-
QCD is the theory of strong interactions between quarks and gluons in the Standard Model. It exhibits two main properties, color confinement and asymptotic freedom [1, 2]. Therefore, there are both perturbative and non-perturbative parts of QCD in the calculation of processes that involve hadrons. The study on
$ J/\psi $ related processes provides a good method to probe both perturbative and non-perturbative aspects of QCD dynamics. On the one hand, leptonic decays of$ J/\psi $ are easy to measure by the experiments. On the other hand,$ J/\psi $ is a bound state of a$ c\bar c $ pair, where$ c $ quark is heavy so that$ J/\psi $ related processes can be well factorized into perturbative and non-perturbative parts in theoretical calculations. In 1995, in order to explain the experimental measurements of$ J/\psi $ and$ \psi^\prime $ production at the Tevatron [3], a non-relativistic QCD (NRQCD) factorization formalism was proposed based on the color-octet (CO) mechanism [4]. The method allows consistent theoretical predictions to be made, and to be improved order by order in the strong coupling constant$ \alpha_s $ and the heavy quark relative velocity$ v $ , although the CO NRQCD long-distance matrix elements, which were thought to be universal, can only be obtained by fitting the experimental data.In the last twenty years, many important advances have been made in both experimental and theoretical studies of the
$ J/\psi $ related processes at different colliders. There are very precise experimental measurements of$ J/\psi $ production and polarization at the LHC [5-7], with the theoretical predictions extending to NLO [8-18].However, things are quite different in
$ e^+e^- $ collisions. The signature of the CO production of$ J/\psi $ in$ e^{+} e^{-} $ annihilation at B-factories was suggested in Ref. [19], and its contribution is at the endpoint of$ J/\psi $ momentum spectrum due to the kinematics of the two-body final states. The cross-sections for inclusive$ J/\psi $ production in$ e^+e^- $ annihilation were measured by BABAR and Belle [20-23]. However, the CO signal was not observed. In Ref. [24], the authors tried to spread the CO signal by re-summing the CO contribution. There was a suggestion in Ref. [25] to look for the CO contribution in$ e^+ e^- \rightarrow J/\psi +\gamma+X $ , where CO channels have larger contribution than the color-singlet (CS) channels in a different range of the photon energy spectrum. The experimental results are several times larger than the leading-order CS prediction [26, 27]. This large discrepancy was resolved by including the NLO QCD corrections, relativistic corrections, and feed-down contribution from higher excited states (see e.g. Refs. [28-31]). Therefore, the contributions of the CS channels can already explain the experimental data and almost no space is left for CO contribution [32].In experimental measurements, many exotic states decay into
$ J/\psi $ . The$ J/\psi $ production is a very important background in the search for these exotic states. The precise measurement of$ e^+e^-\rightarrow J/\psi \pi^+\pi^- $ was performed by the BESIII collaboration [33]. Apart from the decays of exotic states, the contribution of the$ J/\psi $ inclusive production in the continuous background obtained in this measurement is much larger, and it may provide space for a CO contribution [34]. Thus, a detailed study of the inclusive$ J/\psi $ production in$ e^+e^- $ collisions with center-of-mass energy in the range from 3.7 to 4.6 GeV is an interesting subject. However, this energy range is near the inclusive$ J/\psi $ production threshold, and the validity of perturbative QCD calculations is strongly questioned. Previous studies have already shown that the CS result at NLO can describe the experimental measurements of the inclusive$ J/\psi $ production at the energy of B-factories (10.58 GeV). Therefore, we will address in this work the question at what CM energy can CS perturbative results describe the inclusive$ J/\psi $ production in a$ e^+e^- $ collision.The paper is organized as follows. We give a detailed study of the inclusive
$ J/\psi $ production in$ e^+e^- $ collisions in the CM energy range from 3.7 to 10.58 GeV in Sec. 2. In Sec. 3, we suggest to measure the inclusive$ J/\psi $ production by using the initial state radiation (ISR) effect at B-factories, and present a detailed calculation of this process in QCD NLO. The summary and conclusion are given in Sec. 4. -
As the CM energy is not sufficient for
$ J/\psi+c\bar{c} $ production at BESIII, the calculation is almost the same as for the$ J/\psi+gg $ case [30] at B factories, but with a much smaller$ \sqrt{s} $ . To perform the calculation, the FDC package [35] was used to generate quad-precision FORTRAN codes, which is essential to deal with serious numerical instability in the calculations of virtual corrections near the threshold. A two-cutoff method [36] is used to treat infrared divergences in the correction process, and after the check of the cutoff independence,$ \delta_s = 10^{-3} $ and$ \delta_c = 2\times 10^{-5} $ are chosen. More details of the calculations can be found in Refs. [30, 31].For numerical results, the approximation
$ M_{J/\psi} = 2m_c $ is our default choice.$ m_c $ is set to 1.4, 1.5 and 1.6 GeV, and the renormalization scale$ \mu_r $ is chosen as 2$ m_c $ or$ \sqrt{s}/2 $ , in the calculations which give the uncertainty of the results. The radial wave function at the origin of$ J/\psi $ ,$ |R_s(0)|^2 $ , is set to 0.944 GeV3 for$ m_c = 1.5 $ GeV. For the other values of$ m_c $ ,$ |R_s(0)|^2 $ should be multiplied by a factor$ (m_c/1.5 $ GeV$ )^2 $ .$ m_\pi $ is set to 139.6 MeV according to PDG [37]. For the value of the strong coupling constant$ \alpha_s $ , the two-loop formula is used and the value of the fine structure constant$ \alpha $ is set to 1/137. To produce two$ \pi $ in the final states, a cut$ m^2_X\geqslant (2m_{\pi})^2 $ is introduced for the invariant mass of$ gg $ in$ e^+e^-\to J/\psi gg $ ,$ ggg $ in$ e^+e^-\to J/\psi ggg $ , and$ g q\bar{q} $ in$ e^+e^-\to J/\psi g q\bar{q} $ .In Table 1, the total cross-section for the inclusive
$ J/\psi $ production at LO and NLO with different$ \sqrt{s} $ is given, as well as the ratio K of NLO to LO results. The center values are obtained as the average of the maxima and minima of the uncertainty bands for$ m_c $ (1.4 GeV to 1.6 GeV) and renormalization scale ($ \mu_r = 2m_c $ to$ \sqrt{s}/2 $ ), and the uncertainty is the half width of the band. Unlike the case of a B-factory, the ratio K is much larger, ranging from 1.75 to 2.59. In some sense, this larger ratio indicates that the convergence of the QCD perturbative expansion is becoming worse.$\sqrt{s}$ /GeV

$\sigma^{(0)}$ /pb

$\sigma^{(1)}$ /pb

$\sigma^{(1)}/\sigma^{(0)}$ 

3.7 1.74±1.02 4.10±2.02 2.59±0.37 3.8 1.82±0.92 4.10±1.66 2.41±0.31 3.9 1.85±0.83 4.02±1.39 2.27±0.25 4.0 1.86±0.75 3.87±1.16 2.14±0.21 4.1 1.84±0.68 3.71±1.00 2.05±0.18 4.2 1.81±0.61 3.55±0.88 1.98±0.15 4.3 1.77±0.55 3.40±0.77 1.92±0.13 4.4 1.72±0.50 3.21±0.67 1.86±0.11 4.5 1.67±0.46 3.04±0.59 1.81±0.10 4.6 1.61±0.41 2.86±0.50 1.75±0.10 Table 1. The total cross-section at different CM energies with uncertainties from the renormalization scale and the mass of charm quark.
In Fig. 1, the total cross-section for the inclusive
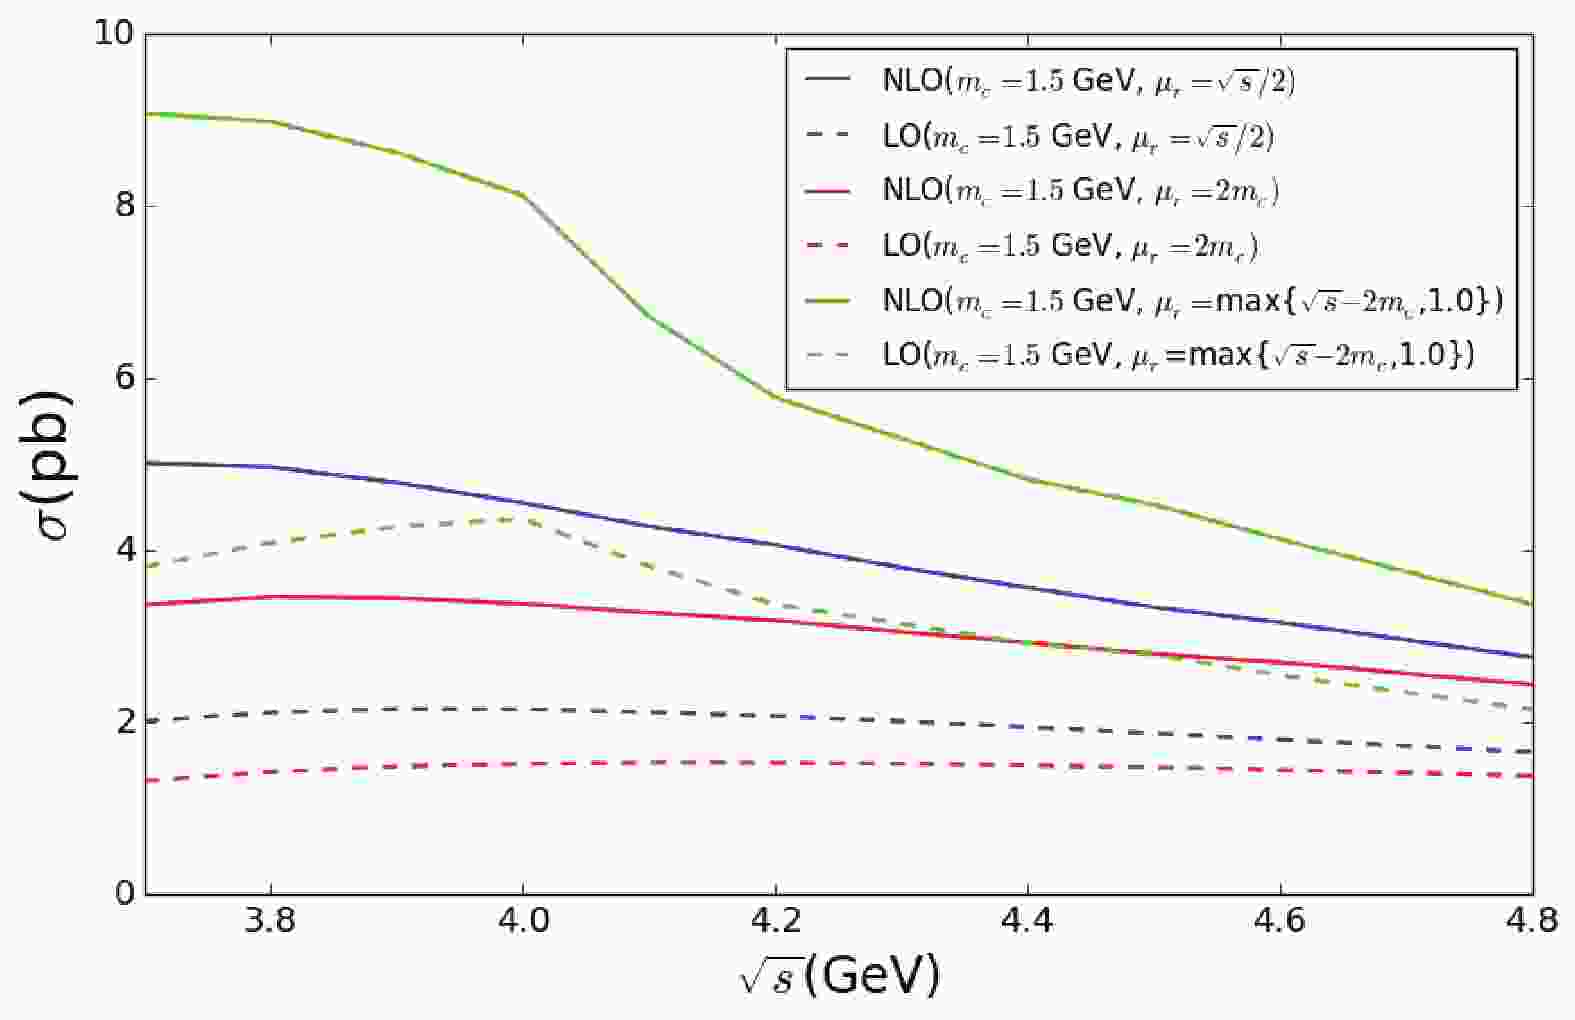
$ J/\psi $ production with different renormalization scales at$ m_c = 1.5 $ GeV is shown. For$ \mu_r = \sqrt{s}-2m_c $ , as$ \sqrt{s} $ is less than 4.0 GeV,$ \mu_r $ is less than 1 GeV and the perturbative expansion is bad. Thus, the limit so that the scale is larger than 1 GeV is added in this case. The scale dependence of the total cross-section for$ \sqrt{s} = 4.0 $ GeV is presented in Fig. 2. It shows clearly that the renormalization scale dependence is not improved for the NLO results in comparison with LO, which gives additional evidence that the convergence of the QCD perturbative expansion becomes worse in this case.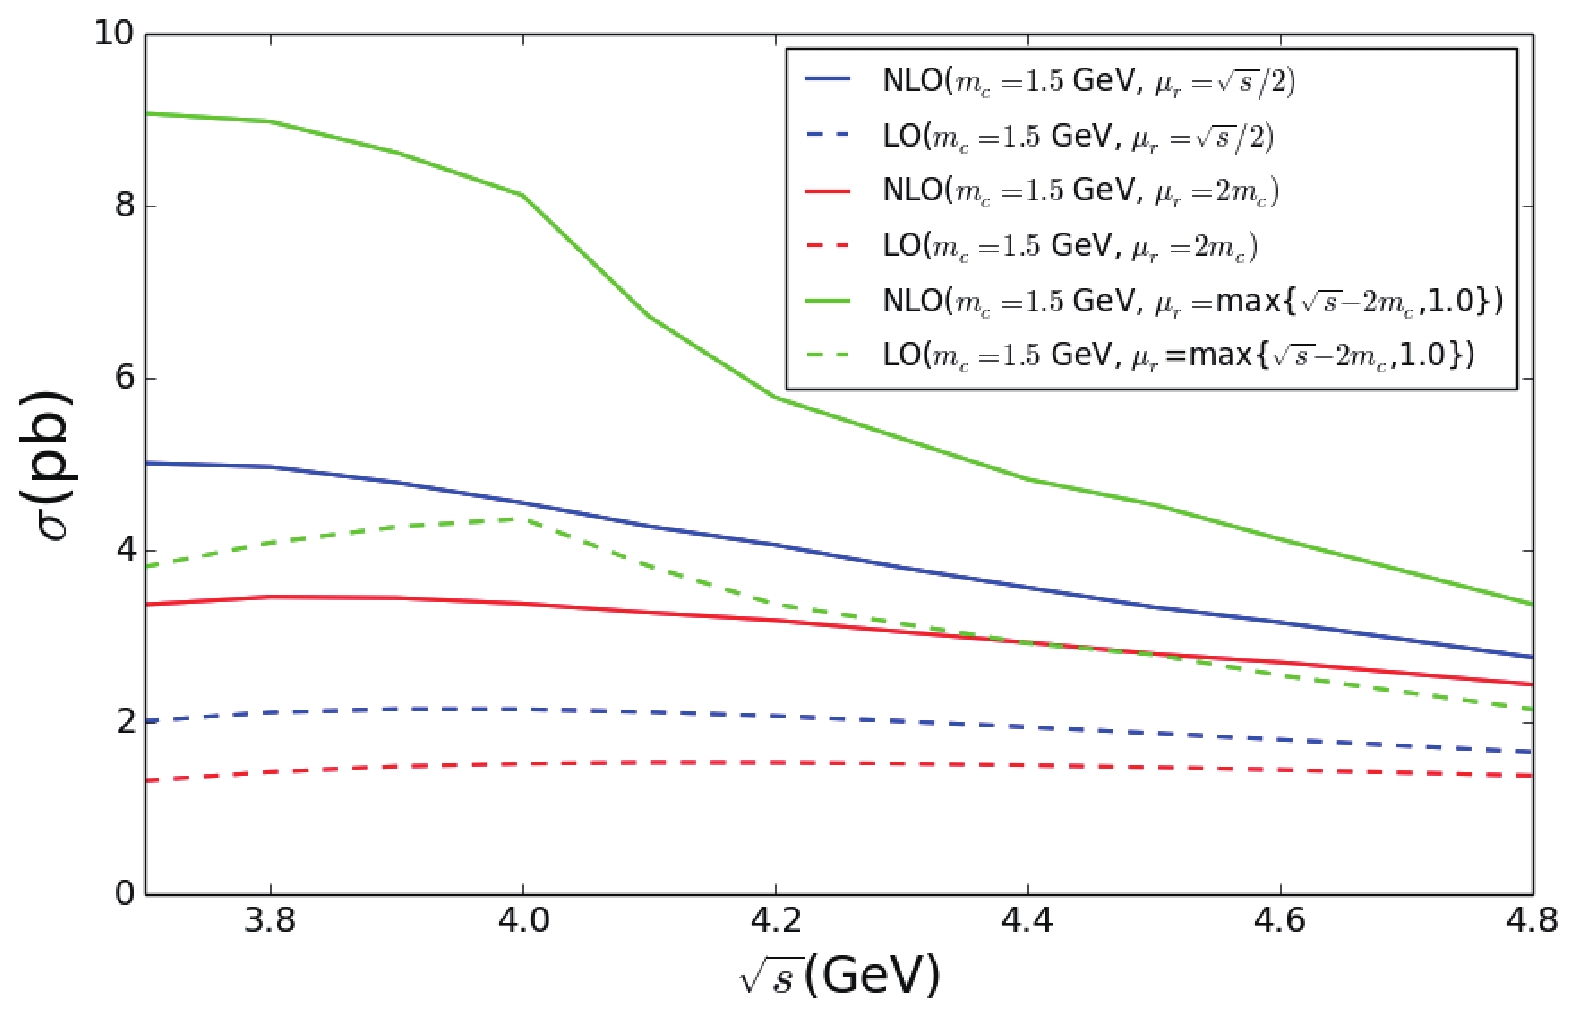
Figure 1. (color online) LO and NLO cross-sections for different renormalization scale as function of
$ \sqrt{s} $ with$ m_c = 1.5 $ GeV.
Figure 2. (color online) Renormalization scale dependence of the inclusive
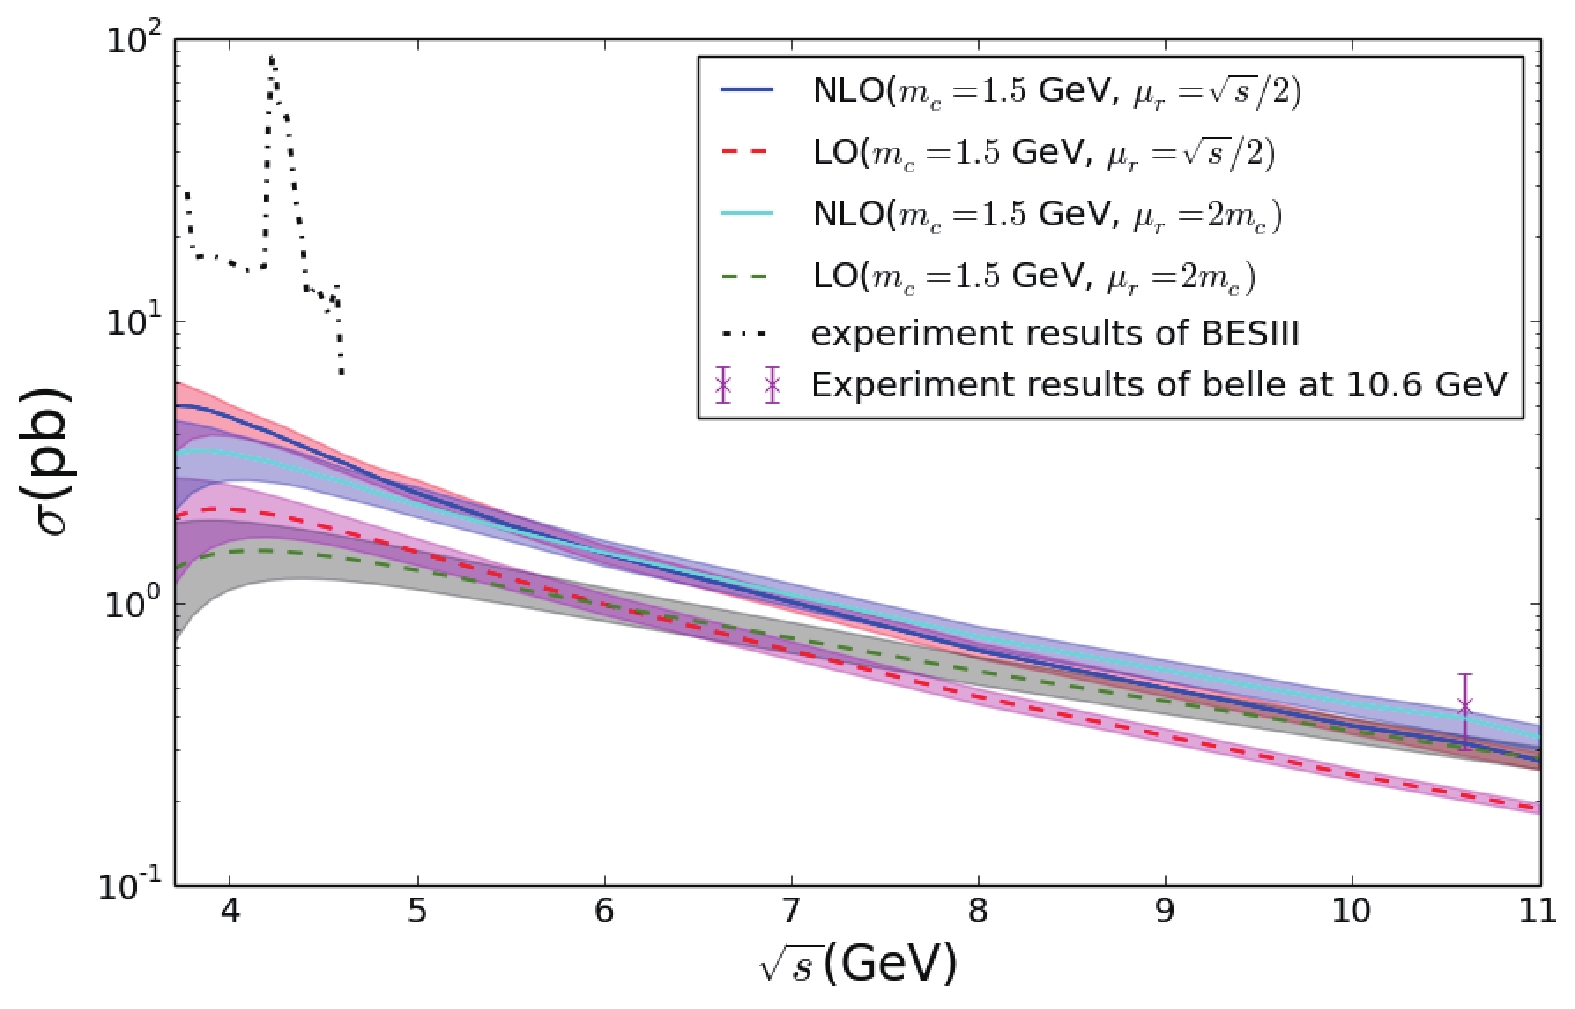
$J/\psi$ production at$\sqrt{s}$ =4.0 GeV.In Fig. 3, we compare our results with the experimental measurements from Ref. [33]. It is obvious that there are resonance structures in the data. We focus on the background off the peak, which is part of the inclusive
$ J/\psi $ production and can be compared with the perturbative QCD calculations. It can be seen that both LO and NLO theoretical predictions are far away from the background, even though the K factor is large. This probably means that the perturbative calculations become very bad in this situation. As the CM energy is reduced and gets closer to the inclusive$ J/\psi $ production threshold, the theoretical perturbative calculation gradually loses its convergence. On the other hand, close to 10.58 GeV , the result is consistent with the measurements from Belle [38]. It is an interesting question to define the boundary where the QCD perturbative calculation is not suitable any more. Considering that the energy of a collider is limited, it is impossible to obtain an experimental curve like the theoretical one in Fig. 3 . However, there is another way to perform a comparison by using the ISR effect in QED. The ISR effect in$ e^+e^-\to J/\psi+X $ is discussed in the next section. -
In B-factories, heavy quarkonium related experimental measurements have been made using the ISR effect [39, 40], which has been theoretically studied to LO [41] and NLO [42].
In this section, the ISR effect in the processes
$ e^+e^-\to J/\psi gg $ and$ e^+e^-\to J/\psi c\bar{c} $ is numerically calculated for the SuperKEKB energy. With the ISR factorization formula from the factorization of the mass and the infrared singularities [43], the total cross-section can be represented as:$ \begin{split} \sigma(s)& = \iint {\rm d}x_1{\rm d}x_2 D_{e^-}(x_1,s)D_{e^+}(x_2,s)\sigma_R(x_1x_2s), \end{split} $

(1) where
$ D_{e^{-(+)}}(x,s) $ is the distribution function of the probability of finding an electron (positron) with a momentum fraction$ x $ within the original electron (positron). Without loss of generality, we use$ D_e(x,s) $ instead in the following discussion.$ \sigma_R(x_1x_2s) $ is the cross-section for the reduced CM energy$ s^\prime = x_1x_2s $ .$ D_e(x,s) $ satisfies the following evolution equation (see as Refs. [44-46])$ D(x,s) = \delta(1-x)+\int_{m_e^2}^s\frac{{\rm d}Q^2}{Q^2}\frac{\alpha(Q^2)}{2\pi}\int_x^1\frac{{\rm d}z}{z}P(z)D_e\left(\frac{x}{z},Q^2\right) $

(2) with
$ \alpha(Q^2) = \dfrac{\alpha}{1-(\alpha/3\pi){\ln}(Q^2/m_e^2)} $

(3) and
$ P(z) = \dfrac{1+z^2}{1-z}-\delta(1-z)\int_0^1 {\rm d}x \dfrac{1+x^2}{1-x} $

(4) is the regularized splitting function. By defining
$ x = x_1x_2 $ , we have$ \begin{split} \sigma(s)& = \int {\rm d}x F(x,s)\sigma_R(xs), \end{split} $

(5) with
$ \begin{split} F(x,s)&\equiv\int^1_x {\rm d}x_1 \frac{1}{x_1} D_{e}(x_1,s)D_{e}\left(\frac{x}{x_1},s\right). \end{split} $

(6) On the other hand, if we define
$ \begin{split} R(x,s)&\equiv\int^1_x {\rm d}x_1 \int^1_{x/x_1} {\rm d}x_2 D_{e}(x_1,s)D_{e}(x_2,s), \end{split} $

(7) with the substitution
$ x_2 = t/x_1 $ ,$ \begin{split} R(x,s)& = \int^1_x {\rm d}t F(t,s). \end{split} $

(8) Therefore,
$ F(x,s) $ can be obtained by taking the derivative of$ R(x,s) $ (with a negative sign). It follows from Eq. (2) that$ R(x,s) $ satisfies the equation$ \begin{split} R(x,s)& = 1+\int^s_{m_e^2} \frac{\alpha (Q^2)}{\pi}\frac{{\rm d}Q^2}{Q^2} \int^1_x {\rm d}zP(z)R\left(\frac{z}{x},Q^2\right). \end{split} $

(9) Defining another function
$ G(x,s)\equiv \int^1_x {\rm d}t D(t,s), $

(10) $ D(x,s) $ can be obtained by taking the derivative of$ G(x,s) $ . Again from Eq. (2), a similar equation as Eq. (9) is found for$ G(x,s) $ $ \begin{split} G(x,s)& = 1+\int^s_{m_e^2} \frac{\alpha (Q^2)}{2\pi}\frac{{\rm d}Q^2}{Q^2} \int^1_x {\rm d}zP(z)G\left(\frac{z}{x},Q^2\right). \end{split} $

(11) This equation can be obtained from Eq. (9) by the substitution
$ \alpha (Q^2) \to \alpha(Q^2)/2 $ . Following the procedures in Ref. [47],$ R(x,s) $ and$ G(x,s) $ are obtained as$ \begin{split} R(x,s)& = (1-x)^{\beta_l}\left(1+\frac{3}{4}\beta_l\right)+\frac{\beta_l}{2}\left(\frac{1}{2}x^2+x-\frac{3}{2}\right) +{\cal O}(\beta_l^2), \\ G(x,s)& = (1-x)^{\beta_l/2}\left(1+\frac{3}{8}\beta_l\right)+\frac{\beta_l}{4}\left(\frac{1}{2}x^2+x-\frac{3}{2}\right) +{\cal O}(\beta_l^2), \\ \end{split} $

(12) with
$ \beta_l = \frac{2\alpha}{\pi}\left[{\log}\left(\dfrac{s}{m_e^2}\right) -1 \right]. $

(13) Thus,
$ F(x,s) $ and$ D_e(x,s) $ are obtained as$ \begin{split} F(x,s)& = \beta_l\left(1+\frac{3}{4}\beta_l\right)(1-x)^{\beta_l-1}-\frac{\beta_l}{2}(1+x)+O(\beta^2_l),\\ D_e(x,s)& = \frac{\beta_l}{2}\left(1+\frac{3}{8}\beta_l\right)(1-x)^{\beta_l/2-1}-\frac{\beta_l}{4}(1+x)+O(\beta^2_l),\\ \end{split} $

(14) In SuperKEKB [48, 49], electrons at 7 GeV will collide with positrons at 4 GeV. The invariant variable is
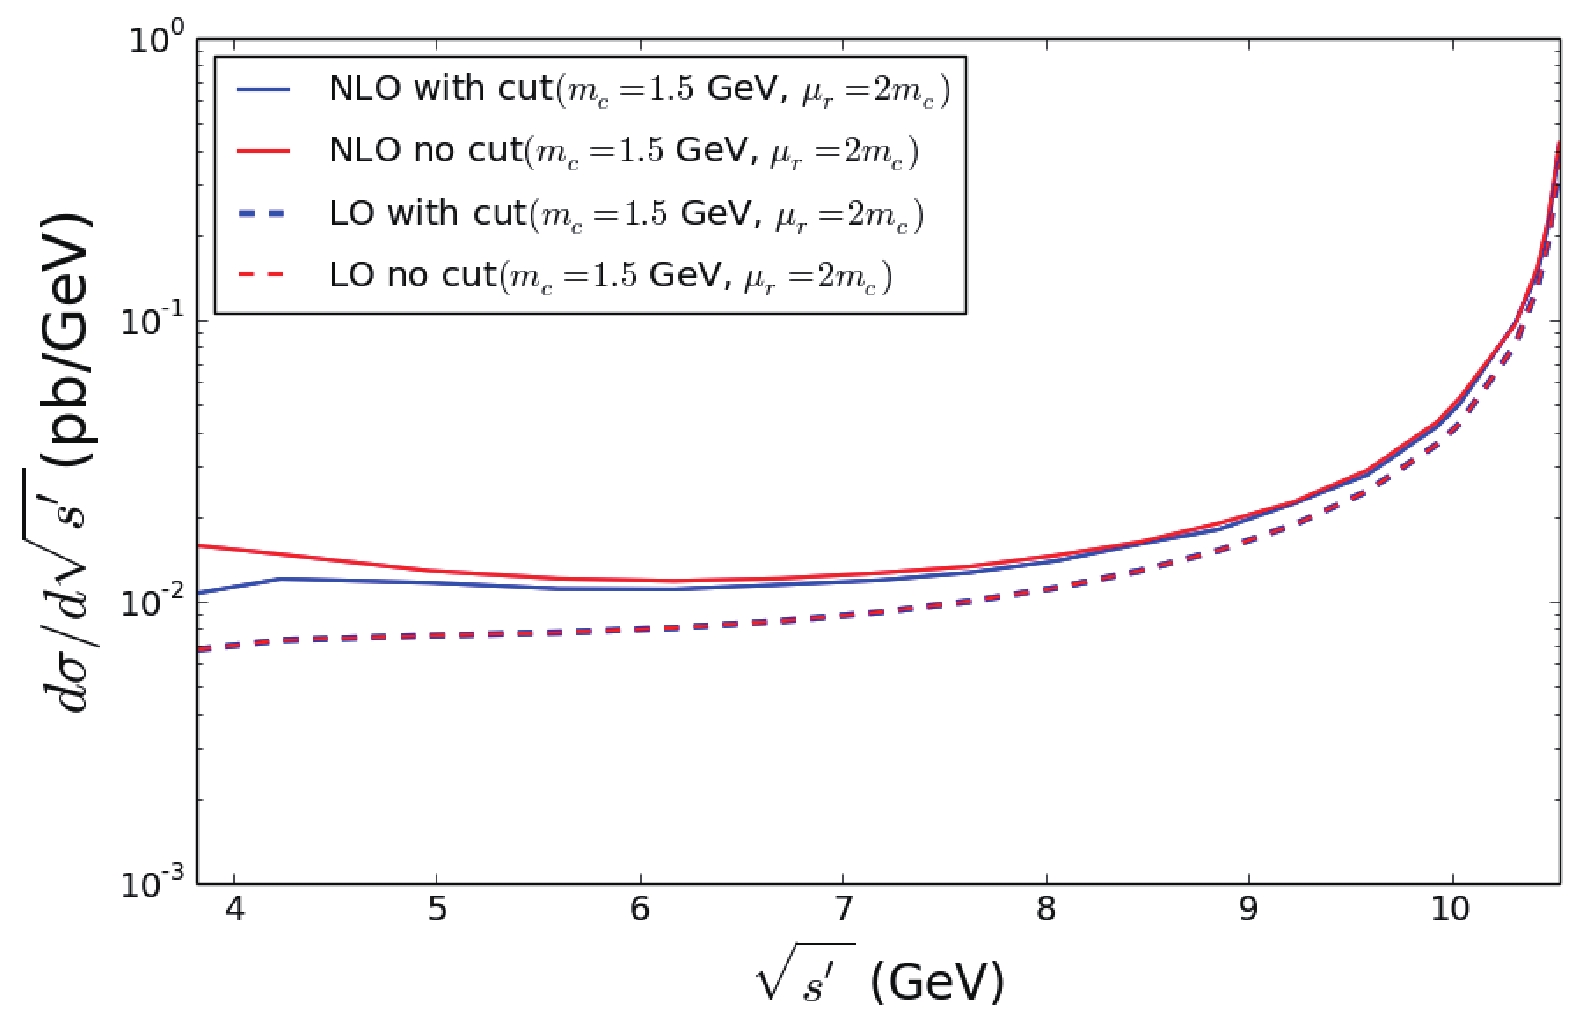
$ \sqrt{s} = \sqrt{112} $ GeV. The half-crossing angle$ \theta_c $ in the detector is 41.5 mrad, within which the particles can not be measured. The calculations are performed in the CM frame of partons, and the Lorentz boost is performed from this frame to the laboratory frame for all involved particles. Here, we use a cut to make sure that the angle between the outgoing$ J/\psi $ and the beam in the laboratory frame is larger than the crossing angle,$ \theta_{J/\psi}>\theta_c $ . The same cut is also applied for the recoiling particle$ X $ (here the momentum of$ X $ is the sum of all other final state particles), namely$ \theta_X>\theta_c $ . In the experimental measurements, a hadron is reconstructed from its decay products. Thus, even if a hadron is within the crossing angle, it could still be observed if its decay products are outside the crossing angle. The cut works better when included in the Monte Carlo simulations related to data analysis.In Fig. 4, the ISR results for the reduced CM energy from 3.8 to 10.58 GeV are presented for both LO and NLO with
$ m_c = 1.5 $ GeV and$ \mu_r = 2m_c $ . For low reduced CM energy, there is an obvious effect of the angle cut on the NLO results, but the effect becomes smaller as the energy increases. The LO results with and without the cut almost coincide, which means that the effect of the cut is negligible. Besides, in comparison with the LO results, the NLO results are larger at lower reduced CM energy, and the difference becomes smaller as the energy increases. This behavior of the NLO results is consistent with what we have seen in Fig. 3. The error caused by the uncertainty of the charm mass and the renormalization scale is shown in Fig. 5. The center of each curve describes the behavior for$ m_c = 1.5 $ GeV, while the upper and lower boundaries correspond to$ m_c = 1.4 $ and$ 1.6 $ GeV. From Fig. 3, we saw clearly that the measurement of$ J/\psi \pi^+ \pi^- $ by BESIII is a few times larger than the QCD NLO prediction for the inclusive$ J/\psi +X $ production. Hence, the experimental measurement of$ J/\psi \pi^+ \pi^- $ including the ISR effect will certainly be larger than the curve in Fig. 5 for the reduced CM energies from 3.70 to 4.60 GeV. This means that the curve with the ISR effect will be in agreement with the QCD perturbative prediction in a large CM energy range, and will not follow the QCD perturbative prediction only in a small energy range. A comparison between the experimental measurements and QCD perturbative predictions is eagerly expected.KEKB has a peak luminosity of 2.1083
$ \times 10^{34}\;\rm{cm}^{-2}\rm{s}^{-1} $ and the SuperKEKB project requires a peak luminosity of$ 8\times 10^{35}\;\rm{cm}^{-2}\rm{s}^{-1} $ which is 40 times larger than KEKB. SuperKEKB is designed to operate for 11 years. The total integrated luminosity accumulated by the Belle detector reached$ 1.04\;{\rm ab}^{-1} $ [50] . The goal of the BelleII detector in SuperKEKB is to accumulate an integrated luminosity of$ 50\;{\rm ab}^{-1} $ [48]. In Table 2, the number of events are estimated for different bins of reduced CM energy at Belle and BelleII. The treatment of the center value and the uncertainty is similar as in Table 1.reduced CM energy $\sqrt{s^\prime}$ /GeV

$\sigma$ without cut /pb

number at KEKB ( $\times 10^4$ )

number at SuperKEKB( $\times 10^6$ )

$\sigma$ with cut /pb

number at KEKB ( $\times 10^4$ )

number at SuperKEKB ( $\times 10^6$ )

3.8-6.5 0.046±0.05 4.74±0.52 2.28±0.25 0.045±0.05 4.63±0.54 2.22±0.26 6.5-8.5 0.034±0.003 3.52±0.34 1.69±0.16 0.034±0.003 3.50±0.32 1.68±0.16 8.5-9.5 0.026±0.002 2.73±0.24 1.31±0.12 0.026±0.002 2.71±0.24 1.30±0.12 9.5-10.0 0.022±0.002 2.32±0.21 1.12±0.10 0.022±0.002 2.31±0.19 1.10±0.09 10.0-10.5 0.060±0.005 6.26±0.53 3.03±0.241 0.060±0.005 6.30±0.51 3.03±0.24 10.5-10.583 0.255±0.021 26.52±2.22 12.75±1.06 0.254±0.021 26.34±2.15 12.66±1.04 Table 2. Total cross-section in different bins of reduced CM energy and the number of events estimated for the SuperKEKB experiment for
$J/\psi+gg$ .Similar calculations for
$ e^+e^-\to J/\psi c\bar{c} $ were also performed. The effect of the cut is presented in Fig. 6, which shows that the effect of the angle cut in the detector is less than 0.1% for both LO and NLO, as the two curves almost overlap with each other. The same situation is also seen in Fig. 7. The results in Fig. 4 and Fig. 6 are consistent with Refs. [30, 31], where$ \sqrt{s^\prime} $ is close to 10.58 GeV. Similar to Table 2, the number of events, estimated with uncertainties from$ m_c $ and$ \mu_r $ , are shown for Belle and BelleII in Table 3.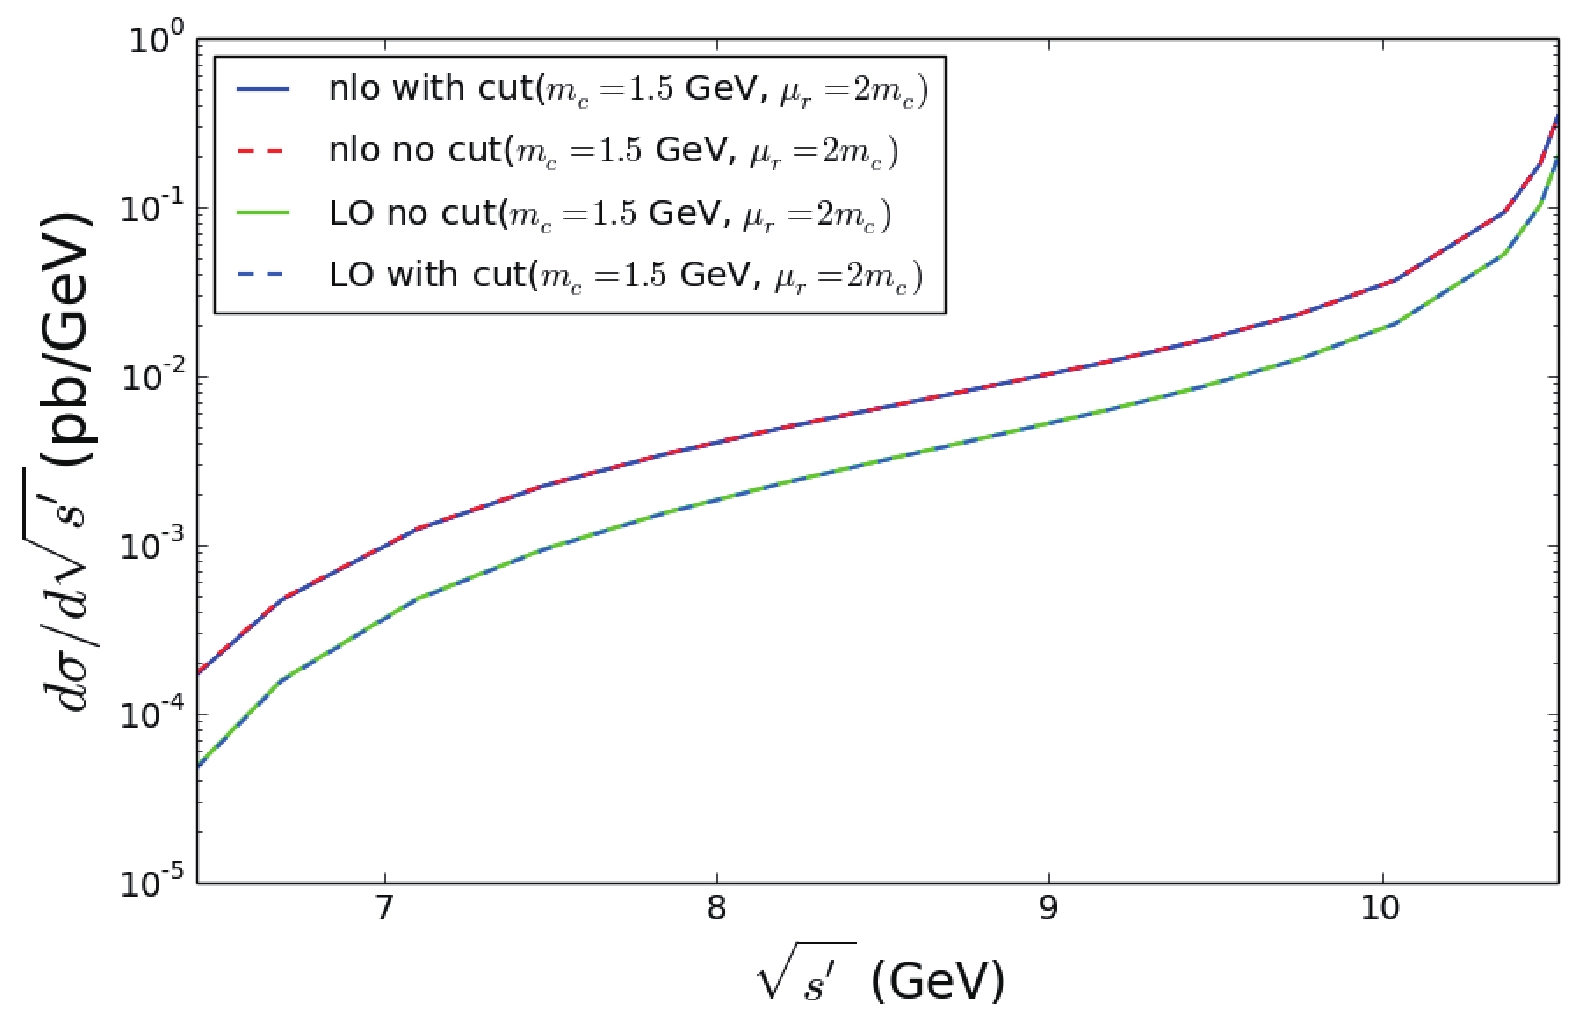
Figure 6. (color online) ISR effect for
$J/\psi+c\bar{c}$ for QCD LO and NLO with and without the cut.reduce CM energy $\sqrt{s^\prime}$ /GeV

$\sigma$ without cut /pb

number at KEKB ( $\times 10^4$ )

number at SuperKEKB ( $\times 10^6$ )

$\sigma$ with cut /pb

number at KEKB ( $\times 10^4$ )

number at SuperKEKB( $\times 10^6$ )

6.4-8.5 0.008±0.005 0.79±0.41 0.38±2.01 0.008±0.005 0.79±0.41 0.38±2.01 8.5-9.5 0.014±0.005 1.43±0.05 0.69±0.23 0.014±0.005 1.43±0.05 0.69±0.23 9.5-10.0 0.015±0.005 1.56±0.04 0.75±0.21 0.015±0.005 1.56±0.04 0.75±0.21 10.0-10.5 0.047±0.012 4.84±1.22 2.33±0.59 0 .047±0.012 4.83±1.22 2.32±0.59 10.5-10.583 0.209±0.050 21.72±5.26 10.44±2.53 0.209±0.050 21.72±5.26 10.44±2.53 Table 3. Total cross-section in different bins of reduced CM energy and the number of events estimated for the SuperKEKB experiment for
$J/\psi+c\bar{c}$ . -
In summary, the NLO QCD corrections of the inclusive
$ J/\psi $ production in$ e^+e^- $ annihilation with$ \sqrt{s} $ ranging from 3.7 to 10.58 GeV were calculated. It is found that even in QCD NLO, the results for the CM energy range from 3.7 to 4.6 GeV are still far away from the background in the recent experimental measurements of BESIII. The perturbative prediction becomes worse when the CM energy is close to the$ J/\psi $ production threshold. On the other hand, for energies close to 10.58 GeV the results are consistent with the measurements by Belle [38]. It is interesting to compare the experimental measurements and the QCD perturbative predictions for CM energies from 3.7 to 10.6 GeV. By using the ISR effect in QED, the processes in$ e^+e^-\to J/\psi+gg $ and$ e^+e^-\to $ $ J/\psi+c \bar{c} $ were calculated in QCD NLO taking into account the uncertainty from the charm quark mass and the renormalization scale. The results were plotted and the number of events for different reduced CM energy bins were given for SuperKEKB. This provides a way to precisely test the validity of perturbative predictions for$ J/\psi $ production in$ e^+e^- $ collisions at different reduced CM energies. We suggest to measure the ISR effect in$ J/\psi $ production in future experiments.
Perturbative QCD for J/ψ inclusive production via initial state radiation in ${{e^+e^-}}$ collisions
- Received Date: 2019-04-04
- Available Online: 2019-08-01
Abstract: The process


 Abstract
 HTML
HTML Reference
 Related
 PDF
PDF






 DownLoad: