


 Abstract
 HTML
HTML Reference
 Related
 PDF
PDF


-
Nickel is widely used for making stainless steel and other corrosion-resistant alloys which play an important role in the construction of nuclear reactors and accelerators. The 58Ni, 60Ni, and 61Ni contents in natural nickel are 68.0769%, 26.2231%, and 1.1399%, respectively [1]. Research into the (n, α) reactions is important in nuclear engineering applications, because neutron-induced helium production would lead to helium accumulation and cause serious radiation damage to the materials. Besides, measurements of these cross sections could enhance our understanding of nuclear structure and nuclear reaction mechanisms. For example, the cross section of the 58Ni(n, α)55Fe reaction would enable one to derive the level structure of the residual nucleus, 55Fe [2].
For the cross sections of the 58Ni(n, α)55Fe (Q = 2.899 MeV) reaction, existing measurement results are abundant because the activation method is available for this reaction. In the 4.50 – 5.50 MeV neutron energy region, six measurements [2-7] could be found in the EXFOR library [8], but there are noticeable discrepancies among these measurements. For example, the cross section of the 58Ni(n, α)55Fe reaction measured by Gledenov (1997, 5.00 – 7.00 MeV) [6] is ~ 2 times higher than that obtained by Goverdovskiy (1992, 5.12 MeV) [4]. Besides, the coefficient of variation among different evaluations, including the ENDF/B-VIII.0 [9], ENDF/B-VII.1 [10], JENDL-4.0u+ [11], JEFF-3.3 [12], ROSFOND-2010 [13], and CENDL-3.1 [14] libraries, is 14.92% in the 4.50 MeV ≤ En ≤ 5.50 MeV region [15].
For the cross sections of the 60Ni(n, α)57Fe (Q = 1.355 MeV) and 61Ni(n, α)58Fe (Q = 3.580 MeV) reactions, because the residual nuclei (57Fe and 58Fe) of these two reactions are stable, the activation method is unavailable for measurement. For the cross sections of the 60Ni(n, α)57Fe reactions, there is only one measurement (Khromyleva (2018, 6.00 – 7.15 MeV) [16]) in the EXFOR library [8]. For the 61Ni(n, α)58Fe reaction, there is no data in the entire neutron-energy region except for several results around En = 0.0253 eV [8]. In the 5.00 MeV ≤ En ≤ 5.50 MeV region, the coefficients of variation among different evaluations are 36.43% and 46.85% for the 60Ni(n, α)57Fe and 61Ni(n, α)58Fe reactions, respectively [9-14].
Accurate measurements of the cross sections of the 58Ni(n, α)55Fe, 60Ni(n, α)57Fe, and 61Ni(n, α)58Fe reactions are required. In the present work, the cross sections of the 58Ni(n, α)55Fe reaction were measured at the En = 4.50, 4.75, 5.00, 5.25, and 5.50 MeV energy points and those of the 60Ni(n, α)57Fe and 61Ni(n, α)58Fe reactions were obtained at the En = 5.00 and 5.50 MeV energy points. The present data for the 60Ni(n, α)57Fe reaction are the first results of measurements below 6.0 MeV and those of the 61Ni(n, α)58Fe reactions are the first results of measurement in the MeV region. The details of the experiments are illustrated in Sect. 2, the data processing and the results are presented in Sect. 3 and Sect. 4, respectively, and the conclusion is drawn in Sect. 5.
-
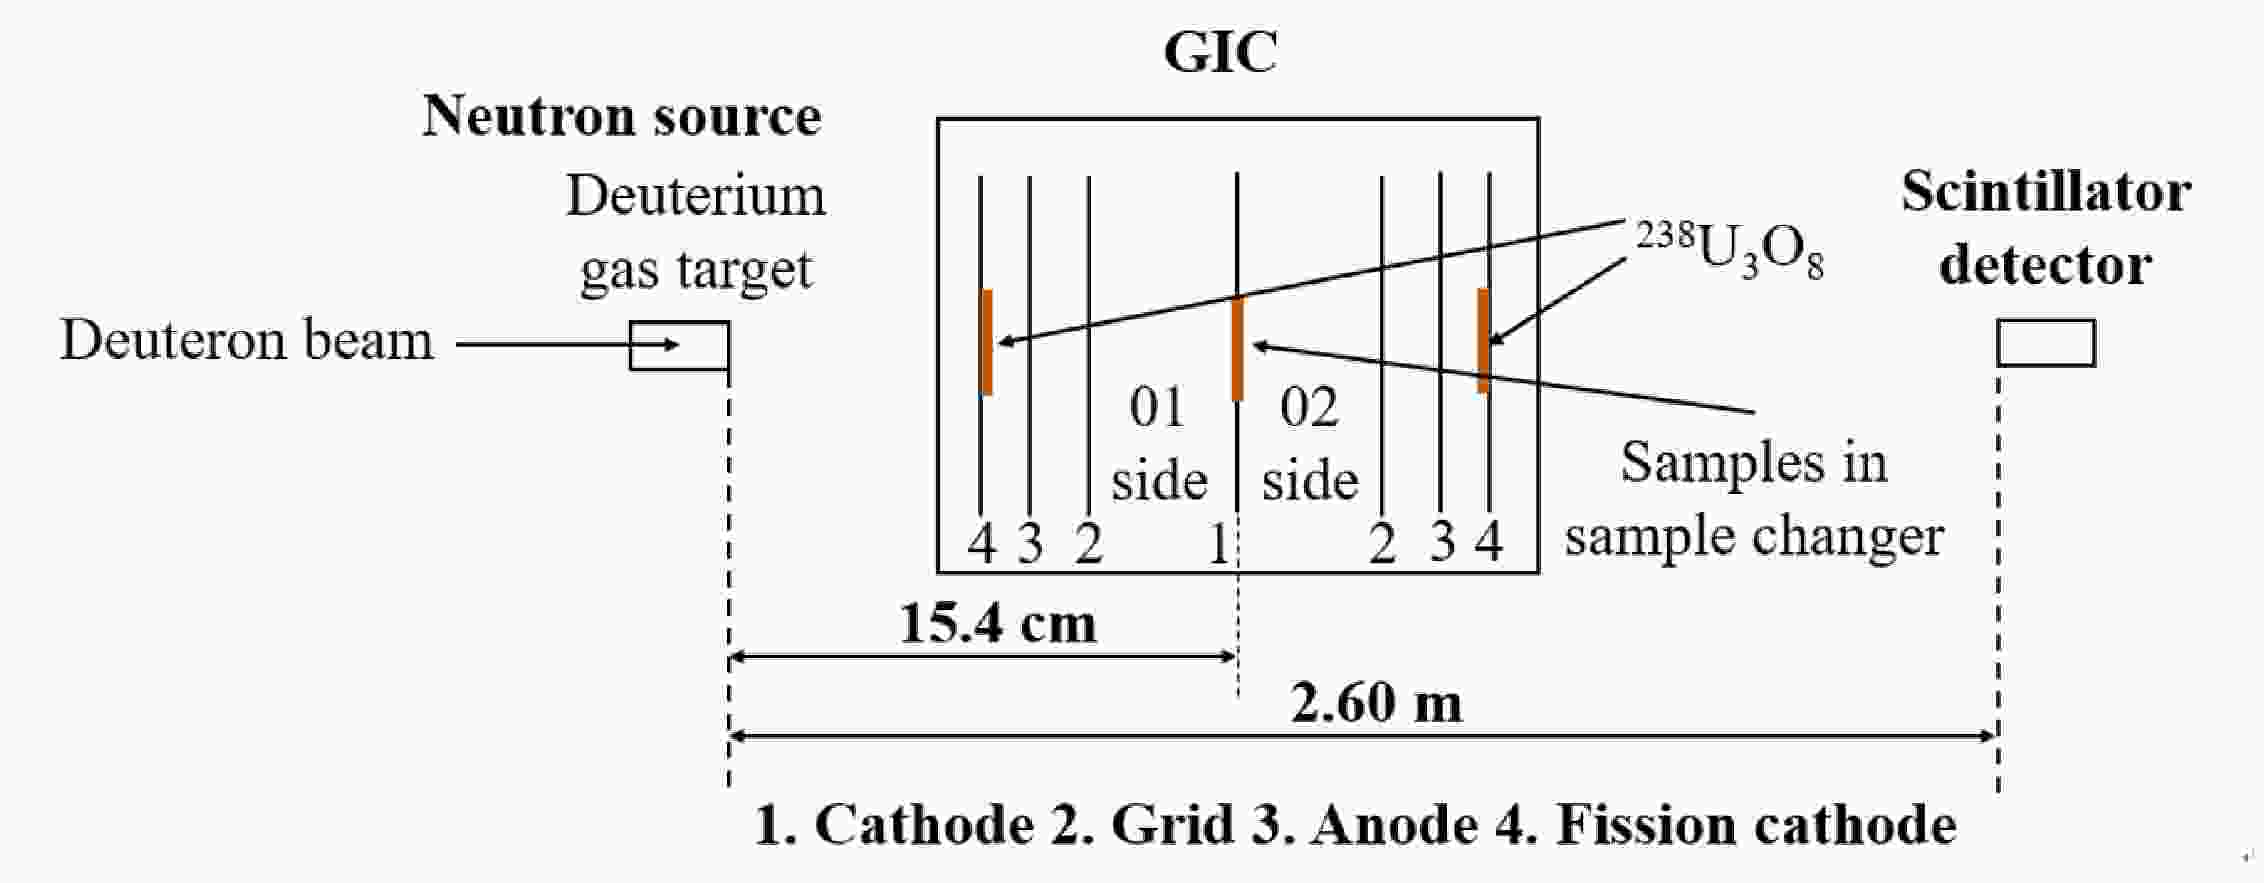
The experiments were performed based on the 4.5-MV Van de Graaff accelerator at Peking University, China. As shown in Fig. 1, the experimental apparatus consists of three main parts: the neutron source, the gridded twin ionization chamber (GIC) as the charged particle detector (with samples inside), and the scintillator detector for neutron energy spectrum measurement. The symmetric double sections of the GIC were defined as side 01 and side 02 , respectively.
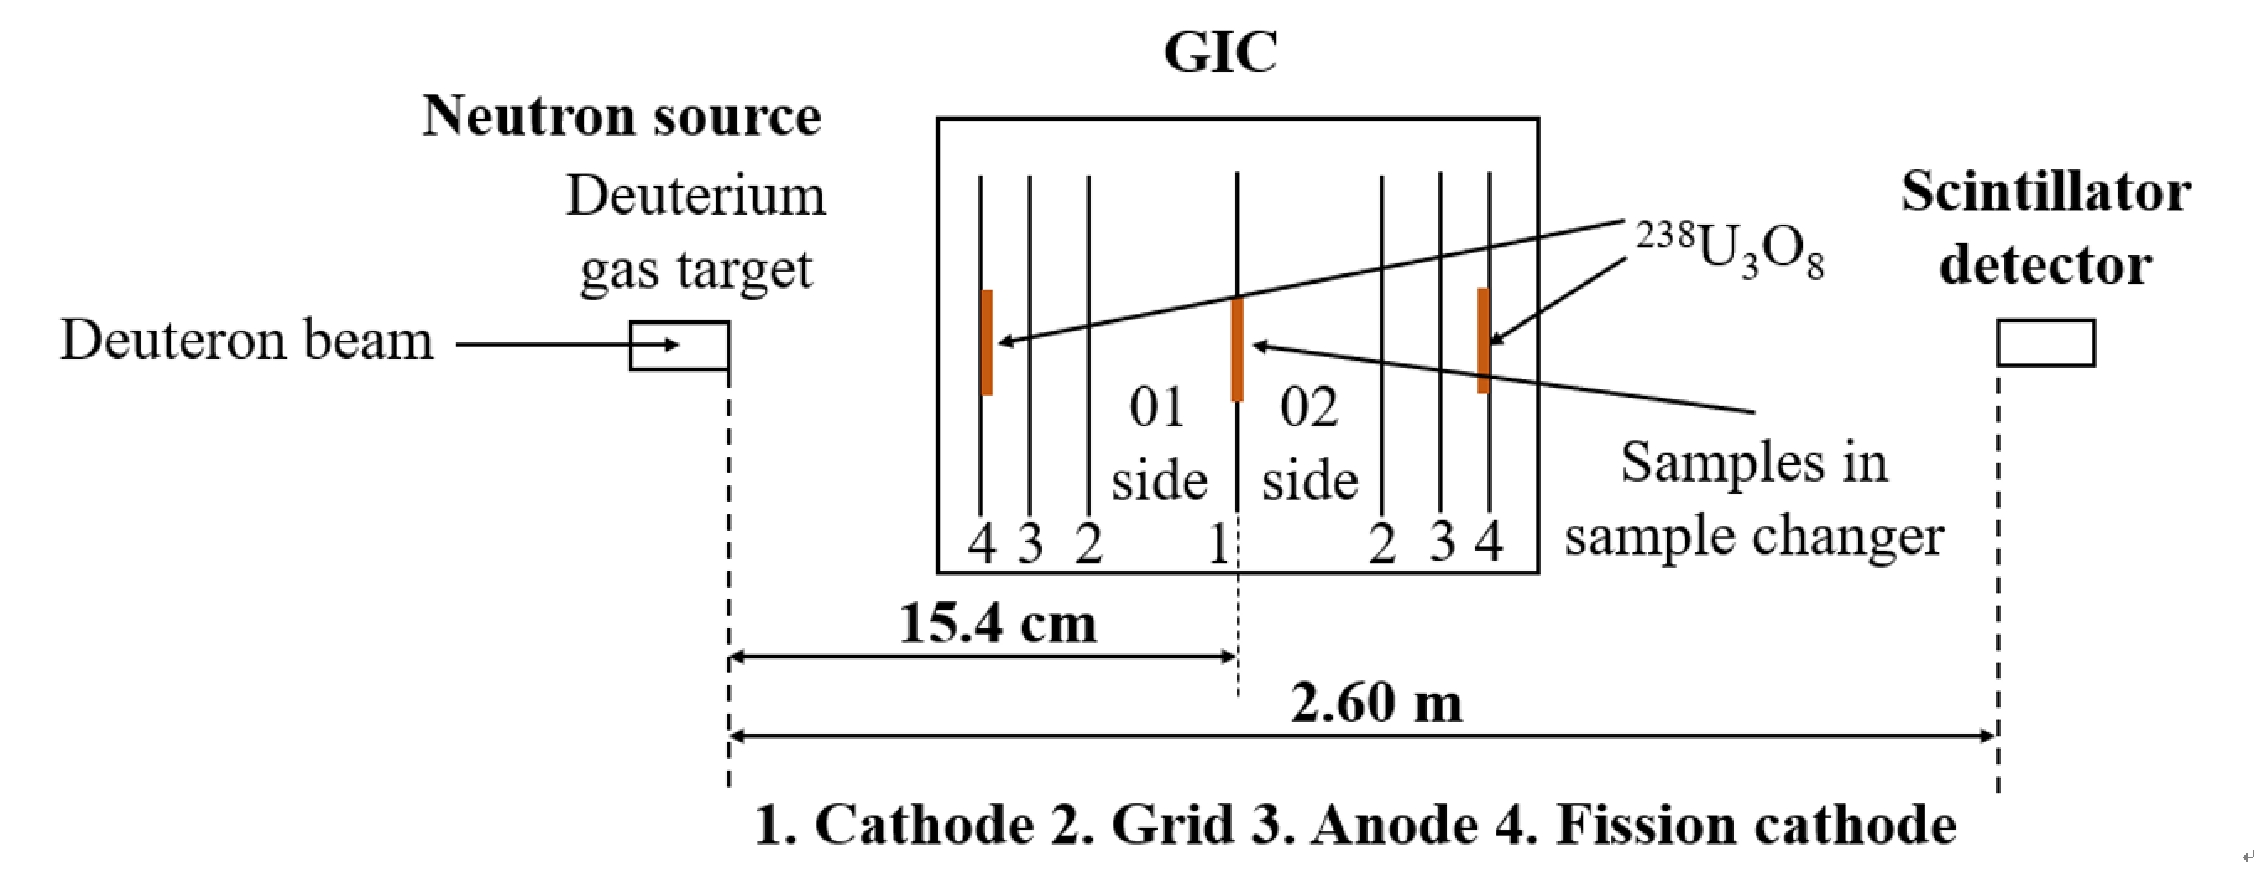
Figure 1. (color online) Schematic drawing of the experimental apparatus.
-
Measurements were performed based on the 4.5-MV Van de Graaff accelerator at Peking University. The quasi mono-energetic neutrons were generated by the 2H(d, n)3He reaction using the energetic deuteron beam from the accelerator to bombard a deuterium gas target 2.0 cm in length under a pressure of 3.0 atm. The deuterium gas target was separated from the vacuum tube of the accelerator by a 5.0 μm-thick molybdenum foil sample. The energy range of the incident deuteron was set to 2.091 – 2.868 MeV for the neutrons to be generated with the kinetic energy range of 4.50 – 5.50 MeV and an energy spread (1σ) of 0.14 – 0.19 MeV [17]. The deuteron beam current was ~ 2.0 μA throughout the measurement.
-
A sample changer with five sample positions was set at the common cathode of the GIC, and back-to-back double samples were placed at each of them as presented in Table 1. The sample changer could be rotated with a rotating a knob below the GIC without opening it. The samples used in the present measurements were as follows: a) the back-to-back compound α sources at sample position No.1 (234U, 4.775 MeV; 239Pu, 5.155 MeV; 238Pu, 5.499 MeV; 244Cm, 5.805 MeV) were used to calibrate the detection system [18]; b) to monitor the neutron flux, three highly enriched (99.999%) 238U3O8 samples were prepared, and their nucleus number and unevenness were determined using the α spectrum measured by the GIC. Details of the method can be found in Ref. [19]. A 238U3O8 sample 43.0 mm in diameter, 62.1% in unevenness, and 600.8 μg/cm2 in average thickness at the No.2 sample position was used to determine the absolute neutron flux. The other two 238U3O8 samples were glued onto the fission cathodes of the 01 and 02 sides to determine the relative neutron flux, respectively. Their diameters were 45.0 mm and 43.0 mm, unevennesses were 61.6% and 63.3%, and average thicknesses were 604.6 μg/cm2 and 557.5 μg/cm2, respectively. c) Two 58Ni samples at the No.3 sample position, and one 60Ni sample and one 61Ni sample at the No.4 sample position were used to measure the foreground events, the data of which are listed in Table 2. The number of Ni atoms in the samples was determined by weighing the samples. Each Ni sample was prepared on a 0.1 mm thick tantalum backing with a diameter of 48.0 mm, as shown in Fig. 2; d) the back-to-back 0.1 mm thick tantalum backings at the No.5 position, which were 48.0 mm in diameter, were used to measure the background events.
sample position sample(01 side) sample(02 side) purpose No.1 α source α source calibrating the detection system No.2 238U Ta measuring the absolute neutron flux No.3 58Ni#I 58Ni#II measuring the foreground of the 58Ni(n, α)55Fe reaction No.4 61Ni 60Ni measuring the foreground of the 60,61Ni(n, α)57,58Fe reactions No.5 Ta Ta measuring the background of the 58,60,61Ni(n, α)55.57,58Fe reactions Table 1. Sample positions of the sample changer.
samples isotopic enrichment (%) thickness/(μg/cm2) diameter/mm preparation method 58Ni#Ia 99.84 601.3 46.0 rolling 58Ni#IIa 99.84 579.4 42.0 rolling 60Nib 99.65 570.4 46.0 rolling 61Nic 91.50 332.4 43.5 vacuum evaporation a Impurities: 60Ni (0.15%), 61Ni (< 0.01%), 62Ni (0.01%), 64Ni (< 0.01%);
b Impurities: 58Ni (0.29%), 61Ni (0.03%), 62Ni (0.03%), 64Ni (< 0.008%);
c Impurities: 58Ni (2.85%), 60Ni (3.8%), 62Ni (1.65%), 64Ni (0.2%).Table 2. Description of the Ni samples.
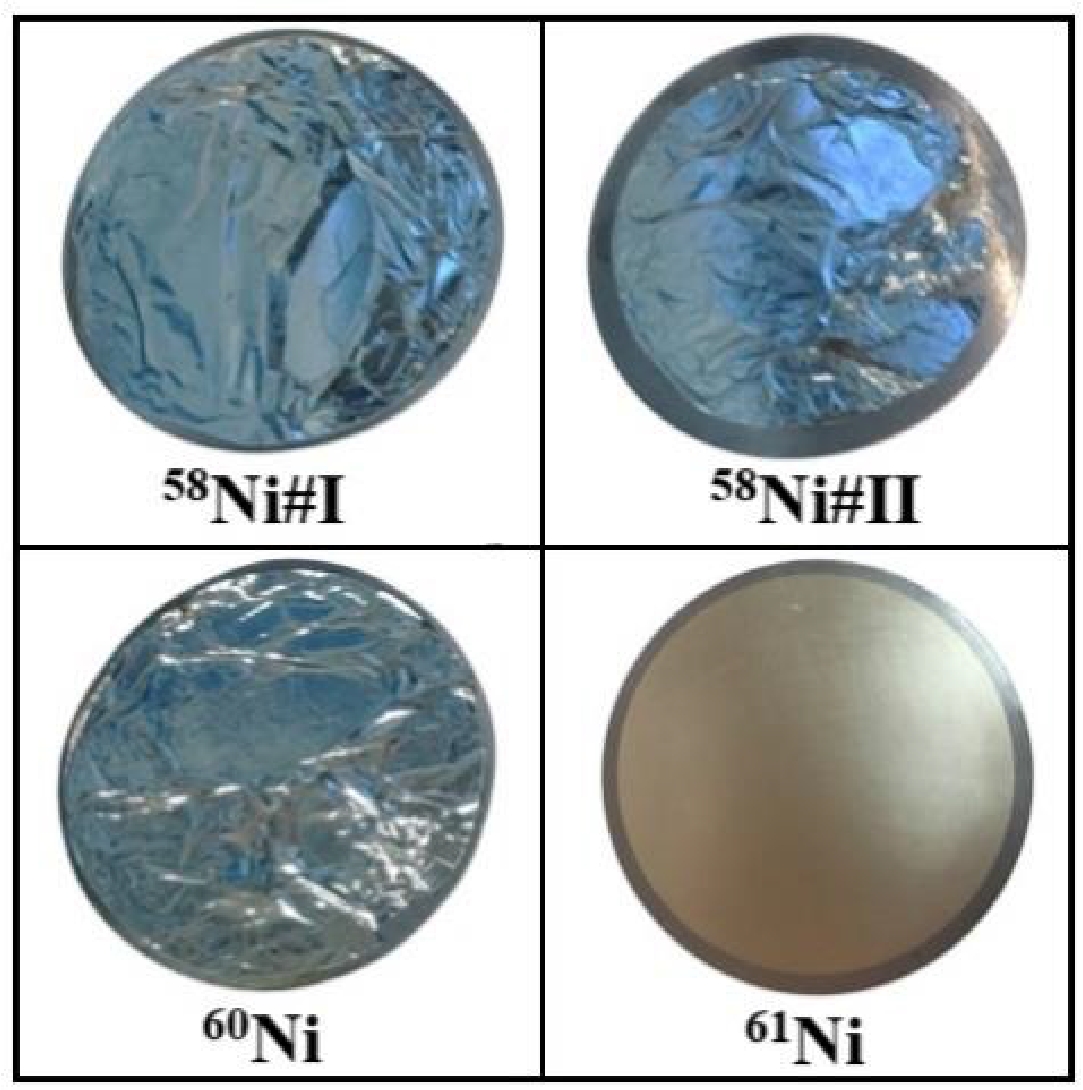
Figure 2. (color online) Pictures of the Ni samples.
The nucleus-number uncertainty was 1.0% for the 58Ni#I and 61Ni samples, and 5.0% for the 58Ni#II and 60Ni samples. Although two 58Ni samples were used for the measurements, the 58Ni#II sample had a fairly large nucleus-number uncertainty because a small section was broken during operations. Therefore, the data obtained from the two 58Ni samples were processed individually and the cross sections obtained for the 58Ni#II sample were used to check those obtained for the 58Ni#I sample. The corrections for impurity interference are detailed in Sect. 3.5.
-
Comparing with our group's previous work [20], a new GIC with symmetric double sections was made and installed whose structure and electronics are shown in Fig. 3. The old GIC has been in use for ~ 20 years, and has several shortcomings, such as gas leakage at the valve and signal instability when high voltages are applied to the electrodes. The structure of the new GIC is similar to that of the old one but it has better gas tightness and low signal noise at high voltages. Besides, the new GIC has two fission cathodes (each with the capacity for a 238U sample) to monitor the relative neutron flux, while the old GIC had only one.
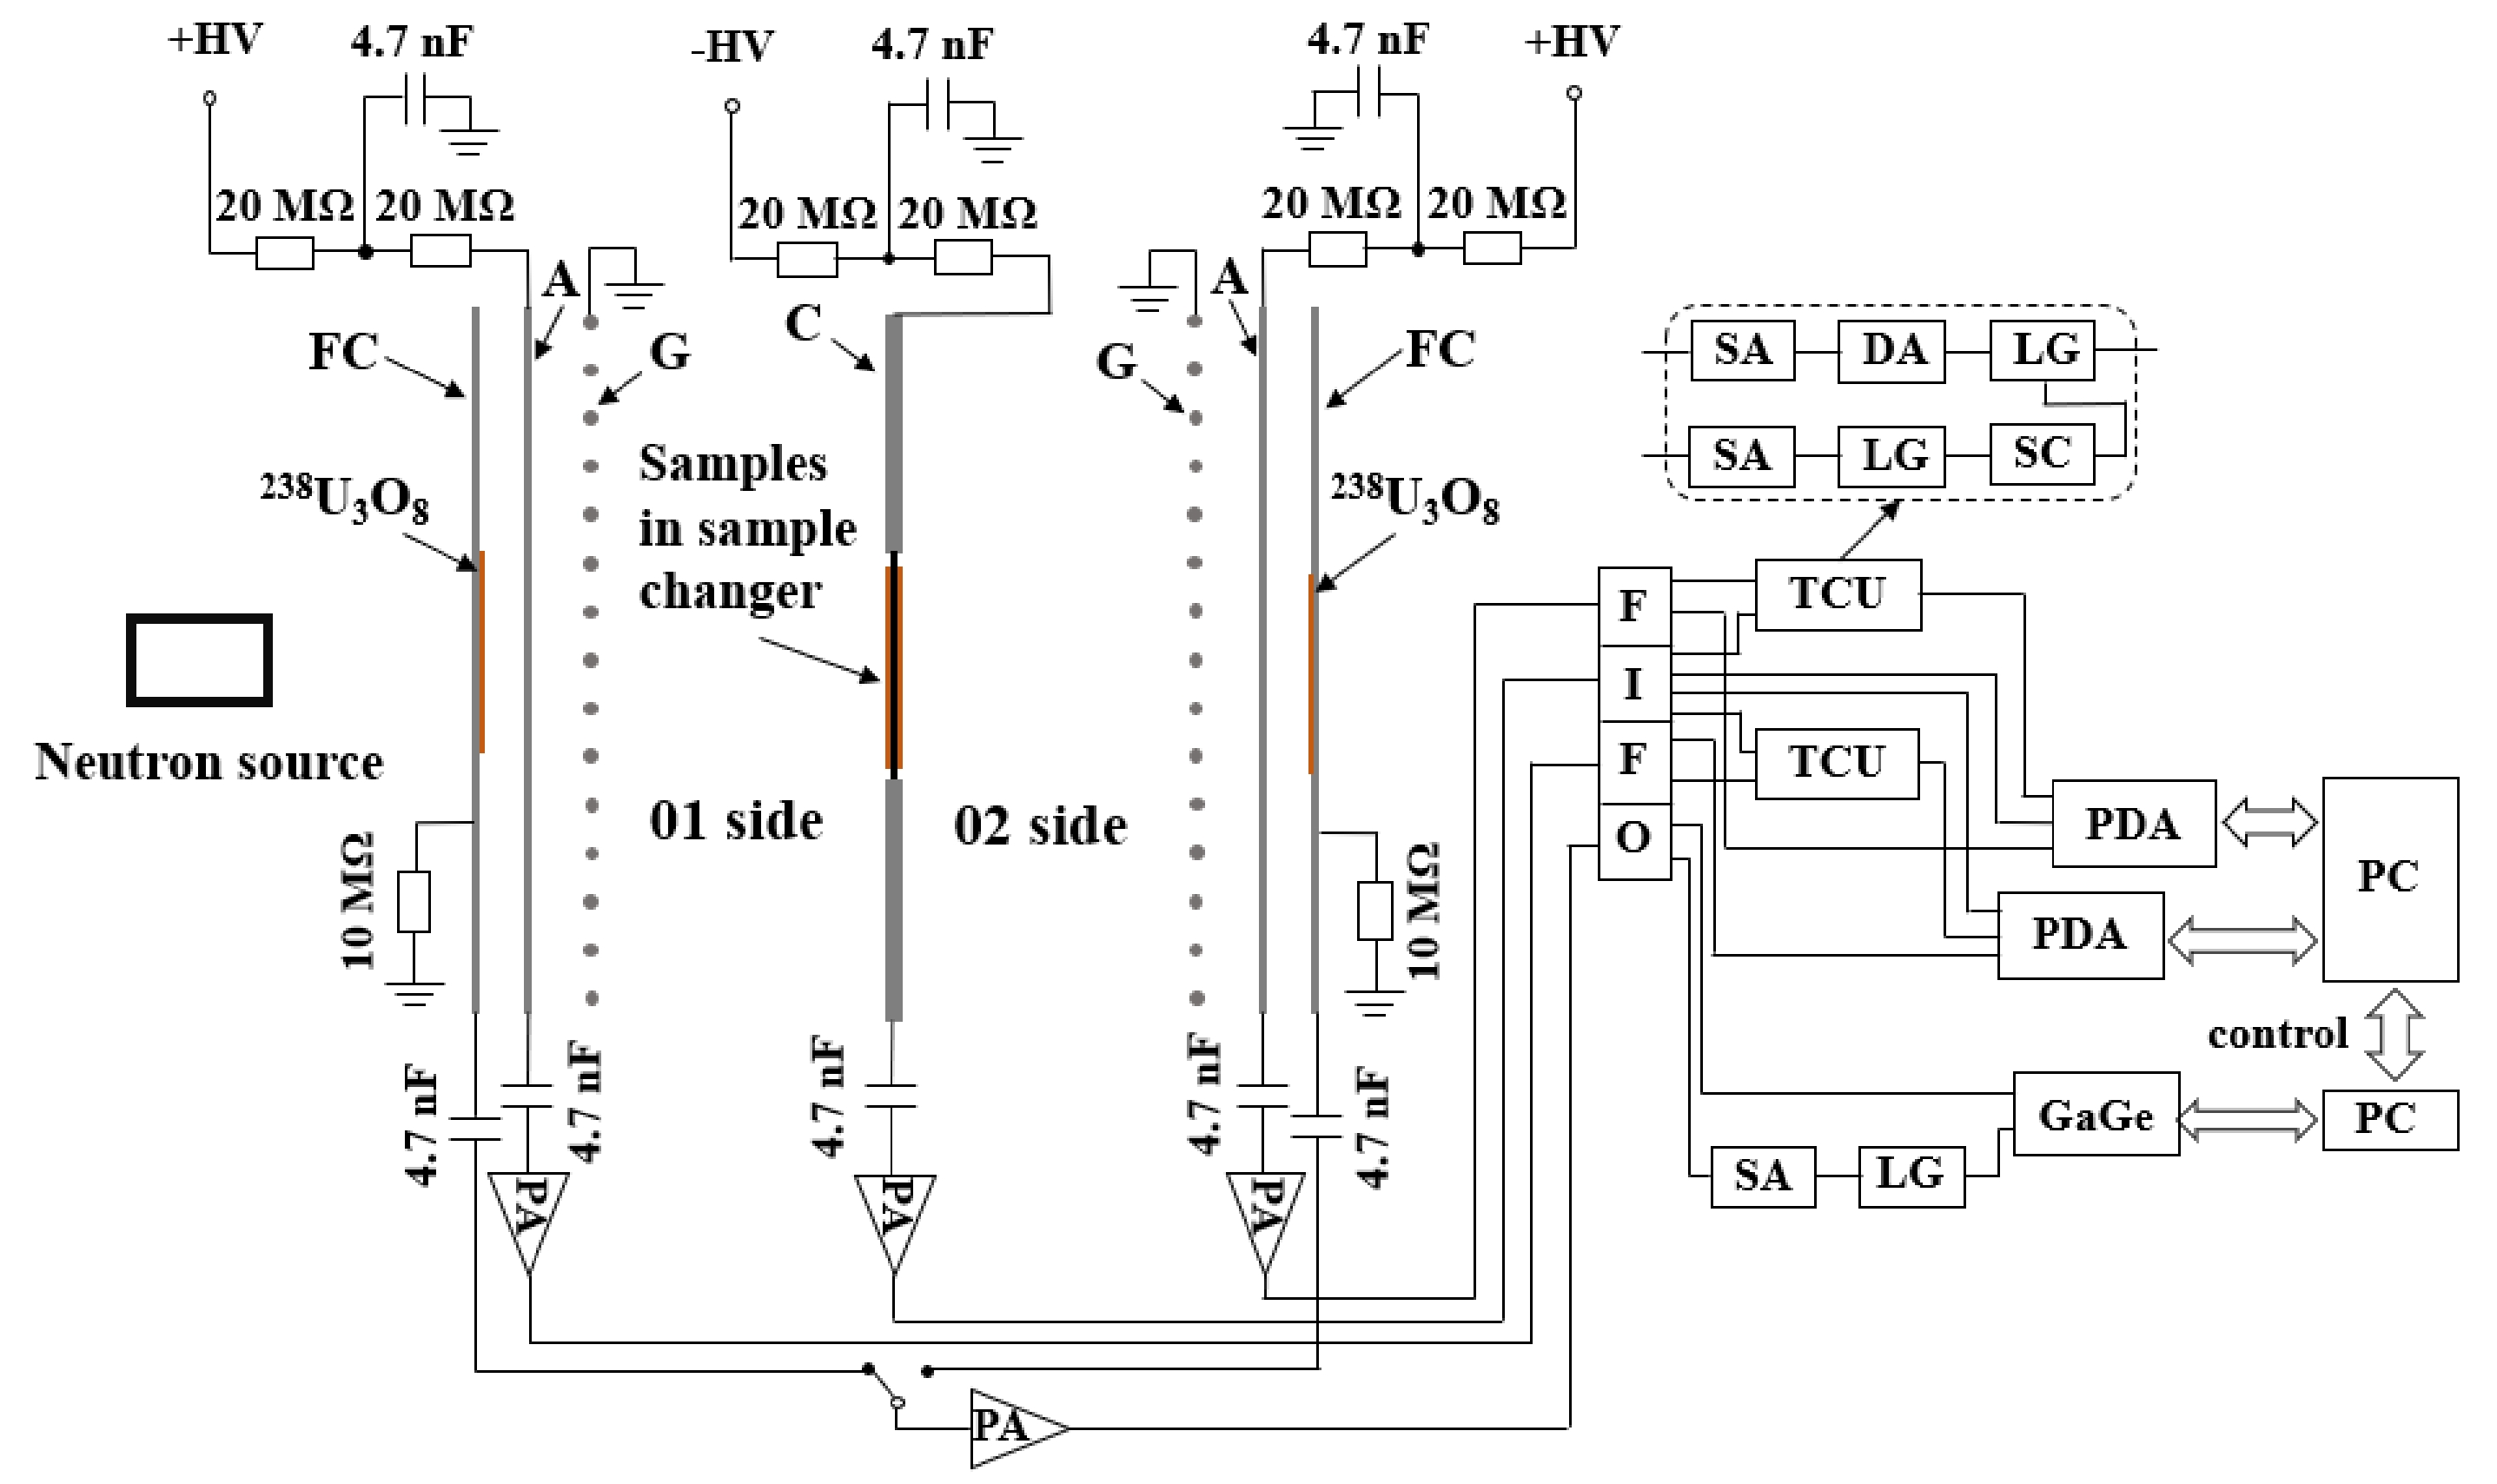
Figure 3. (color online) The structure and the electronics of the GIC: FC, fission cathode; A, anode; G, grid; C, cathode; FIFO, fan in–fan out (CAEN N625); PA, charge sensitive preamplifier (MESYTEC MPR-1); TCU, trigger control unit; SA, signal amplifier (ORTEC 572A); DA, delay amplifier (ORTEC 427A); LG, linear gate (ORTEC 542); SC, single channel analyzer (ORTEC 551); PDA, Signatec PDA14 waveform digitizer; GaGe, GaGe OVE-832-007 high resolution PCIe digitizer.
The GIC has seven electrodes: a common-cathode, two grids, two anodes, and two shields. In the present work, to monitor the relative neutron flux, two 238U3O8 samples were glued onto each shield, respectively. As such, the two shields would be used as the fission cathodes of the fission chambers. The distance was 6.1 cm from the cathode to the grid, 1.4 cm from the grid to the anode, 1.0 cm from the anode to the fission cathode, and 15.4 cm from the cathode to the front surface of the neutron source. Because there is only one foil each for the 60Ni and 61Ni samples, the GIC would be rotated by 180° during the experiment to measure the forward (0° – 180°) and the backward (90°– 180°) cross sections of the (n, α) reaction. To obtain higher fission tallies, only the signal of the fission cathode near the neutron source was used. For sides 01 and 02, the signals from the cathode and anode were recorded by a PDA14 waveform digitizer that was activated by the trigger control unit. The trigger control unit would produce the external trigger, which was generated by the coincidence of the cathode and the anode signals. The trigger control unit effectively improved the anti-noise and anti-background performance of the GIC. The signal from the fission cathode was recorded by a GaGe OVE-832-007 high-resolution PCIe digitizer.
The GIC's working gas was Xe + 8.5% H2 and the pressure was 0.855 atm so that the α-particles could be stopped before they reached the grids. The high voltages applied to the cathodes and anodes were -1200 and 600 V (the grid electrodes were grounded), which allowed for all the electrons from the ionization tracks to be collected.
With the GIC, information on the energy and angular distribution of the detected charged particle is obtained using the cathode and anode signal amplitudes. If a charged particle is emitted from the sample on the cathode and is stopped by the work gas before it reaches the gird, the cathode signal Vc and the anode signal Va can be represented by [21]
${V_{\rm{c}}} = {G_{\rm{c}}}E\left( {1 - \frac{{\overline X }}{d}\cos \theta } \right)$

(1) and
${V_{\rm{a}}} = {G_{\rm{a}}}E\left( {1 - \delta \frac{{\overline X }}{d}\cos \theta } \right) \approx {G_{\rm{a}}}E,$

(2) where Gc and Ga respectively are the ratio constants of the cathode and anode that could be determined via energy calibration; E is the energy of the emitted charged particle; d is the distance between the cathode and the grid;
$ \bar{X} $ is the distance from the beginning to the center of gravity of the ionization trace; and$ \delta $ is the grid-inefficiency of the GIC. According to the theoretical calculations, in this work, the grid-inefficiency was 0.0121, which is quite low, meaning that the influence of the grid-inefficiency in the present work was negligible. The charged particle can be identified by determining the valid area in the cathode-anode two-dimensional spectrum, because according to Eqs. (1) and (2), different charged particles with the same energy and emitting angle would induce anode and cathode signals with different amplitudes due to their different ionization traces. -
An EJ-309 liquid scintillator detector was used to obtain the neutron spectrum by unfolding the measured pulse-height spectra [22]. The axis of the scintillator detector was along the normal line of the electrodes of the ionization chamber and the 0° direction of the deuteron beam line. The distance from the entrance surface of the scintillator detector to the front surface of the neutron source was 2.60 m.
-
For each neutron energy point, measurements were performed with the sample sequentially at the No.1, No.2, No.3, No.4, and No.5 sample positions then the GIC was rotated by 180° and measurements were performed at the No.5, No.4, No.3, No.2, and No.1 sample positions. The total neutron beam duration was ~ 70 h.
During the experiment, the fission tallies obtained from the 238U3O8 sample glued onto the fission cathode near the neutron source were used to monitor the relative neutron flux, and the ratio of the fission count during the foreground measurement to that during the background measurement was approximately 1:1 – 2:1. The scintillator detector would run for ~ 15.0 min every hour to obtain the neutron spectrum.
-
First, the compound α sources were used for energy calibration and to determine the valid area of α events. Second, the fission tallies from the 238U3O8 samples were calculated to determine the absolute and relative neutron flux. Third, the net α events from the 58Ni(n, α)55Fe, 60Ni(n, α)57Fe and 61Ni(n, α)58Fe reactions were obtained in the valid area after the subtraction of the background, and the detection efficiency of α events was calculated. Fourth, the α and fission events induced by the low-energy neutrons were corrected. Fifth, the α events from the impurity isotopes were corrected. Finally, the cross sections of the 58Ni(n, α)55Fe, 60Ni(n, α)57Fe, and 61Ni(n, α)58Fe reactions were obtained, and the spread of neutron energy was unfolded into a specific energy using the iterative method.
-
The energy response of the detection system was calibrated using the compound α sources. The energy of each channel could be calibrated using the four α energy groups, as shown in Fig. 4. According to Eqs. (1) and (2), for the α particles, if we let the emitting angles equal 0° and 90°, respectively, the 0° curve and 90° line can be drawn in the cathode-anode two-dimensional spectrum as shown in Fig. 4, by which the valid area of α events can be determined. Taking the fluctuation in energy resolution into account, the valid area is a little lager than the region between the 0° curve and 90° line as shown by the two red curves in Fig. 4.
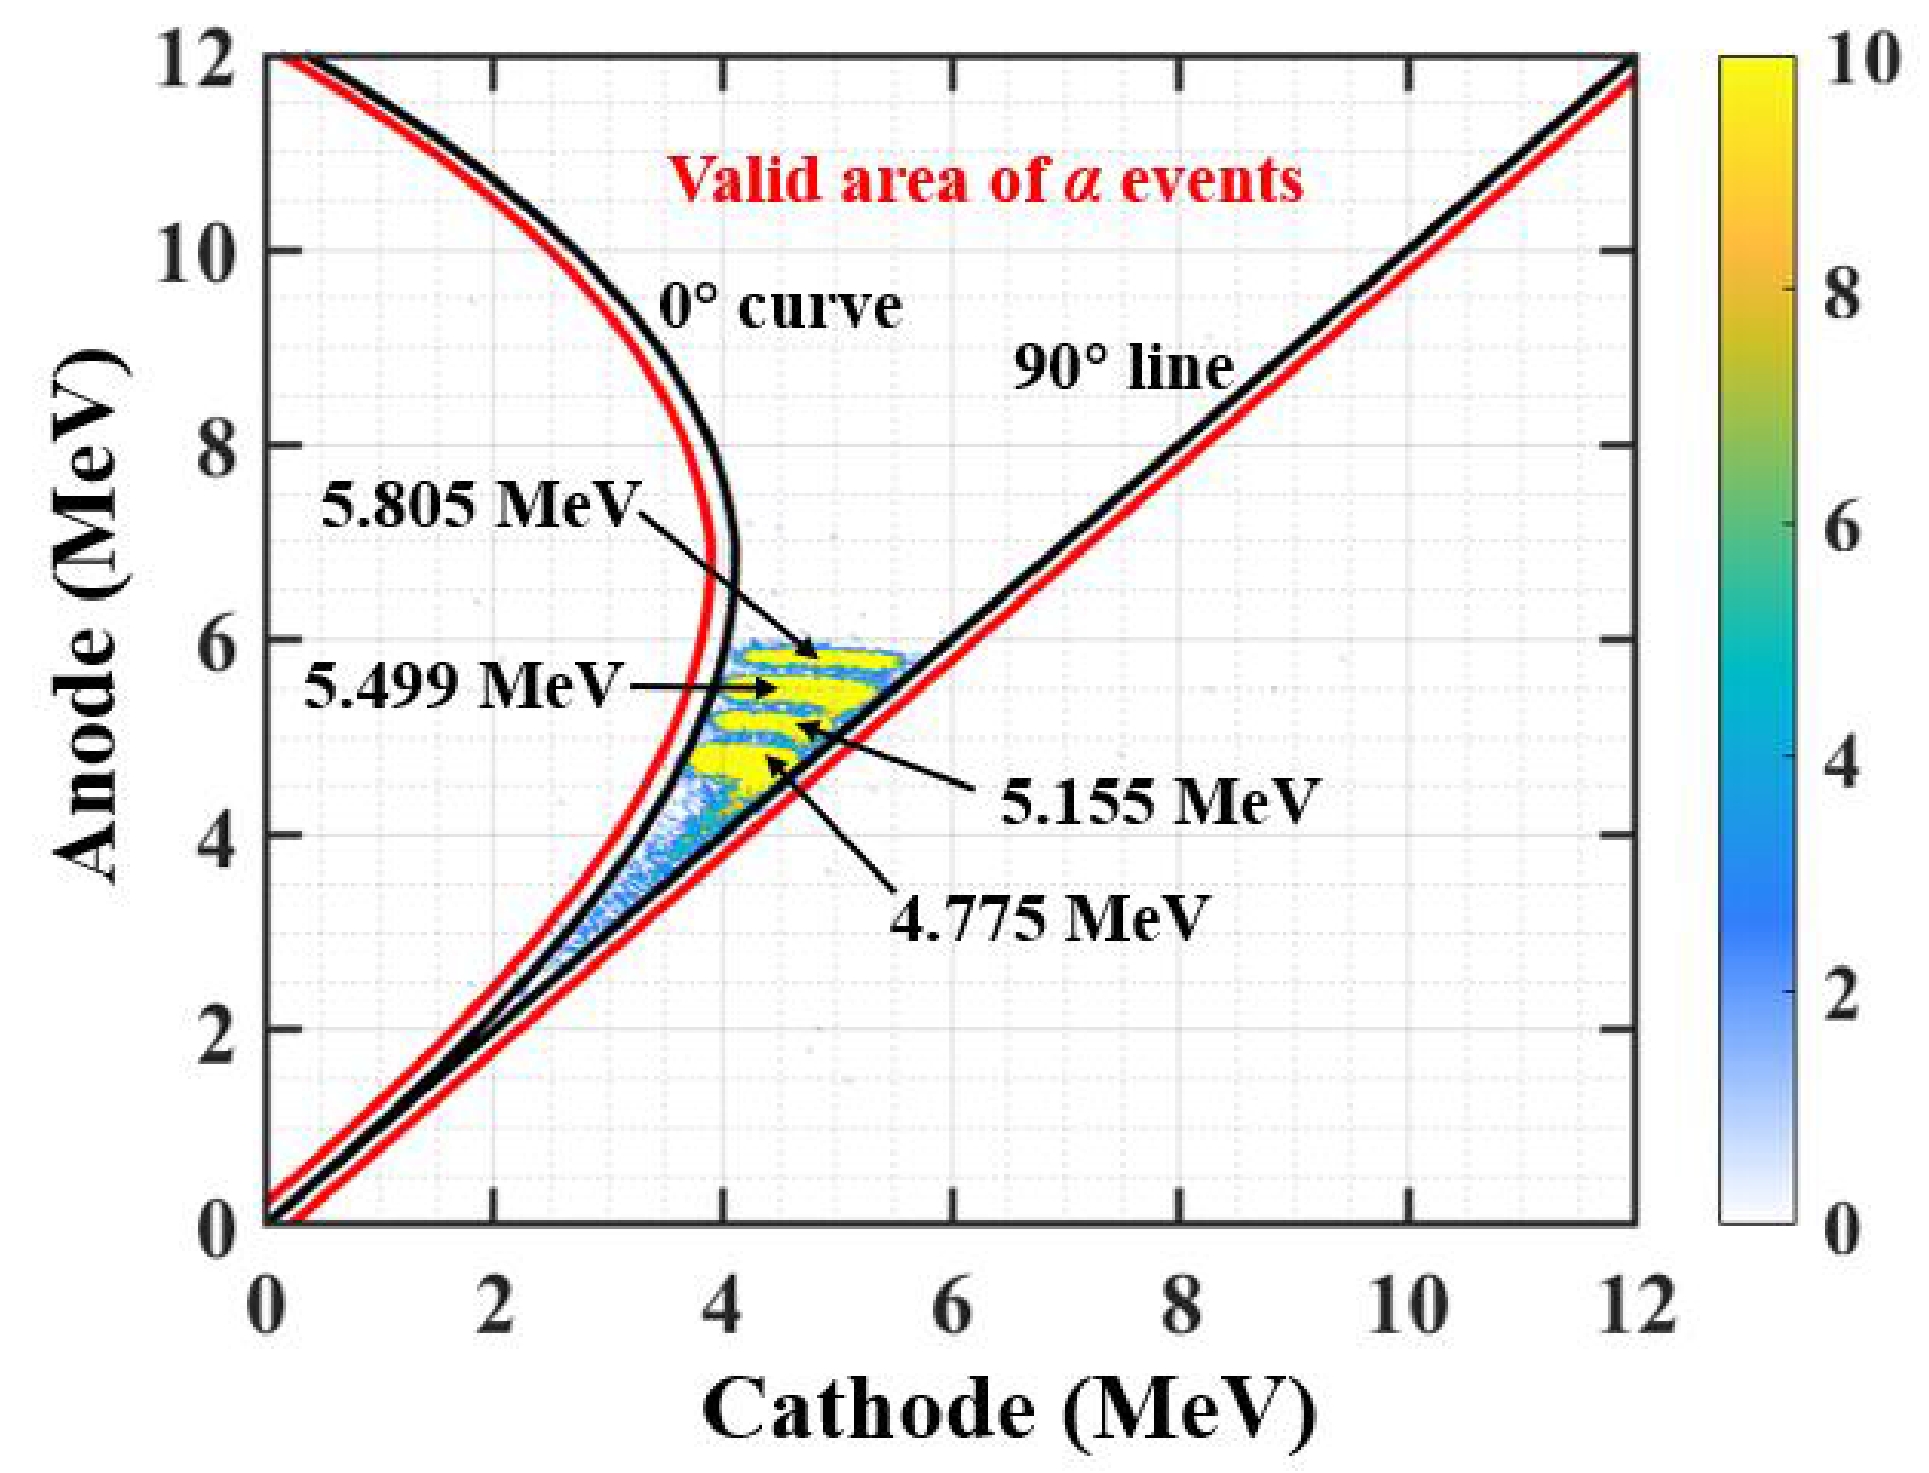
Figure 4. (color online) The measured cathode-anode two-dimensional spectrum of the compound α sources in the forward direction.
-
The total fission tallies from the 238U3O8 sample were used to determine the absolute neutron flux. A typical anode spectrum of the fission fragments is shown in Fig. 5 as an example.
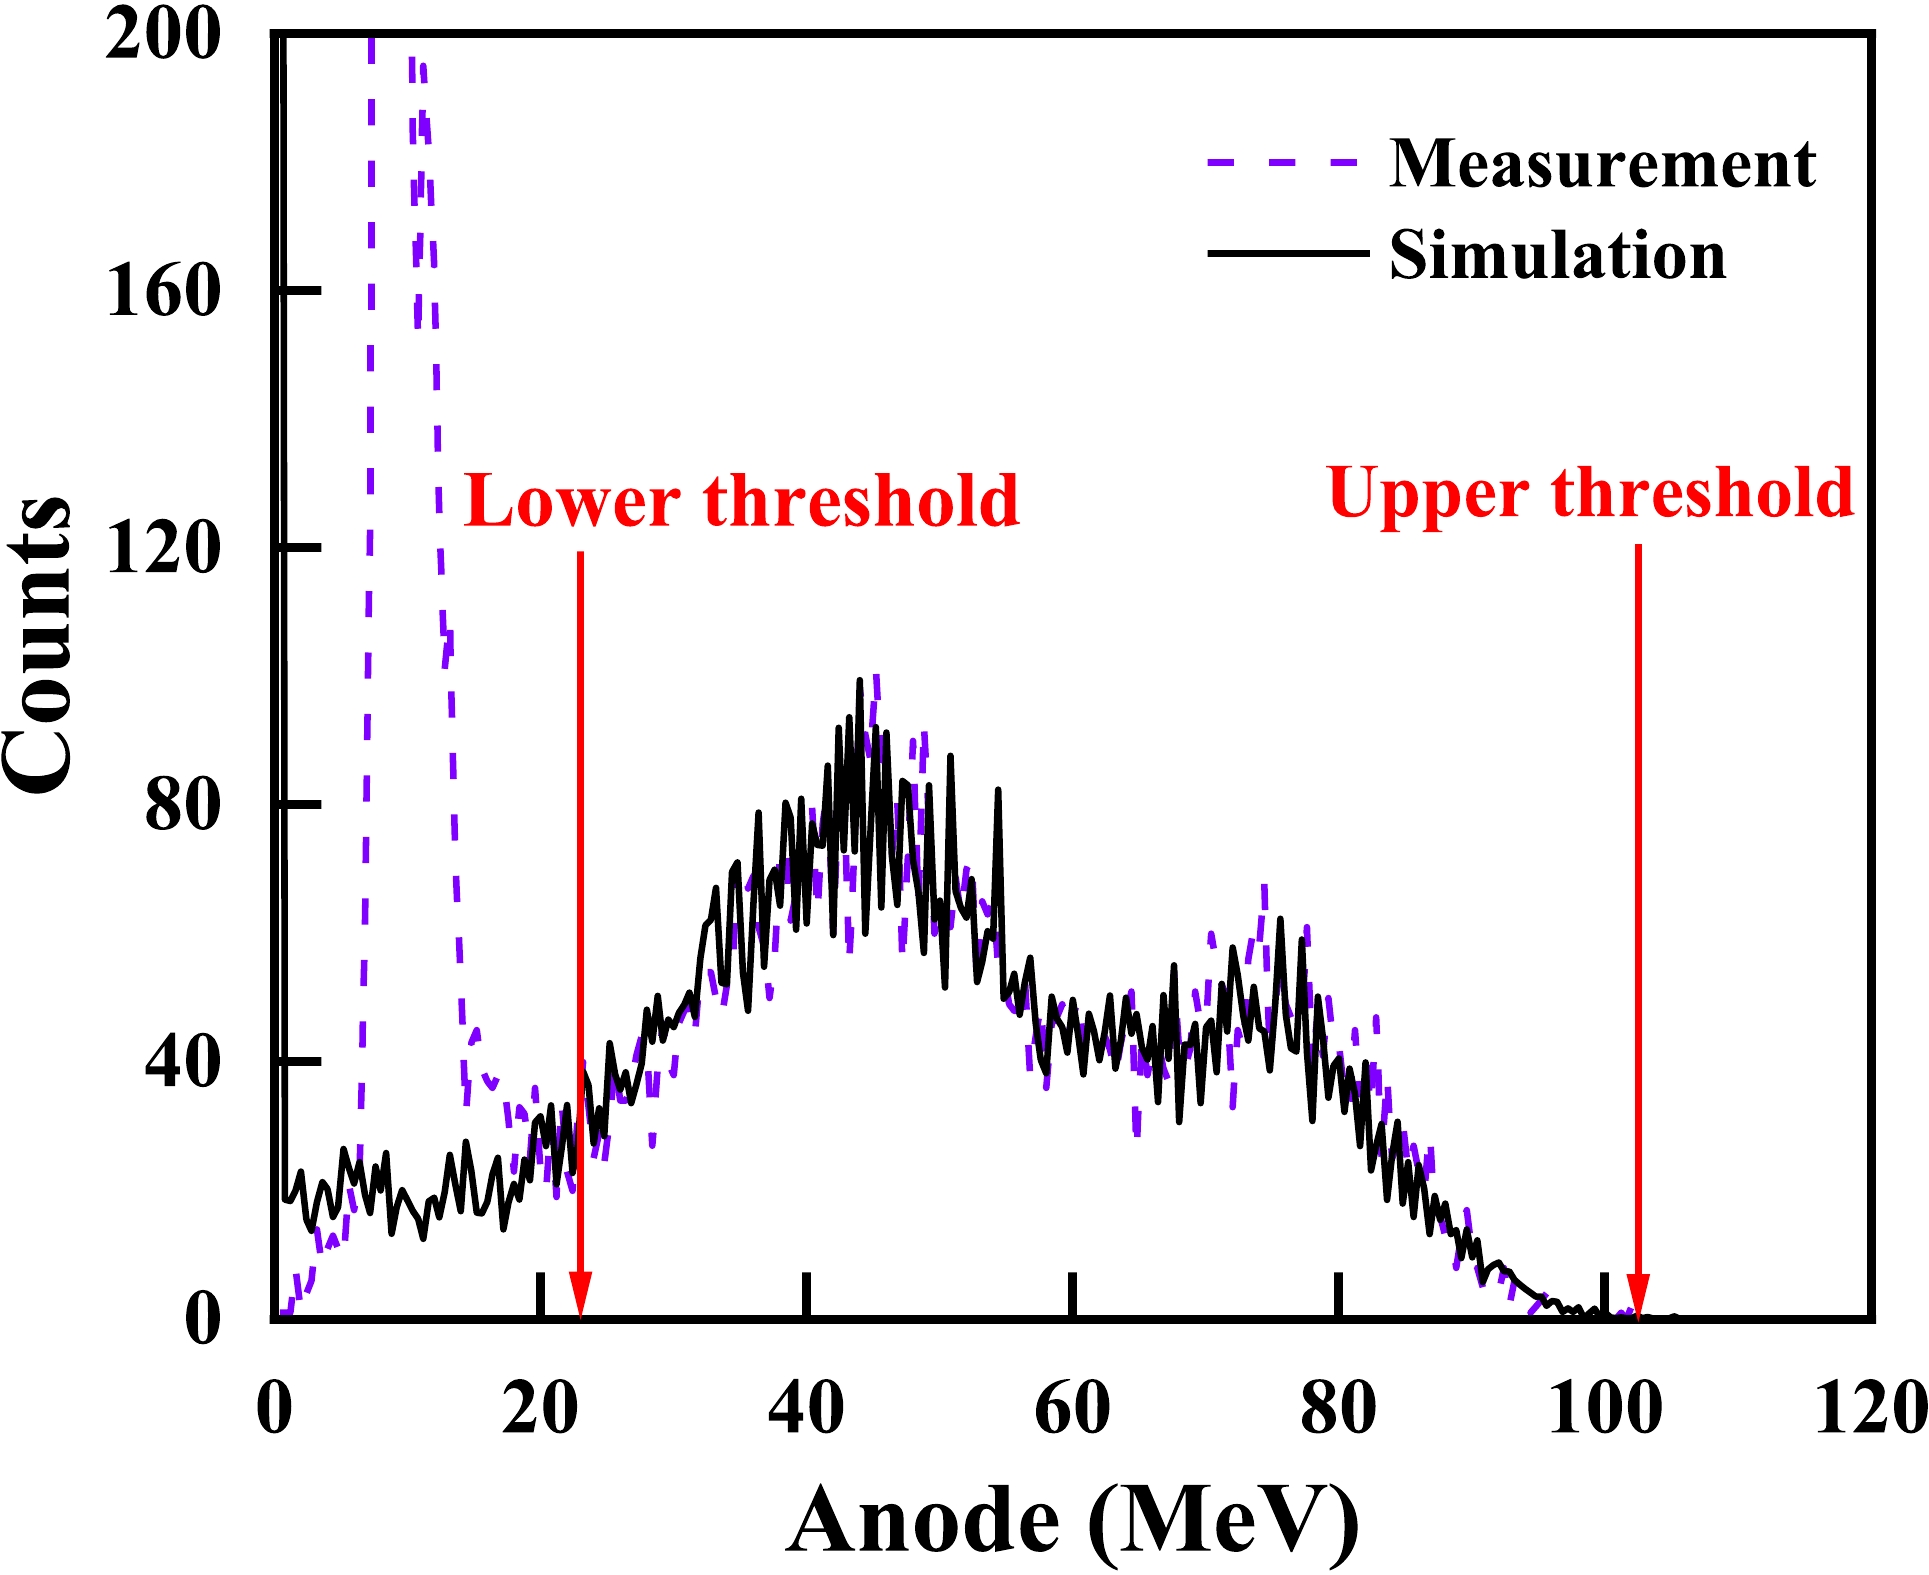
Figure 5. (color online) The anode spectrum of the fission fragments for the absolute neutron flux measurement at En = 5.50 MeV.
The detection efficiency (εf) of the fission fragments for the absolute neutron flux measurement is (75.55 – 84.93)% in the present work. A Monte Carlo simulation was used for the threshold and self-absorption corrections. The simulation code was written using Matlab-2019a [23]. The stopping power of the fission fragments in the samples was calculated by SRIM-2013 [24], the mass distribution of the fission fragments was calculated by the GEF code [25], and the angular distributions of the fission fragments were obtained from Ref. [26]. Details of the simulation can be found in Ref. [19]. The black curve in Fig. 5 shows the simulation result for the fission fragments, which agrees well with the measurement spectrum. The shape of the simulation spectrum was almost identical at different neutron energy points, because the variation of En was negligible compared to the total kinetic energy (TKE) of 238U fission fragments (~ 170 MeV). The change of εf in the present results was due to the different thresholds. The threshold position was adjusted at different energy points to obtain higher fission tallies while avoiding the background. The total fission tallies could be determined by the fission tallies within the thresholds (Nf) divided by εf.
As described in Sect. 2.5, the absolute neutron flux was measured as an individual experimental step, while the relative neutron flux was continuously measured for different experimental steps. The relative neutron flux was obtained using the relative fission tallies within the thresholds of the 238U3O8 sample glued onto the fission cathode for the different experimental steps. For the two fission cathodes, the thresholds were fixed, so the detection efficiency of the fission fragments can be regarded as invariant and be eliminated when calculating the relative tallies.
-
The cathode-anode two-dimensional spectra of the 58Ni(n, α)55Fe, 60Ni(n, α)57Fe, and 61Ni(n, α)58Fe reactions were analyzed. Fig. 6(a) shows the two-dimensional spectrum for the measurement of the 58Ni(n, α)55Fe reaction in the forward direction (from the 58Ni#I sample) after subtracting the background events at En = 5.50 MeV. The background tallies were normalized using the fission tallies from the 238U3O8 sample glued onto the fission cathode. The effective α events could be selected in the valid area described in Sect. 3.1. Then, the two-dimensional spectrum was projected onto the anode channel as Fig. 6(b) shows, in which the thresholds were set to separate the effective α events from the background that could not be subtracted. The tally of net α events within the thresholds (
${N_\alpha }$ ) can be determined by
Figure 6. (color online) (a) The cathode-anode two-dimensional spectrum after subtracting background events and (b) the anode projection spectrum of the foreground, background, and net events for the measurement of the 58Ni(n, α)55Fe reaction in the forward direction (from the 58Ni#I sample) at En = 5.50 MeV.
${N_\alpha }{\rm{ = }}N_\alpha ^{{\rm{fore}}}{\rm{ - }}{C^{{\rm{f\_b}}}}N_\alpha ^{{\rm{back}}},$

(3) where
$N_\alpha ^{{\rm{fore}}}$ and$N_\alpha ^{{\rm{back}}}$ are the total tallies within the thresholds of the foreground and background measurements, respectively.${C^{{\rm{f\_b}}}}$ is the background normalization coefficient, which is the ratio between the fission tallies from the 238U3O8 sample glued onto the fission cathode during the foreground measurement and those during the background measurement. The detection efficiency of the α particles was determined from the simulation results of the anode spectrum. Detection efficiency was related to the neutron energy and the threshold of which the details will be described in Sect. 3.4. -
The neutron spectrum at each energy point was obtained by unfolding the pulse height spectra measured by an EJ-309 liquid scintillator detector [22]. The neutron energy spectrum at En = 5.5 MeV is shown in Fig. 7 as an example (neutrons with the energy below 1 MeV were ignored because they hardly affect the results). The energy of the neutrons is divided into two parts: the main neutron region around the peak at En = 5.50 MeV, and the low-energy neutron region. The variation in the spectrum resulting from the difference between the positions of the scintillator detector and the GIC was corrected using the Monte Carlo method [27]. In the present work, the low-energy neutrons account for 9.29% – 16.50% of the total, and the α events and fission events they induced should be corrected.
$k_\alpha ^{{\rm{low}}}$ and$k_f^{{\rm{low}}}$ are defined as the proportion of α events and fission events within the thresholds induced by low-energy neutrons, respectively, and they would be calculated as follows.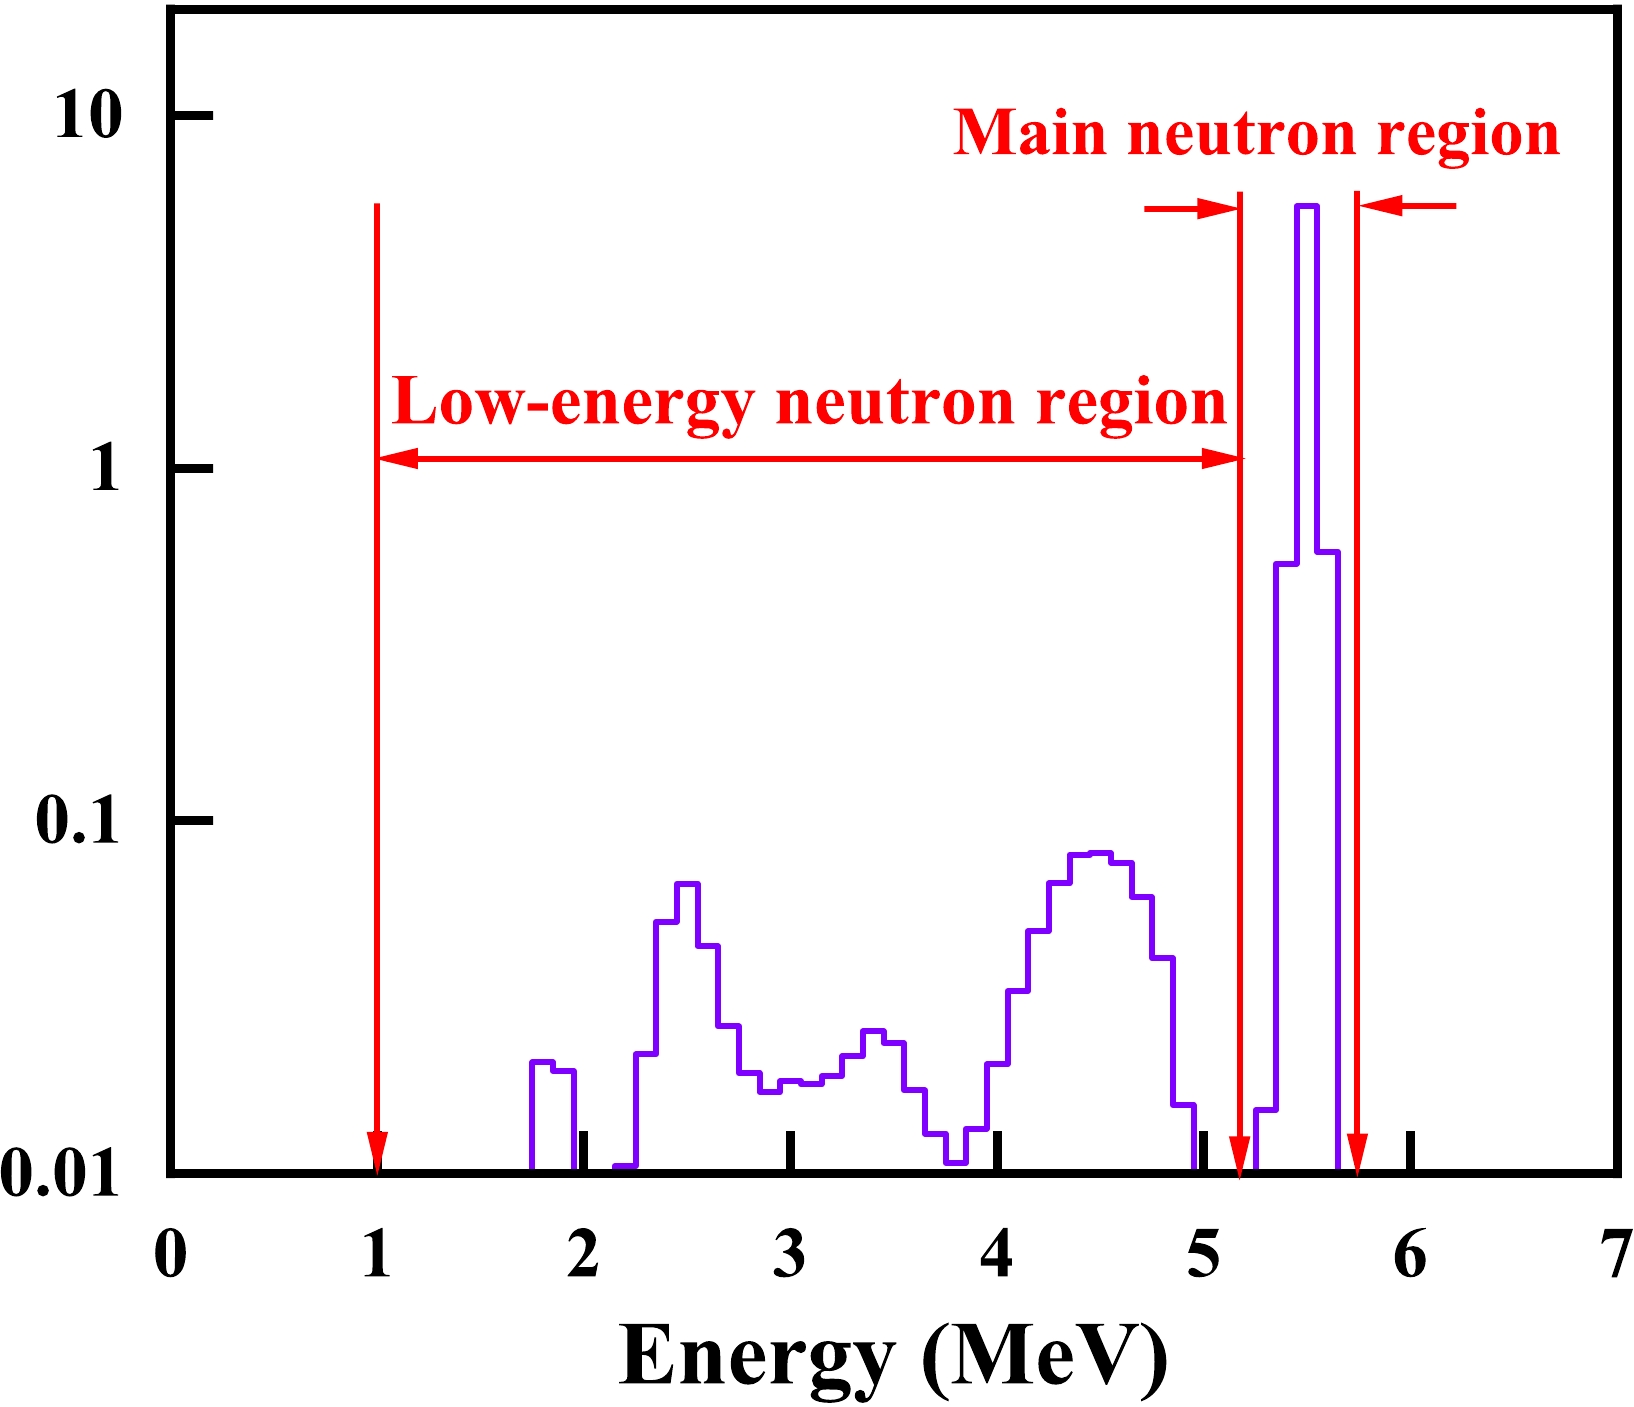
Figure 7. (color online) Neutron spectrum at En = 5.50 MeV (neutrons with the energy under 1 MeV were ignored).
The angular and energy distributions of the α events from the (n, α) reaction will change at different neutron energy points, thus changing the detection efficiency; therefore, the anode spectra induced by the neutrons with different energies should be simulated.
For the simulation, the relative intensities of the neutrons at different energy bins were obtained from the measured neutron spectrum, the stopping power of α particles in the samples was calculated using SRIM-2013 [24], the angular and energy distributions of α particles were calculated using TALYS-1.9 [28] and, for the initial condition, the cross sections were obtained from the ENDF/B-VIII.0 library [9]. Because the tallies of the simulated spectrum may be systematically higher or lower than those measured, the simulated spectrum was multiplied by a factor to fit the measurements, which means that only the variation trend in the cross sections obtained from the ENDF/B-VIII.0 library was used in the present results. The detection efficiencies of α events (εα) were obtained from the simulated spectrum. According to the simulation, εα is 86.73% – 92.64% for the 58Ni(n, α)55Fe reaction in the 4.50 MeV ≤ En ≤ 5.50 MeV region, 69.47% – 87.00% for the 60Ni(n, α)57Fe reaction, and 84.11% – 91.48% for the 61Ni(n, α)58Fe reaction in the 5.00 MeV ≤ En ≤ 5.50 MeV region.
Because the cross sections were not measured for low neutron energy in the present work, it is necessary to use the evaluation cross sections to calculate the final results. To estimate the uncertainty of the evaluation cross sections, the ENDF/B-VII.1 library was used, and the final result was recalculated. Then, the difference between the new result and the previous result was regarded as the uncertainty.
As an example, Fig. 8 shows the α events of the 58Ni(n, α)55Fe reaction (in the forward direction at En = 5.50 MeV) induced by the total neutrons, main neutrons, low-energy neutrons, and the neutrons with 5.50 MeV of specific energy as “Simulation (total neutrons),” “Simulation (main neutrons),” “Simulation (low-energy neutrons),” and “Simulation ([5.50 MeV] neutrons),” respectively. Using the simulated spectra of “Simulation (low-energy neutrons)” and “Simulation (total neutrons),” the proportion of α events within the thresholds induced by the low-energy neutrons (
$k_\alpha ^{{\rm{low}}}$ ) could be determined. The values of$k_\alpha ^{{\rm{low}}}$ are 2.93% – 5.25%, 0.22% – 1.35%, and 2.96% – 4.44% for the 58Ni(n, α)55Fe, 60Ni(n, α)57Fe, and 61Ni(n, α)58Fe reactions, respectively.
Figure 8. (color online) The measured and simulated anode projection spectrum for the measurement of the 58Ni(n, α)55Fe reaction in the forward direction (from the 58Ni#I sample) at En = 5.50 MeV. The simulated α events were induced by the neutrons in different energy regions.
As described in Sect. 3.2, the detection efficiency of the fission events could be regarded as invariant with the change of neutron energy when the thresholds were fixed; it can then be eliminated when the proportion of fission events induced by the neutrons with different energies is calculated. Therefore, the proportion of the fission events within the thresholds induced by the low-energy neutrons (
$k_f^{{\rm{low}}}$ ) could be determined using the standard cross section of the 238U(n, f) reaction [29] and the measured neutron spectrum. According to calculation,$k_f^{{\rm{low}}}$ is 9.41% – 16.32% at different neutron energy points.The correction coefficient of the events induced by low-energy neutrons (ρlow) was introduced by
${\rho ^{_{{\rm{low}}}}}{\rm{ = }}\dfrac{{{\rm{1 - }}k_\alpha ^{{\rm{low}}}}}{{{\rm{1 - }}k_f^{{\rm{low}}}}}.$

(4) The values of
${\rho ^{{\rm low}}}$ are 1.064 – 1.132, 1.125 – 1.164, and 1.090 – 1.127 for the 58Ni(n, α)55Fe, 60Ni(n, α)57Fe, and 61Ni(n, α)58Fe reactions, respectively. The values of${\rho ^{{\rm{low}}}}$ are greater than 1, because the low-energy neutrons would have a stronger influence on fission events than on α events. -
As shown in Table 2, in addition to the main isotopes in the samples there are some impurity isotopes, including 58Ni, 60Ni, 61Ni, 62Ni, and 64Ni. The α events arising from the 62Ni and 64Ni impurity isotopes hardly affect the results because the cross sections of the (n, a) reactions of these two isotopes were smaller than those of other isotopes by two orders of magnitude [15]. Therefore, only the influences of the 58Ni, 60Ni, and 61Ni isotopes were taken into consideration.
The interference arising from the impurities was negligible in the 58Ni(n,α)55Fe reaction measurements because the cross sections of the (n, α) reactions of the 60Ni and 61Ni impurity isotopes were fairly small compared with those in the 58Ni(n, α)55Fe reaction, and the purity of the 58Ni sample was very high (99.84%). In the 60Ni(n, α)57Fe and 61Ni(n, α)58Fe reaction measurements, the interference from the impurities in the samples was non-negligible because the cross sections of the two reactions were approximately 70% – 90% lower than those of the 58Ni(n, α)55Fe reaction and 58Ni was the main impurity isotope in the 60Ni and 61Ni samples.
To correct the interference of the impurity isotopes, the anode spectrum contributed by different isotopic compositions was simulated according to their proportions presented in Table 1. A typical example is shown in Fig. 9. The conditions for the simulation were similar to those described in Sect. 3.3 but the cross sections of the (n, α) from the impurity isotopes were obtained from the present results: in the measurement of the 58Ni(n, α)55Fe reaction, the interference from the impurities was negligible and consequently the cross sections of the 58Ni(n, α)55Fe reaction could be obtained without correcting for the impurity isotopes; then, for the measurement of the 60Ni(n, α)57Fe reaction, the interference was mainly from the 58Ni(n, α)55Fe reaction, the cross sections of which already had been obtained; lastly, for the measurement of the 61Ni(n, α)58Fe reaction, the interference was mainly from the 58Ni(n, α)55Fe and 60Ni(n, α)57Fe reactions, the cross sections of which had also been obtained already.
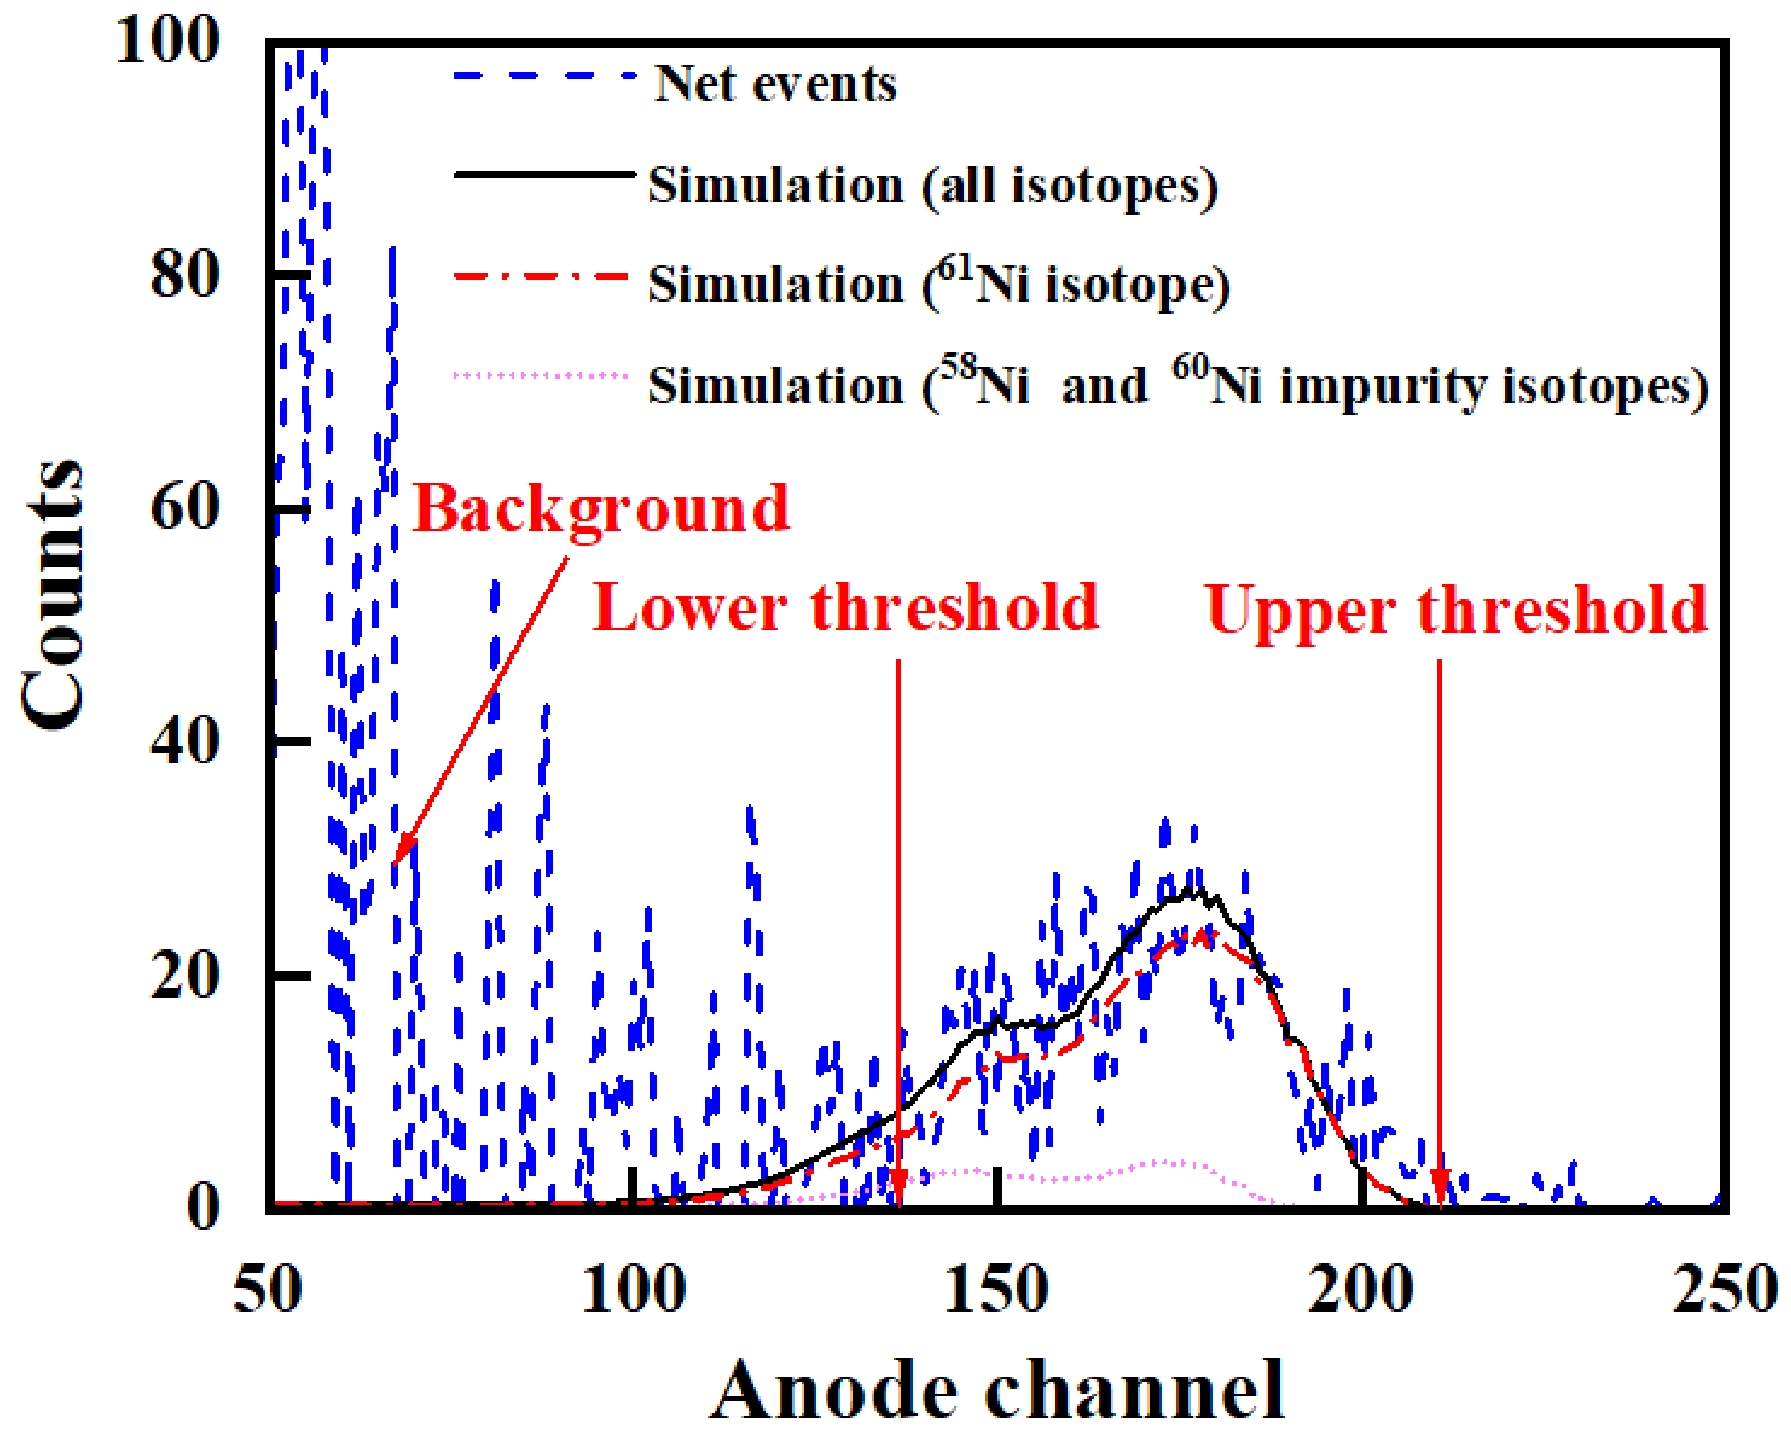
Figure 9. (color online) The measured and simulated anode projection spectrum for the measurement of the 61Ni(n, α)55Fe reaction in the forward direction at En = 5.50 MeV. The simulated α events were from all isotopes in the 61Ni sample, including the 61Ni isotope and the 58Ni and 60Ni impurity isotopes.
The tallies of the α events from different isotopes could be determined from the simulated results. The proportion of α events arising from the impurity isotope (βimpurity) could be determined using the ratio between the simulated tallies within the thresholds of the impurity isotopes and those of all isotopes. βimpurity is ~ 0% for the 58Ni(n, α)55Fe reaction, 0.89% – 1.07% for the 60Ni(n, α)57Fe reaction, and 11.69% – 12.95% for the 61Ni(n, α)58Fe reaction.
-
Either the forward or backward cross sections (σα) of the (n, α) reactions can be calculated by
${\sigma _\alpha }{\rm{ }} = {\sigma _f} \cdot \frac{{{N_{\rm{U}}} \cdot {N_\alpha } \cdot {\varepsilon _f} \cdot {\rho ^{{{\rm{low}}}}} \cdot ({\rm{1 - }}{\beta ^{{\rm{impurity}}}})}}{{{N_{{\rm{Ni}}}} \cdot {N_f} \cdot {\varepsilon _\alpha } \cdot G \cdot {C^{{\rm{f\_}fission}}}}} \cdot {R^{{\rm{unfolding}}}},$

(5) where σf is the standard cross section of the 238U(n, f) reaction, and the values of σf in the present results are 0.5592, 0.5579, 0.5483, 0.5517, and 0.5482 b at En = 4.50, 4.75, 5.00, 5.25, and 5.50 MeV, respectively [29]. NU and NNi are the numbers of 238U and 58, 60, 61Ni nuclei in the samples, respectively. Nα and Nf are the tallies of the net α events and fission events described in Sects. 3.3 and 3.2, respectively. εf and εα are the detection efficiencies for the fission fragments and α particles at the specific neutron energy described in Sect. 3.2 and 3.3, respectively. ρlow is the correction coefficient of the events induced by the low-energy neutrons described in Sect. 3.5. βimpurity is the proportion of α events arising from the impurity isotope described in Sect. 3.5. G = 0.9890 – 1.003 is the ratio between the average neutron flux in the area of the nickel sample and that of the 238U3O8 sample in the sample changer, and G is obtained by the Monte Carlo method (G is introduced because there is a slight difference between the diameters of the two samples). Cf_fission is the ratio between the fission tallies from the 238U3O8 sample glued onto the fission cathode during the foreground measurement and those obtained during the absolute neutron flux measurement. Runfolding is the unfolding coefficient that is explained as follows.
According to the measured neutron spectrum shown in Fig. 7, in the main neutron region, the width of the neutron peak is non-negligible and the corresponding uncertainty of En is 2.5% – 4.2% in the 4.50 MeV ≤ En ≤ 5.50 MeV region. The spread of neutron energy could be unfolded using the iterative method.
$k_\alpha ^{{{\bar E}_{{n}}}}$ and$k_f^{{{\bar E}_{{n}}}}$ , which are the ratios between the tallies of the α and fission events within the thresholds induced by the neutrons with the specific energy${\bar E_{{n}}}$ and those induced by the main neutrons that were determined for unfolding the neutron spectrum.$k_\alpha ^{{{\bar E}_{{n}}}}$ can be determined using the simulation method. As shown in Fig. 8, the α events induced by main neutrons and the neutrons with the specific energy${\bar E_{{n}}}$ can be determined using the simulated tallies of “Simulation (main neutrons)” and “Simulation ([5.50 MeV] neutrons).” The conditions for simulation were the same as those described in Sect. 3.3 except for the cross section of the (n, α) reaction. The forward or backward cross section of the (n, α) reaction was obtained from the last iteration using Eq. (3). In the main neutron region, the neutron energies are very close and the excitation functions of the (n, α) reactions are smooth; therefore, the cross section can be obtained from the measured results using the linear interpolation or extrapolation method.$k_f^{{{\bar E}_{{n}}}}$ could be determined using the standard cross section of the 238U(n, f) reactions [29] and the measured neutron spectrum.Next, the unfolding coefficient Runfolding was calculated by
${R^{{\rm{unfolding}}}}{{ = }}\frac{{k_\alpha ^{{{\bar E}_{{n}}}}}}{{k_f^{{{\bar E}_{\rm{n}}}}}}.$

(6) Then, the new cross section σα would be calculated using Eq. (5). This deconvolution process was iterated until the variation of the cross section was less than 0.1% (usually 10 times). Runfolding was set to 1 as the initial value. In the present work, the final value of Runfolding is 0.9705–1.018, which would slightly correct the original results by -2.95%-1.80%. The value of Runfolding is mainly affected by the average neutron energy in the main neutron region. If the average neutron energy is smaller than the specific energy
${\bar E_{{n}}}$ , Runfolding would be greater than 1; otherwise, it would be less than 1. The unfolding method could decrease the uncertainty of En from 2.5% – 4.2% to 1.4% – 1.5%, and the final uncertainty of En is contributed by the energy resolution of the scintillator detector. -
The forward and backward cross sections of the 58Ni(n, α)55Fe, 60Ni(n, α)57Fe, and 61Ni(n, α)58Fe reactions can be calculated using Eq. (5). The sources of uncertainty and their magnitudes are presented in Table 3. The total (n, α) cross section could be obtained by adding the forward cross section to the backward. Further, the forward/backward ratios in the laboratory reference system could be obtained by division. The results are shown in Tables. 4 – 6 and Figs. 10 – 12 (results of the 58Ni(n, α)55Fe reaction were obtained from the 58Ni#I sample).
source magnitude (%) 58Ni(n, α)55Fe 60Ni(n, α)57Fe 61Ni(n, α)58Fe NU 1.0a, b 1.0a, b 1.0a, b NNi 1.0a, b 5.0a, b 1.0a, b σf 0.6 – 0.7 a, b 0.6 – 0.7 a, b 0.6 – 0.7 a, b Nα 2.9 – 4.4 a, 2.7 – 5.0 b 8.0 – 11.6 a, 13.2 – 18.5 b 6.4 – 7.0 a, 8.3 – 8.5 b Nf 1.0 – 1.1 a, b 1.0 – 1.1 a, b 1.0 – 1.1 a, b ρlow 1.4 – 1.7 a, 1.0 – 2.1 b 1.4 – 1.6 a, 1.5 – 1.6 b 1.4 – 1.7 a, 1.5 – 1.7 b εf 1.9 – 3.1 a, b 2.1 – 3.1 a, b 2.1 – 3.1 a, b εα 1.8 – 3.2 a, 2.2 – 3.3 b 3.3 – 6.2 a, 6.5 – 7.6 b 2.2 – 4.0 a, 2.1 – 3.5 b G < 0.5 a, b < 0.5 a, b < 0.5 a, b βimpurity –– < 0.1 a, b 1.8 – 2.0 a, 1.8 – 1.9 b Runfolding 1.0 – 2.1 a, 1.0 – 2.7 b 2.0 – 3.7 a, 1.0 – 4.6 b 0.3 – 1.1a, 0.5 – 1.1b En(later error after the unfolding process) 1.4 – 1.5 a, b 1.4 – 1.5 a, b 1.4 – 1.5 a, b σα 5.2 – 6.6 a, 5.3 – 7.6 b, 5.2 – 7.0 c 11.6 – 12.8 a, 15.7 – 20.4 b,13.9 – 15.0 c 8.6 – 8.7 a, 9.8 – 10.2 b,9.0 – 9.4 c a For the forward cross section;
b For the backward cross section;
c For the total cross section (forward cross section + backward cross section).Table 3. Sources of the uncertainty and their magnitudes.
En/MeV cross section /mb forward/backward ratio measurement calculation measurement calculation 4.50 ± 0.07 25.7 ± 1.3 24.6 0.96 ± 0.07 1.05 4.75 ± 0.07 28.7 ± 2.0 30.7 1.03 ± 0.10 1.05 5.00 ± 0.07 37.2 ± 2.2 36.8 1.03 ± 0.09 1.05 5.25 ± 0.08 44.6 ± 2.7 42.9 1.05 ± 0.09 1.05 5.50 ± 0.08 51.7 ± 3.0 48.7 1.04±0.08 1.04 Table 4. Measured 58Ni(n, α)55Fe cross sections and forward/backward ratios in the laboratory reference system (results were obtained from the 58Ni#I sample) compared with TALYS-1.9 calculations using the adjusted input parameters.
En/MeV cross section /mb forward/backward ratio measurement calculation measurement calculation 5.00 ± 0.07 9.40 ± 0.84 9.36 1.04 ± 0.13 1.05 5.50 ± 0.08 11.9 ± 1.1 12.0 1.00 ± 0.13 1.04 Table 6. Measured 61Ni(n, α)58Fe cross sections and forward/backward ratios in the laboratory reference system compared with TALYS-1.9 calculations using the adjusted input parameters.

As described in Sect. 2.2, the present cross sections of the 58Ni(n, α)55Fe reaction were obtained from the 58Ni#I sample, and they were checked using the results obtained from the 58Ni#II sample, as Fig. 13 shows. The results obtained from the two samples agreed, thus verifying the reliability of the measurement results .
-
TALYS-1.9 [28] was used to calculate the cross sections of the 58Ni(n, α)55Fe, 60Ni(n, α)57Fe, and 61Ni(n, α)58Fe reactions. To attain better agreement with the present results, several input parameters, including those of the optic, level density, and stripping models, were adjusted from the default input values, as listed in Table 7 (parameters of the stripping model mainly affect the results for En > 10.0 MeV). The calculated cross sections and forward/backward ratios agree well with the measured results, as presented in Tables 4 – 6 and Figs. 10 – 12. With the adjusted parameters, the calculated cross sections of other major reaction channels, including the (n, tot), (n, el), (n, n’), and (n, p) reactions, and the angular distributions of elastic scattering have been checked. The calculated results of these reactions also agree well with most existing measurements and evaluations, thus verifying the reliability of the adjusted parameters.
58Ni(n, α)55Fe 60Ni(n, α)57Fe keyword parameter keyword parameter rvadjust a p 1.03 rvadjust a p 1.14 rvadjust a a 0.92 rvadjust a a 1.091 rwadjust a a 1.58 aadjust b 28 60 1.14 tljadjust a a 0.50 1 tljadjust a a 1.50 1 tljadjust a a 3.00 2 tljadjust a a 2.02 3 61Ni(n, α)58Fe aadjust b 26 55 0.90 keyword parameter tadjust b 26 55 0.95 rvadjust a p 1.12 cstrip c a 0.80 rvadjust a a 1.02 a parameters of the optic model [28];
b parameters of the level density model [28];
c parameters of the striping model [28].Table 7. Adjusted input parameters of TALYS-1.9.
-
The present cross sections were compared with existing measurement data obtained from the EXFOR library [8] and evaluations obtained from the ENDF/B-VIII.0 [9], ENDF/B-VII.1 [10], JENDL-4.0u+ [11], JEFF-3.3 [12], ROSFOND-2010 [13], CENDL-3.1 [14], and TENDL-2019 [30] libraries:
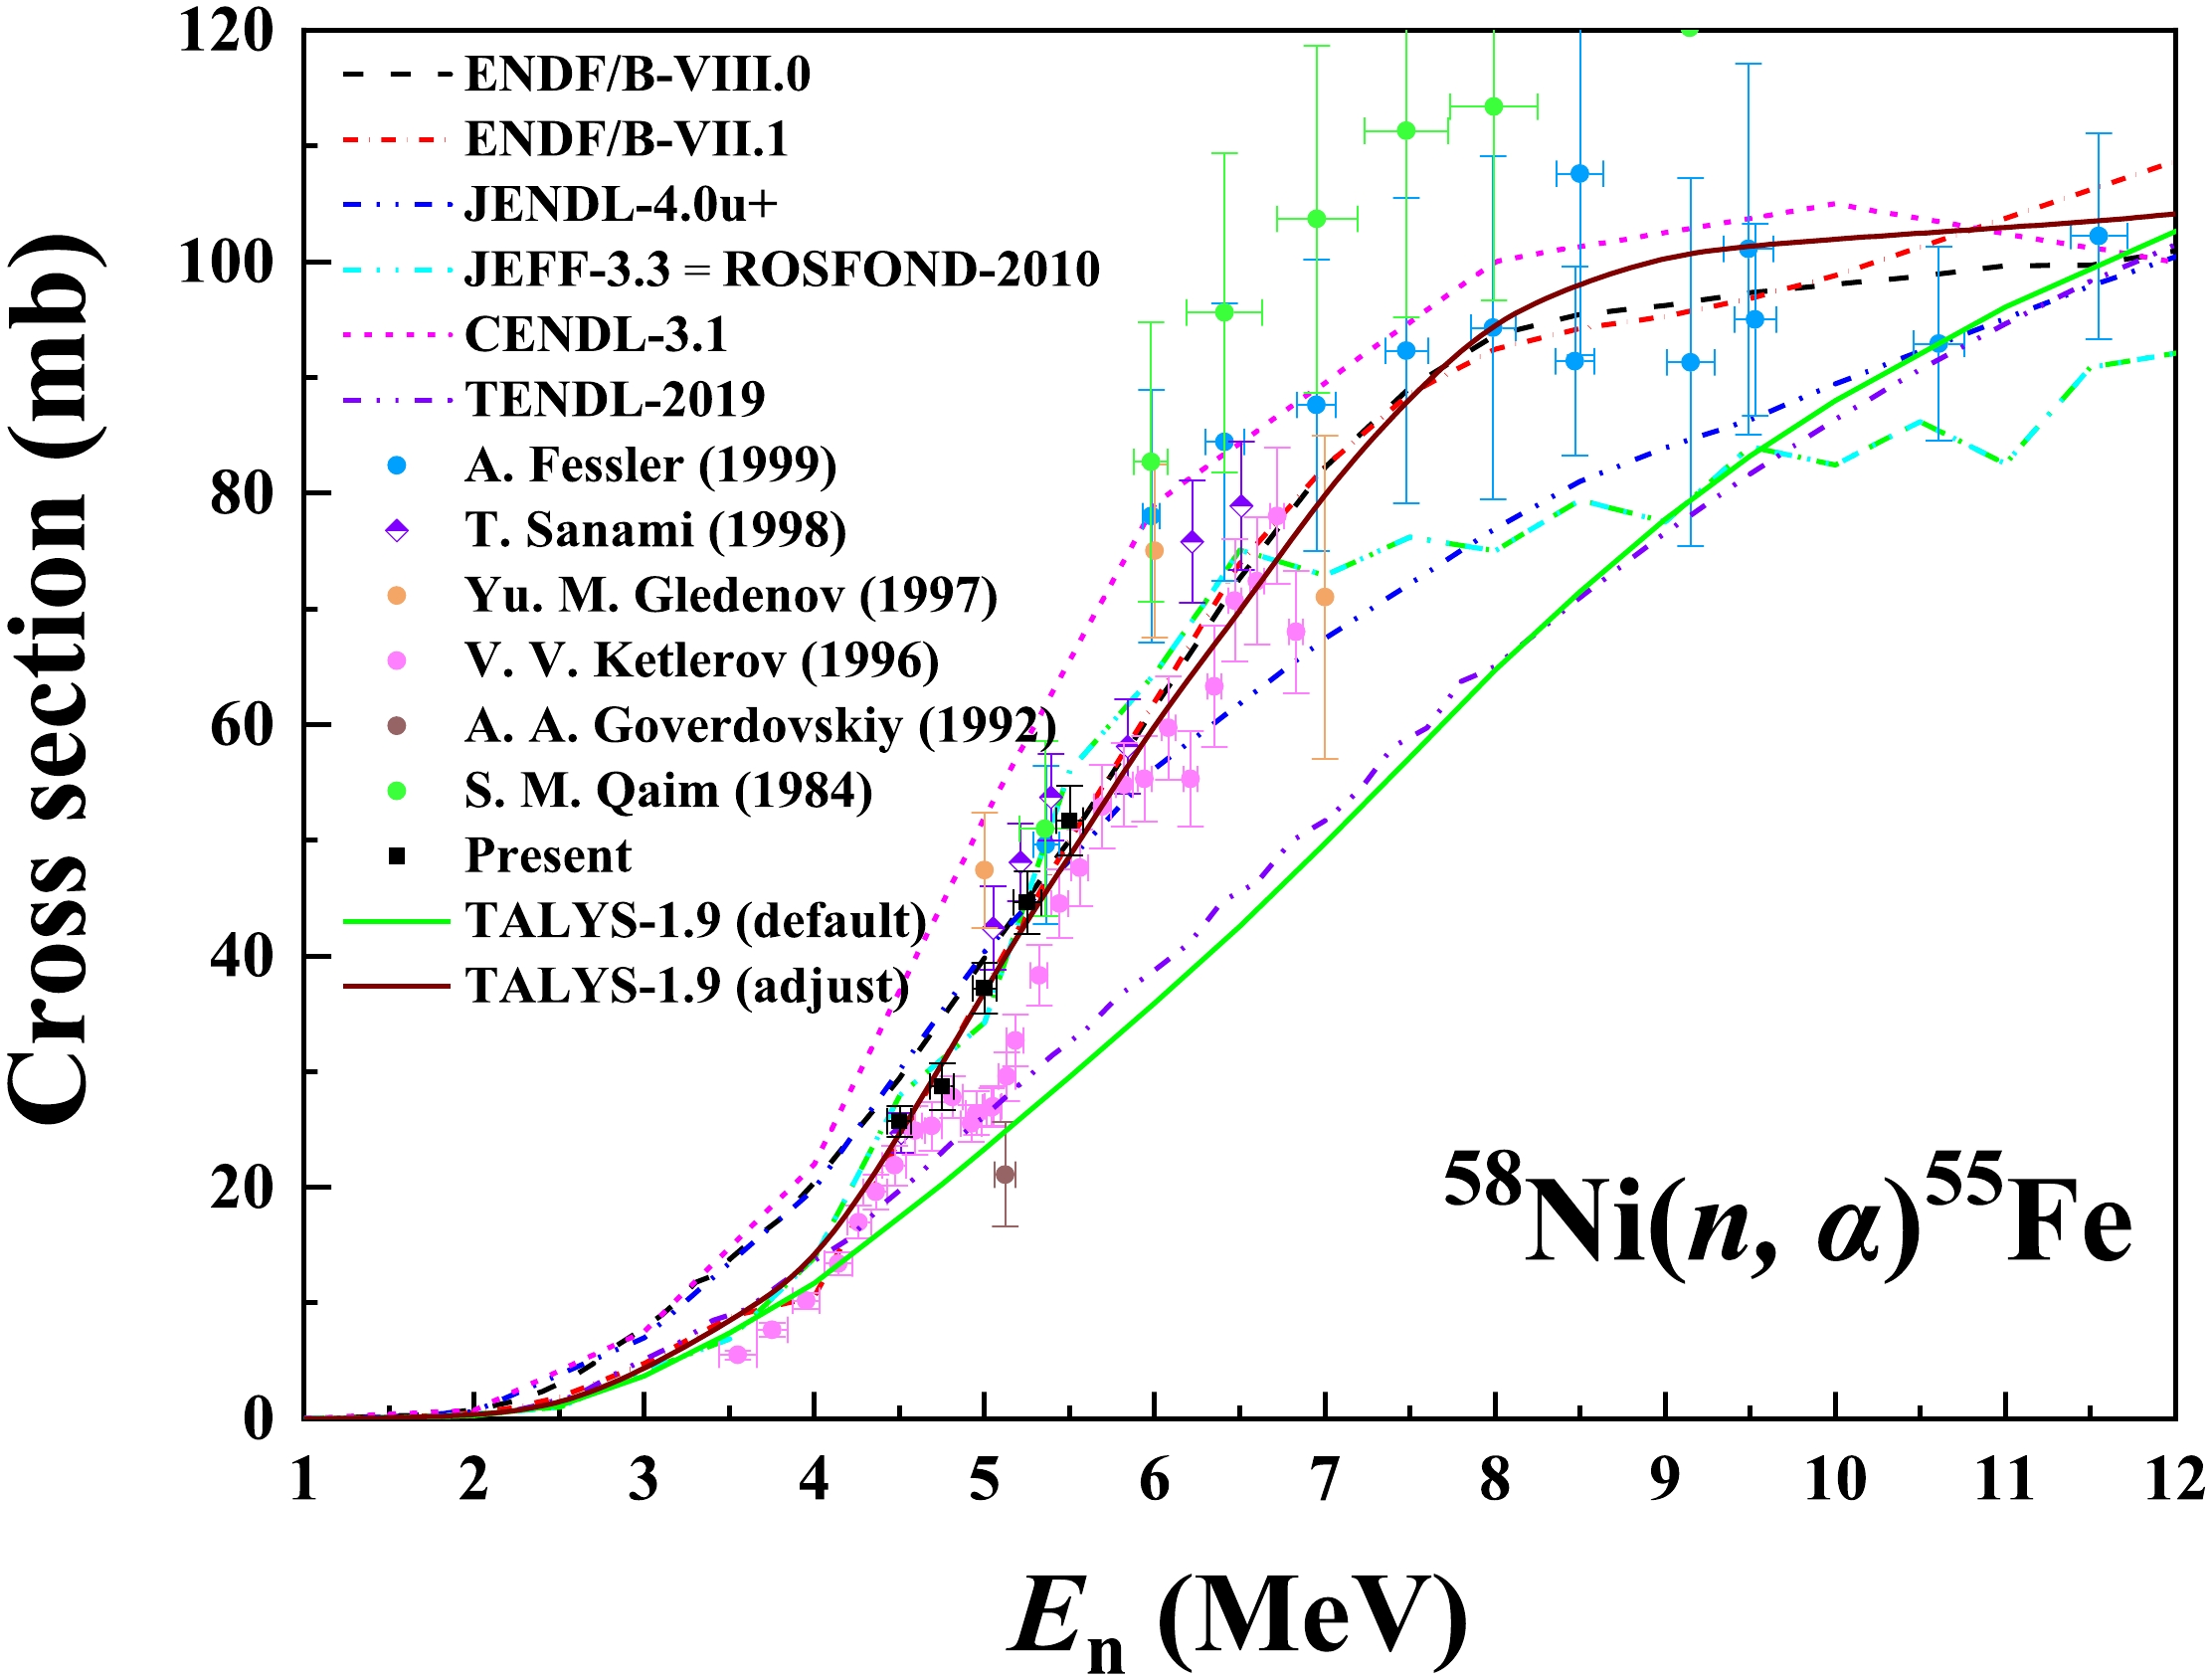
1) For the 58Ni(n, α)55Fe reaction, the present cross sections in the 4.50 MeV ≤ En ≤ 5.50 MeV region agree well with the measurement data of Fessler (1999, 5.36 – 19.4 MeV) [7], T. Sanami (1998, 4.51 – 6.51 MeV) [2], S. M. Qaim (1984, 5.36 – 9.49 MeV) [3], and the ENDF/B-VII.1 evaluation [10]. Besides, the excitation function calculated using TALYS-1.9 with the adjusted parameters also accords with the ENDF/B-VII.1 evaluation [10].
The present cross sections are 21.6% lower than those in the measurement data of Gledenov (1997, 5.00 – 7.00 MeV) [6] and 79.1% higher than those of Goverdovskiy (1992, 5.12 MeV) [4] in the 4.50 MeV ≤ En ≤ 5.50 MeV region. Compared with other measurement data in this neutron energy region, the Gledenov [6] and Goverdovskiy [4] results respectively have the highest and the lowest values. Uncertainties in their results are greater than 10%, while those in the present results are less than 7%. The V. V. Ketlerov (1996, 3.55 – 6.83 MeV) [5] measurement data suggest that the excitation function has a “valley structure” around En = 4.92 MeV. However, the present results and none of the evaluations show this structure [9 - 14, 30].
2) For the 60Ni(n, α)57Fe reaction, there is only one measurement (Khromyleva (2018, 6.00 – 7.15 MeV) [16] in the MeV region, which consistent with our measurement results. The present cross sections agree well with the data from the JEFF-3.3 (= ROSFOND-2010) library [12, 13]. The excitation function calculated using TALYS-1.9 with the adjusted parameters accords with both measurements and the JEFF-3.3 (= ROSFOND-2010) library [12, 13].
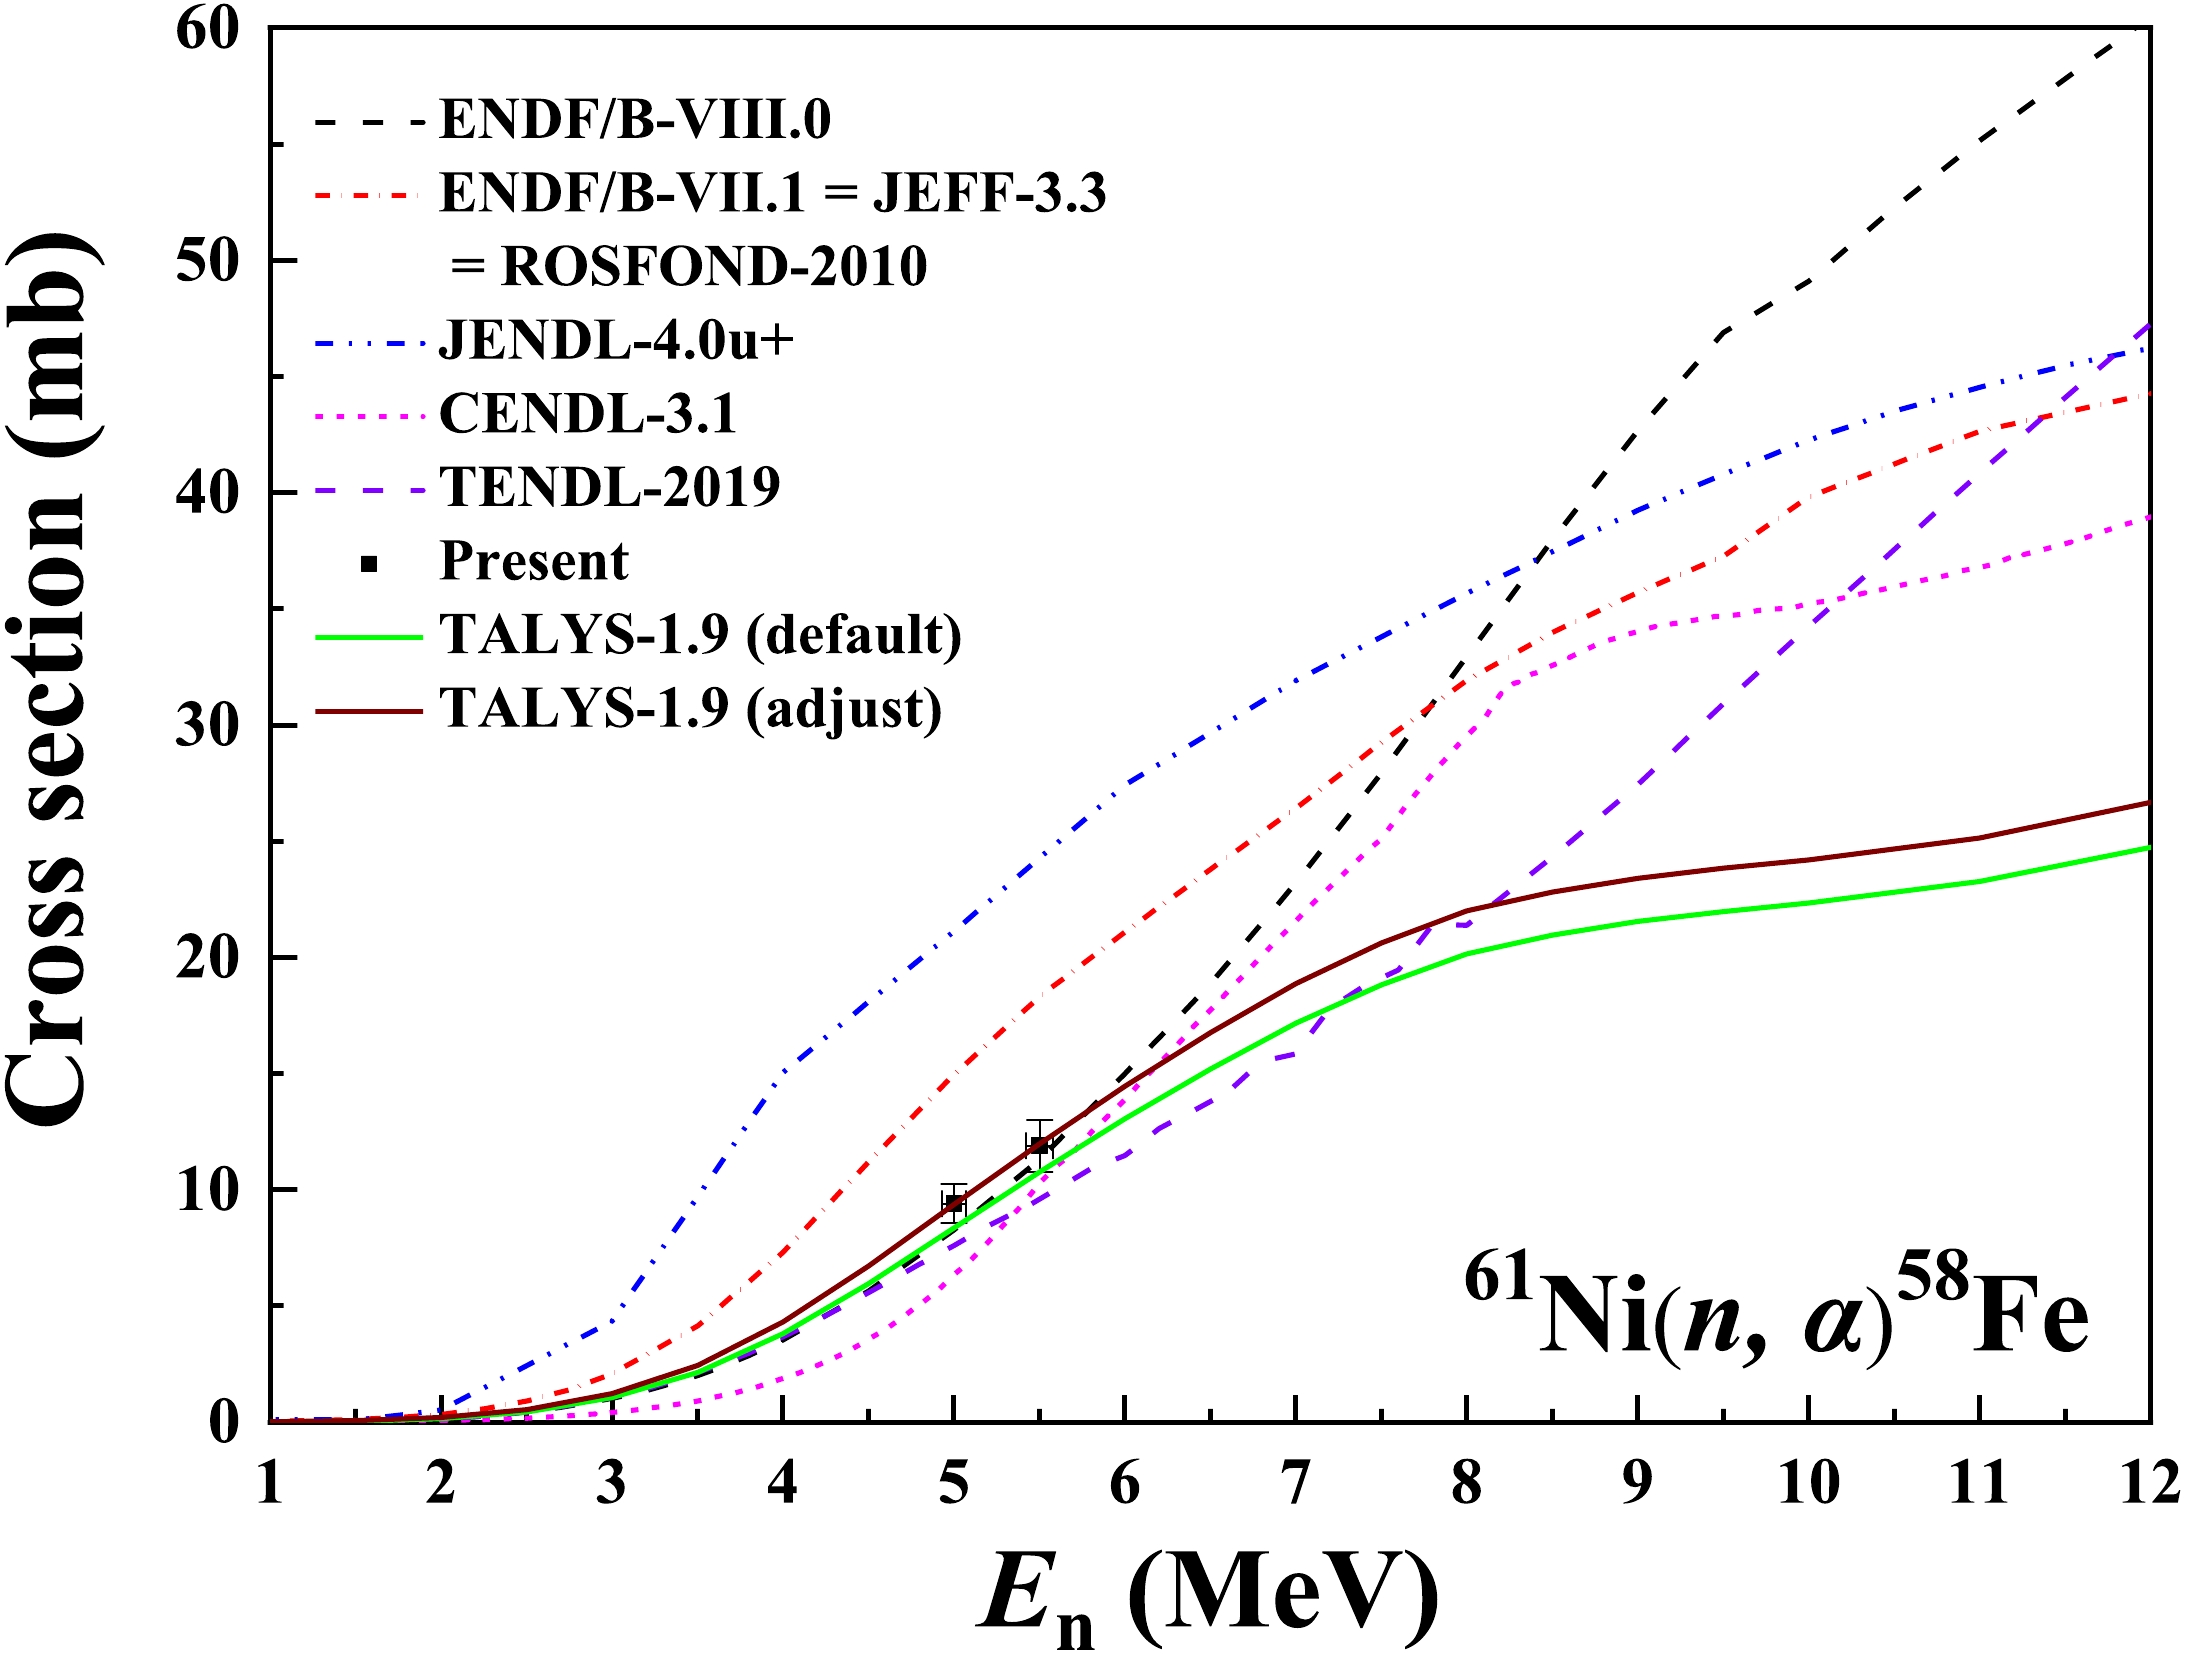
3) For the 61Ni(n, α)58Fe reaction, there is no measurement in the MeV region and there is a significant deviation among different evaluations. Compared with various other evaluations, the present results better agree with the ENDF/B-VIII.0 library [9]. The excitation function calculated using TALYS-1.9 with the adjusted parameters is close to the ENDF/B-VIII.0 library for En < 6.0 MeV [9] and the TENDL-2019 library for En > 6.0 MeV [30].
As presented in Tables 4, 5, and 6 the nearly symmetrical distributions for the forward and backward directions of the outgoing alpha-particles mean that the compound mechanism is predominant for the 58Ni(n, α)55Fe and 61Ni(n, α)58Fe reactions. However, in the case of the 60Ni(n, α)57Fe reaction, a slight non-statistical effect may be available.
En/MeV cross section /mb forward/backward ratio measurement calculation measurement calculation 5.00 ± 0.07 4.22 ± 0.63 4.03 1.31 ± 0.31 1.06 5.50 ± 0.08 7.87 ± 1.09 8.10 1.32 ± 0.27 1.05 Table 5. Measured 60Ni(n, α)57Fe cross sections and forward/backward ratios in the laboratory reference system compared with TALYS-1.9 calculations using the adjusted input parameters.
-
Above the En = 5.50 MeV region, the cross sections of the 58Ni(n, α)55Fe, 60Ni(n, α)57Fe, and 61Ni(n, α)58Fe reactions noticeably grow correspondingly with the increase in neutron energy. The cross sections of the three reactions in the 8.50 MeV ≤ En ≤ 10.50 MeV region are approximately 2 – 10 times larger than those in the 4.50 MeV ≤ En ≤ 5.50 MeV region [9]. However, in the 8.50 MeV ≤ En ≤ 10.50 MeV region, the existing measurement data for the 58Ni(n, α)55Fe reactions are scarce, and there is no measurement for the 60Ni(n, α)57Fe and 61Ni(n, α)58Fe reactions [8]. Further, there are significant discrepancies among different evaluations in this neutron energy region [9]. Taking these factors into consideration, measurements of the cross sections of the three reactions are planned in the 8.50 MeV ≤ En ≤ 10.50 MeV region based on the HI-13 tandem accelerator of the China Institute of Atomic Energy (CIAE).
-
In the present work, the cross sections of the 58Ni(n, α)55Fe, 60Ni(n, α)57Fe, and 61Ni(n, α)58Fe reactions were measured in the 4.50 – 5.50 MeV neutron-energy region using the 4.5-MV Van de Graaff accelerator, GIC detector, enriched nickel isotopic foil samples, 238U3O8 samples, and the EJ-309 liquid scintillator detector. The present data of the 58Ni(n, α)55Fe reaction are consistent with the data of most measurements and the ENDF/B-VII.1 evaluation [8, 10]. The present data of the 60Ni(n, α)57Fe reaction are the first measurement results below 6.0 MeV, and those of the 61Ni(n, α)58Fe reactions are the first measurement results in the MeV region. The results calculated using TALYS-1.9 with the parameters adjusted agree well with the present data. These results would contribute significantly to clarifying the deviations and discrepancies among the measurements and evaluations to date.
The authors are indebted to the operations crew of the 4.5-MV Van de Graaff accelerator at Peking University. Dr. Qiwen Fan from the China Institute of Atomic Energy is acknowledged and thanked for preparing the 58Ni, 60Ni, and 61Ni samples.
Cross-section measurements for 58,60,61Ni(n, α)55,57,58Fe reactions in the 4.50 – 5.50 MeV neutron energy region
- Received Date: 2020-06-05
- Available Online: 2020-11-01
Abstract: The cross sections at 5 energy points of the 58Ni(n, α)55Fe reaction were measured in the 4.50 MeV ≤ En ≤ 5.50 MeV region while those for the 60Ni(n, α)57Fe and 61Ni(n, α)58Fe reactions were measured at En = 5.00 and 5.50 MeV using the 4.5 MV Van de Graaff accelerator at Peking University. A gridded twin ionization chamber (GIC) was used as the detector, and enriched 58Ni, 60Ni, and 61Ni foil samples were prepared and mounted at the sample changer of the GIC. Three highly enriched 238U3O8 samples inside the GIC were used to determine the relative and absolute neutron fluxes. The neutron energy spectra were obtained through unfolding the pulse height spectra measured by the EJ-309 liquid scintillator. The interference from the low-energy neutrons and impurities in the samples has been corrected. The present data of the 60Ni(n, α)57Fe reaction are the first measurement results below 6.0 MeV, and those of the 61Ni(n, α)58Fe reactions are the first measurement results in the MeV region. The present results have been compared with existing measurements, evaluations, and TALYS-1.9 calculations.


 DownLoad: