


 Abstract
 HTML
HTML Reference
 Related
 PDF
PDF


-
In the fields of astrophysics and nuclear physics, it is important to observe some transient processes which indicate important physical information. Accurate observation of the pulse arrival time of a pulsar is expected to be used to monitor and modify the long-term frequency stability of atomic clocks [1]. The neutron time spectrum of nuclear fusion indicates the nuclear reaction process [2]. The processes of solar flares erupting [3] and nuclear explosions [4] are all transient, with the total number of neutrons increasing at the beginning and then decreasing.
In recent years, pulsed radiation sources have become very important in the defense and nuclear energy industries because they can produce high intensity radiation particles in a short time [5, 6]. The output of those devices is discontinuous when operated in pulsed mode or at relatively long intervals [7]. Typical examples are pulsed accelerator neutron sources [8, 9], Tokamak devices [10], and spallation neutron sources [11-13]. As is well-known, the energy spectrum and number of neutrons produced by fusion reactions can be used to characterize the temperature and the total amount of reaction products [14, 15]. The pulsed neutron flux [16], energy spectrum [17, 18] and time structure [19, 20] are the most important parameters in measuring a pulsed neutron process.
Traditionally, two modes are used in observation: counting mode and current mode [1]. The main characteristics and the equivalent circuit diagrams of these two modes are given in Table 1. In counting mode, the amplitude of a signal pulse is proportional to the charge generated in the detector, which means this method is suitable for pulse amplitude spectra indicating the total energy measurement [21, 22]. Because the response time of the measuring device is usually longer than the interval time of the particle pulse, the loop current I(t) is the average of the interaction effect between the particle flux and the detector [23]. The current output is proportional to the energy deposited in the detector by the particles. For the detection of single-energy particles, the total deposition energy is directly proportional to the number of particles. Therefore, the particle intensity can be characterized by the output current [24, 25].
counting mode current mode Equivalent circuit Output category Voltage Current Output size ${V_{\max }} = Q/C$ 

${I_0} = rQ = r\frac{E}{W}q$ 

Typical applications Energy spectrum measurement Time spectrum measurement Measurement object Single particle Particle flux Output characteristic Output is proportional to the deposition energy Output is proportional to the number of particles
and the energy of particlesLimitations Dead time, low counting rate (≤106 s−1) Single particle information lost In counting mode, R is the equivalent resistance of the measuring circuit, C is the equivalent capacitance, V(t) is the output signal of the detector, and Q is the charge generated by a single particle in the detector. In current mode, r is the event rate, Q=Eq/W is the amount of charge produced by particles interacting with the detector, E is the deposition energy, W is the mean ionization energy, and q is 1.60×10⁻¹⁹ C. Table 1. Main features of counting mode and current mode.
For the beginning and end stages of a high-intensity pulse, such as fusion ignition of a Tokamak, these phases often reflect important physical processes, so their flux measurement is very important [26]. If current-mode detectors are used directly, the results of these phases cannot meet the statistics requirements due to the small number of particles in the instantaneous measurement, and only the peak phases can meet the statistical requirements. In order to obtain an accurate neutron signal and reduce the uncertainty from accompanying γ rays, it is necessary to discriminate neutrons from γ rays. Current mode cannot address this measurement. If counting mode is used, the detection efficiency cannot be high, otherwise the counting channel will be blocked. For a pulsed field with a short pulse duration whose process is irreversible, the number of particles entering the detector is low, and the results are insufficient to meet the necessary statistical precision. The traditional counting mode and current mode therefore both have disadvantages. For the scenario when the neutron intensity is between the steady-state radiation field and the high-intensity pulsed radiation field, it is no longer appropriate to use these methods.
In order to solve the measurement dilemmas of the above two methods, the current-mode-counting method was proposed [27, 28]. The current-mode-counting method is a detector operation mode in which the detection system is formed by a current-mode detector and a high-bandwidth current amplifier, and an independent current waveform is measured for each particle. Since a single particle corresponds to an independent current waveform, the arrival time, energy and type of the incident particles can be obtained simultaneously. The waveform width is determined by the detector. The response time for a single particle is of the order of nanoseconds or picoseconds when fast-response detectors are used. This method can improve the effective counting rate compared with the counting mode.
-
For a steady-state radiation field, such as the radiation field produced by an isotope source, the measurement within a short time can be described by a Poisson process, and the decay constant λ is used to represent the number of particles emitted per unit time [1]. Similarly, the number of signals in the detector generated by the pulsed source in a very short time window can be regarded as the result of one Poisson sampling, and the short time window can be represented by [ti-0.5△T, ti+0.5△T](△T→0). For different time windows, the measurement process is independent. Let the independent incremental process be represented by {Y(t), t≥0}. If there is a function λ(t) and two random moments s, t (s<t), and {Y(t), t≥0} obeys the Poisson distribution with the representation
$\int_s^t {\lambda \left( u \right)} {\rm{d}}u,$

(1) then {Y(t), t≥0} is called a non-homogeneous Poisson process (NHPP) with the parameter λ(t) [29].
By setting the time spectrum of the pulsed neutron source as y(t), which represents the number of neutrons emitted per unit time, then the total number of neutrons is represented by
$Y\left( t \right){\rm{ = }}\int_0^t {y(t)} {\rm d}t.$

(2) When η represents the absolute detection efficiency (the ratio of the absolute signal number produced in the detector to the number of neutrons emitted from the pulsed source), then the actual time spectrum of neutrons interacting with the detector can be described by
${y_1}(t){\rm{ = }}\eta y(t).$

(3) Let f(GHz) be the sampling frequency of the detection system. In the time window close to the occurrence of ti with a width of △T, the detection process takes y1(t) as the parameter for Poisson sampling, and the theoretical number of particles observed is
${N_1}\left( {{t_i}} \right){\rm{ = }}\int_{{t_i} - 0.5\Delta T}^{{t_i} + 0.5\Delta T} {{y_1}(t)} {\rm d}t{\rm{ = }}\int_{{t_i} - 0.5\Delta T}^{{t_i} + 0.5\Delta T} {\eta y(t)} {\rm d}t.$

(4) For the detection process of recording the neutrons, each time window is independent. Therefore, N1(t) can be regarded as a sampling of the NHPP in the duration T of the pulsed radiation field. The value of N1(ti) is determined by the width of the observing window△T, the intensity of the time spectrum y(ti), and the absolute detection efficiency η. When the neutron arrives, it produces an impulse function δ(t) (whose amplitude equals 1). The total number in each △T is limited to less than or equal to 1 by improving the sampling frequency and controlling the detection efficiency. When the particles enter the detector, an impulse sequence combined with multiple impulses is obtained. The function g (y, f, η) is defined as the above non-homogeneous Poisson sampling process. Using that definition, the above process can be expressed as
$ y(t)\xrightarrow[\eta ]{f} \boxed g\to x(t). $

(5) The function x(t) is used to represent the impulse sequence (whose value is either 0 or 1) formed by the above process. Obviously, near a certain moment, the denser value 1 is, the stronger the pulsed source is. The response function of the detector to the single particle is denoted by h(t). After a neutron enters the detector at ti, the detector responds to the δ(ti) with an independent current waveform. After the particle flux enters the detector, the detector output can be expressed as
$F(t) = g\left( {y(t),f,\eta } \right)*h(t),$

(6) where the symbol “ * ” represents a convolution.
In the current-mode-counting method, a pulsed radiation field measurement uses the characteristic parameter y(t) from the measured result F(t). The original information y(t) of the pulsed neutron radiation field is reconstructed based on the reverse process of the above model, as shown in the simulation verification and experimental verification.
-
The output of the pulse radiation field in the detector can be simulated based on the NHPP simulation method. The current-mode-counting mode was verified by using the above ideas after the detector output was simulated. Non-homogeneous Poisson sampling results were obtained by using Poisson process thinning [30]. The single particle impulse signal was converted into a detector output according to the response function described by Eq. (6).
The simulation process is represented by Figs. 1 and 2. First, one sets the time spectrum as y(t), which represents the number of neutrons emitted from the pulsed radiation source per unit time. It is also the intensity function of the NHPP. Then, the absolute detection efficiency η is introduced and the response time spectrum y1(t) of the detector obtained, which represents the number of neutrons reacting with the detector. The measured impulse sequence x(t) is then obtained based on Poisson process thinning. The amplitude 1 indicates that a neutron entered the detector and produced a signal output at that moment.
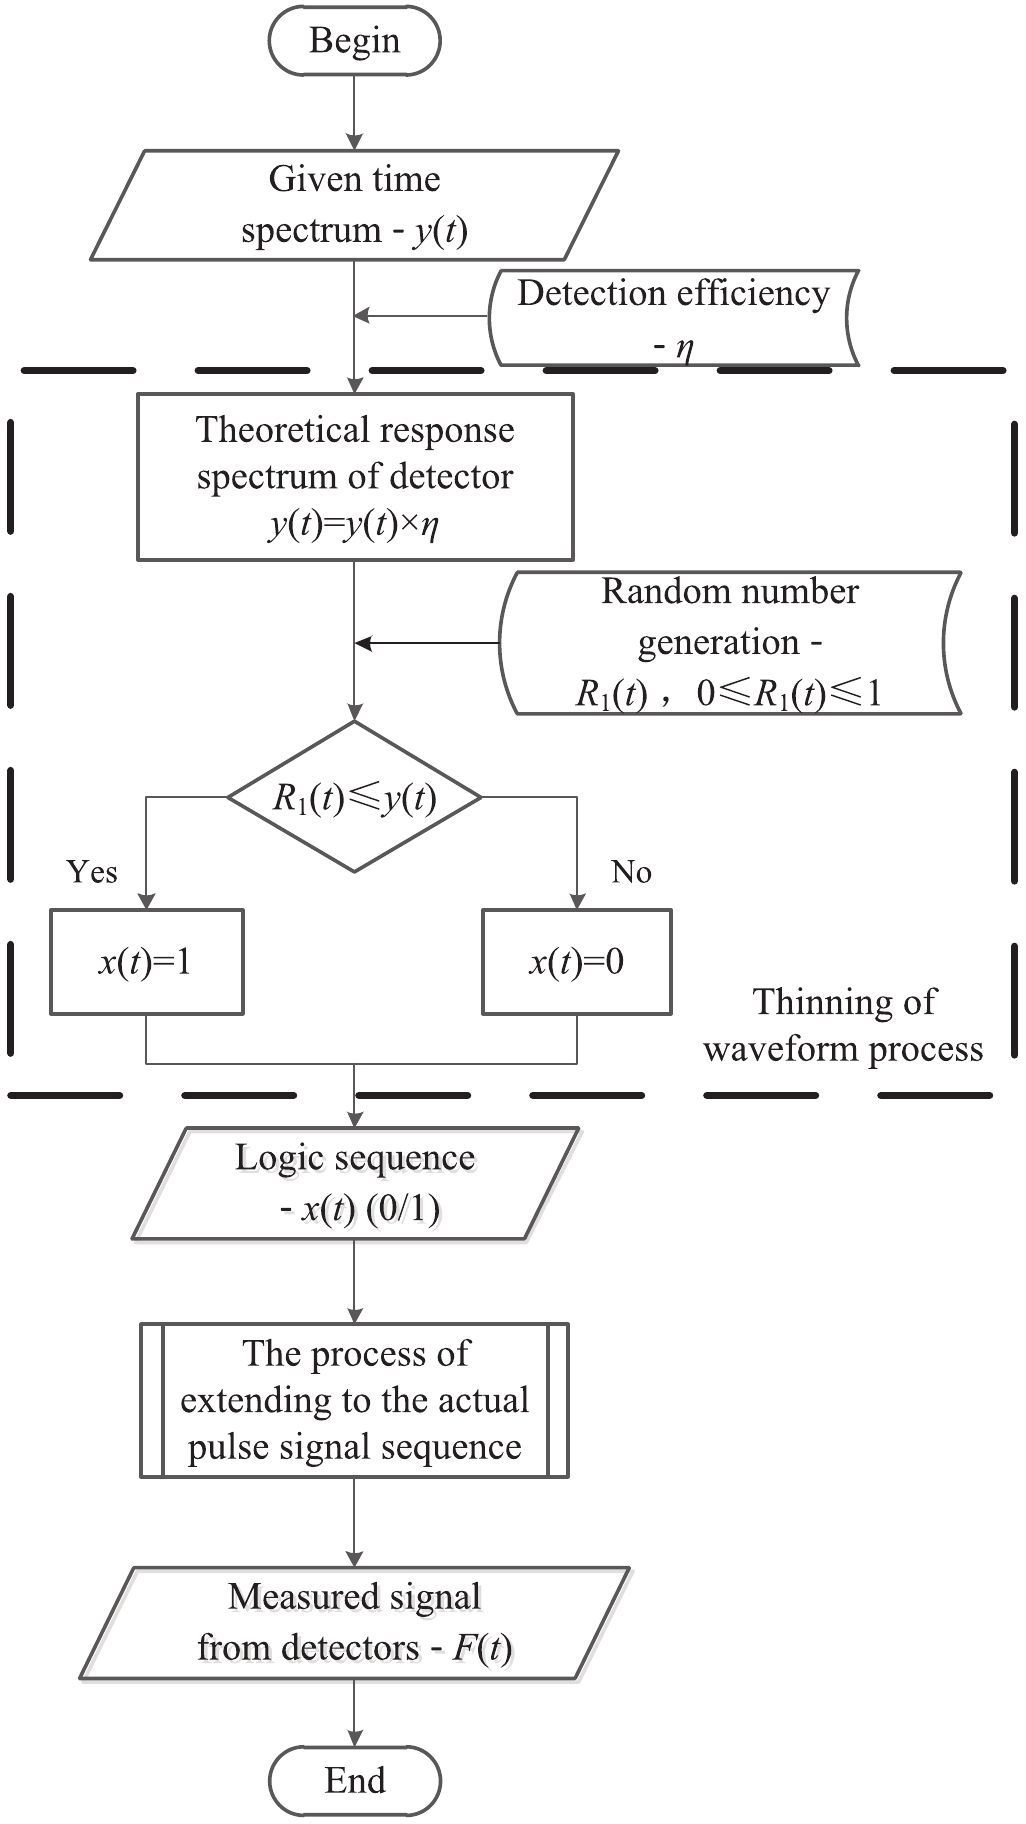
Figure 1. Flow diagram of the simulation of pulsed radiation field impact detectors.
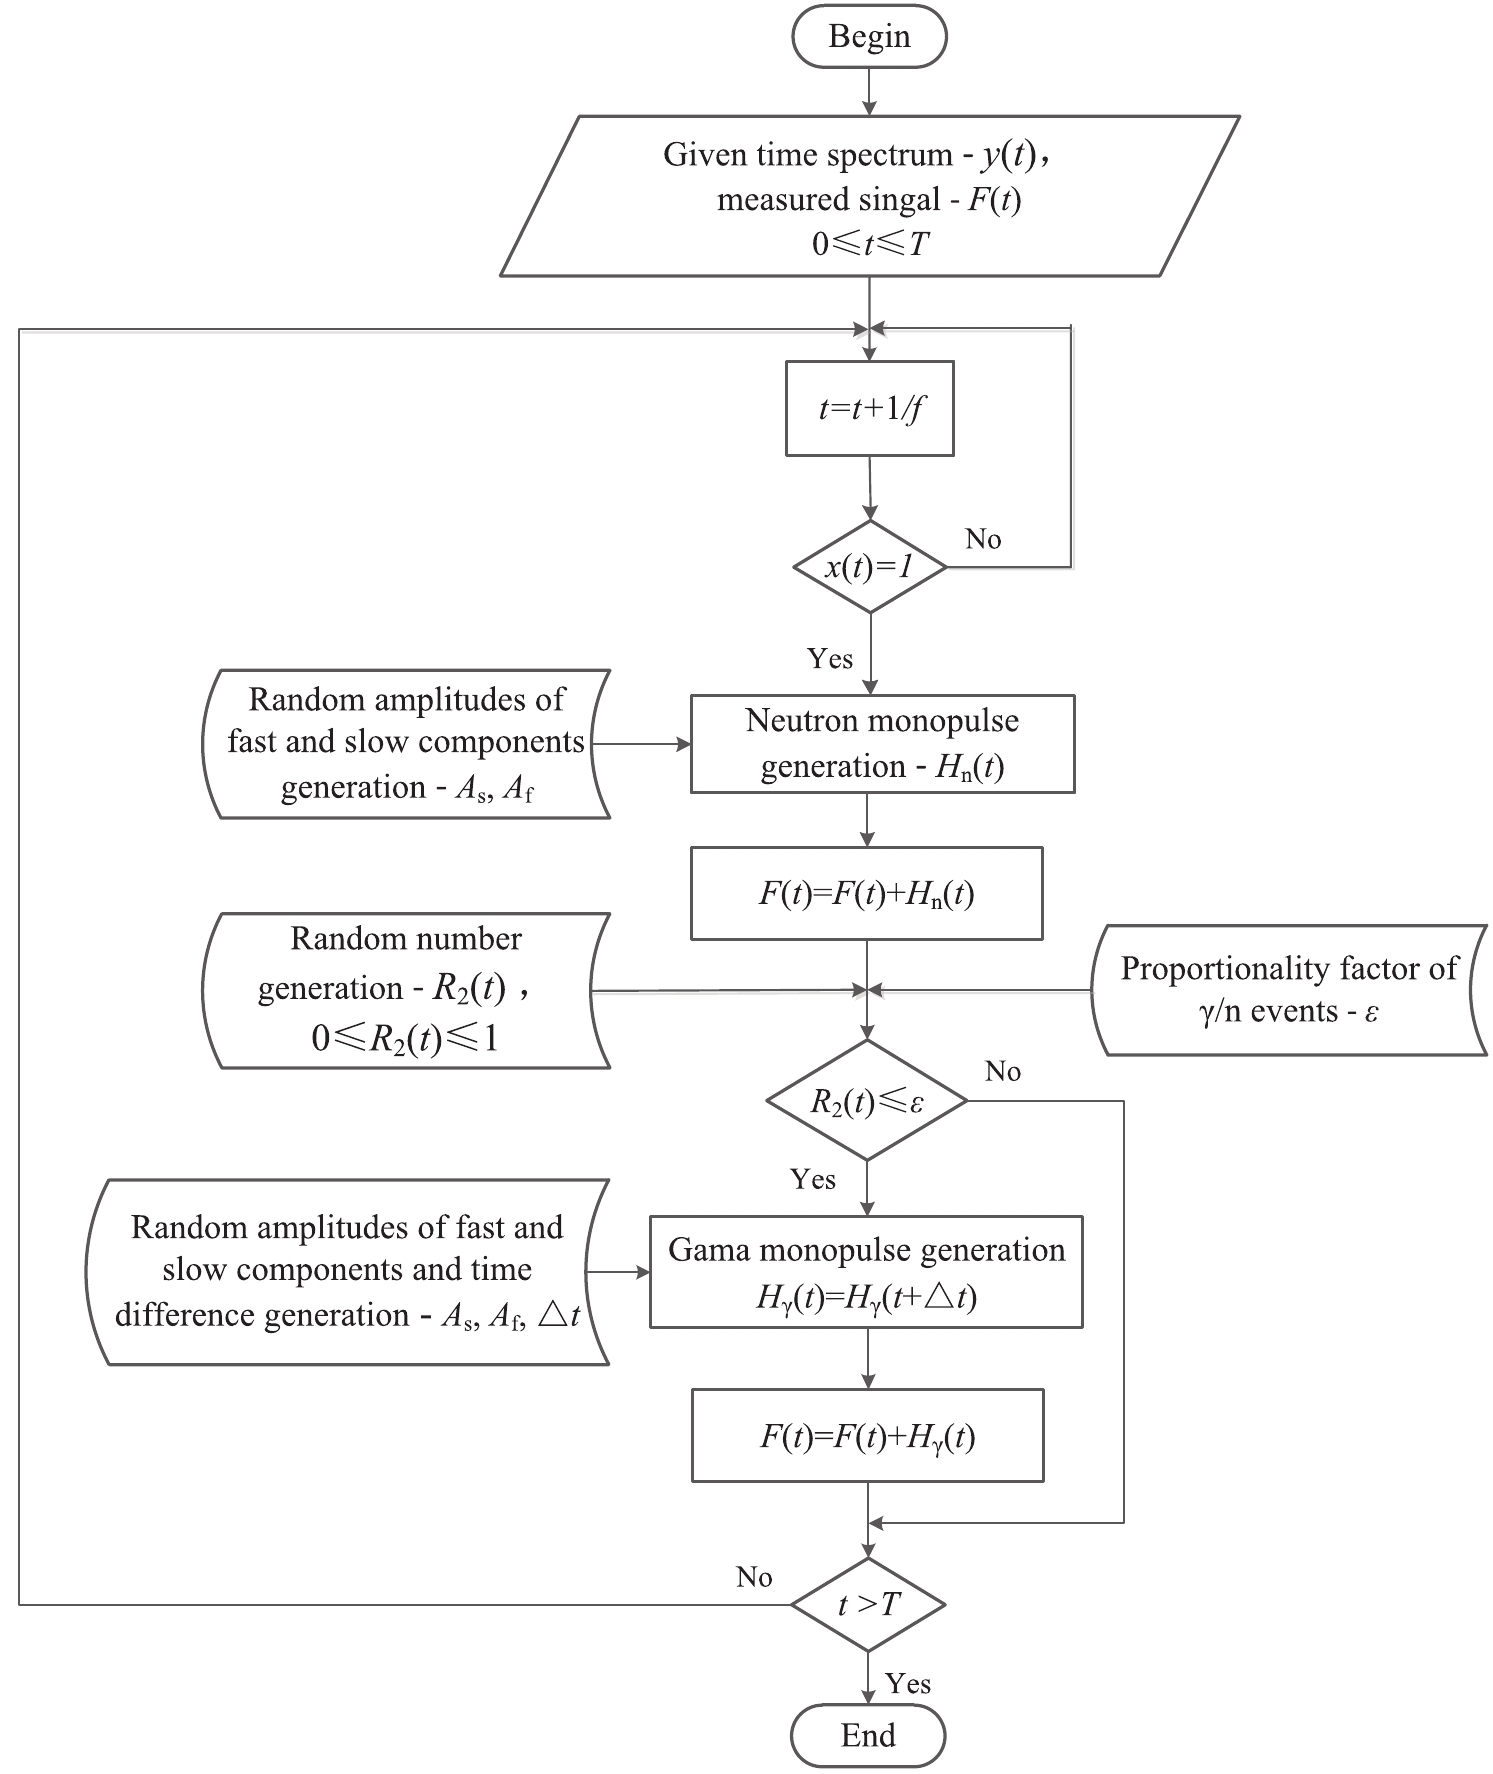
Figure 2. Flow diagram of detector response to the shock sequence x(t).
In this paper, the given time spectrum of the pulsed neutron source is described by Eq. (7):
$y = A \times {{\rm e}^{\textstyle - \frac{{{{\left( {t - {t_c}} \right)}^2}}}{{2 \times {\sigma ^2}}}}}.$

(7) The time spectrum is Gaussian, the sampling duration is T = 20 μs, the peak appears at tc = 8 μs, full width at half maximum (FWHM) is 2.94 μs and this pulsed source produces a total of 2.5 ×10⁷ neutrons.
The neutron single particle pulse amplitude is defined according to the neutron pulse amplitude distribution function Hn(t). Near the neutron signal, a gamma signal with random amplitude Hγ(t) is generated according to the probability ratio of n/γ (0.2 in used in this paper). The delay time △t of the n/γ peak is also described by a random distribution. After the above process, the output F(t) is obtained and the results of the simulation are shown in Fig. 3. An oscilloscope with high bandwidth and high sampling rate is used as the analog signal acquisition system. The highest sampling rate of the oscilloscope is f =10 GHz. Figure 3 show the simulated output of detectors with absolute detection efficiency of 2 × 10⁻⁶ when the equivalent resistance of the output circuit is 50 Ω.
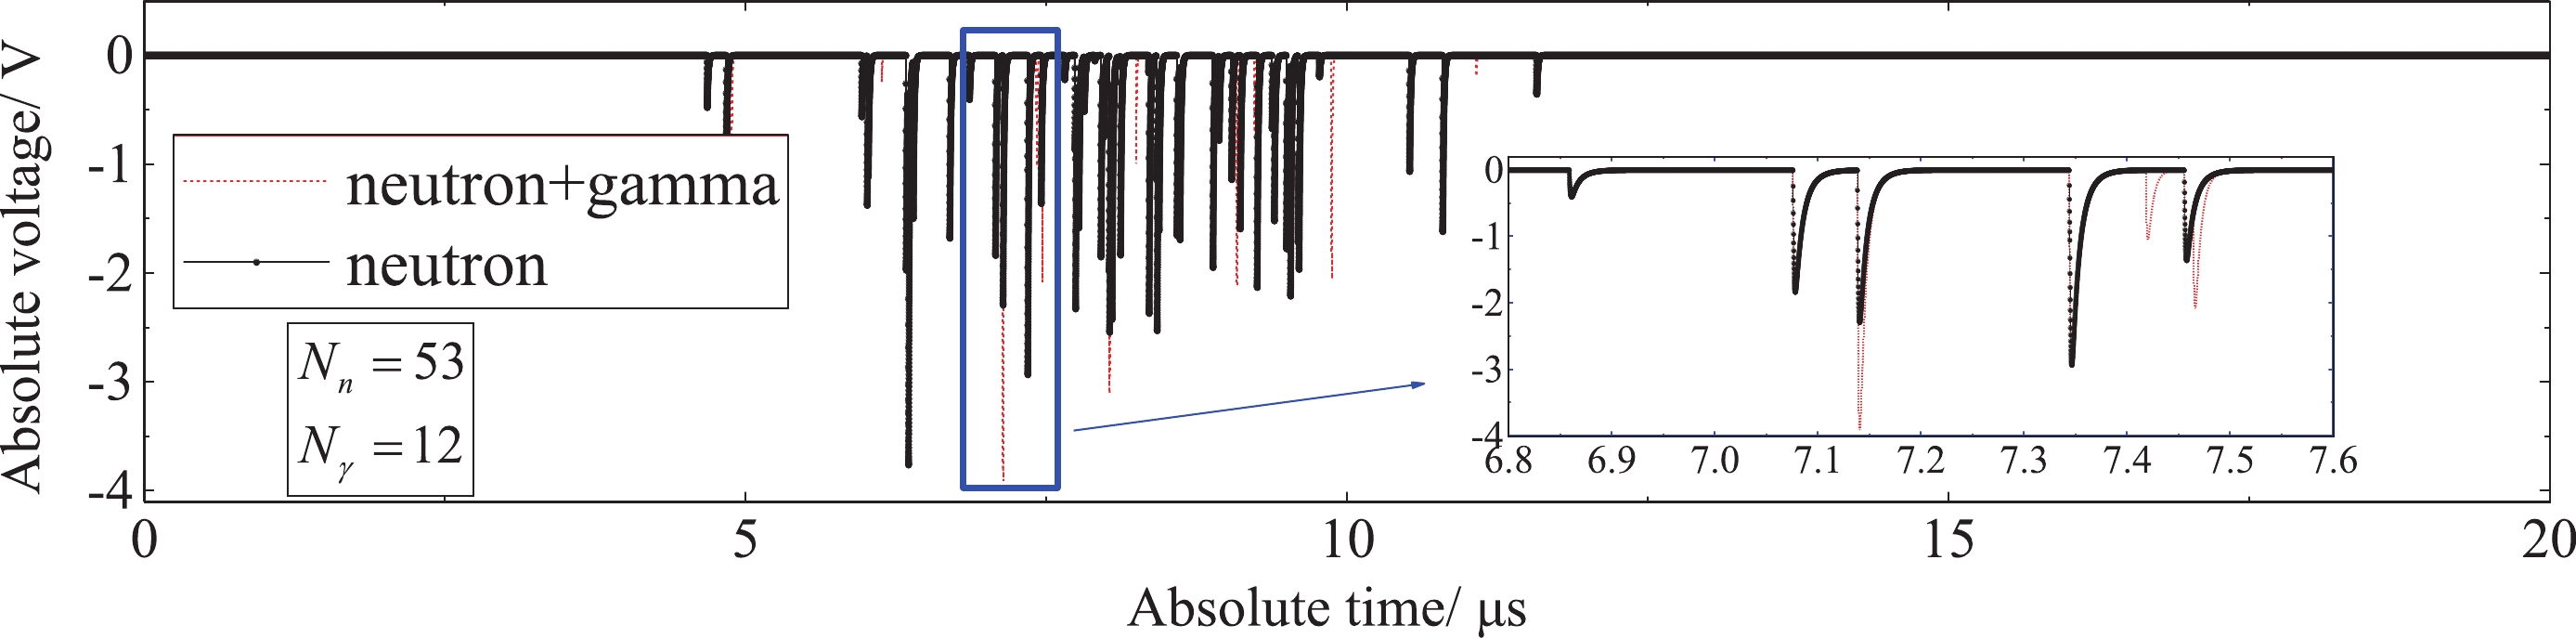
Figure 3. (color online) Simulation detector output obtained by only one detector at detection efficiency of 2×10⁻⁶.
-
According to the model, the time spectrum y(t) can be created with the following steps:
1. Obtaining the particle signal F(t) of pulsed neutron radiation field from the detector array
For a Poisson process, it has been shown mathematically that the mean value of many multiple sampling results is the maximum likelihood estimation of the waveform process parameter λ. The average value of multiple experiments can be obtained by repeated pulse measurements in a repeatable pulse radiation field, such as at the China Spallation Neutron Source (CSNS). If the neutron is produced by an unrepeatable pulse, the signals can be collected by placing multiple detectors.
$ {\tilde y_1}\left( {{t_1}} \right)$ , which estimates y1(t), can be expressed as follows:$ {\tilde y_1}\left( {{t_i}} \right) = \frac{{\displaystyle\sum\limits_1^j {{{\hat y}_{1,j}}} \left( {{t_i}} \right)}}{j} = \frac{{\displaystyle\sum\limits_1^j {{{\hat N}_{1,j}}} \left( {{t_i}} \right)}}{{j\Delta T}}, $

(8) where j is the number of the detectors with an identical detection efficiency or the repetition number of the repeatable pulsed neutron source.
To collect as many particles as possible in a limited time and reduce particle pile-up, the detector’s response time to a single particle should be as short as possible. In addition, the detection system should be able to discriminate neutrons from γ rays. A detection system consisting of stilbene crystals and photomultiplier tubes can be used for experimental measurements based on the current-mode-counting mode. At this step, the output signal F(t) was obtained as shown in Fig. 3.
2. Information acquisition of particle flux based on waveform digitization technology
After accumulating multiple impulses in the time dimension, the output signal is represented as
$ \widehat{F} $ (t). The peak finding, n/γ discrimination, peak height interpretation and peak position identification was carried out by waveform digitization processing. After peak finding for a single particle, the amplitude value and arrival time can be obtained directly and the charge can be obtained by integrating the particle waveform.Theoretically, the impulse of a single particle can be obtained by deconvolution as
$x\left( t \right){\rm{ = }}g\left( {y{\rm{(}}t{\rm{),}}f{\rm{,}}\eta } \right) = {{\mathcal{F}} ^{ - 1}}{\rm{[}}{Y_F}\left( \omega \right){\rm{/}}H\left( \omega \right){\rm{]}},$

(9) where YF(ω) and H(ω) are the frequency domain transformation of F(t) and h(t), and
${{\mathcal{F}} ^{ - 1}}$ is the identifier of deconvolution. However, the pulse amplitudes are random and the deconvolution operation is very complicated. A simple approach is to assign a δ(t) pulse directly at the peak location of a single particle and convert the output signal$ \widehat{F} $ (t) to an impulse sequence,$ \widehat{x} $ (t). At the same time, in the waveform digitization process, the neutron amplitude information is reserved for the calculation of the pulse amplitude spectrum, and the charge information of the neutron is reserved for the calculation of the charge amplitude spectrum. For time spectrum y(t), after this step,$ \widehat{x} $ (t) is as shown in Fig. 4.
Figure 4. (color online) The impulse sequence
$ \widehat{x} $ (t) from F(t) after step (a) in Fig. 3.3. Calculation of characteristic parameters y(t) of pulse radiation field based on a statistical algorithm
There is an amplitude for every △T =1/f (ns) in the impulse sequence
$ \widehat{x} $ (t) as shown in Fig. 4. The result is so discrete that it cannot directly reflect the change of pulse source intensity with time. Therefore, a time spectrum reconstruction algorithm is needed. Two reconstruction algorithms are proposed in this paper. The first is the window-by-window statistics algorithm (WWS) and the second is wavelet packet transformation (WPT).When using the WWS algorithm, a time window with a width is set and represented by the midpoint of the window. The total number of neutrons is counted for each window. Then, a series of points [ti,
$ {\widehat{N}}_{1} $ (ti)] is obtained. In this algorithm, one sets the width of the statistical window as tw, the pulse duration is T, and the step size of each window moving backward is △τ. Then, one lets n0 represent the number of points of the reconstructed time spectrum where n0 = T /△τ. For [ti,$ {\widehat{N}}_{1} $ (ti)], except for the elements in the first statistical window$ t_{\rm{w}}^1$ and the last window$ t_{\rm{w}}^{n_0}$ , each point in other time windows of the intermediate moment is used m (equal to tw /△τ) times in the summation calculation. Therefore, in order to ensure the accuracy of calculation, the value of T should be longer than the pulse duration so that$ {\widehat{N}}_{1} $ (ti) at the beginning and end is zero. Then, the neutron time spectrum observed by the detector is$ \hat{y}_{1}(t)=\frac{\hat{N}_{1}\left(t_{k}\right)}{m \Delta T}. $

(10) The basic principle of the WPT algorithm is that energy is conserved in each wavelet packet transformation [31]. The impulse sequence x(t) is transformed into an energy sequence xx(t) as
$xx(t) = \left\{ {\begin{array}{*{20}{l}} {\begin{array}{*{20}{l}} {\sqrt {x(t)} ,\;\;\;x(t) > 1} \end{array}}\\ {x(t),\;\;\;{\rm{others.}}} \end{array}} \right.$

(11) Energy conservation can be expressed as follows:
$ \int_{ - \infty }^{ + \infty } x {x^2}(t){\rm{d}}t = \frac{1}{{{C_p}}}\int_{ - \infty }^{ + \infty } {{{\left| {W_p^2(\omega )} \right|}^2}} {\rm{d}}\omega, $

(12) where Wp(ω) is the wavelet packet transform coefficient of xx(t), p is the basis function of the wavelet packet transform, and Cp is a constant and equal to one. The basis function, which is close to the single particle waveform, is selected such that the wavelet system of the Daubechies multilayer wavelet packet transformation can be performed. When the decomposition layer number is q, the total number of nodes in this layer is 2q and the number of coefficients corresponding to each node is represented by nq. The ordinate of the time spectrum is obtained by summation of the coefficients squared of the same position at each node. Therefore, the reconstructed time spectrum is composed of nq discrete points.
4. Absolute detection efficiency correction
The absolute detection efficiency η of the detector can be obtained based on Monte Carlo simulation when the emission angle of the pulsed neutron, detector distance, particle energy, crystal type and size and other detection conditions are known. On the other hand, the absolute detection efficiency of a single energy point can be obtained by calibration. The time spectrum of the pulsed radiation source is obtained after
${\hat y_1}(t)$ is divided by the absolute detection efficiency η, and the total number of neutrons$\hat Y$ is obtained by integrating the full spectrum$\hat y(t)$ .Both WWS and WPT algorithms were used in this simulation. The parameters of the WWS algorithm were set to tw = 0.8 μs and △τ = 20 ns. The counting time is 20 μs, n0 = 1000, m = 40. For the WPT algorithm, q = 12, "db3" (the third basis function of the Daubechies series) [32] was used as the basis function, and the time spectrum
${\hat y_1}(t)$ was reconstructed by Eq. (12). A Gaussian fitting tool was used to fit the reconstructed time spectrum of these two algorithms to obtain the parameters in Eq. (7). Comparing the theoretical parameters and simulation results, the maximum error of those characteristic parameters is less than 2.3%, which is the relative error of σ obtained by the WWS algorithm. As shown in Fig. 5, both algorithms can effectively reconstruct the neutron time spectrum. The simulation results show that the current-mode-counting method can be used to effectively measure the pulsed radiation field.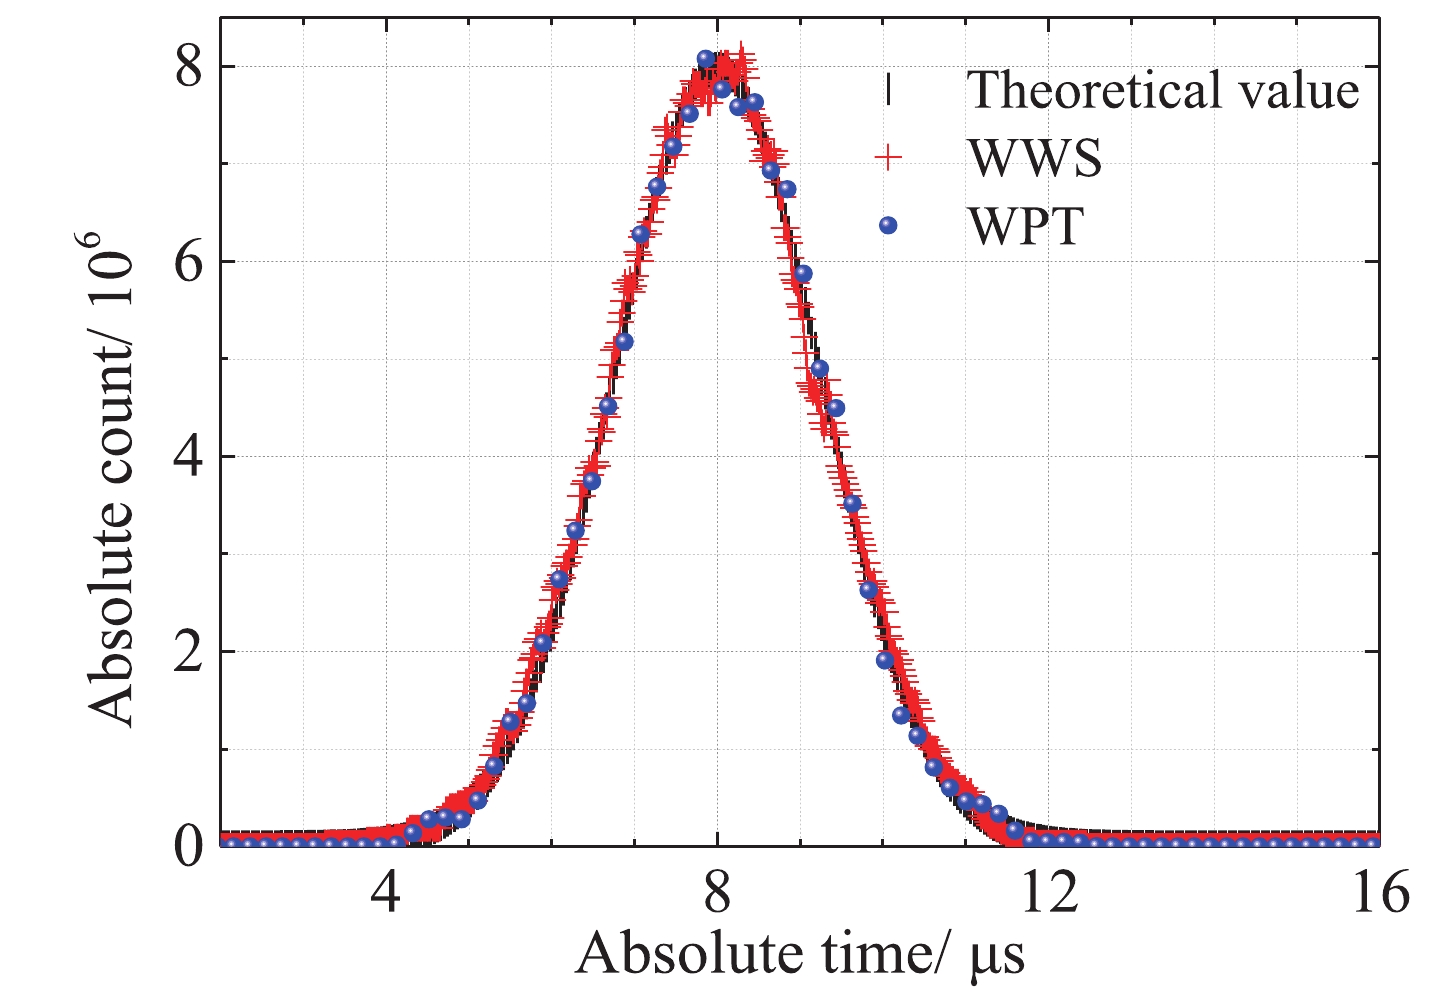
Figure 5. (color online) Comparison of time spectrum obtained by two algorithms, with the theoretical value.
-
At the China Institute of Atomic Energy, the CIAE 600-kV nanosecond-pulse neutron generator (CPNG-6) can work in pulsed mode by using its deuterium ion source [33]. A verification experiment was carried out based on the pulsed neutron radiation field generated by CPNG-6. Neutrons are generated from D-D or D-T nuclear fusion, when the deuterium ion beam bombards a deuterium/tritium target. The ion beam cutter has good stability and can produce a deuterium beam with a width of 5 μs at a frequency of 1 Hz. According to the principles of nuclear reactions, a pulsed neutron beam with a width of 5 μs can be produced.
-
The experimental layout is shown in Fig. 6. A square wave signal was sent to the oscilloscope as an external trigger signal and time base zero point when the ion source cutter opened the door. The detector output and the external trigger signal in the time window between -1 and 9 μs were stored by the oscilloscope. Stilbene crystals were near the entry windows of the photomultipliers (PMTs, model ETL-9815), sealed in stainless steel sleeves to shield them from light and electromagnetic interference. In order to obtain fine signal details, a HDO8108A oscilloscope manufactured by Teledyne LeCroy was used, with a maximum sampling rate of 10 GHz and bandwidth of 12 bits. The detector was placed on the same horizontal plane as the beam channel. In order to prevent the detector from losing the single particle waveform signal when it was saturated at a high flux, the detector was situated a distance D away from the central axis, and a distance L from the target head. In this experiment, a deuterium ion beam was used to bombard the tritium target. It produced a 14.1 MeV monoenergetic neutron beam. More detailed experimental conditions are presented in Section IV.C. After a certain amount of data was accumulated, the information of the pulsed radiation field was reconstructed.
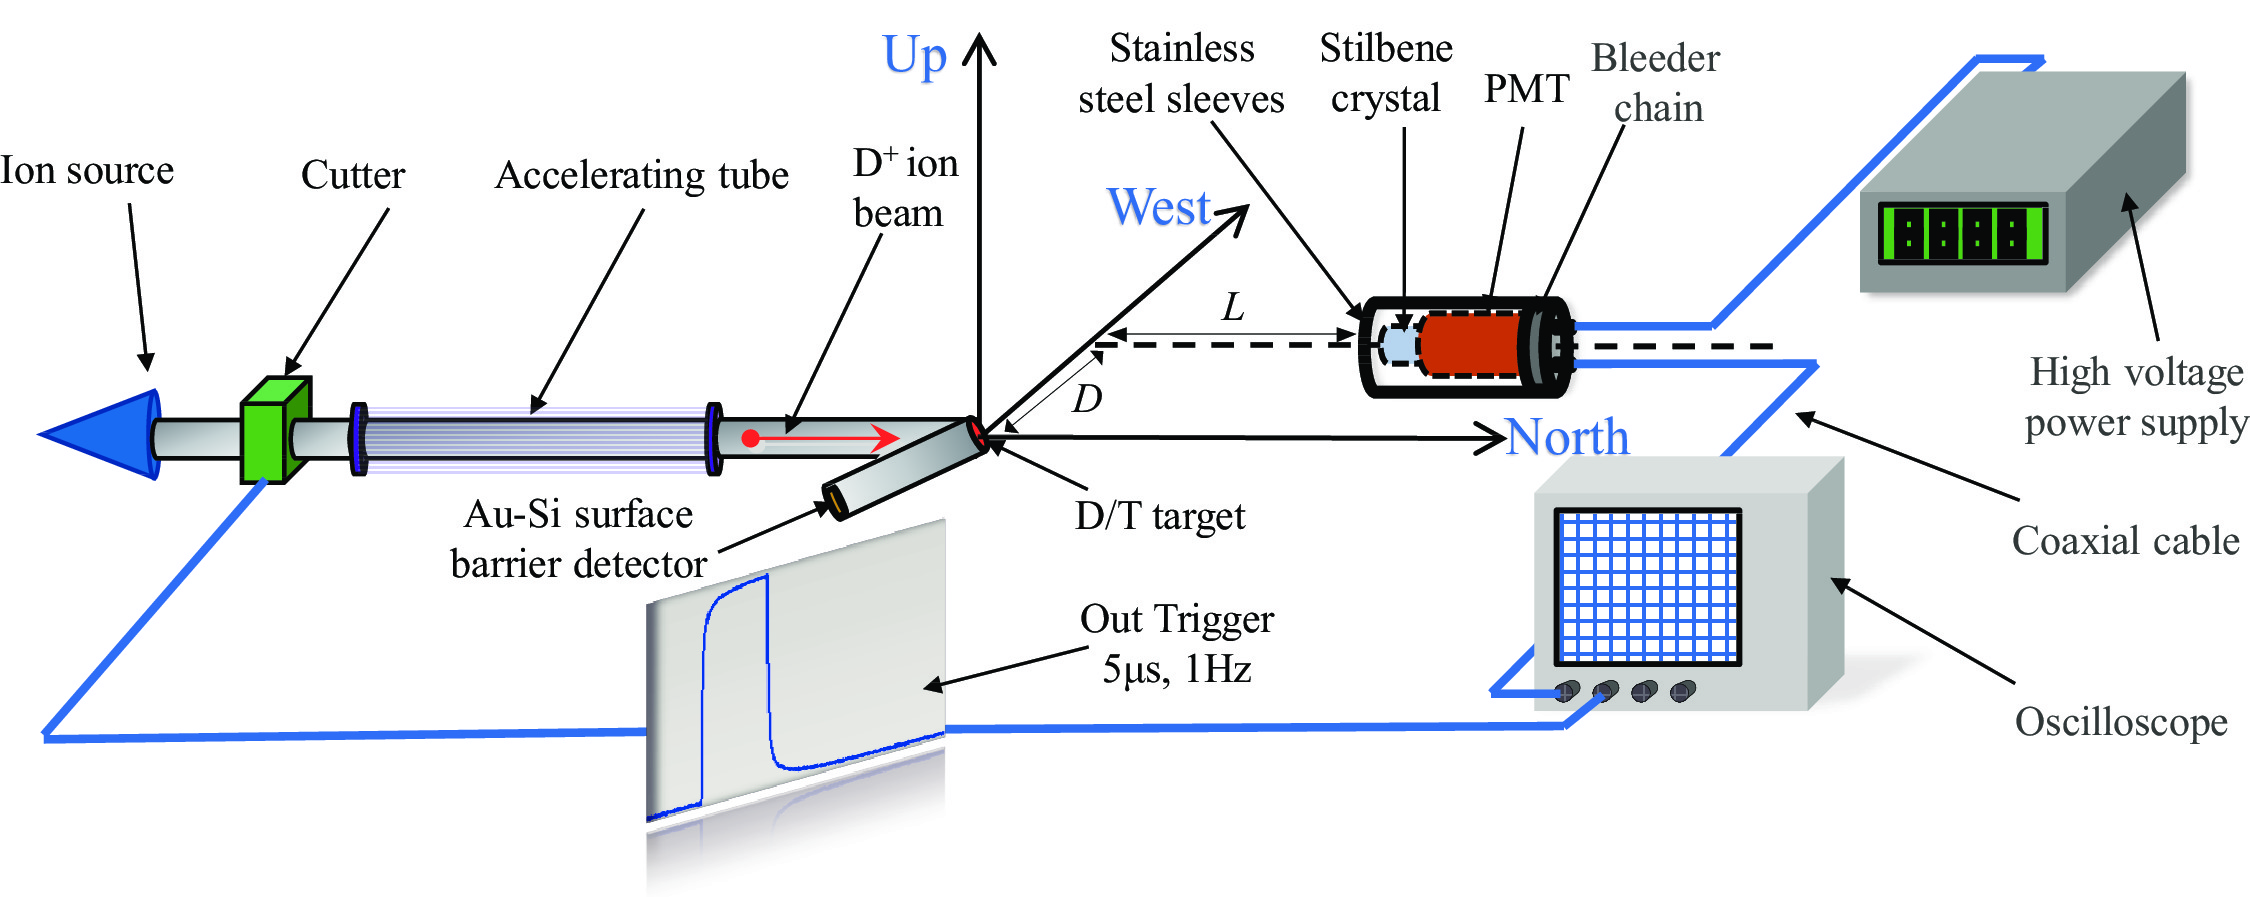
Figure 6. (color online) Experimental layout.
-
1. Neutron / gamma discrimination
The experimental conditions and n/γ discrimination results are listed in Table 2, and the n/γ distribution is shown in Fig. 7. The charge integral method [34] was used for waveform discrimination. For each particle waveform, the integral time was zero at the peak moment. Qtotal was the current integral result from −10 ns to +60 ns, and Qslow the result from +10 ns to +60 ns. The peak-seeking algorithm could not find the second peak in the range of (−10, 60) ns after the first peak was found. The PSD charge distribution graph was obtained after thousands of pulses and the result is shown in Fig. 7. In the process of analysis, only the waveform, voltage and charge of single particles that could be completely separated were counted. The waveforms of the pile-up signals were not counted, and are denoted “pile-up signal”.
Group Detector size/mm2 L/cm D/cm Number of pulses Neutron count Neutron probability a Φ15×5 50 10 1000 1405 59.31% b Φ25×10 50 10 1005 3513 56.15% c Φ50×10 60 10 1107 3665 69.44% d Φ50×5 50 10 1500 6453 59.85% Table 2. n/γ discrimination results based on the charge integral method.

Figure 7. (color online) n/γ discrimination results.
The detector for group (c) was closer to the central axis of deuterium ion beam, had a higher neutron yield, and a larger neutron probability than the other groups. The other three positions were the same, so the neutron probability was similar, about 60%. In order to improve the signal-to-noise ratio in Fig. 7(c) and 7(d), higher detector thresholds were set than in Fig. 7(a) and 7(b) so there are fewer low Q events in the pile-up strip. Based on the n/γ discrimination result, the neutron signals were detected separately to reconstruct the charge amplitude spectra and neutron time spectra.
2. Charge amplitude spectrum
In the charge amplitude spectrum, the abscissa is the charge value while the ordinate is the neutron count. For an organic scintillator, the charge value generated by the reaction is directly related to the energy of the incident particle. After the energy calibration, it is promising to obtain the neutron energy spectra by the differentiation unfolding method [35]. The charge value (Qtotal) of a particle can be obtained from the stored single particle current waveform. The count of the amplitude spectra was normalized to each deuterium ion beam pulse for comparison.
In order to verify the correctness of the experimental results obtained by the current-mode-counting method, an online acquisition system based on the traditional counting mode was built, composed of CAMAC modules (QDC-7166 by Philips), a n/γ discrimination module (2160A by Canberra) and several NIM modules. The charge amplitude spectrum after n/γ discrimination can be obtained in real time by the online acquisition system. In the comparative experiment, the cutter of the particle source was removed and the same detector parameters used at the same position. The logic of the online collection system is based on that of Ref. [36]. Charge multichannel calibration was carried out before this experiment, and a signal generator was used to produce square waves with different charge values. The charge multichannel calibration result can be expressed as follows:
$Q = 0.15164{M_c} + 1.00089,$

(13) where Mc is the charge multichannel address and Q (pC) is the charge generated by a single particle in the detector.
In order to measure the background counts during operation of the accelerator, a shadow cone was placed between the accelerator target and the detectors, to shield the direct neutrons. The absolute count from the online acquisition system was obtained after the background was subtracted from the total signal. The charge amplitude spectrum of the QDC was normalized according to the results of current-mode-counting method shown in Fig. 9. Besides Φ 15 × 5 crystals, the experimental results for the other three crystals are also shown.
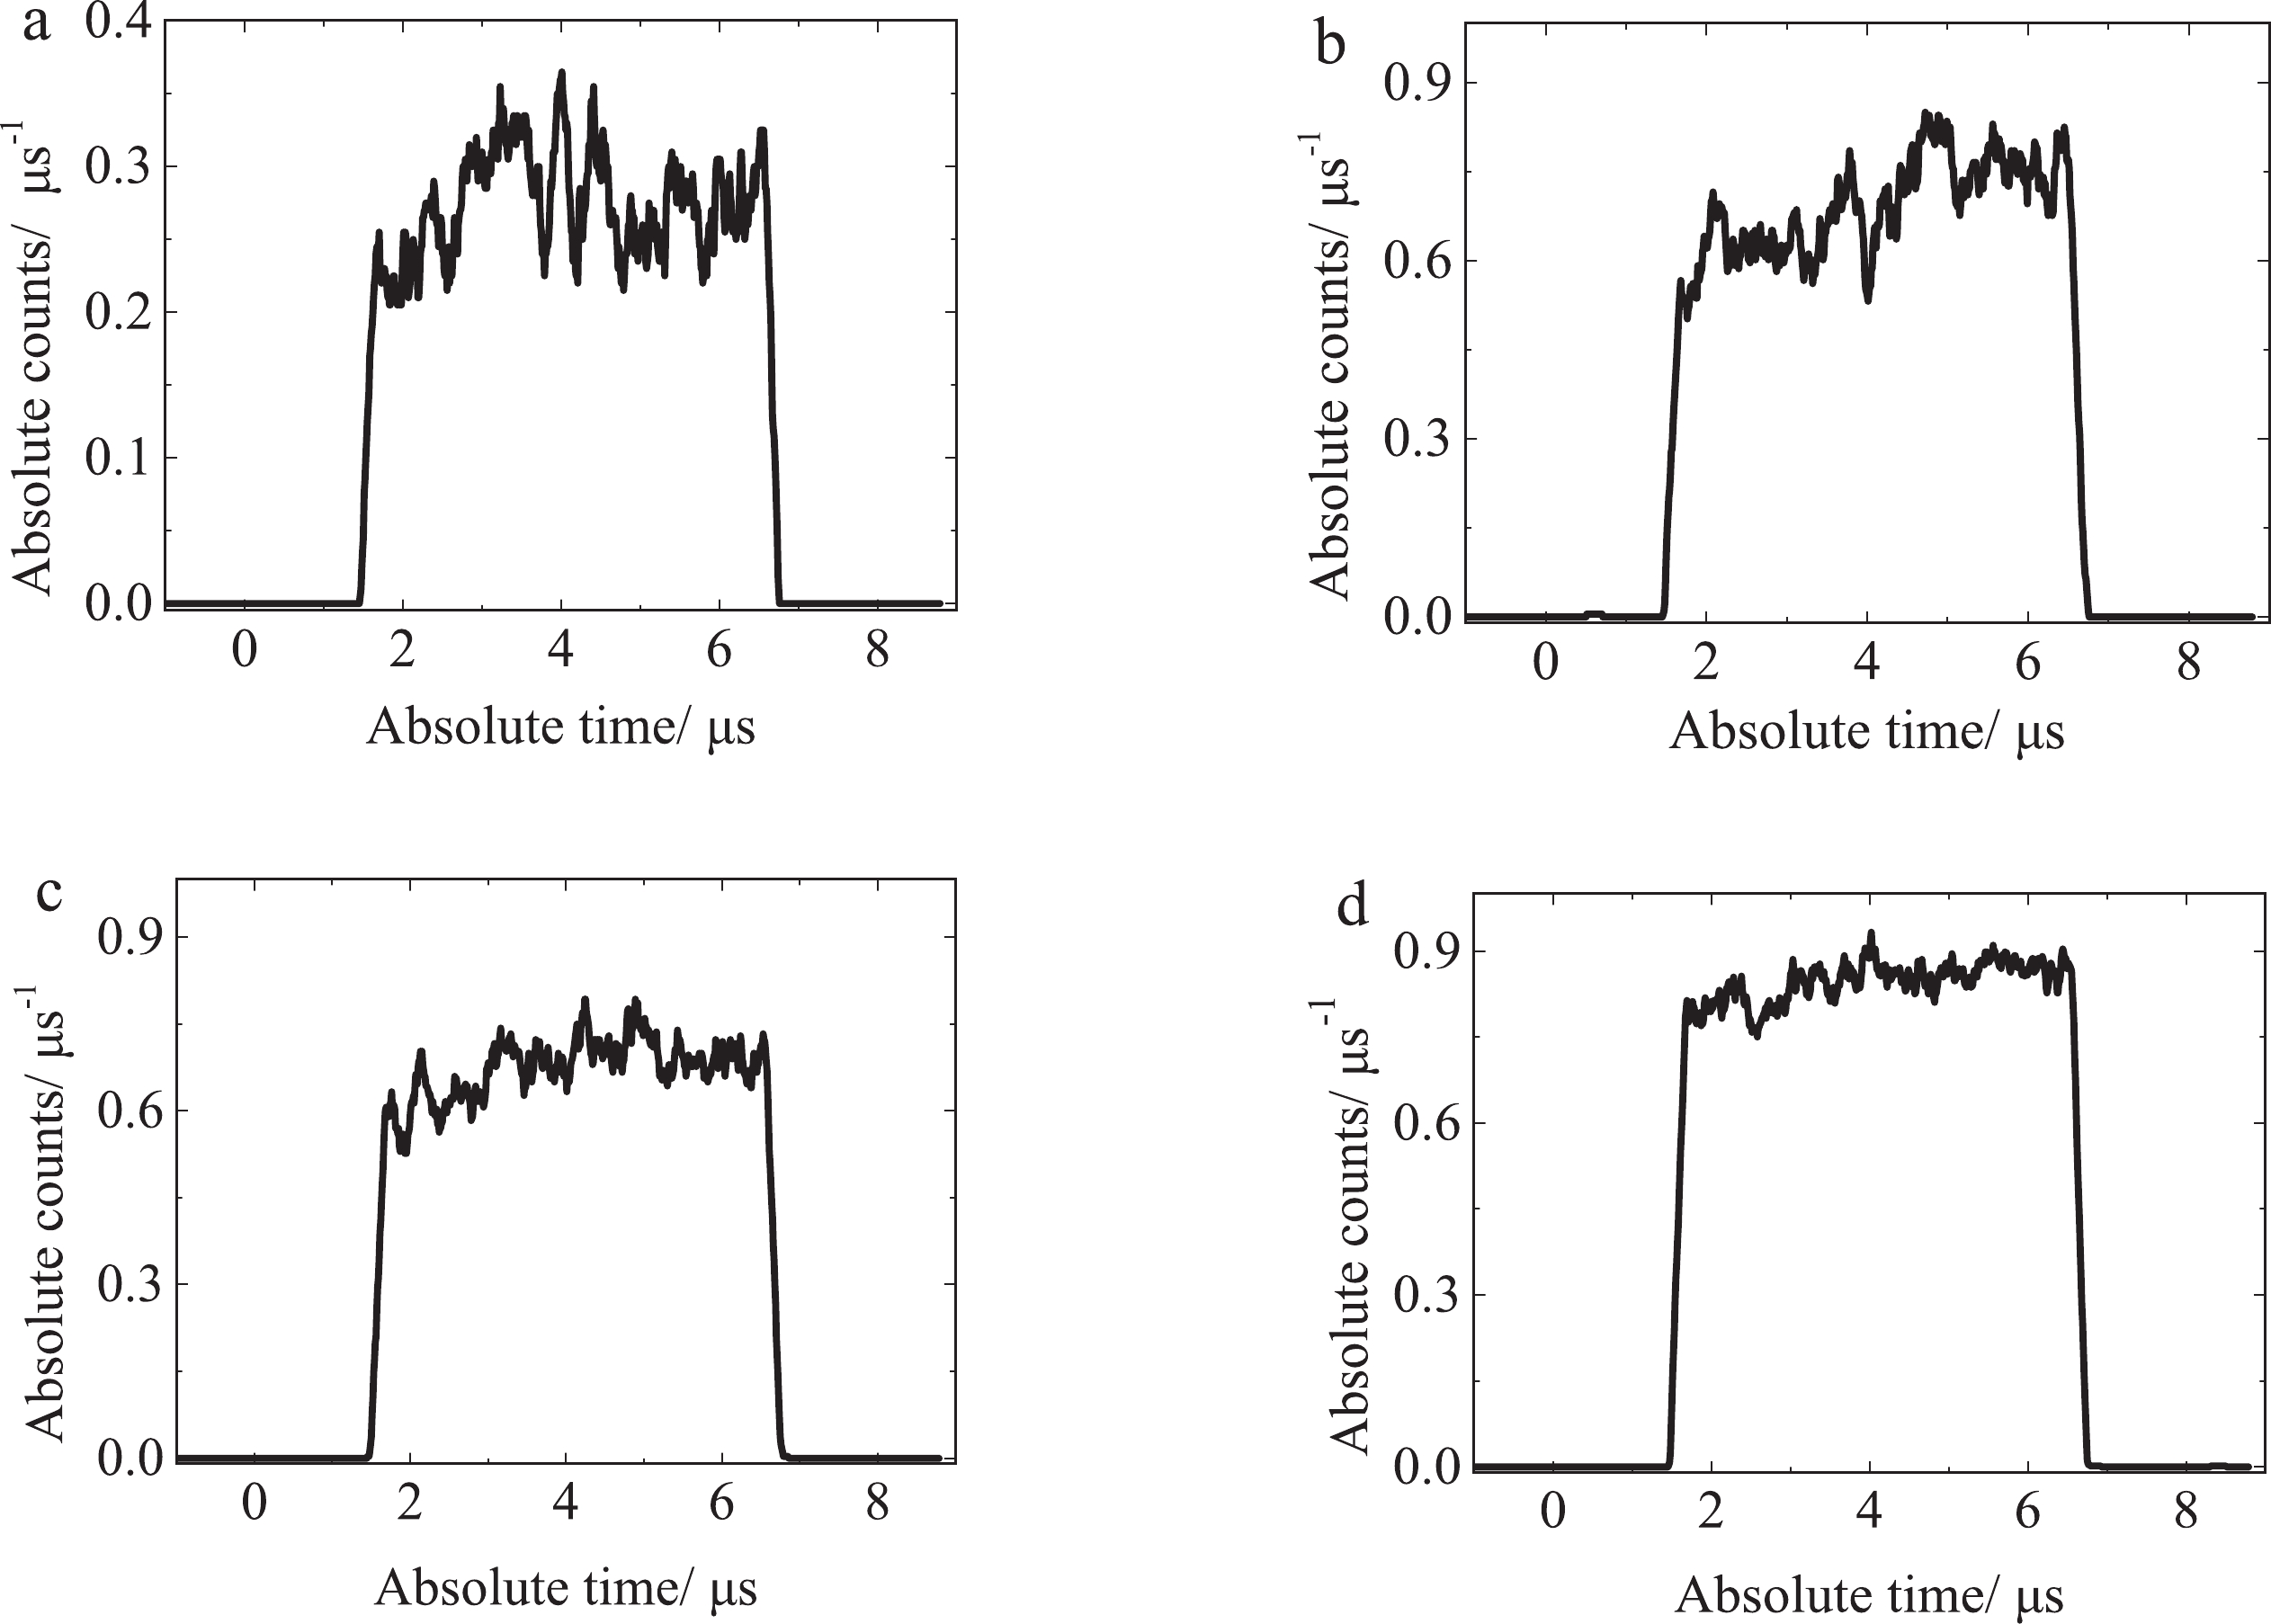
Figure 9. Time spectra of the pulsed neutrons obtained by current-mode-counting method.
As shown in Fig. 8, the amplitude spectrum (in a log scale) formed by the 1405 neutrons of the group (a) experiment shows the amplitude spectrum of the organic scintillator. An amplitude edge of the maximum appears. The two kinds of experimental results show good agreement in Fig. 8 (b) and (d). The results of the current-mode-counting method fluctuated. This is because the count was limited but not as much as the QDC. In Fig. 8 (c), the charge amplitude spectrum obtained by the current-mode-counting method deviates slightly from that of the online acquisition at its edges, but the overall trend is consistent with the online acquisition. The thresholds of both curves are not exactly the same and the charge amplitude spectrum obtained by current-mode-counting was lower than the red one.
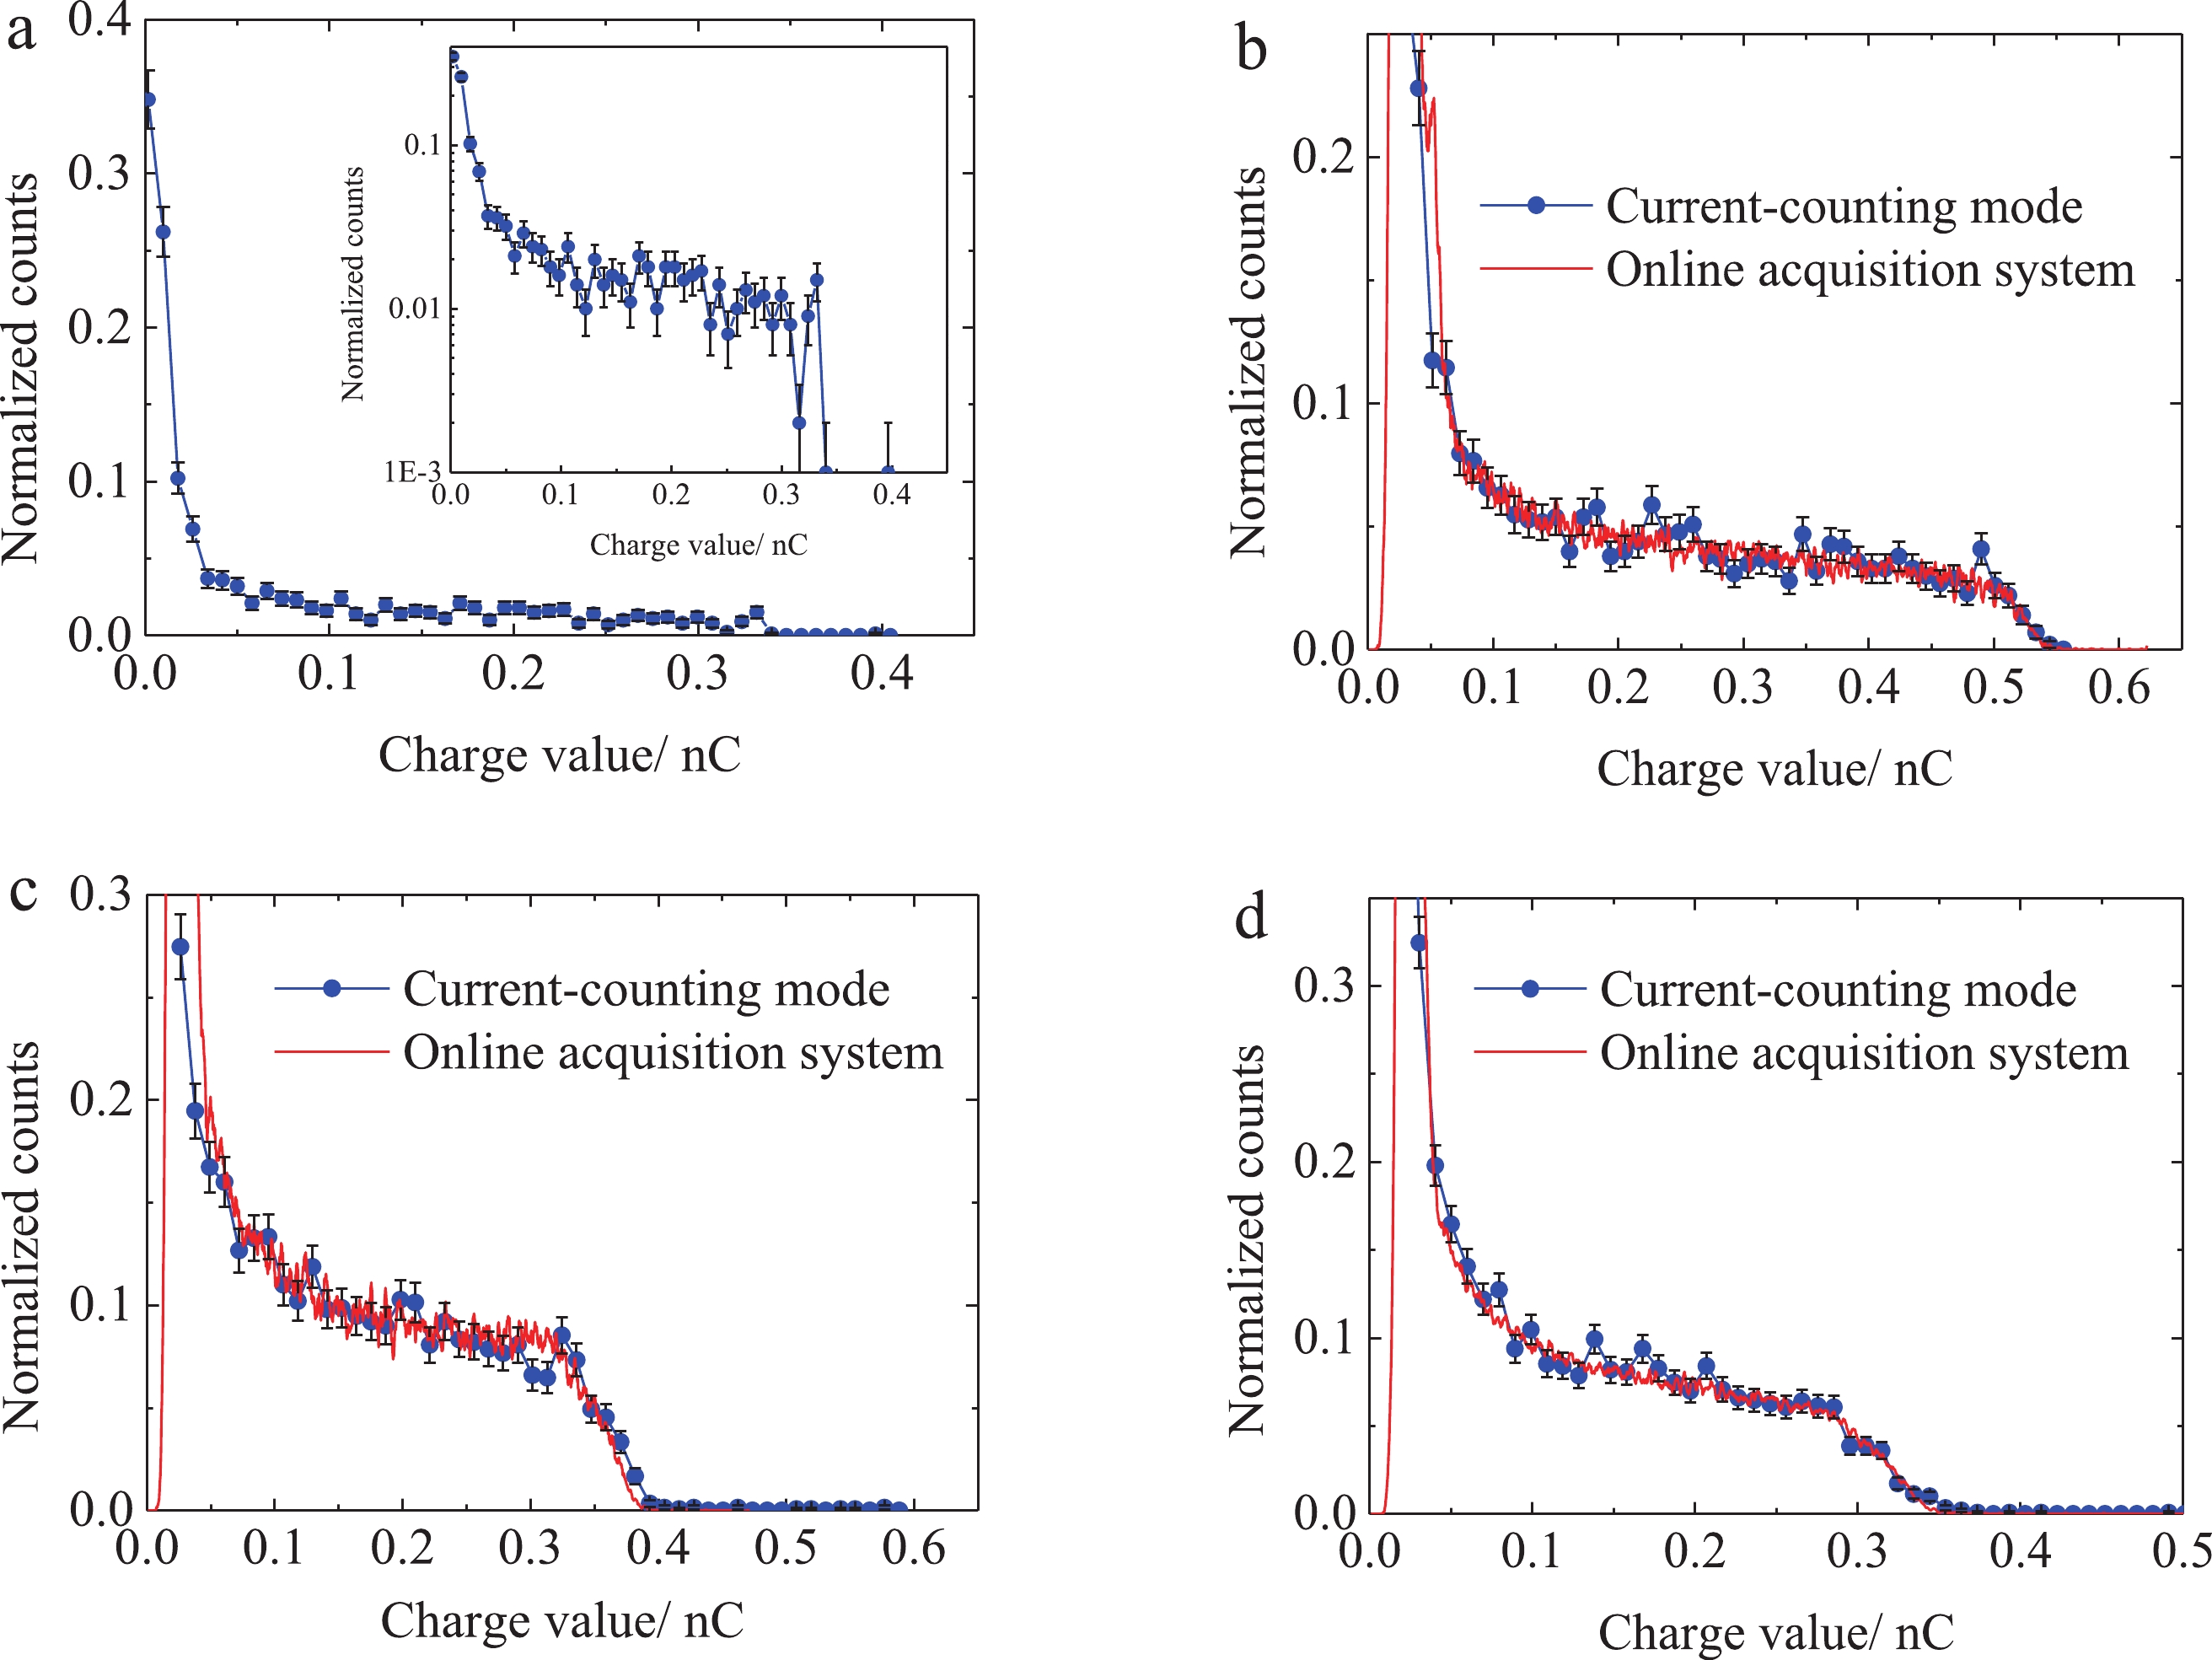
Figure 8. (color online) Comparison of the charge amplitude spectra obtained by the two methods for (a) Φ15×5, (b) Φ25×10, (c) Φ50×10, and (d) Φ50×5. The red solid line is the charge amplitude spectrum obtained by the online acquisition system. The blue dotted line is the charge amplitude spectrum obtained by the current-mode-counting method. The black error bar represents the uncertainty of the experimental results (68% confidence).
In Fig. 8, the output of the online acquisition system is the absolute count after the background was subtracted. The subtraction is unnecessary in the current-mode-counting method because the neutrons in the experiment hall have a very low probability of entering the detector in the active time window between −1 and 9 μs. As a result, they can easily be removed, which is one of the advantages of the current-mode-counting method.
Compared with traditional CAMAC acquisition system based on counting mode, the detector system structure of the current-mode-counting method is more semplice. Each particle corresponds to an independent waveform, with a response time of the order of a ns. Theoretically, the counting rate of the system can reach as high as 108 s−1. With faster scintillation crystals and other photomultiplier tubes, the theoretical counting rate can be higher. What is more, the charge of each particle was obtained directly by integration without the process of calibration. That is one of the advantages of the current-mode-counting mode.
3. Neutron time spectrum
The time spectrum of the pulse source can be characterized by the measured neutron time spectrum, because the neutron flight distance does not exceed 60 cm and the flight time spread is negligible [37]. Due to time constraints, the neutron detection efficiency calibration had not been carried out at the same position. Therefore, the absolute neutron detection efficiency cannot be obtained. The neutron time spectrum in this section was used to characterize the relative change of neutron intensity with time. The WWS algorithm was used in this section,
$t_{w\_} $ = 200 ns and △τ =10 ns. The neutron time spectrum of the above four experiments is shown in Fig. 9.The main parameters of neutron time structure obtained from the four experiments are listed in Table 3. The deviation from the theoretical value (5 μs) is given in parentheses after the time value. It can be seen from this table that the half width of neutron time structure can be effectively measured based on the current-mode counting method, which is consistent with the theoretical value. Theoretically, the neutron count should be a stable straight line in the duration of the pulse. In practice, the electric tension and current of CPNG-6 target had jitter, which made it difficult to maintain a constant intensity of the emitted deuterium beam [38]. As the number of neutrons increases, the time spectra of groups a through d gradually becomes smooth, as shown in Fig. 9 (d). As can been seen in the figure, the slope is close to a straight line.
Group Bottom width/μs Half width/μs Time start/μs a 5.30(+6.0%) 5.06(+1.2%) 1.46 b 5.29(+5.8%) 4.99(−0.2%) 1.46 c 5.40(+8.0%) 5.05(+1.0%) 1.45 d 5.46(+9.2%) 5.05(+1.0%) 1.47 Table 3. The parameters of the neutron time spectra obtained by the current-mode-counting method.
-
The current-mode-counting method is a method in which the detection system is designed so that each particle produces an independent current waveform. Since a single particle corresponds to the independent current waveform, the arrival time, energy and type of the incident particles can be obtained simultaneously.
In this paper, the response process model of the detectors to a pulsed neutron radiation field was established. Based on the current-mode-counting method, a measurement process for a pulsed radiation field was designed. In the verification experiment, the original current waveform generated by the pulsed radiation field was stored. Based on the current-mode-counting mode, the n/γ discrimination results, neutron charge amplitude spectra and time spectra were simultaneously obtained. The charge amplitude spectra agreed well with the output of the CAMAC online acquisition system working in counting mode. Experimental results showed that the current-mode-counting method is an effective way to measure the pulsed neutron radiation field.
Compared with traditional detectors operating in counting mode and current mode, each particle corresponds to a current waveform, and the response time of a single particle is in the order of nanoseconds. The effective counting rate of the detection system can be increased to 108 s−1 with the appropriate hardware. The waveform, arrival time and energy information of the particle can be obtained at the same time, which can be used for PSD, amplitude spectrum and time spectrum reconstruction. This current-mode-counting method is of great significance for the measurement of the rising and falling phases of the intense pulsed radiation field. It also provides a reference model for the particle detection process of solar flare observation, pulsar navigation signal acquisition and spaceborne nuclear explosion detection.
-
The authors acknowledge the China Institute of Atomic Energy (CIAE) for providing the pulsed neutron source. They appreciate Kai Zhang and Hong-Tao Chen for the operation of the neutron generator and assistance in these experiments.
A transient process observation method based on the non-homogeneous Poisson process model
- Received Date: 2020-06-18
- Available Online: 2021-04-15
Abstract: The current-mode-counting method is a new approach to observing transient processes, especially in transient nuclear fusion, based on the non-homogeneous Poisson process (NHPP) model. In this paper, a new measurement process model of the pulsed radiation field produced by transient nuclear fusion is built based on the NHPP. A simulated measurement is performed using the model, and the current signal from the detector is obtained by simulation based on Poisson process thinning. The neutron time spectrum is reconstructed and is in good agreement with the theoretical value, with its maximum error of a characteristic parameter less than 2.3%. Verification experiments were carried out on a CPNG-6 device at the China Institute of Atomic Energy, with a detection system with a nanosecond response time. The experimental charge amplitude spectra are in good agreement with those obtained by the traditional counting mode, and the characteristic parameters of the time spectrum are in good agreement with the theoretical values. This shows that the current-mode-counting method is effective for the observation of transient nuclear fusion processes.


 DownLoad: