-
Xenon is a natural element with the atomic number Z = 54. It has nine stable isotopes with Z numbers following that of tin. Its isotopes are 126Xe(0.0890%), 124Xe(0.0952%), 128Xe(1.9102%), 130Xe(4.0710%), 136Xe(8.8573%), 134Xe(10.4357%), 131Xe(21.232%), 129Xe(26.4006%), and 132Xe(26.9086%) [1]. These isotopes are prominent in the study of nuclear energy and nuclear physics. First, xenon is ideal for studying plasma conditions at high temperatures and pressure owing to its remarkable physical properties. In the design of a fusion reactor, adding an appropriate xenon gas and harnessing its pressure resistance and thermal neutron absorption characteristics can effectively prevent nuclear leakages, thereby ensuring the safety of nuclear reactors such as the international thermonuclear experimental reactor (ITER) and accelerator-driven subcritical systems (ADSs) [2]. The 3H(d,n)4He fusion could provide output energy up to 14 MeV. In this case, the neutron yields would be (5~6)×1014 n/s [3]. Therefore, the xenon gas activation inside a fusion reactor should be considered. Second, xenon isotopes are ascribed to the transitional region below the closed neutron shell with N = 82 [4]. The analysis of the transitional nucleus neutron cross-section is a fundamental interest of nuclear chemists and physicists. The possibility of comparing these competing approaches raises an additional interest from the experimentalists to obtain data on even–even Xe nuclei. Particularly important are the non-yrast level properties that provide strict tests for various nuclear models [5]. Nuclear reactions can be induced via neutrons with an energy of approximately 14 MeV (e.g., (n, 2n), (n, p), (n, α), (n, t), and (n, d) reactions [6,7]). Such reactions are essential for nuclear physics to elucidate the inertial confinement fusion (ICF) plasma [8,9]. The neutron′s energy distributed in the deuterium-tritium (DT) ICF plasma relies on the power of stopping for the corresponding tritons and deuterons. For this purpose, the cross-section values of xenon isotope nuclear reactions induced by 14 MeV neutrons are required. However, the preparation of appropriate rare-gas targets for irradiation is difficult, which explains the lack of data on the corresponding cross-sections. For the 124Xe isotopes, the cross sections of the 124Xe(n,2n)123Xe reaction at approximately 14 MeV have been determined by a limited number of laboratories [10-13]. The cross-sections of the 126Xe(n, 2n)125Xe, 128Xe(n, 2n)127Xe, 130Xe(n, 2n)129mXe, 132Xe(n, 2n)131mXe, 130Xe(n, p)130I, 131Xe(n, p)131I, and 132Xe(n, p)132I reactions at ~14 MeV were obtained experimentally by only two groups [10, 11]. They adopted sodium perxenate (Na4XeO6·2H2O) and quinol-clathrates as the target sample, and the corresponding result was reported at only one energy point. In addition, significant differences have been identified among previous literature results [10-14]. These differences are mainly triggered by two factors:
1) Decay data deficiencies (characteristic γ-ray intensity). For the 124Xe(n,2n)123Xe reaction, the cross-sections were measured by Sigg and Kuroda (1976) [10] and Kondaiah et al. (1968) [11] with the characteristic γ-ray intensity at 63.9% and 47.3% for the same characteristic γ-ray of 148.9 keV, respectively (refer to Table 1). Ref. [12] provides no information on decay. The datum for 48.9% was recently measured [1]. For the 127Xe product radionuclide, the cross-sections have also been determined by Sigg and Kuroda (1976) [10], with the characteristic γ-ray intensity at 60.8% for the same characteristic γ-ray of 202.8 keV (refer to Table 1). The data for 68.7% have been recently measured [1]. For the 129mXe product radionuclide, the cross-sections have been determined by Kondaiah et al. (1968) [11] using the characteristic γ-ray intensity to be 5.8% for the same characteristic γ-ray 196.56 keV. The data for 4.59% have been recently measured [1].
Reaction Decay data Detector Monitor reaction Reference 124Xe(n, 2n)123Xe T1/2=2.1 h, Eγ=148.9 keV, Iγ=63.9% GeLi 27Al(n,α)24Na Ref. [10] T1/2=2.08 h, Eγ=149 keV, Iγ=47.3% GeLi 136Xe(n, 2n)135Xe Ref. [11] T1/2=2.04 h, decay data: No information Xenon gas enriched to 40% 124Xe. GeLi 27Al(n,α)24Na Ref. [12] T1/2=2.08 h, Eγ=148.92 keV, Iγ=48.9%; Eγ=178.02 keV, Iγ=14.9%
Xenon gas enriched to 99.6% 124Xe.HPGe 197Au(n, 2n)196Au Ref. [13] 126Xe(n, 2n)125Xe T1/2=17 h, Eγ=188.4 keV, Iγ= 54.97% GeLi 27Al(n,α)24Na Ref. [10] T1/2=16.8 h, Eγ=187 keV, Iγ= 54.97% GeLi 136Xe(n, 2n)135Xe Ref. [11] 128Xe(n, 2n)127Xe T1/2=36.4 d, Eγ=202.84 keV (Iγ=60.8%), Eγ=172.1 keV (Iγ=20.8%), Eγ=374.96 keV (Iγ=18.3%) GeLi 27Al(n,α)24Na Ref. [10] T1/2=36.41 d, Eγ=203 keV, Iγ= 68.37% GeLi 136Xe(n, 2n)135Xe Ref. [11] 130Xe(n, 2n)129mXe T1/2=8 d, Eγ=196.5 keV, Iγ= 4.59% GeLi 27Al(n,α)24Na Ref. [10] T1/2=8 d, Eγ=197 keV, Iγ=5.8% GeLi 136Xe(n, 2n)135Xe Ref. [11] 132Xe(n, 2n)131mXe T1/2=11.9 d, Eγ=163.9 keV, Iγ= 2% GeLi 27Al(n,α)24Na Ref. [10] T1/2=11.8 d, Eγ=164 keV, Iγ=2.1% GeLi 136Xe(n, 2n)135Xe Ref. [11] 130Xe(n, p)130I T1/2=12.4 h, Eγ=536.1 keV (Iγ=100%), Eγ=668.4 keV (Iγ=94%),
Eγ=739.4 keV (Iγ=81%), Eγ=418.0 keV (Iγ=33%),GeLi 27Al(n,α)24Na Ref. [10] T1/2=12.3 h, Eγ=538 keV (Iγ=99.2%), Eγ=743 keV (Iγ=86.7%) GeLi 136Xe(n, 2n)135Xe Ref. [11] 131Xe(n, p)131I T1/2=8.04 d, Eγ=364.5 keV, Iγ=82% GeLi 27Al(n,α)24Na Ref. [10] T1/2=8.05 d, Eγ=364 keV, Iγ=83.58% GeLi 136Xe(n, 2n)135Xe Ref. [11] 132Xe(n, p)132I T1/2=2.28 h, Eγ=772.7 keV (Iγ=75%), Eγ=667.7 keV (Iγ=98%),
Eγ=954.6 keV (Iγ=16.7%), Eγ=522.6 keV (Iγ=15.6%),
Eγ=630.2 keV (Iγ=13.5%)GeLi 27Al(n,α)24Na Ref. [10] T1/2=2.26 h, Eγ=773 keV, Iγ=79.81% GeLi 136Xe(n, 2n)135Xe Ref. [11] Table 1. Summary of cross-section measurements for (n, 2n) and (n, p) reactions on xenon isotopes from previous measurements.
2) Interfering reactions. For the 132Xe(n, p)132I (β-(100%), T1/2=2.295 h) reaction, in previous research [10,11], the 773 keV gamma-ray emitted in the 132I decay was used to obtain the values of the 132Xe(n, p)132I reaction cross section. However, the 773 keV gamma-ray did not only emerge from the 132I product radionuclide, but also from the 132Xe(n, p)132mI (half-life T1/2 = 1.387 h, γ-ray energy Eγ = 772.6 keV, and intensity Iγ = 14.0%) reaction, and from the 134Xe(n, α)131m1Te (half-life T1/2 = 33.25 h, γ-ray energy Eγ = 773.67 keV, and intensity Iγ = 36.8%) reaction (refer to Table 1, the decay data of the daughter nucleus, the detector used, and the monitor reaction are also given).
Owing to the lack of data and differences between these data, the libraries of evaluated nuclear data rely heavily on nuclear model calculations in the 13–15 MeV energy regions; hence, large differences exist among the various evaluations. For instance, for the 124Xe(n, 2n)123Xe reaction, the evaluation result of database JENDL-4.0 [15] was 1.5 times that of ENDF/B-VIII.0 [16] (CENDL-3 [17]). For the 130Xe(n, p)130I reaction, the result of database JENDL-4.0 [15] was 3 times that of ENDF/B-VIII.0 [16] (JEFF-3.3 [18], RUSFOND [19]). For the 131Xe(n, p)131I reaction, the result of database JENDL-4.0 [15] was 4 times that of ENDF/B-VIII.0 [16], JEFF-3.3 [18], RUSFOND [19], and CENDL-3 [17]. For the 132Xe(n, p)132I reaction, the result of database JENDL-4.0 [15] was 4 times that of RUSFOND [19]. Consequently, new measurements for the Xe(n,x) cross section are required in the 13–15 MeV neutron energy range.
This paper reports the 124Xe(n, 2n)123Xe, 128Xe(n, 2n)127Xe, 130Xe(n, 2n)129mXe, 126Xe(n, 2n)125Xe, 130Xe(n, p)130I, 132Xe(n, 2n)131mXe, and 131Xe(n, p)131I reaction cross-section measurements at 13–15 MeV. We adopted natural high-purity pressured Xe gas as a target, and a high-resolution HPGe detector was utilized to measure the gamma activities of the product nuclei. During the irradiation process, each sample was wrapped in pure cadmium foils to circumvent the effects of the 124Xe(n,γ)125Xe, 126Xe(n,γ)127Xe, 128Xe(n,γ)129mXe, and 130Xe(n,γ)131mXe reactions induced by thermal neutrons on the 126Xe(n,2n)125Xe, 128Xe(n,2n)127Xe, 130Xe(n,2n)129mXe, and 132Xe(n,2n)131mXe reactions, respectively. The obtained results were compared and analyzed with previously reported results, the evaluation data in JENDL-4.0 [15], ENDF/B-VIII.0 [16], CENDL-3 [17], JEFF-3.3 [18], and RUSFOND [19] libraries, and the theoretical excitation curves acquired using the TALYS-1.95 [20] code.
-
The procedure for radioactive product identification and cross-section measurements is outlined in a different paper [21-23]. Only the most prominent characteristics associated with the measurements conducted in this study are presented.
-
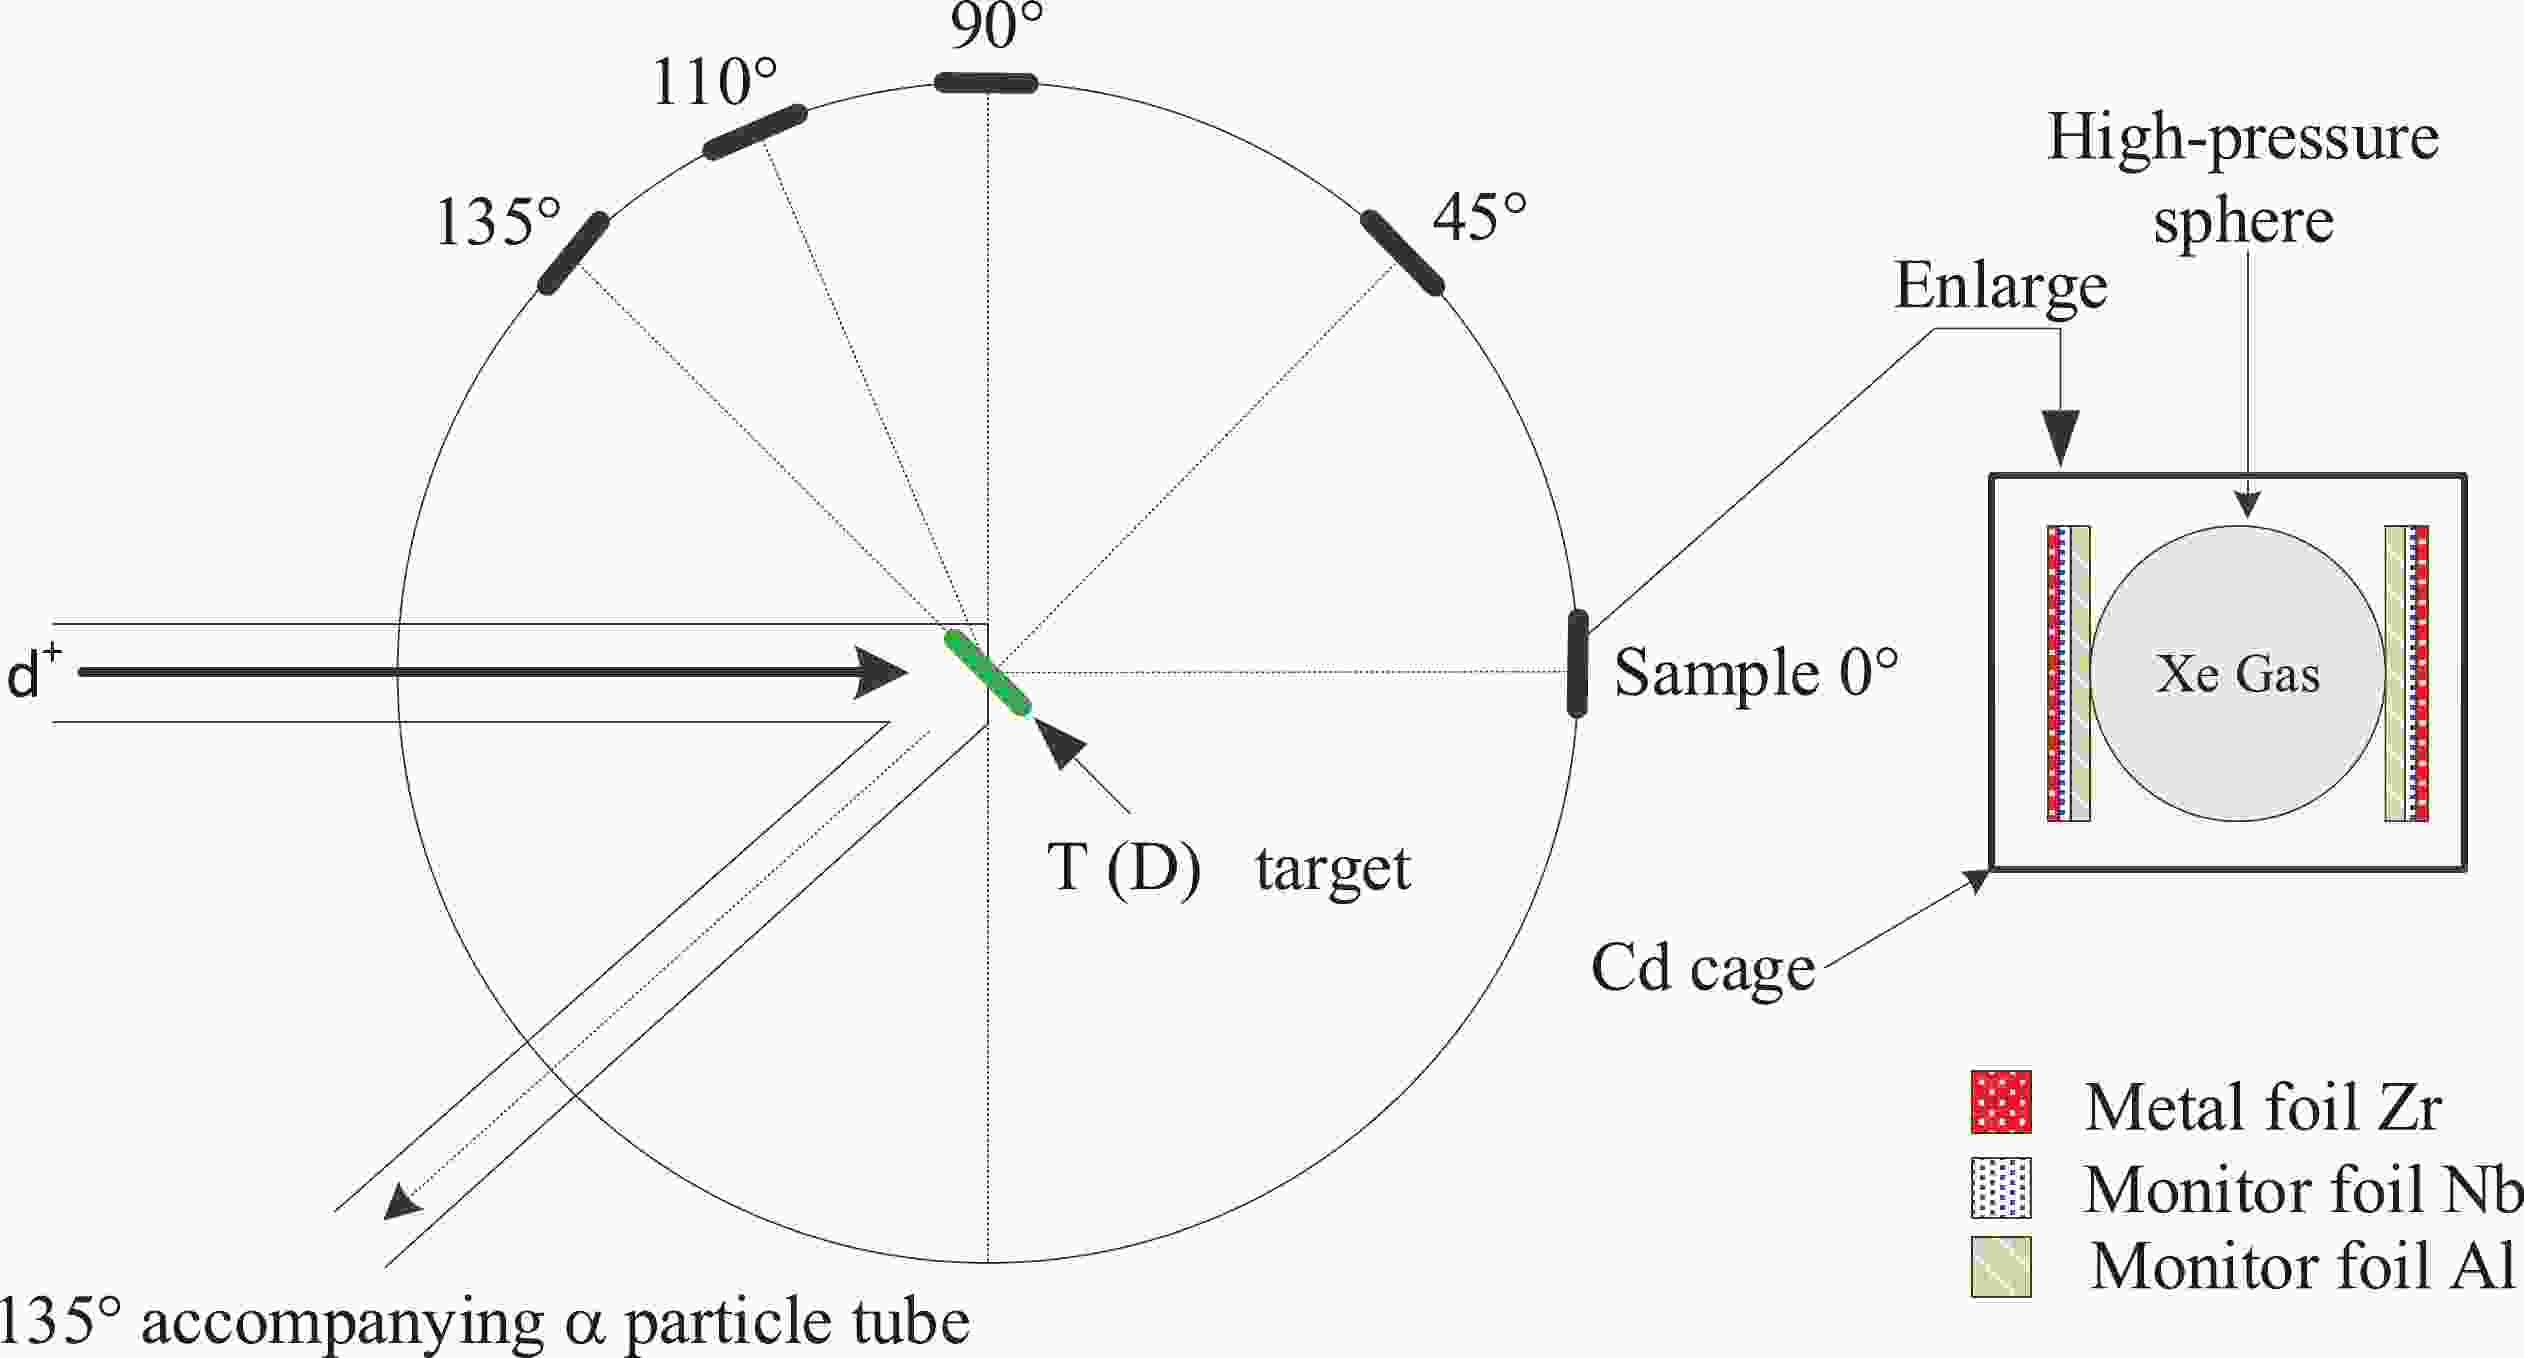
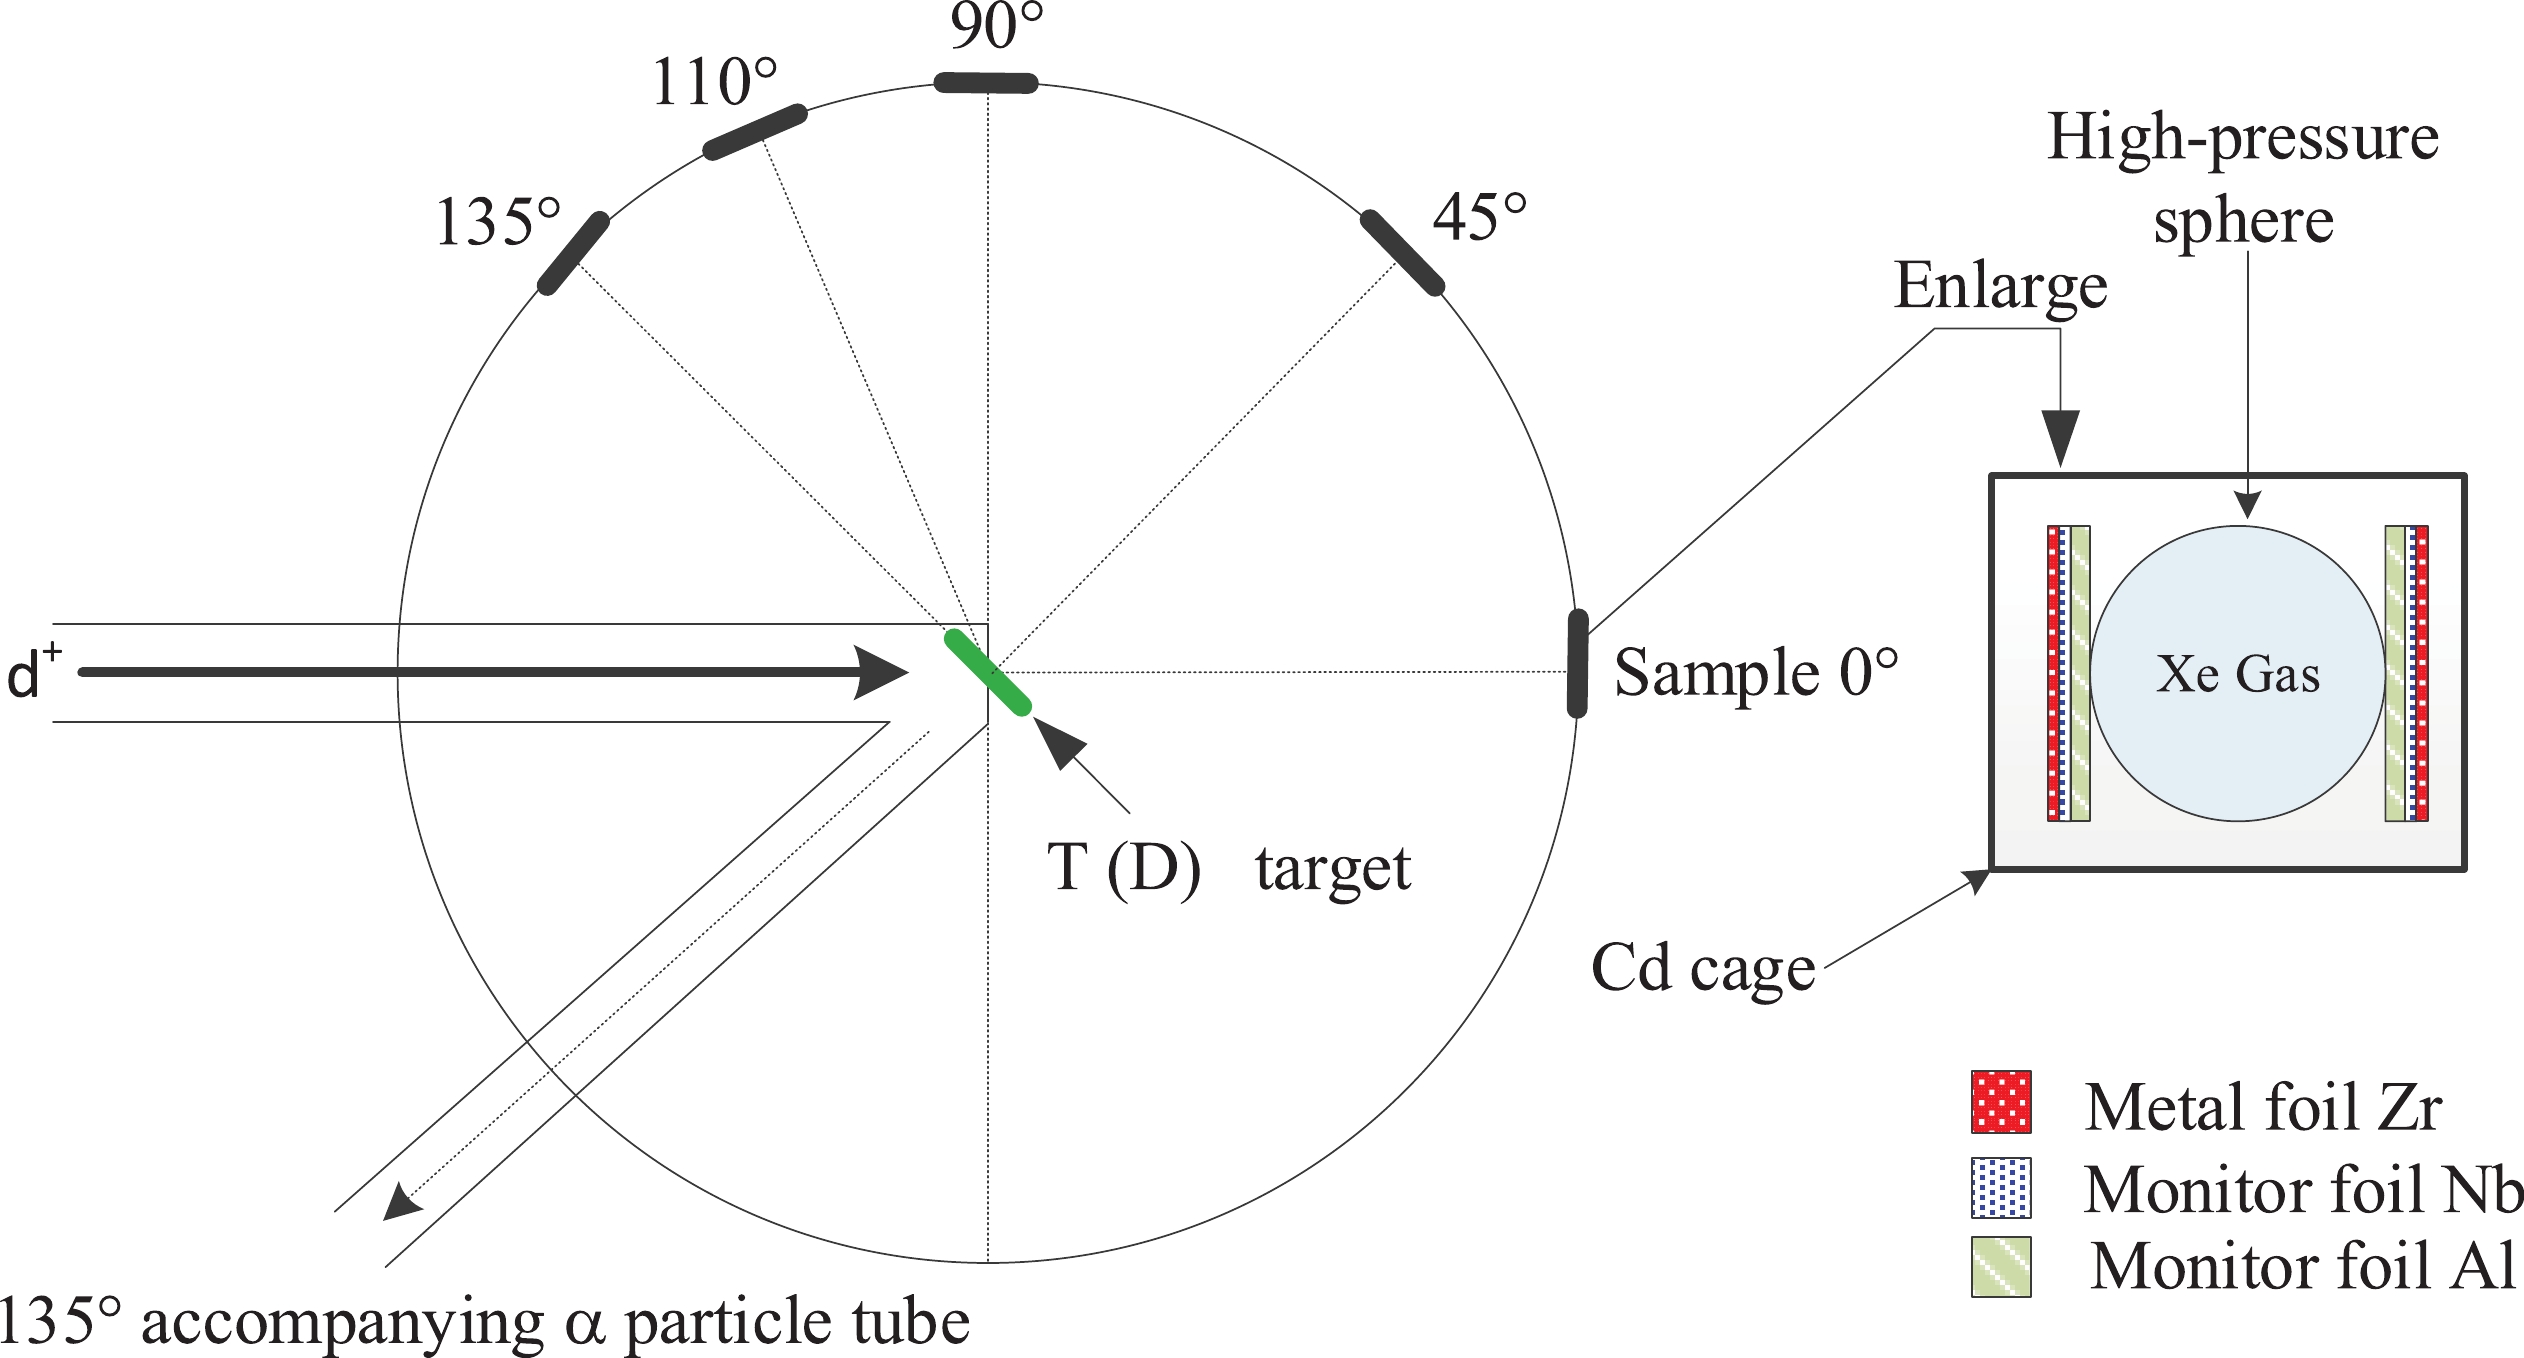
Xenon gas (99.999% purity with natural isotopic composition) was stored in a stainless-steel sphere with a 20 mm inner diameter and 1 mm wall thickness. The xenon gas weight was obtained by subtracting the container weight from the total weight. The gas weight and pressure were 2.3–5.2 g and 120–250 atm, respectively. Five of such samples of xenon gas and 10 monitors (20 mm diameter), comprising 99.99% pure and 0.12 mm thick Nb foil and a 99.999% pure and 0.3 mm thick Al foil, were prepared for irradiation. A ZrNbAl–Xe–AlNbZr stack was prepared from these five samples and mounted at 0°, 45°, 90°, 110°, and 135° angles relative to the beam. The end of the neutron production target was 5 cm apart from the sample sphere center (see Fig. 1). The neutron fluxes for the low-threshold of the 130Xe(n, p)130I, 131Xe(n, p)131I, and 132Xe(n, p)132I reactons were monitored by implementing the 27Al(n, α)24Na reaction (Eth = 3.249 MeV). The neutron fluxes for the high-threshold of the 124Xe(n, 2n)123Xe, 126Xe(n, 2n)125Xe, 128Xe(n, 2n)127Xe, 130Xe(n, 2n)129mXe, and 132Xe(n, 2n)131mXe reactions were monitored by implementing the 93Nb(n, 2n)92mNb reaction cross-section (Eth = 8.792 MeV). The cross-sections of the 27Al(n, α)24Na and 93Nb(n, 2n)92mNb monitor reactions were adopted from a different paper [24]. Subsequently, a cadmium foil (99.95% pure and 1 mm thick) was wrapped around the samples to minimize the influence of the 124Xe(n, γ)125Xe, 126Xe(n, γ)127Xe, 128Xe(n, γ)129mXe, and 130Xe(n, γ)131mXe reactions activated via thermal neutrons on the 126Xe(n, 2n)125Xe, 128Xe(n, 2n)127Xe, 130Xe(n, 2n)129mXe, and 132Xe(n, 2n)131mXe reactions, respectively.
The K-400 neutron generator at the Institute of Nuclear Physics and Chemistry of the China Academy of Engineering Physics was utilized to irradiate the samples for 2 h. The neutron yields were ~(4–5)×1010 n/s. The 3H(d,n)4He reaction produced 14 MeV neutrons when excited by a 134 keV deuteron beam energy and a 200 μA beam current. The generator described above uses a solid 3H–Ti target that is 2.65 mg/cm2 thick. To monitor the neutron flux within the irradiation, the accompanying α-particles were utilized. An Au–Si surface barrier detector was set at an angle of 135° relative to the beam direction. The obtained data were adopted for the correction of the neutron flux deviation.
-
The average energies of neutron during the irradiating tests at the 0°, 45°, 90°,110°, and 135° incident angles were established via two approaches. The first approach adopted the cross-section ratios of the 93Nb(n, 2n)92mNb and 90Zr(n, 2n)89m+gZr reactions [25]. Another approach utilized the expressions obtained from Ref. [23]. The results obtained by the two approaches are consistent within their uncertainties. These neutron energies were 14.8, 14.4, 14.1, 13.8, and 13.5 MeV, respectively. The neutron energy uncertainty at 5 cm was assessed to be equal to 0.2 MeV, following the consideration of the specimen and the d+ beam sizes (~4 mm) [25].
-
After irradiation, the samples decay for different amounts of time (ranging from 55 min to 5 days depending on the half-life of the daughter nucleus), and the gamma-ray activities of the 123Xe, 125Xe, 127Xe, 129mXe, 131mXe, 130I, 131I, 24Na, 92mNb, and 132I nuclei were measured by the calibrated detector of GEM-60P HPGe (with the crystal length and diameter equal to 72.3 and 70.1 mm, respectively). The energy resolution at 1.332 MeV and a relative efficiency were equal to 1.69 keV and about 68%, respectively. The detector was calibrated using standard sources of γ-ray. Monte Carlo simulations were also performed to correct the geometry difference between the γ-ray calibration sources used for determining the efficiency of the HPGe detectors and the Xe sphere. The partial spectra of γ-ray for Xe samples collected after 4.5 h and 32.7 h irradiations are presented in Figs. 2 and 3, respectively. In addition to the strong lines of interest at 148.9 and 536.07 keV in Fig. 2 and 188.4, 202.86, 163.93, 196.56, and 364.49 keV in Fig. 3, in the former figure, the weaker 132I γ-ray transitions at 522.65 keV are also indicated. The ORTEC® GammaVision® Gamma Spectrum Analysis computer program examined the peak area [26] using the emulation package of ORTEC® MAESTRO® MCA for data collection and analysis [26].
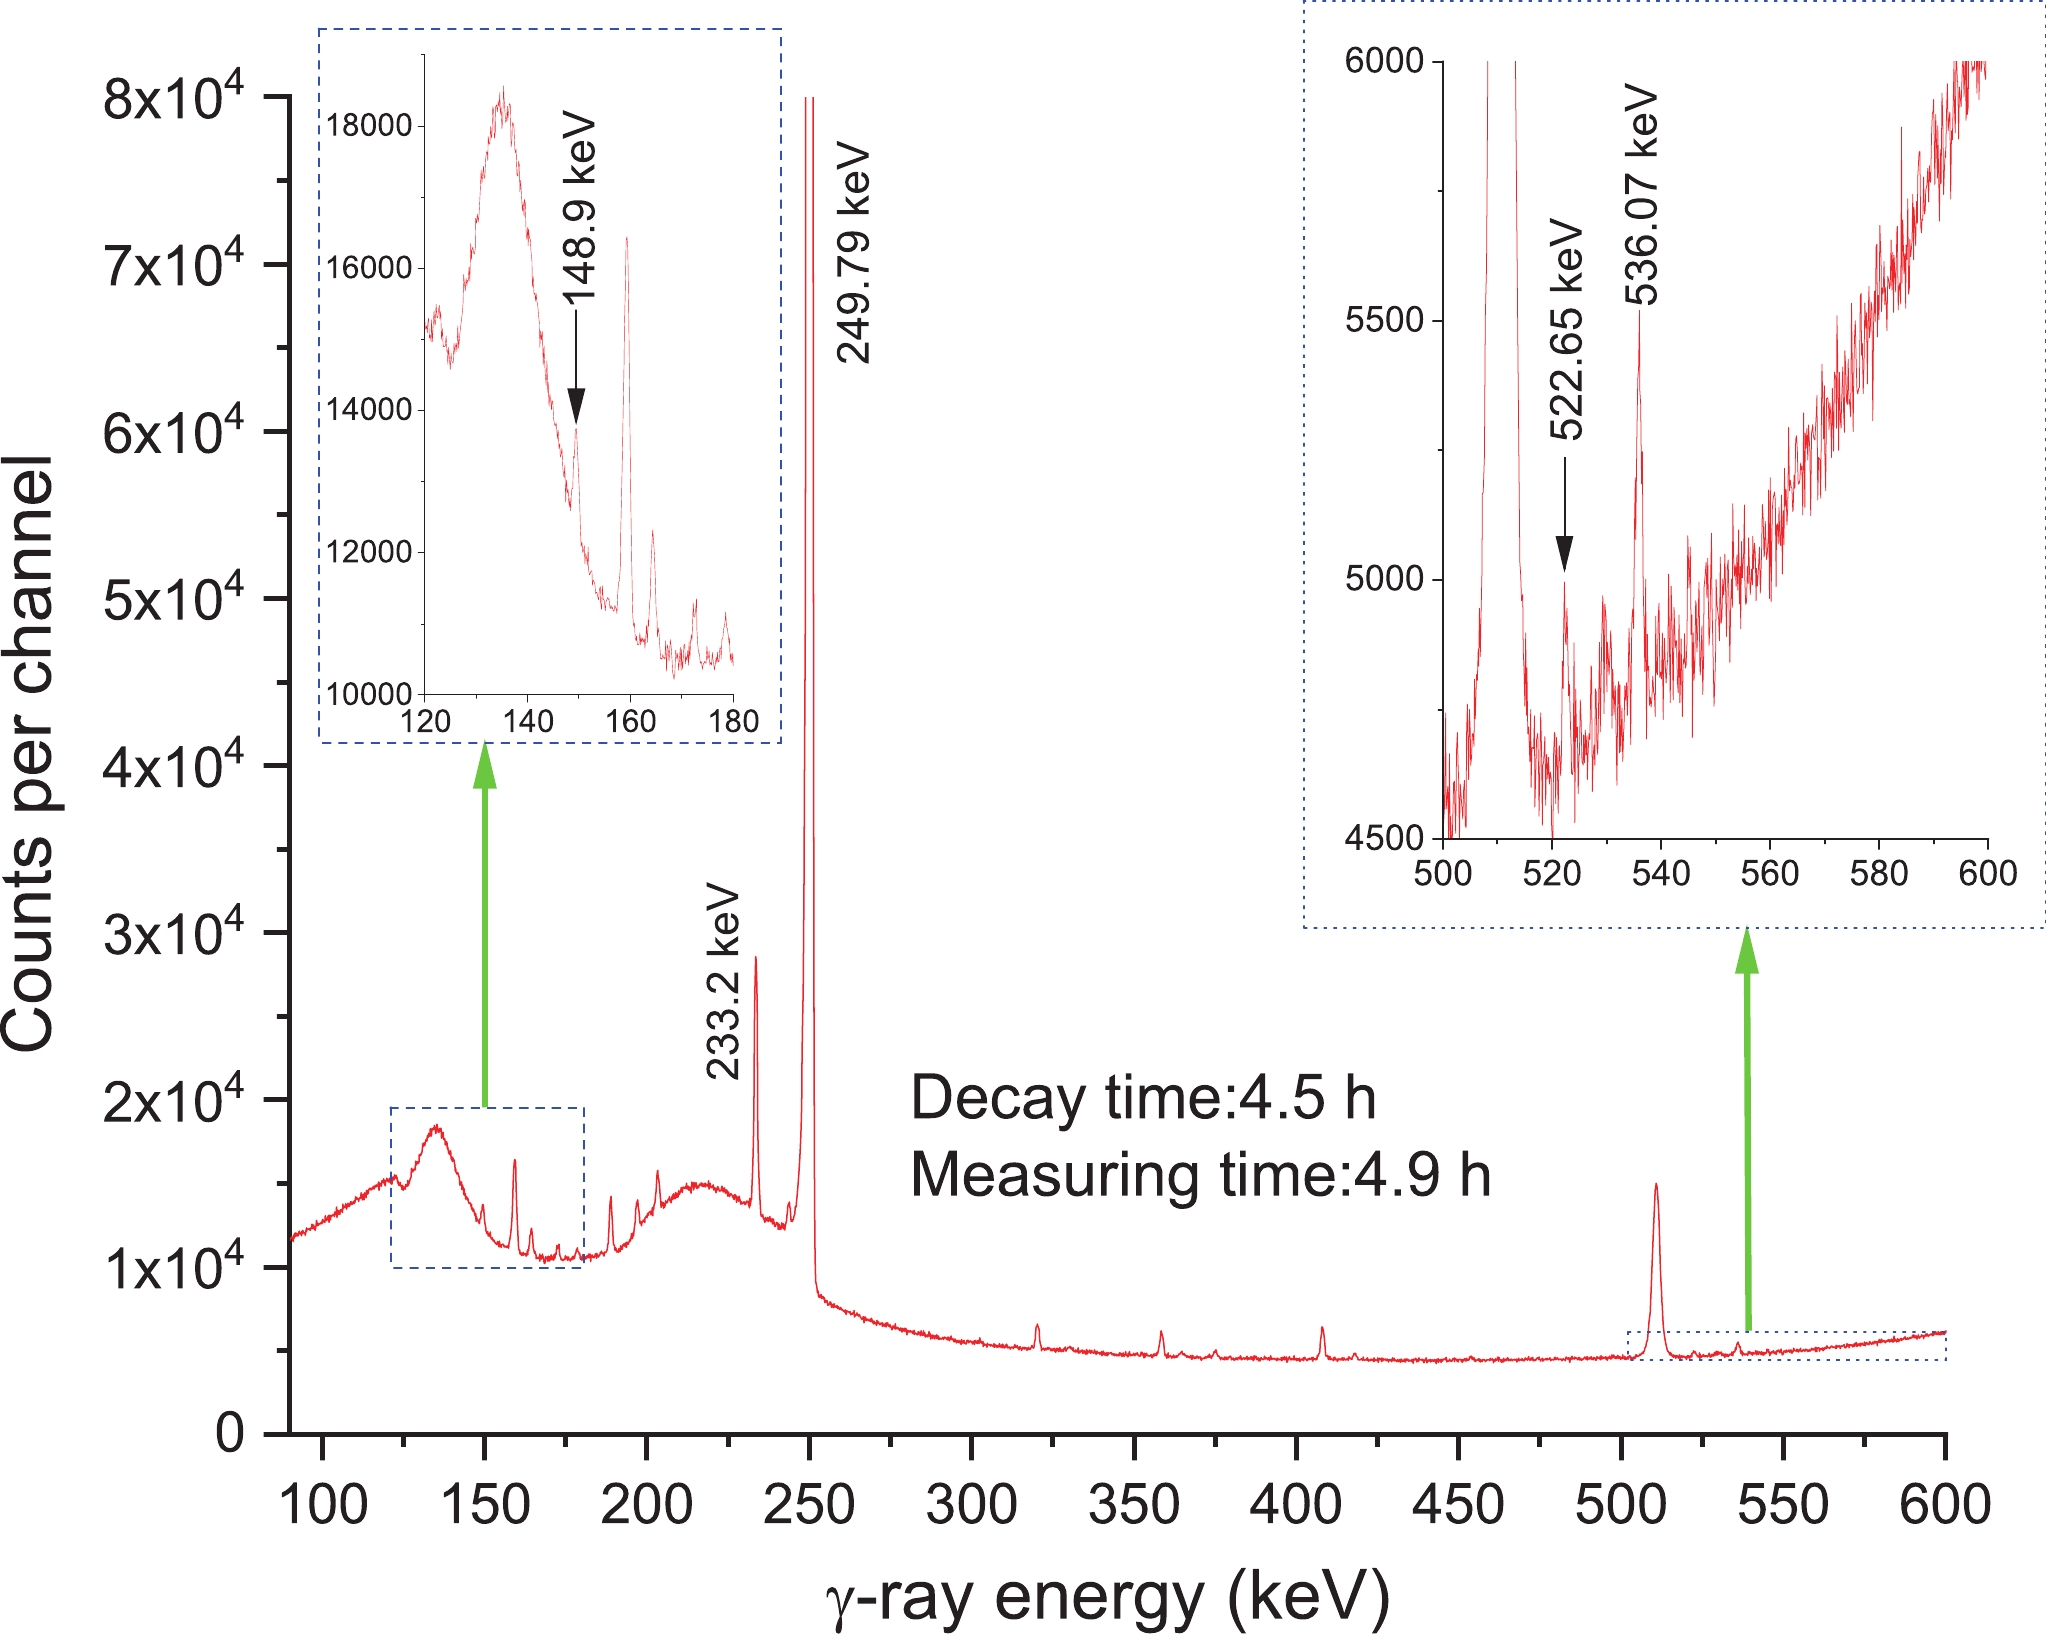
Figure 2. (color online) γ-ray spectrum of xenon obtained with a 68% relative efficient HPGe detector at En=13.5 MeV, 4.5 h after the neutron activation of xenon isotopes and an acquisition time of 4.9 h. The lines of interest are 148.9, 522.6, and 536.07 keV. In the energy ranges of 120–180 keV and 500–600 keV, the enlarged portion of the spectrum is given.
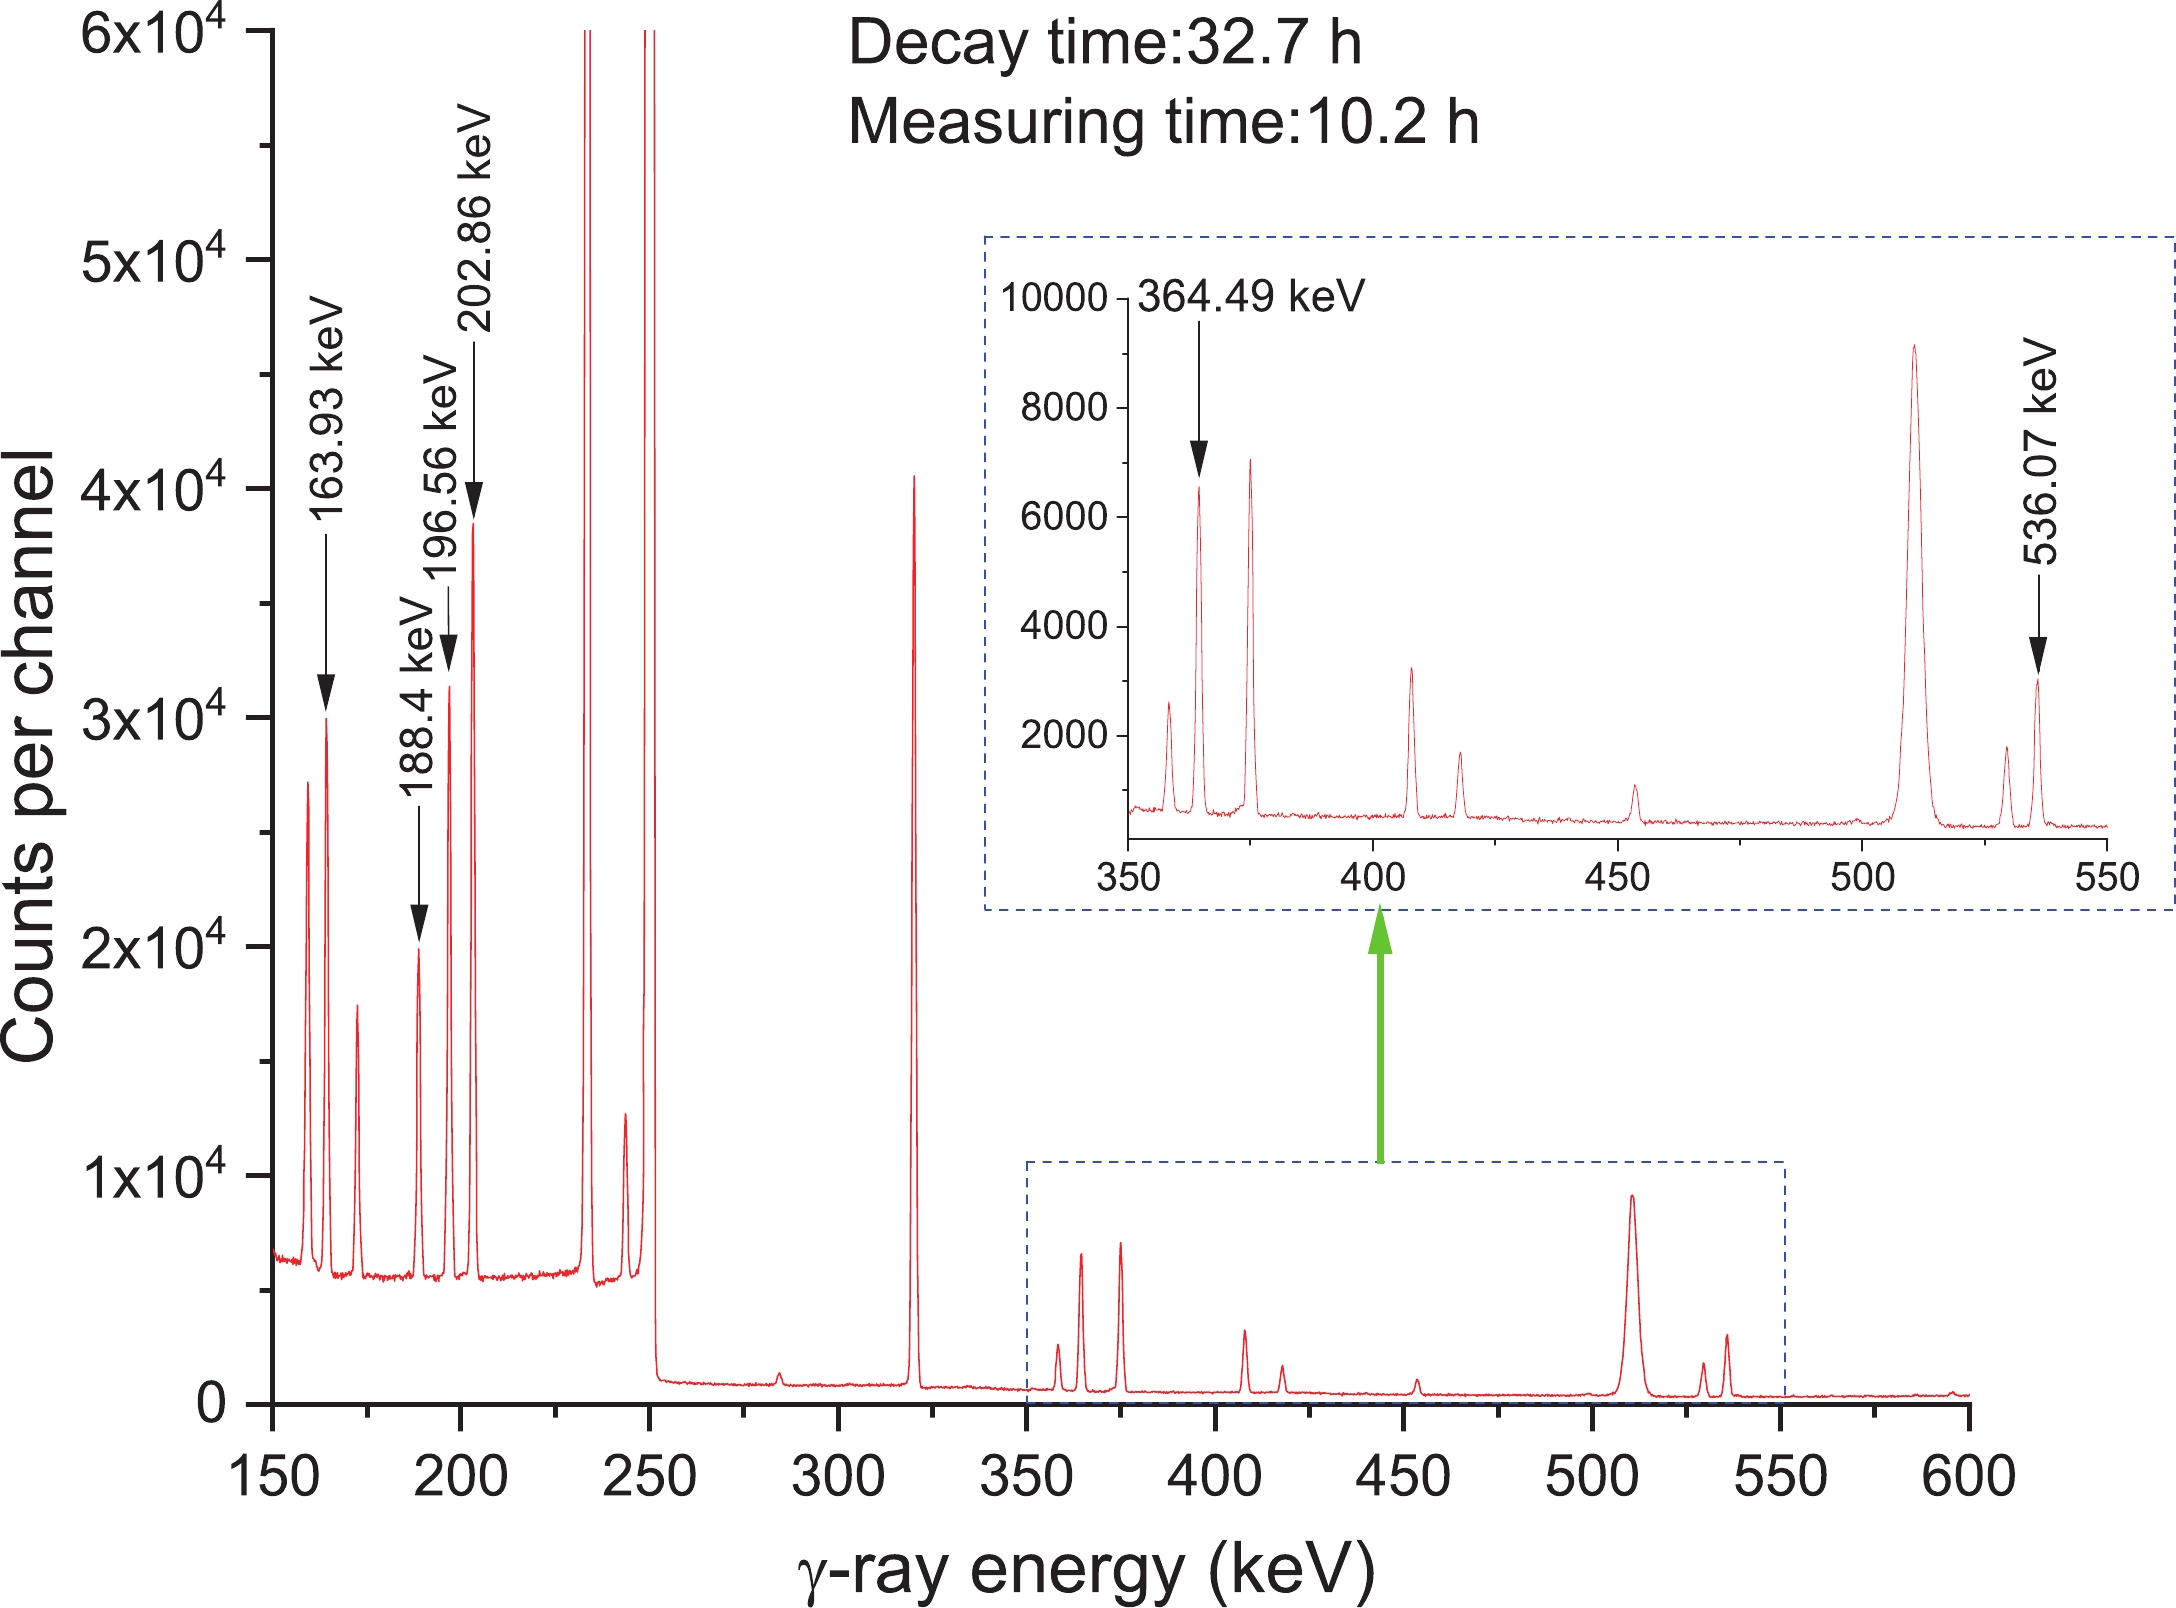
Figure 3. (color online) γ-ray spectrum of xenon obtained with a 68% relative efficient HPGe detector at En=14.8 MeV, 32.7 h after the neutron activation of xenon isotopes, and an acquisition time of 10.2 h. The lines of interest are 188.4, 202.86, 163.93, 196.56, and 364.49 keV. In the energy ranges of 350–550 keV, the enlarged portion of the spectrum is given.
Table 2 presents the above mentioned reactions, the characteristics of the corresponding reaction product radioactive decay, and their abundance.
Abundance of target isotope (%) Reaction E-threshold/MeV Mode of decay (%) T1/2 Eγ/keV Iγ (%) 0.0952(3) 124Xe(n, 2n)123Xe 10.569 EC(100) 2.08(2) h 148.9 48.9(6) 0.0890(2) 126Xe(n, 2n)125Xe 10.105 EC(100) 16.9(2) h 188.42 53.8(3) 1.9102(8) 128Xe(n, 2n)127Xe 9.686 EC(100) 39.346(3) d 202.86 68.7(12) 4.0710(13) 130Xe(n, 2n)129mXe 9.566 IT(100) 8.88(2) d 196.56 4.59(14) 26.9086(33) 132Xe(n, 2n)131mXe 9.170 IT(100) 11.84(4) d 163.93 1.95(6) 4.0710(13) 130Xe(n,p)130I 2.179 β-(100) 12.36(1) h 536.07 99 21.232(30) 131Xe(n,p)131I 0.190 β-(100) 8.0252(6) d 364.49 81.5(8) 26.9086(33) 132Xe(n,p)132I 2.814 β-(100) 2.295(13) h 522.65 16.0(5) 100 27Al(n,α)24Na 3.249 β-(100) 14.997(12) h 1368.6 100 100 93Nb(n, 2n)92mNb 8.972 EC (100) 10.15(2) d 934.44 99.15(4) The numbers in brackets represent the uncertainties, for example, 0.0952(3) % means (0.0952±0.0003)%, while 2.08(2) h means (2.08±0.02) h. Table 2. Reactions and decay data of the associated activation products (obtained from Ref. [1]).
-
The reaction cross-sections were calculated as follows [27-31]:
${\sigma _x} = \frac{{{{[S\varepsilon {I_\gamma }\eta KMD]}_0}}}{{{{[S\varepsilon {I_\gamma }\eta KMD]}_x}}}\frac{{{{[\lambda AFC]}_x}}}{{{{[\lambda AFC]}_0}}}{\sigma _0}, $

(1) where the subscripts 0 and x denote the standard monitor and measured reactions values, respectively, while F represents an activity correction factor:
$ F={f}_{c}\times {f}_{s}\times {f}_{g}\times {f}_{\Omega } ,$

(2) where fc, fs, fg, and fΩ denote the correcting factors representing the coincidence summing impact of the cascade γ-rays created by the nuclides, the self-absorption of the γ-rays, the samples counting geometries, and the solid angle of neutron flux, respectively. The calculations of the coincidence summing correction factors were based on the approach explained in previous studies [32,33].
Some of these factors were calculated by the following weighted average formula:
$ {f}_{s}=6{\displaystyle {\int }_{0}^{1}\frac{\mu r(1-{r}^{2})}{1-{\rm e}^{-2\mu \sqrt{1-{r}^{2}}}}}{\rm d}r , $

(3) $ {f}_{g}=3{\displaystyle {\int }_{0}^{1}\left(1+\frac{\sqrt{1-{r}^{2}}}{L}\right)}^{2}r\sqrt{1-{r}^{2}}{\rm d}r , $

(4) $ {f}_{\Omega }=\frac{{\scriptstyle \dfrac{1}{2}}({\Omega }_{1}+{\Omega }_{3})}{{\Omega }_{2}} ,$

(5) where μ denotes the coefficient of linear attenuation at photon energy E (see Table 2), L is the distance from the specimen to the HPGe surface, while Ω1, Ω2, Ω3 represent the solid angle of the front monitor disk, sample and back monitor disks relative to the center of the target, respectively. The coefficient of mass attenuation (μ/ρ) was obtained using the γ-energy taken from a previous study [34]. The linear attenuation coefficient of natural xenon gas was determined as
$ \mu =\rho (\mu /\rho ) $ , where ρ (in g/cm3) represents the Xe gas density in stainless-steel spheres. The linear attenuation coefficient of stainless steel was determined as$\mu = 7.86(\mu /\rho )$ , where the density of iron is 7.86 g/cm3. The comprehensive self-absorption correction factors are presented in Table 3, and the results are distributed between 1.072 and 2.014. The value of the correction factor fΩ is 1.0756.γ-ray energy
/keV(μ/ρ)/(cm2/g) μ/cm−1 Sample densities ρ/(g/cm3) Correction factors fs Fe Xe Fe No. Xe 148.9 0.2003 0.7486 1.5740 1 0.9298 1.2420 2.014 2 0.4385 0.5857 1.477 3 0.8920 1.1916 1.970 4 0.4116 0.5498 1.451 5 0.4082 0.5453 1.447 163.93 0.1824 0.6243 1.4333 1 0.7754 1.2420 1.823 2 0.3657 0.5857 1.396 3 0.7439 1.1916 1.788 4 0.3432 0.5498 1.375 5 0.3404 0.5453 1.372 188.42 0.1577 0.4557 1.2393 1 0.5660 1.2420 1.582 2 0.2669 0.5857 1.291 3 0.5430 1.1916 1.558 4 0.2506 0.5498 1.276 5 0.2485 0.5453 1.274 196.56 0.1495 0.3997 1.1748 1 0.4964 1.2420 1.506 2 0.2341 0.5857 1.258 3 0.4763 1.1916 1.486 4 0.2197 0.5498 1.245 5 0.2179 0.5453 1.243 202.86 0.1450 0.3704 1.1394 1 0.4600 1.2420 1.467 2 0.2169 0.5857 1.240 3 0.4414 1.1916 1.449 4 0.2036 0.5498 1.228 5 0.2020 0.5453 1.227 364.49 0.0996 0.1427 0.7832 1 0.1772 1.2420 1.184 2 0.0836 0.5857 1.106 3 0.1700 1.1916 1.178 4 0.0784 0.5498 1.102 5 0.0778 0.5453 1.102 522.65 0.0825 0.0938 0.6487 3 0.1117 1.1916 1.122 4 0.0516 0.5498 1.073 536.07 0.0816 0.0919 0.6412 1 0.1141 1.2420 1.123 2 0.0538 0.5857 1.075 3 0.1095 1.1916 1.120 4 0.0505 0.5498 1.072 5 0.0501 0.5453 1.072 Table 3. Correction factors for the self-absorption of the sample at a given gamma-ray energy. The angles of the five samples relative to the beam are 0° (No. 1), 45° (No. 4), 90° (No. 2), 110° (No. 5), and 135° (No. 3), respectively.
In the process of calculating the cross sections of the 130Xe(n,2n)129mXe, 132Xe(n,2n)131mXe, 130Xe(n,p)130I, and 131Xe(n,p)131I reactions, the contributions of the interfering 129Xe(n, n′)129mXe, 131Xe(n, n′)131mXe, 131Xe(n, d)130I, and 132Xe(n, d)131I reactions were respectively subtracted using the following equations [7,35]:
$ \begin{aligned}[b] \sigma {(^{{\rm{nat}}}}{{\rm Xe}(n,x}{{\rm{)}}^{129m}}{\rm{Xe}}) =& 0.040710\sigma {(^{{\rm{130}}}}{{\rm Xe}(n,2n}{{\rm{)}}^{129m}}{\rm{Xe}}) \\&+ 0.264006\sigma {(^{{\rm{129}}}}{\rm{Xe}}{{(n,n')}^{129m}}{\rm{Xe}}) \\ =&{\frac{{{{[S\varepsilon {I_\gamma }\eta KMD]}_0}}}{{{{[S\varepsilon {I_\gamma }KMD]}_x}}}\frac{{{{[\lambda AFC]}_x}}}{{{{[\lambda AFC]}_0}}}{\sigma _0}},\\[-16pt] \end{aligned} $

(6) $\begin{aligned}[b] \sigma {(^{{\rm{nat}}}}{{\rm Xe}(n,x}{{\rm{)}}^{131m}}{\rm{Xe}}) =& 0.269086\sigma {(^{{\rm{132}}}}{{\rm Xe}(n,2n}{{\rm{)}}^{131m}}{\rm{Xe}}) \\&+ 0.21232\sigma {(^{{\rm{131}}}}{\rm{Xe}}{{({n},{n'})}^{131m}}{\rm{Xe}})\\ =&{ \frac{{{{[S\varepsilon {I_\gamma }\eta KMD]}_0}}}{{{{[S\varepsilon {I_\gamma }KMD]}_x}}}\frac{{{{[\lambda AFC]}_x}}}{{{{[\lambda AFC]}_0}}}{\sigma _0}},\\[-16pt] \end{aligned} $

(7) $ \begin{aligned}[b] \sigma {(^{{\rm{nat}}}}{{\rm Xe}(n,x}{{\rm{)}}^{130}}{\rm{I}}) =& 0.040710\sigma {(^{{\rm{130}}}}{{\rm Xe}(n,p}{{\rm{)}}^{130}}{\rm{I}})\\& + 0.21232\sigma {(^{{\rm{131}}}}{{\rm Xe}(n,d}{{\rm{)}}^{130}}{\rm{I}})\\ =&{{\rm{ }}\frac{{{{[S\varepsilon {I_\gamma }\eta KMD]}_0}}}{{{{[S\varepsilon {I_\gamma }KMD]}_x}}}\frac{{{{[\lambda AFC]}_x}}}{{{{[\lambda AFC]}_0}}}{\sigma _0}}, \end{aligned} $

(8) $\begin{aligned}[b] \sigma {(^{{\rm{nat}}}}{{\rm Xe}(n,x}{{\rm{)}}^{131}}{\rm{I}}) = &0.21232\sigma {(^{{\rm{131}}}}{{\rm Xe}(n,p}{{\rm{)}}^{131}}{\rm{I}}) \\&+ 0.269086\sigma {(^{{\rm{132}}}}{{\rm Xe}(n,d}{{\rm{)}}^{131}}{\rm{I}})\\ =&{ \frac{{{{[S\varepsilon {I_\gamma }\eta KMD]}_0}}}{{{{[S\varepsilon {I_\gamma }KMD]}_x}}}\frac{{{{[\lambda AFC]}_x}}}{{{{[\lambda AFC]}_0}}}{\sigma _0}}. \end{aligned} $

(9) The interfering 131Xe(n, d)130I and 132Xe(n, d)131I reaction cross-sections were 0.09, 0.15, 0.22, 0.32, and 0.50 mb and 0.30, 0.41, 0.56, 0.80, and 1.11 mb, respectively, at 13.5, 13.8, 14.1, 14.4, and 14.8 MeV, respectively. These values were obtained from the interpolations performed using JEFF-3.3 [16]. The minor contributions to the activities of the product nuclei 130I and 132I from the interfering 132Xe(n, t)130I and 134Xe(n, t)132I reactions were neglected because their cross-sections were below 0.04 mb in the 13–15 MeV range [16]). Unfortunately, neither the experimental measurement nor evaluated data were available for the 129Xe(n, n′)129mXe and 131Xe(n, n′)131mXe reactions. Hence, theoretical calculations were conducted to infer these data.
-
Our primary sources of uncertainty were the counting statistics (0.2%–22%), detector efficiency (3%), cross section of the monitor reaction (0.4%–1.5%), sample weight (0.05%–0.9%), measurements and decay times (0.1%), and the self-absorption of γ-ray (1%). Other uncertainties originated from the experimental and standard nuclear parameters, including the product nuclear half-lives (0.01%–1.1%), specific γ-ray branching ratios (0.2%– 3.1%), and target isotope abundance (0.02%–0.3%). We adopted a quadratic sum rule for the uncertainty analysis [36].
-
The cross sections of the 124Xe(n, 2n)123Xe, 126Xe(n, 2n)125Xe, 128Xe(n, 2n)127Xe, 130Xe(n, 2n)129mXe, 132Xe(n, 2n)131mXe, 130Xe(n, p)130I, 131Xe(n, p)131I, and 132Xe(n, p)132I reactions were assessed by the TALYS-1.95 software [20] up to 20 MeV. TALYS-1.95 is a nuclear model code applied to replicate nuclear reactions comprising tritons, neutrons, photons, protons, deuterons, 3He, and α-particles aimed at the target nuclei. It can be adopted for the reactions with incident energies up to 200 MeV [37-41]. The different parameters in the TALYS-1.95 code were adjusted according to our measured data and previous experiments conducted by other researchers for the 124Xe(n,2n)123Xe, 126Xe(n,2n)125Xe, 130Xe(n,2n)129mXe, 132Xe(n,2n)131mXe, 130Xe(n,p)130I, 131Xe(n,p)131I, and 132Xe(n,p)132I reactions.
-
The offline γ-ray spectroscopic measuring technique was adopted to obtain cross-sections for the 124Xe(n, 2n)123Xe, 126Xe(n, 2n)125Xe, 128Xe(n, 2n)127Xe, 130Xe(n, 2n)129mXe, 132Xe(n, 2n)131mXe, 130Xe(n, p)130I, 131Xe(n, p)131I, and 132Xe(n, p)132I reactions. The obtained results were then examined with those from the JENDL-4.0 [15], ENDF/B-VIII.0 [16], CENDL-3 [17], JEFF-3.3 [18], and RUSFOND [19] data libraries and TALYS-1.95 model code [20]. For the first time, this paper reports the cross-sections of several reactions (excluding the 124Xe(n, 2n)123Xe and 132Xe(n, p)132I) at 13.5, 13.8, and 14.1 MeV (see Table 4).
Reaction This study Literature values En/MeV σ/mb En/MeV σ/mb Reference 124Xe(n,2n)123Xe 13.5±0.2 942±96 14.6 997±80 [10] 13.8±0.2 1017±143 14.4 1130±110 [11] 14.1±0.2 1099±141 14.0 1436±35 [12] 14.4±0.2 1209±156 14.4 1585±33 [12] 14.8±0.2 1293±147 14.7 1618±33 [12] 11.36 80.36±5.03 [13] 11.86 228.56±12.17 [13] 12.36 391.22±34.25 [13] 12.85 570.07±28.46 [13] 13.35 676.28±39.99 [13] 13.85 793.88±38.13 [13] 14.35 839.57±46.53 [13] 14.8 909.44±46.87 [13] 126Xe(n,2n)125Xe 13.5±0.2 1450±117 14.6 1480±130 [10] 13.8±0.2 1498±119 14.4 1355±165 [11] 14.1±0.2 1620±122 14.4±0.2 1702±127 14.8±0.2 1795±113 Continued on next page Table 4. Measured cross-sections of xenon isotopes from this study compared with literature values.
Table 4-continued from previous page Reaction This study Literature values En/MeV σ/mb En/MeV σ/mb Reference 128Xe(n,2n)127Xe 13.5±0.2 1638±99 14.6 1752±140 [10] 13.8±0.2 1640±99 14.4 1530±170 [11] 14.1±0.2 1652±100 14.4±0.2 1696±102 14.8±0.2 1743±105 130Xe(n,2n)129mXe 13.5±0.2 1085±108 14.6 2031±165 [10] 13.8±0.2 1121±113 14.4 1435±130 [11] 14.1±0.2 1182±118 14.4±0.2 1242±124 14.8±0.2 1321±132 132Xe(n,2n)131mXe 13.5±0.2 1004±101 14.6 1000±80 [10] 13.8±0.2 1075±107 14.4 775±65 [11] 14.1±0.2 1085±109 14.4±0.2 1103±110 14.8±0.2 1163±116 130Xe(n,p)130I 13.5±0.2 6.7±0.7 14.6 11.1±1.2 [10] 13.8±0.2 7.0±0.8 14.4 6.7±0.8 [11] 14.1±0.2 7.4±0.8 14.4±0.2 8.0±0.8 14.8±0.2 8.0±0.8 131Xe(n,p)131I 13.5±0.2 5.5±0.6 14.6 7.0±0.8 [10] 13.8±0.2 6.1±0.6 14.4 5.3±0.6 [11] 14.1±0.2 6.5±0.5 14.4±0.2 6.7±0.5 14.8±0.2 7.3±0.6 32Xe(n,p)132I 13.5±0.2 4.0±1.0 14.6 3.7±0.4 [10] 14.4±0.2 4.1±1.0 14.4 2.5±0.3 [11] Monitor reactions 27Al(n,α)24Na 13.5±0.2 125.7±0.8 [24] 13.8±0.2 123.2±0.7 [24] 14.1±0.2 121.6±0.6 [24] 14.4±0.2 116.8±0.4 [24] 14.8±0.2 111.9±0.5 [24] 93Nb(n,2n)92mNb 13.5±0.2 457.9±6.8 [24] 13.8±0.2 457.9±6.8 [24] 14.1±0.2 459.8±6.8 [24] 14.4±0.2 459.8±6.8 [24] 14.8±0.2 459.7±5.0 [24] -
For the 124Xe(n, 2n)123Xe reaction, the gamma-ray with an intensity of Iγ=48.9% and 148.9 keV emitted in the decay of 123Xe was utilized to obtain the cross-section of the 124Xe(n, 2n)123Xe reaction. Sigg and Kuroda [10] used Iγ=63.9% while Kondaiah et al. [11] used Iγ=47.3% for the same ray. However, studies demonstrate that the obtained data for Iγ=48.9% exhibits higher measuring accurately. Accordingly, the cross-sections are modified as follows:
$ {\sigma }_{\rm corrected}=\frac{{I}_{\gamma ({\rm old})}}{{I}_{\gamma ({\rm new})}}{\sigma }_{\rm literature}, $

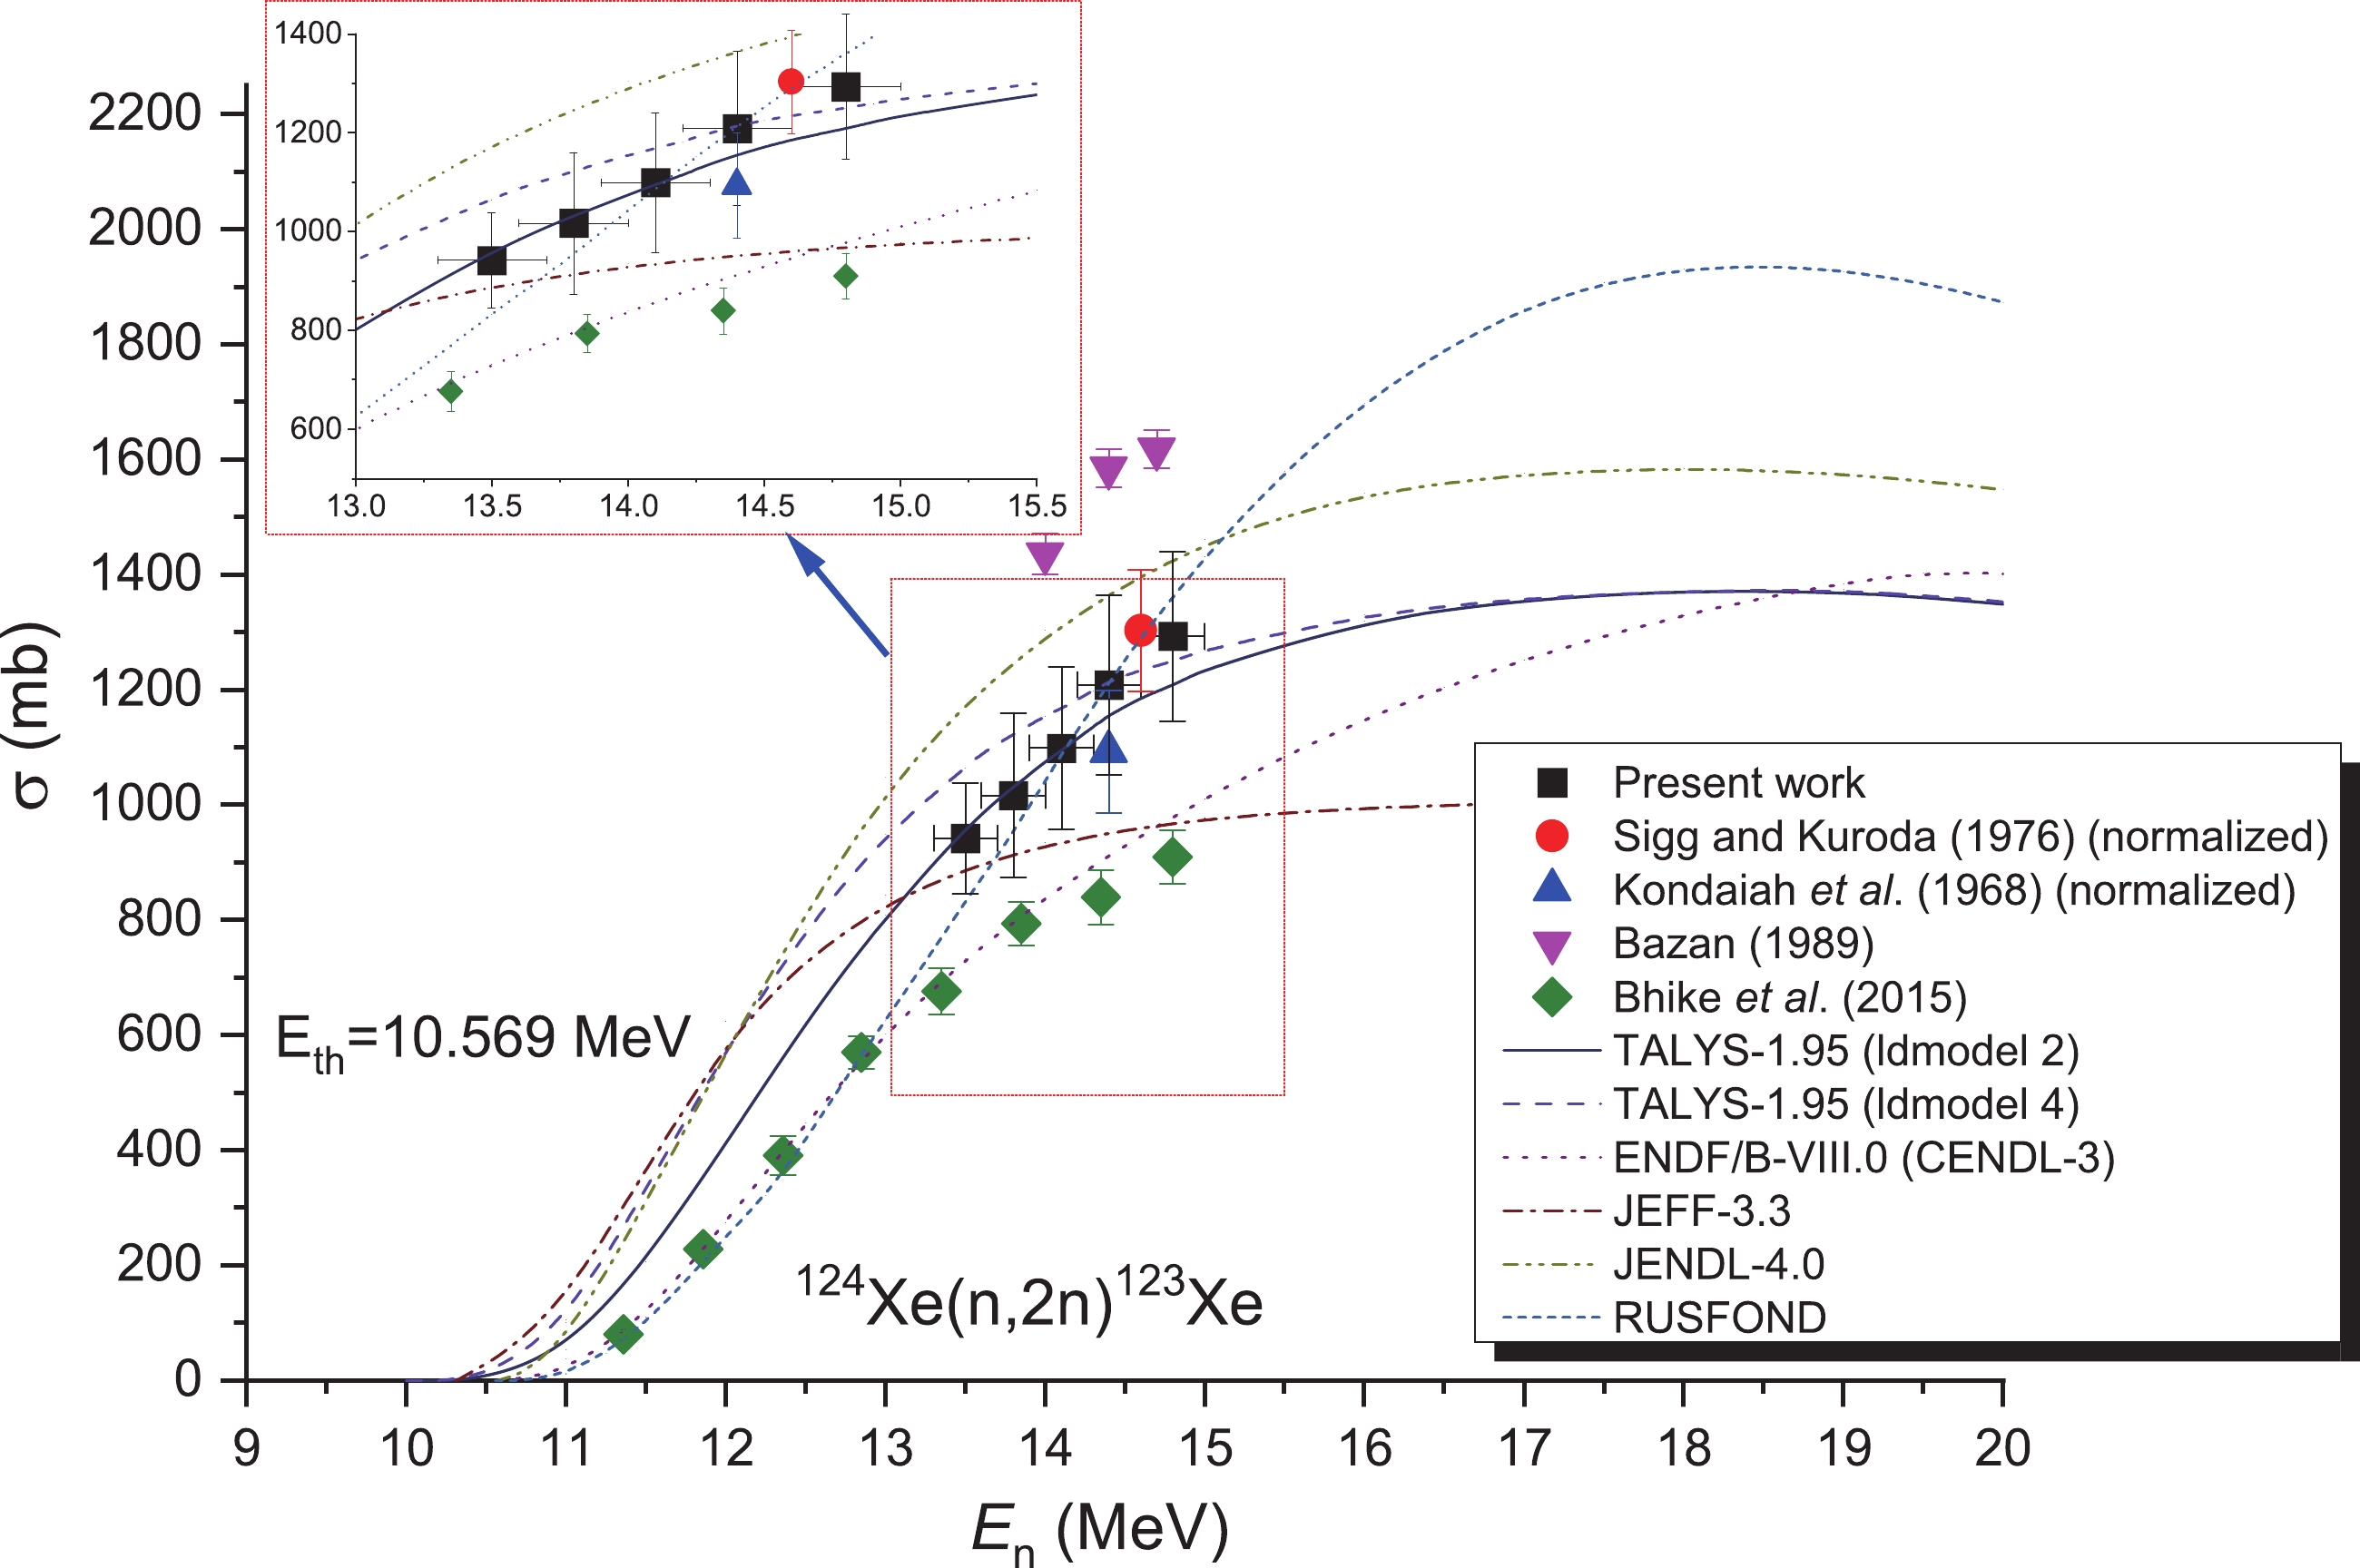
(10) where σliterature is the literature cross-section, Iγ(old) represents the corresponding intensity of the 148.9 keV gamma-ray in the literature, and Iγ(new) is 48.9%. Consequently, the divergence of the four evaluation curves given by databases JENDL-4.0 [15], ENDF/B-VIII.0 [16], CENDL-3 [17], JEFF-3.3 [18], and RUSFOND [19] is very obvious (ENDF/B-VIII.0 [16] is the same as CENDL-3 [17]). The evaluation result of database JENDL-4.0 [15] was 1.5 times that of ENDF/B-VIII.0 [16] (CENDL-3 [17]). The evaluation curves of the ENDF/B-VIII.0 [16] and CENDL-3 [17] data libraries were approximately similar to the simulated curves of excitation processed using TALYS-1.95 [20] (refer to Fig. 4). The results obtained from our measurements increase upon increasing the neutron energy in the 14 MeV range, similar to the theoretical and evaluation data. However, some differences were still observed between the results of earlier experiments. Only four laboratories have reported neutron-induced experimental cross-sections regarding the reaction of 124Xe(n, 2n)123Xe [10–13]. In the 13–15 MeV neutron region of energy, the results obtained in our study are consistent (within the experimental uncertainties) with those obtained by the TALYS-1.95 code (ldmodel 2: The back-shifted Fermi-gas model), with those obtained from the RUSFOND [19] assessments, and with the values reported by Sigg and Kuroda [10] and Kondaiah et al. [11]. In addition, the evaluated data obtained from JENDL-4.0 [15] and Bazan [12] exhibited larger cross-sections than those obtained from the TALYS-1.95 code (ldmodels 2 and 4), ENDF/B-VIII.0 [16] and CENDL-3 [17] assessments, and the study by Bhike et al. [13].
-
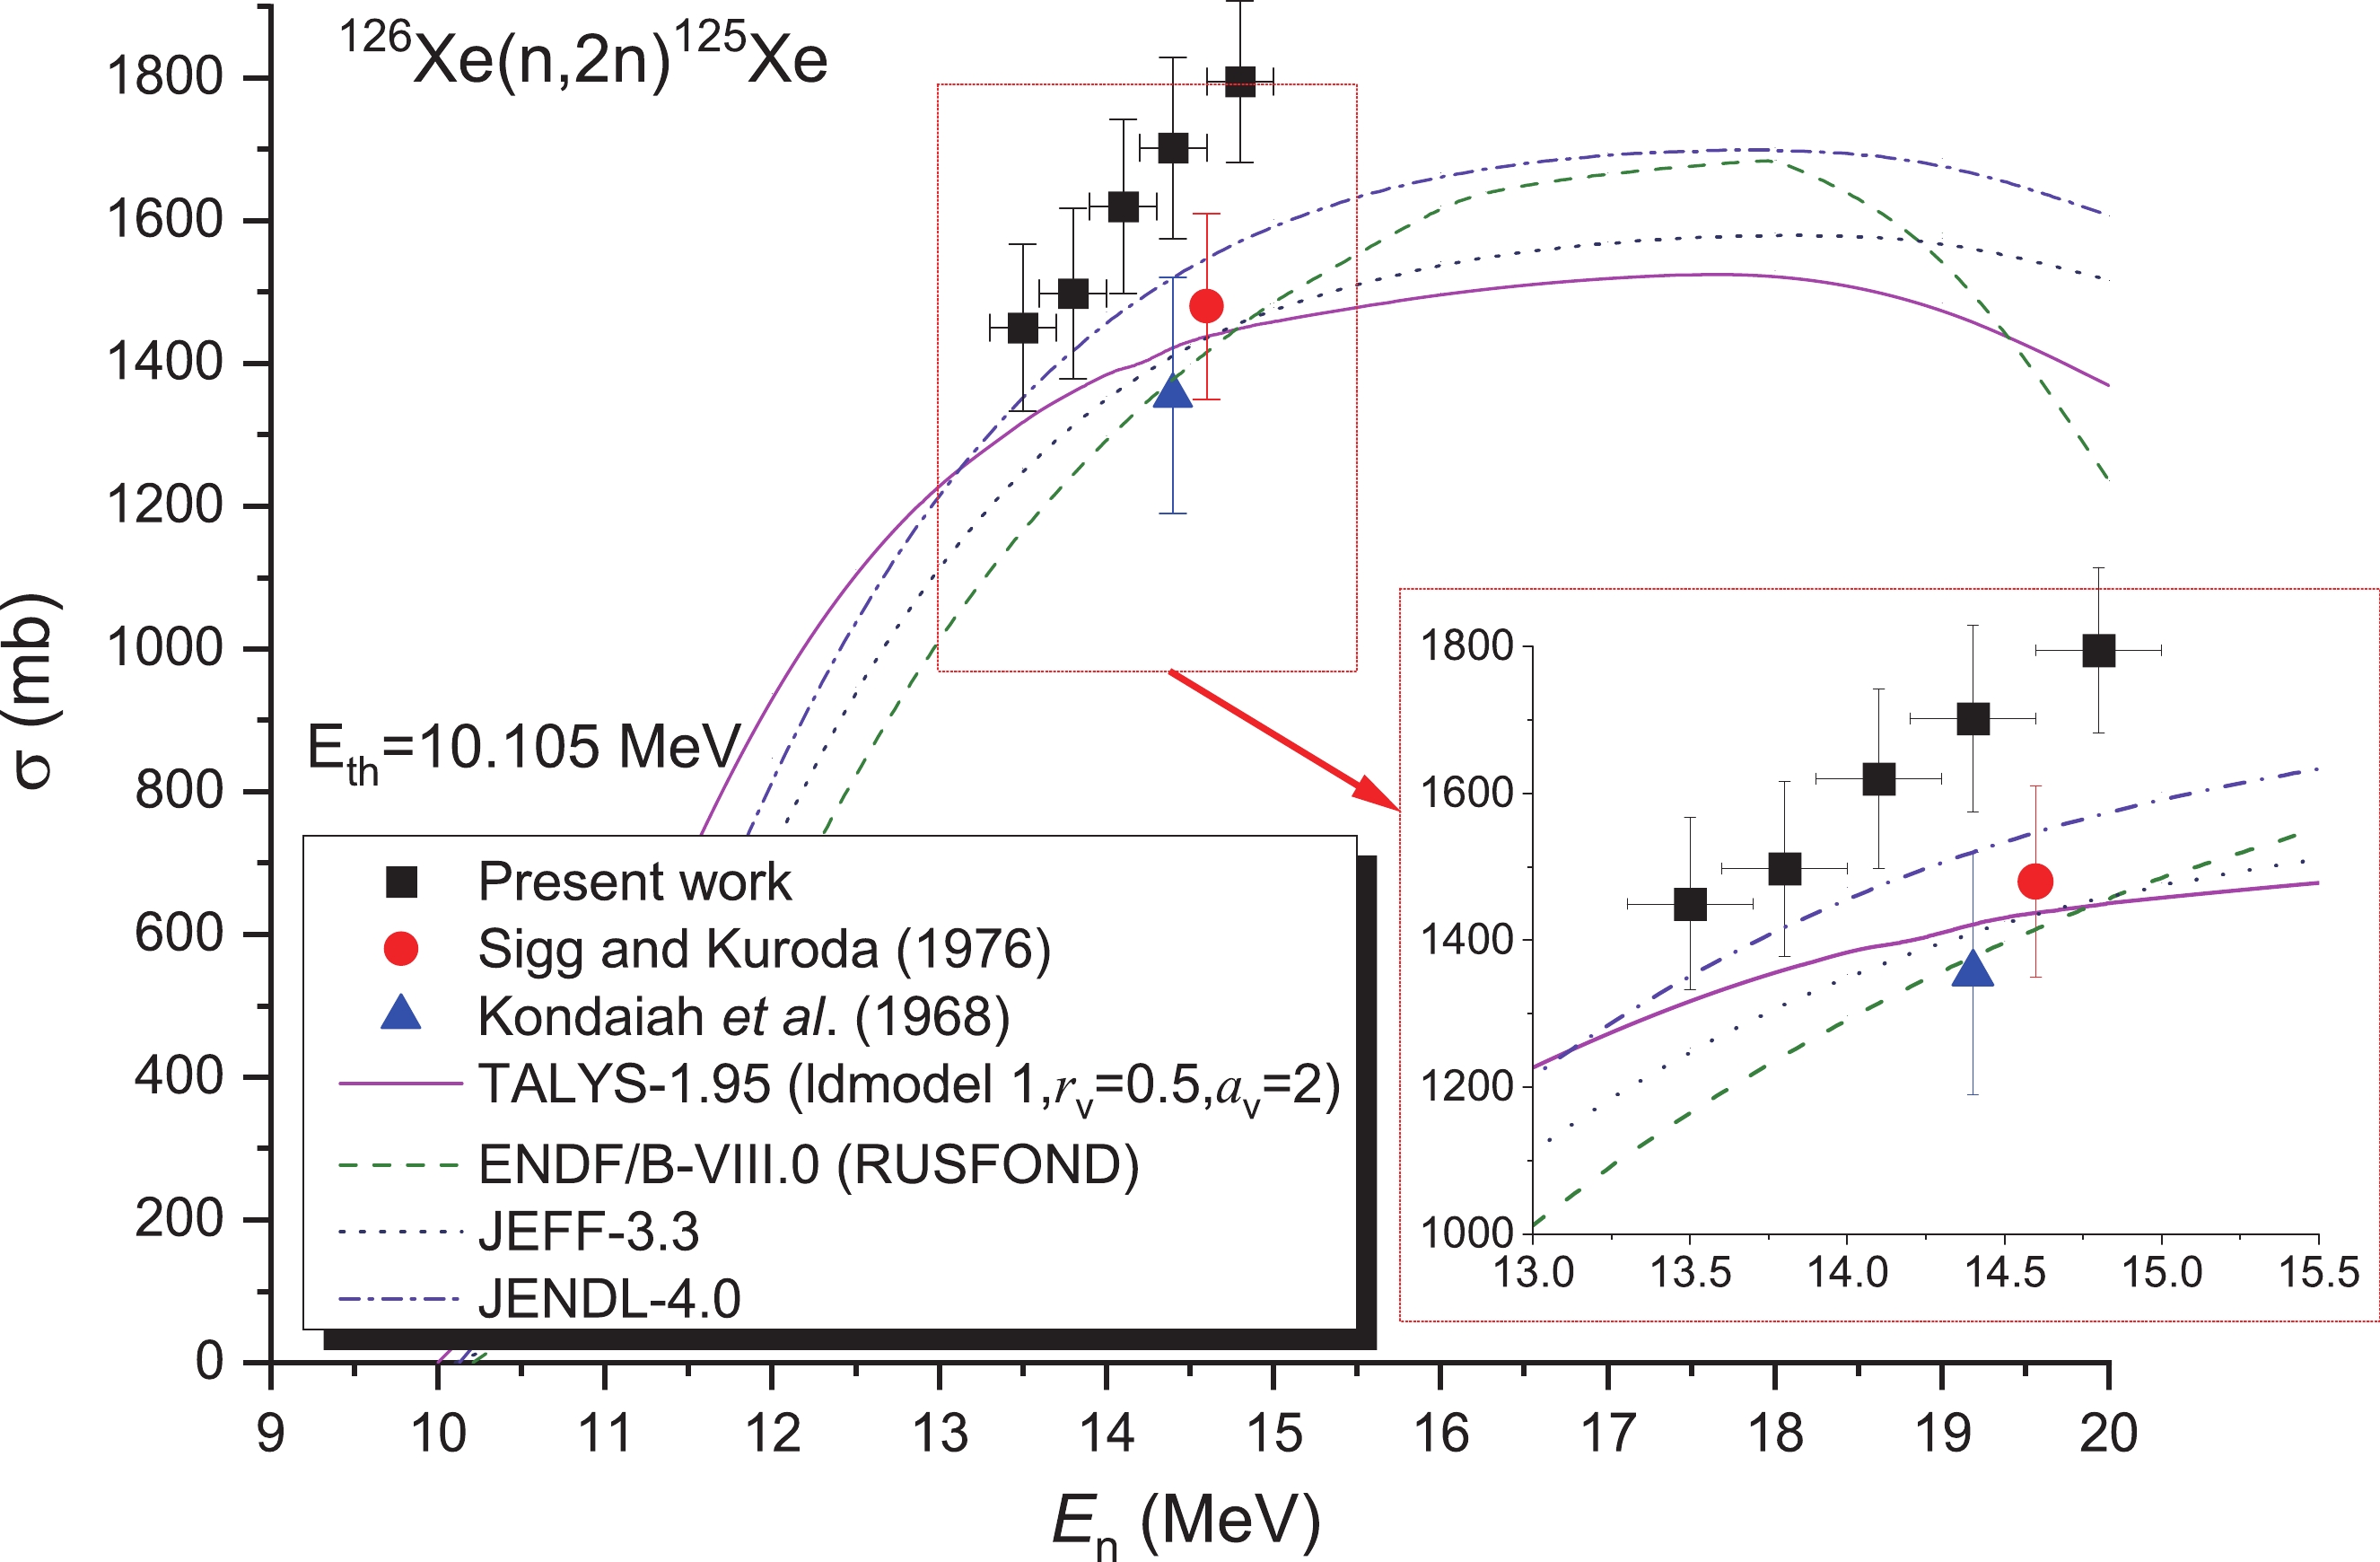
For the 126Xe(n, 2n)125Xe reaction, only two laboratories reported the cross section data in the previous period, and both provided only one energy point [10,11]. In this study, the 126Xe(n, 2n)125Xe reaction cross-sections were determined via the 93Nb(n, 2n)92mNb monitor reaction with a high threshold. The samples were wrapped in a Cd foil to minimize the influence of the low-energy neutrons derived from 2H agglomeration within the tritium target over time and background neutrons. Furthermore, the OMP parameters rv and av were adjusted. Figure 5 presents the cross-sections of the 126Xe(n, 2n)125Xe reaction together with calculations obtained from the TALYS-1.95 code and ENDF/B-VIII.0 [16] (RUSFOND [19]), JEFF-3.3 [18], and JENDL-4.0 [15] libraries (marked as solid lines). At 13.5 and 13.8 MeV, the data measured in this study are consistent with the assessed outcomes from the JENDL-4.0 [15] libraries, and within the limit of experimental uncertainties. In the 13-15 MeV regions, our data are higher than the literature values [10,11] (refer to Table 4 and Fig. 5), as well as the assessed outcomes obtained from the ENDF/B-VIII.0 [16] (RUSFOND [19]) and JEFF-3.3 [18] libraries, and the results of the TALYS-1.95 calculation. ENDF/B-VIII.0 [16] and RUSFOND [19] databases provide the same results. At neutron energies of 13.5, 13.8, and 14.1 MeV, our results are reported for the first time.
-
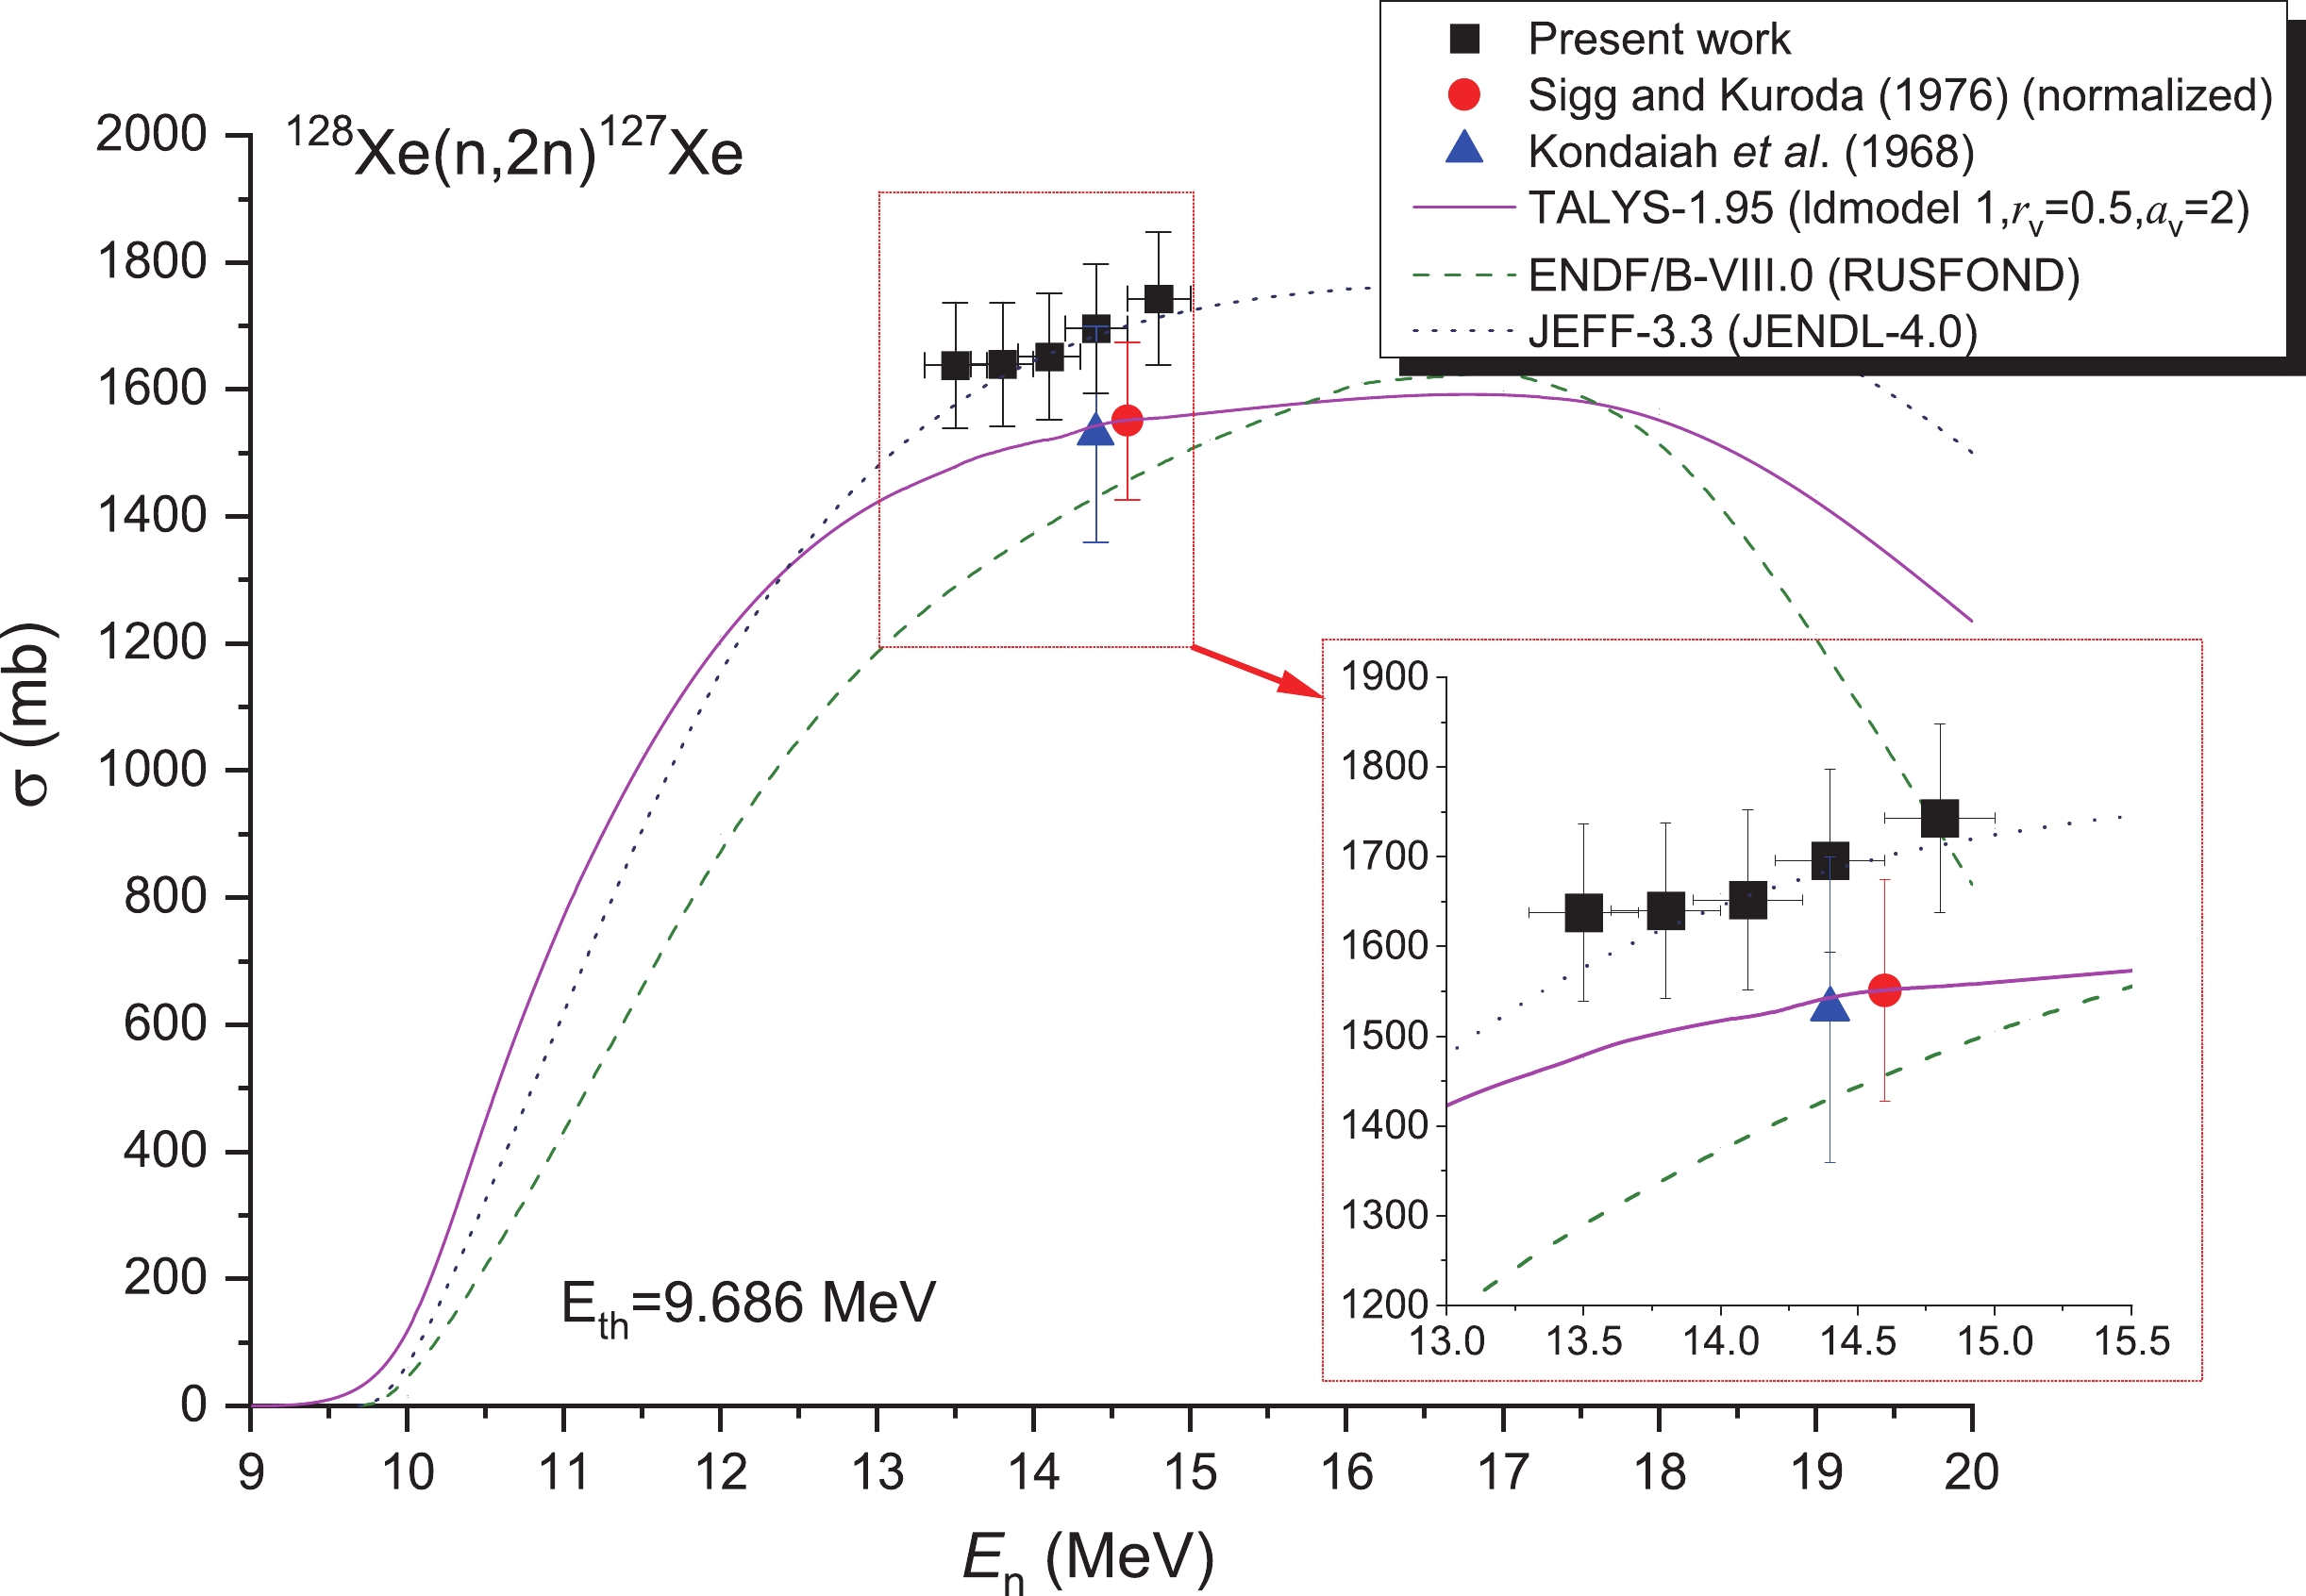
To date, only two laboratories have experimentally determined and reported the cross-sections of the 128Xe(n, 2n)127Xe reaction at one energy point. These values could be found in the corresponding nuclear reaction databases at 14 MeV. Early measurement [10] was carried out using the 202.8 keV (Iγ=60.8%) gamma-ray emitted in the 127Xe. However, for the same ray, data for the Iγ=68.7% has been measured accurately in recent years. Hence, these literature cross sections are corrected by Eq, (10). These results provide a solid foundation to verify the reliability of the experimental results and the validity of the theoretical calculations presented here. In the theoretical calculation, the models for the rv and av parameters of the optical model potential (OMP) were adjusted. The excitation curves in the ENDF/B-VIII.0 [16] (which is similar to RUSFOND [19]) and JEFF-3.3 [18] (JENDL-4.0 [15]) databases are very similar to the theoretical curves of the excitation attained via TALYS-1.95 [20] within the range of neutron energies with a 15 MeV threshold (refer to Fig. 6). Only minor differences among these curves can be observed. Within the limits of experimental uncertainties, the experimental data obtained here agree with the evaluation curves obtained from JEFF-3.3 [18] (JENDL-4.0 [15]) and the corrected cross-sections of Sigg and Kuroda [10], including the experiment values reported by Kondaiah et al. [11].
-
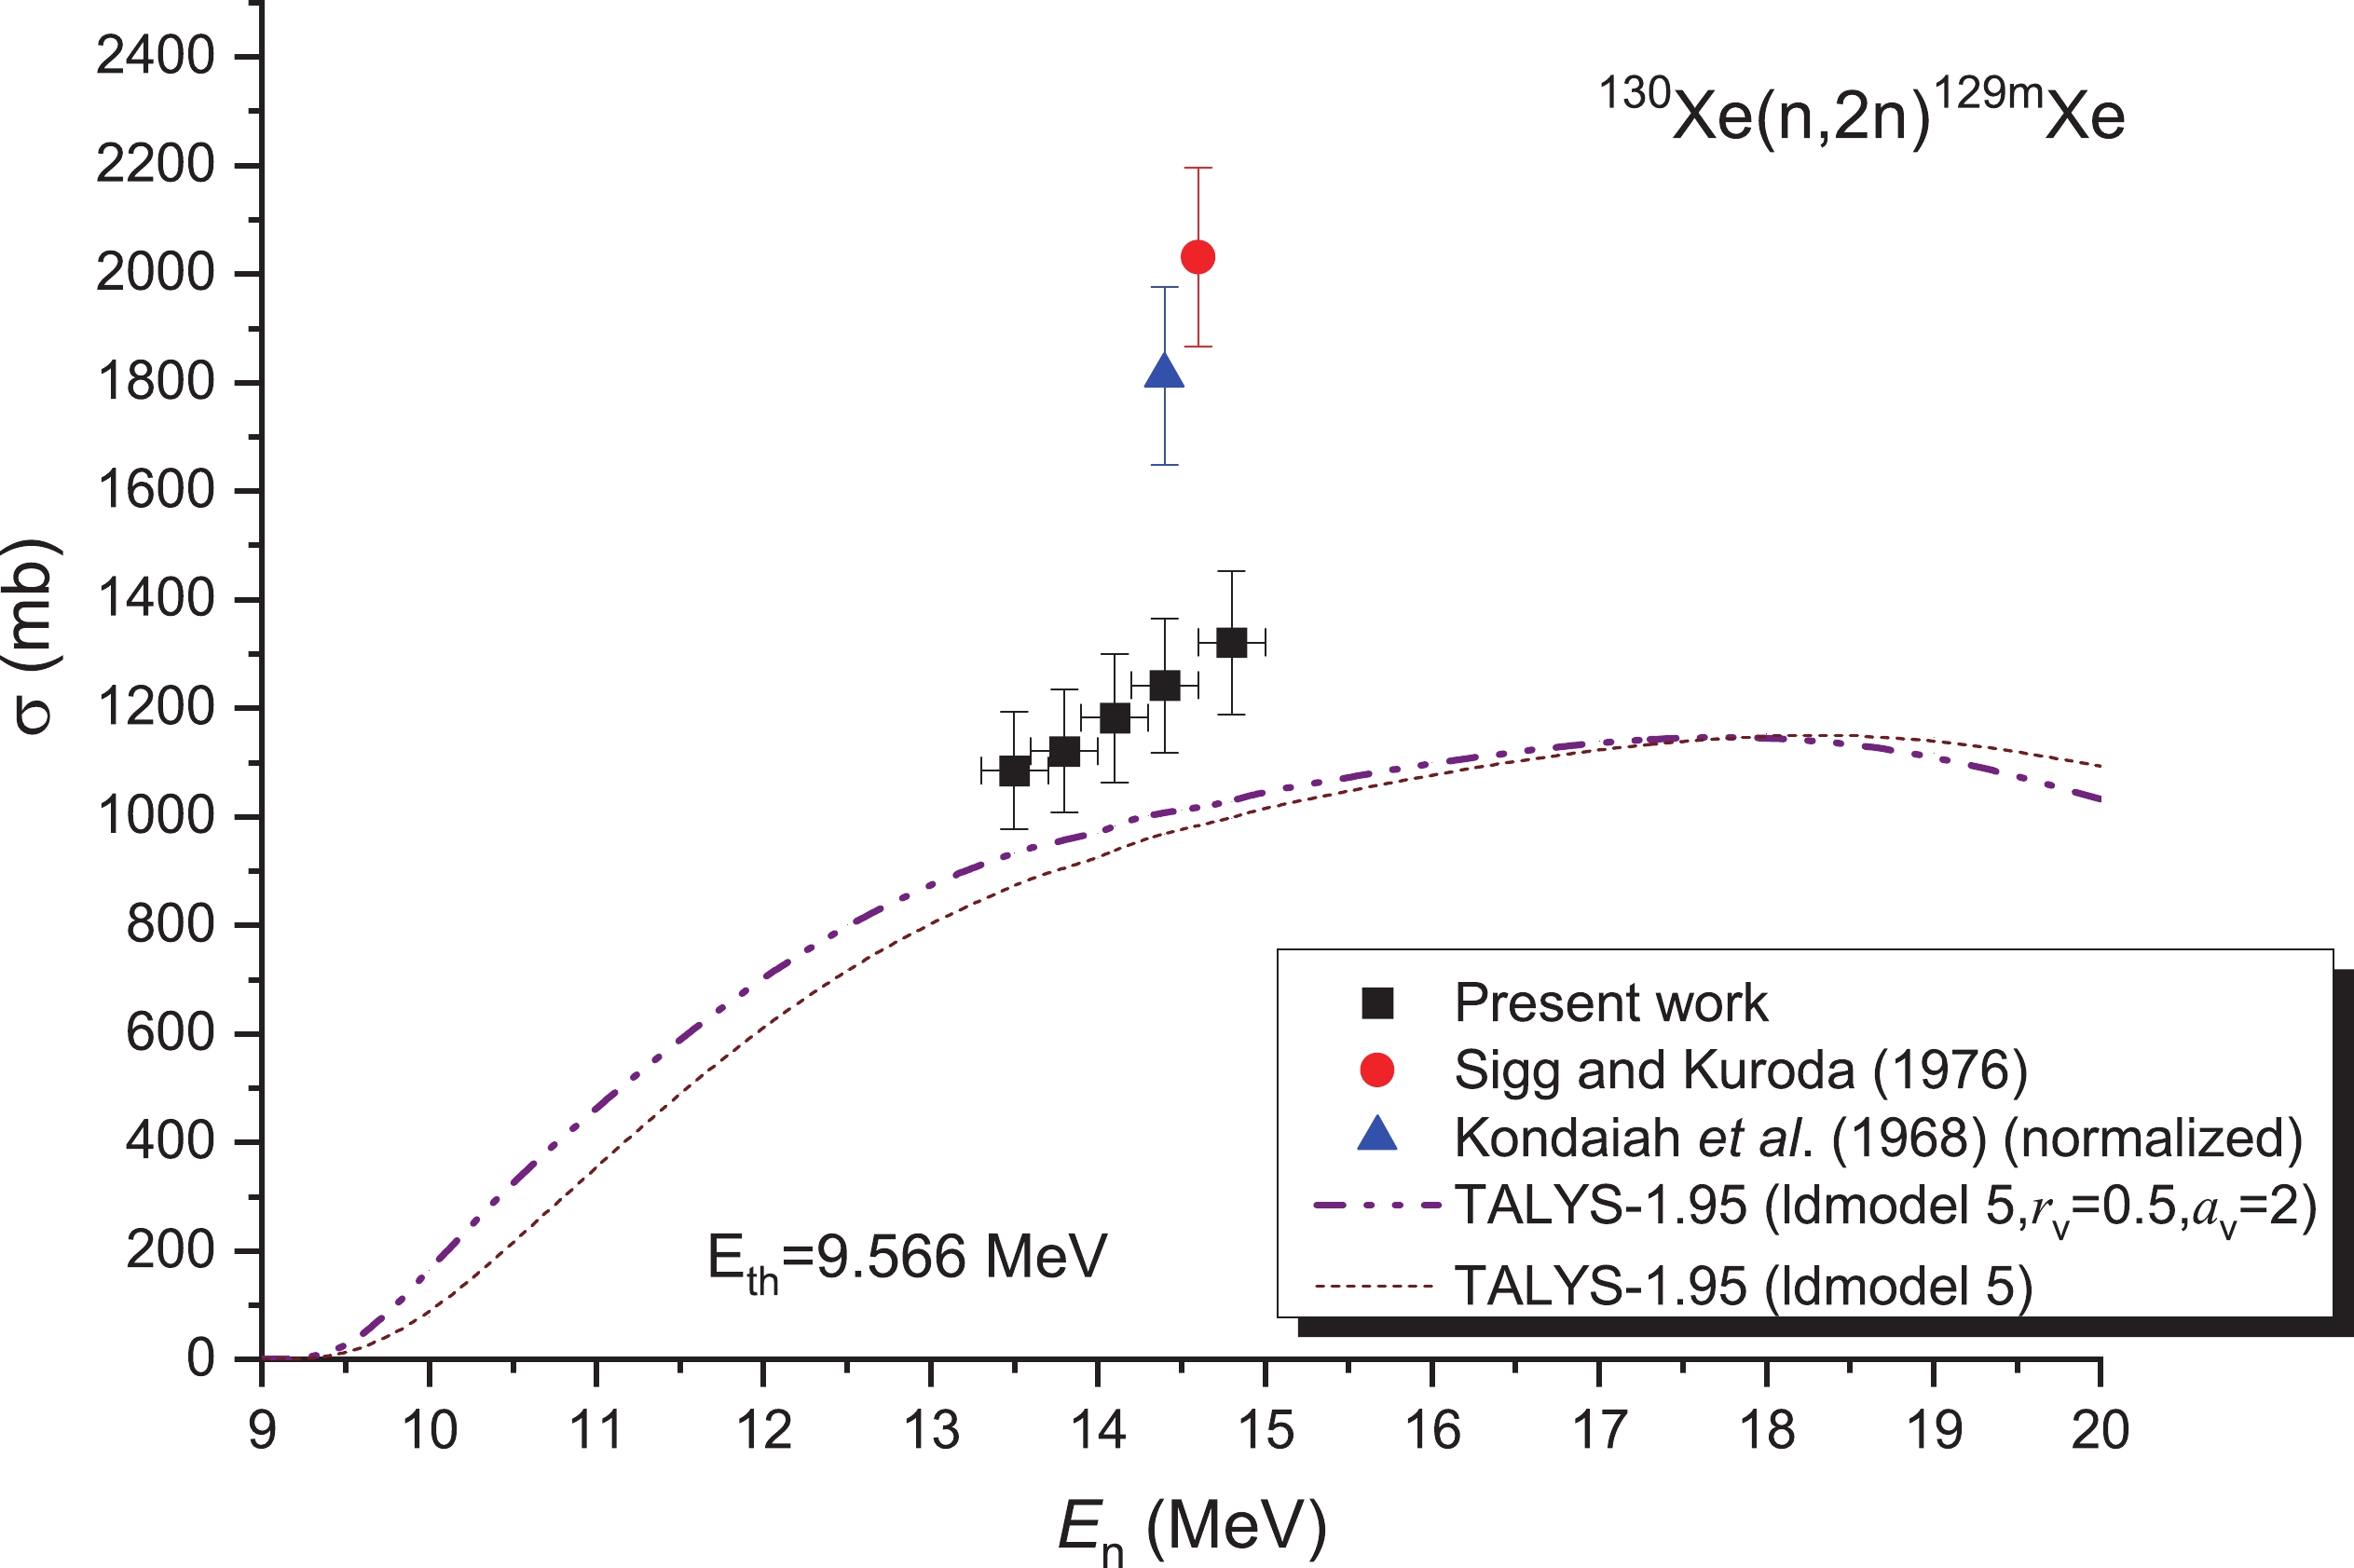
The IAEA database does not contain any evaluation for the cross sections of the 130Xe(n, 2n)129mXe. Only two experimental cross sections were reported for the 13.5–14.8 MeV range [10,11], and these two reports provide the cross-sections at either 14.6 or 14.4 MeV. The OMP parameters rv and av for the 130Xe(n, 2n)129mXe reaction, as well as the model for the level densities, were adjusted. These cross-sections are illustrated in Fig. 7. Our data for the 13.5–14.8 MeV range disagreed with the results of experimental papers [10,11] even when considering the experimental uncertainties. From Fig. 7, it can also be observed that our values are lower than those presented in Refs. [10,11]; however, in the 13–15 MeV region, the values obtained here are higher than those obtained from the TALYS-1.95 code. Furthermore, at the energy of the 14.6 MeV, the values reported by Sigg and Kuroda [10] are approximately 1.6 times greater than the values obtained in this research. This discrepancy was very likely due to the interference of the 129Xe(n, n′)129mXe reaction. To date, neither experimental measurements nor evaluation results have been reported for the 129Xe(n, n′)129mXe reaction. However, according to the theoretical calculation findings of the TALYS-1.95 code (utilizing default parameters), the cross-section values of this reaction at 13–15 MeV are between 143 and 166 mb.
-
For the 132Xe(n, 2n)131mXe reaction, only two works [10,11] have reported cross-sections, both of which provide the cross-section data at one energy value. Although this reaction is also affected by the interfering 131Xe(n, n′)131mXe reaction, its impact is not as large as that of the interfering 129Xe(n, n′)129mXe reaction. The effect of the cross-section value of the 131Xe(n, n′)131mXe reaction at 13–15 MeV is 106–121 mb (theoretical results of the TALYS-1.95 with default parameters). According to Eq. (6), this value was considered in this work. Similarly, Fig. 8 presents the cross section of the 132Xe(n, 2n)131mXe reaction. In addition, for the energy range between 13.3 and 15 MeV, our experimental results are in excellent agreement with the theoretical calculation (ld-model 5: comprising microscopic level densities (Skyrme force) from Hilaire’s combinatorial tables [41]) and the results obtained by Sigg and Kuroda [10] within their uncertainty limits (see Fig. 8); however, these results were larger than the experiment values reported by Kondaiah et al. [11].
-
Figure 9 presents the cross sections of the 130Xe(n,p)130I reaction based on the results reported in [10,11]. In Fig. 9, the values obtained using the TALYS-1.95 calculations and the data obtained from the ENDF/B-VIII.0 [16] (JEFF-3.3 [18] and RUSFOND [19]) and JENDL-4.0 [15] libraries are represented in continuous lines. As illustrated in Fig. 9, there are significant dissimilarities among the results obtained from TALYS-1.95 [20], including the evaluation values acquired using JENDL-4.0 [15] at a neutron energy of approximately 14 MeV. The values evaluated by the JENDL-4.0 [15] for the 130Xe(n, p)130I reaction are 3 times higher those assessed by ENDF/B-VIII.0 [16], JEFF-3.3 [18], and RUSFOND [19] at a neutron energy of approximately 14 MeV. Above the 15 MeV neutron energy, in addition to becoming significantly larger, the difference between the two evaluation curves also changes in the opposite direction. The main reason for this phenomenon is the lack of necessary experimental data. Furthermore, the present result is consistent with the results reported in [11] within the limits of experimental uncertainties. At the 14.8 MeV energy point, the results obtained by Sigg and Kuroda [10] were 40% higher than those measured in this study.
-
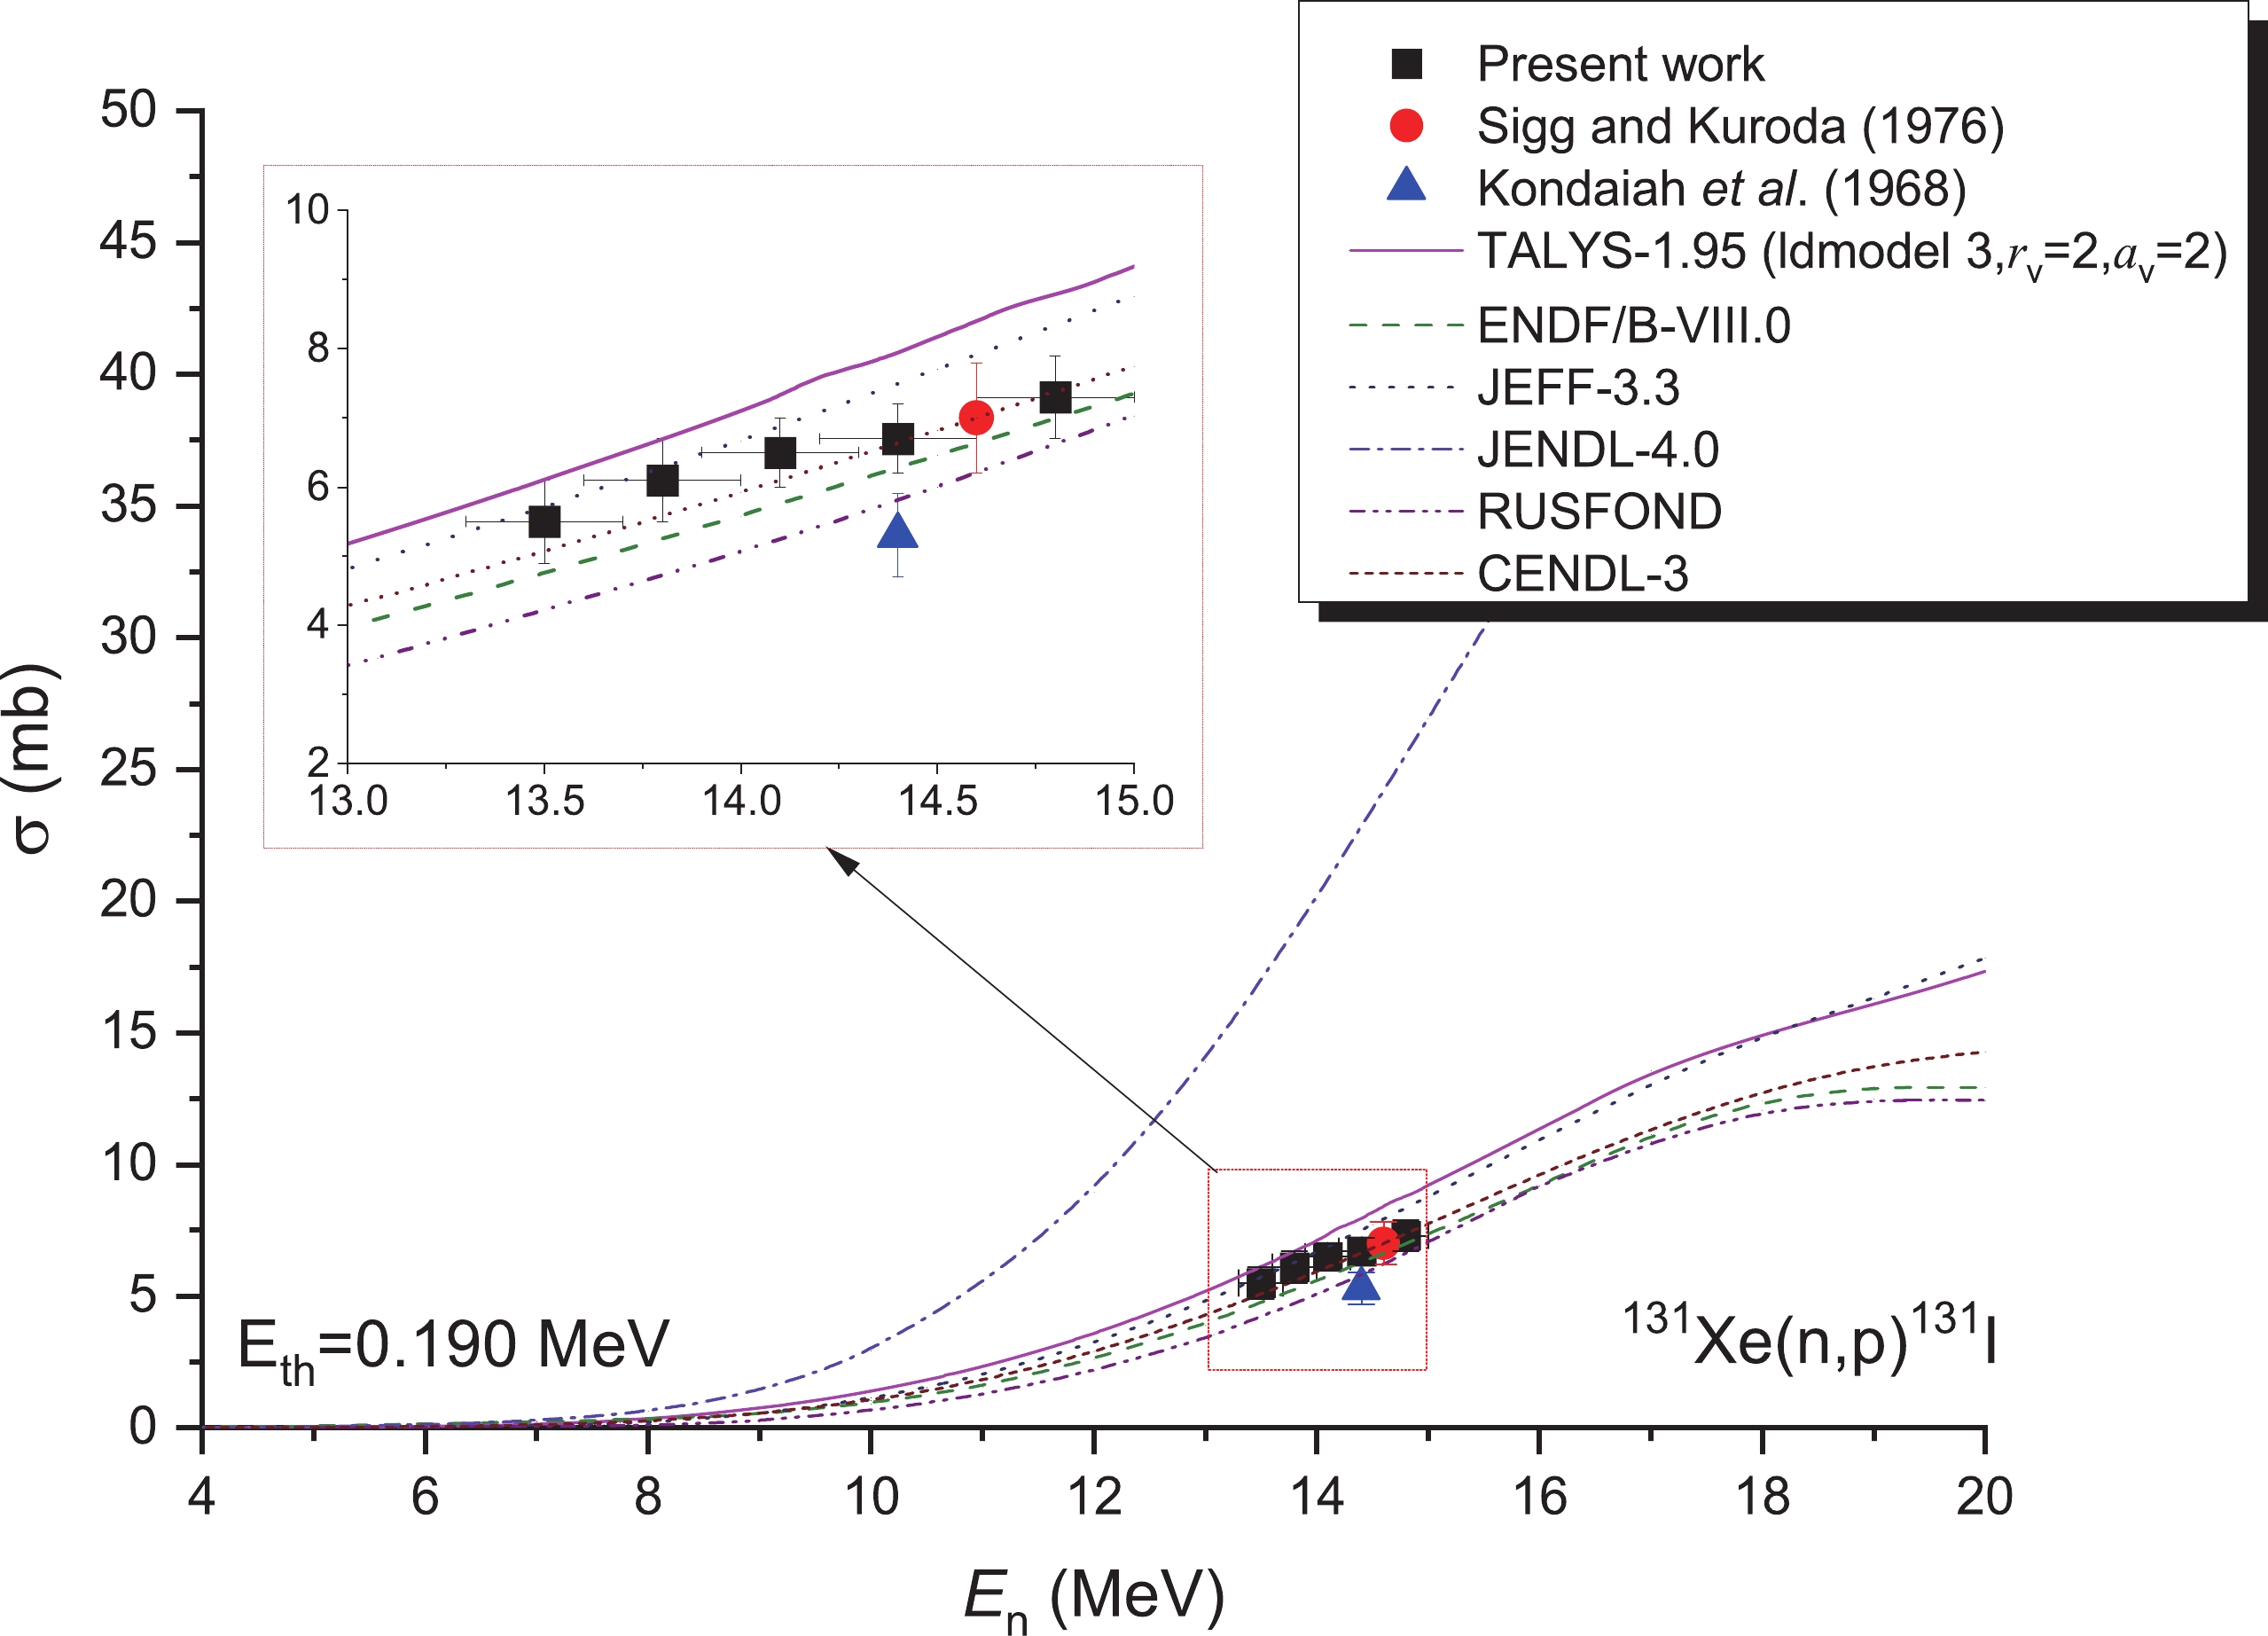
For the 131Xe(n,p)131I reaction, the following conditions were adopted for the measurements: gamma-rays at 364.49 keV (Iγ = 81.5%) emitted via 131I (half-life, T1/2 = 8.0252 d). The measurements reported in the literature adopt the same decay data as this work. Figure 10 compares our data with those of the and literature [10, 11], together with the data obtained by TALYS-1.95 and from the JENDL-4.0 [15], ENDF/B-VIII.0 [16], CENDL-3 [17], JEFF-3.3 [18], and RUSFOND [19] libraries. The agreement between these data is the best at the 13–15 MeV range (see Fig. 10), despite the lack of experimental data at an early stage. Within the neutron energy rage of 13.5–14.8 MeV, our values agree well with the experimental data obtained in [10] and with the evaluated data obtained from the CENDL-3 [17] libraries, within the limits of experimental uncertainty. However, all of our data are below those of JENDL-4.0 [15] (refer to Fig. 10), and the result of the JENDL-4.0 database [15] was 4 times that of ENDF/B-VIII.0 [16], JEFF-3.3 [18], RUSFOND [19], and CENDL-3 [17]. For the theoretical calculation of the 131Xe(n, p)131I reaction, although the OMP parameters rv and av, as well as the level densities, were adjusted to 2, 2, and ld-model 3, respectively, the results remain slightly higher than those obtained in the present study and the evaluated data obtained from the ENDF/B-VIII.0 [16], CENDL-3 [17], JEFF-3.3 [18], and RUSFOND [19] libraries.
-
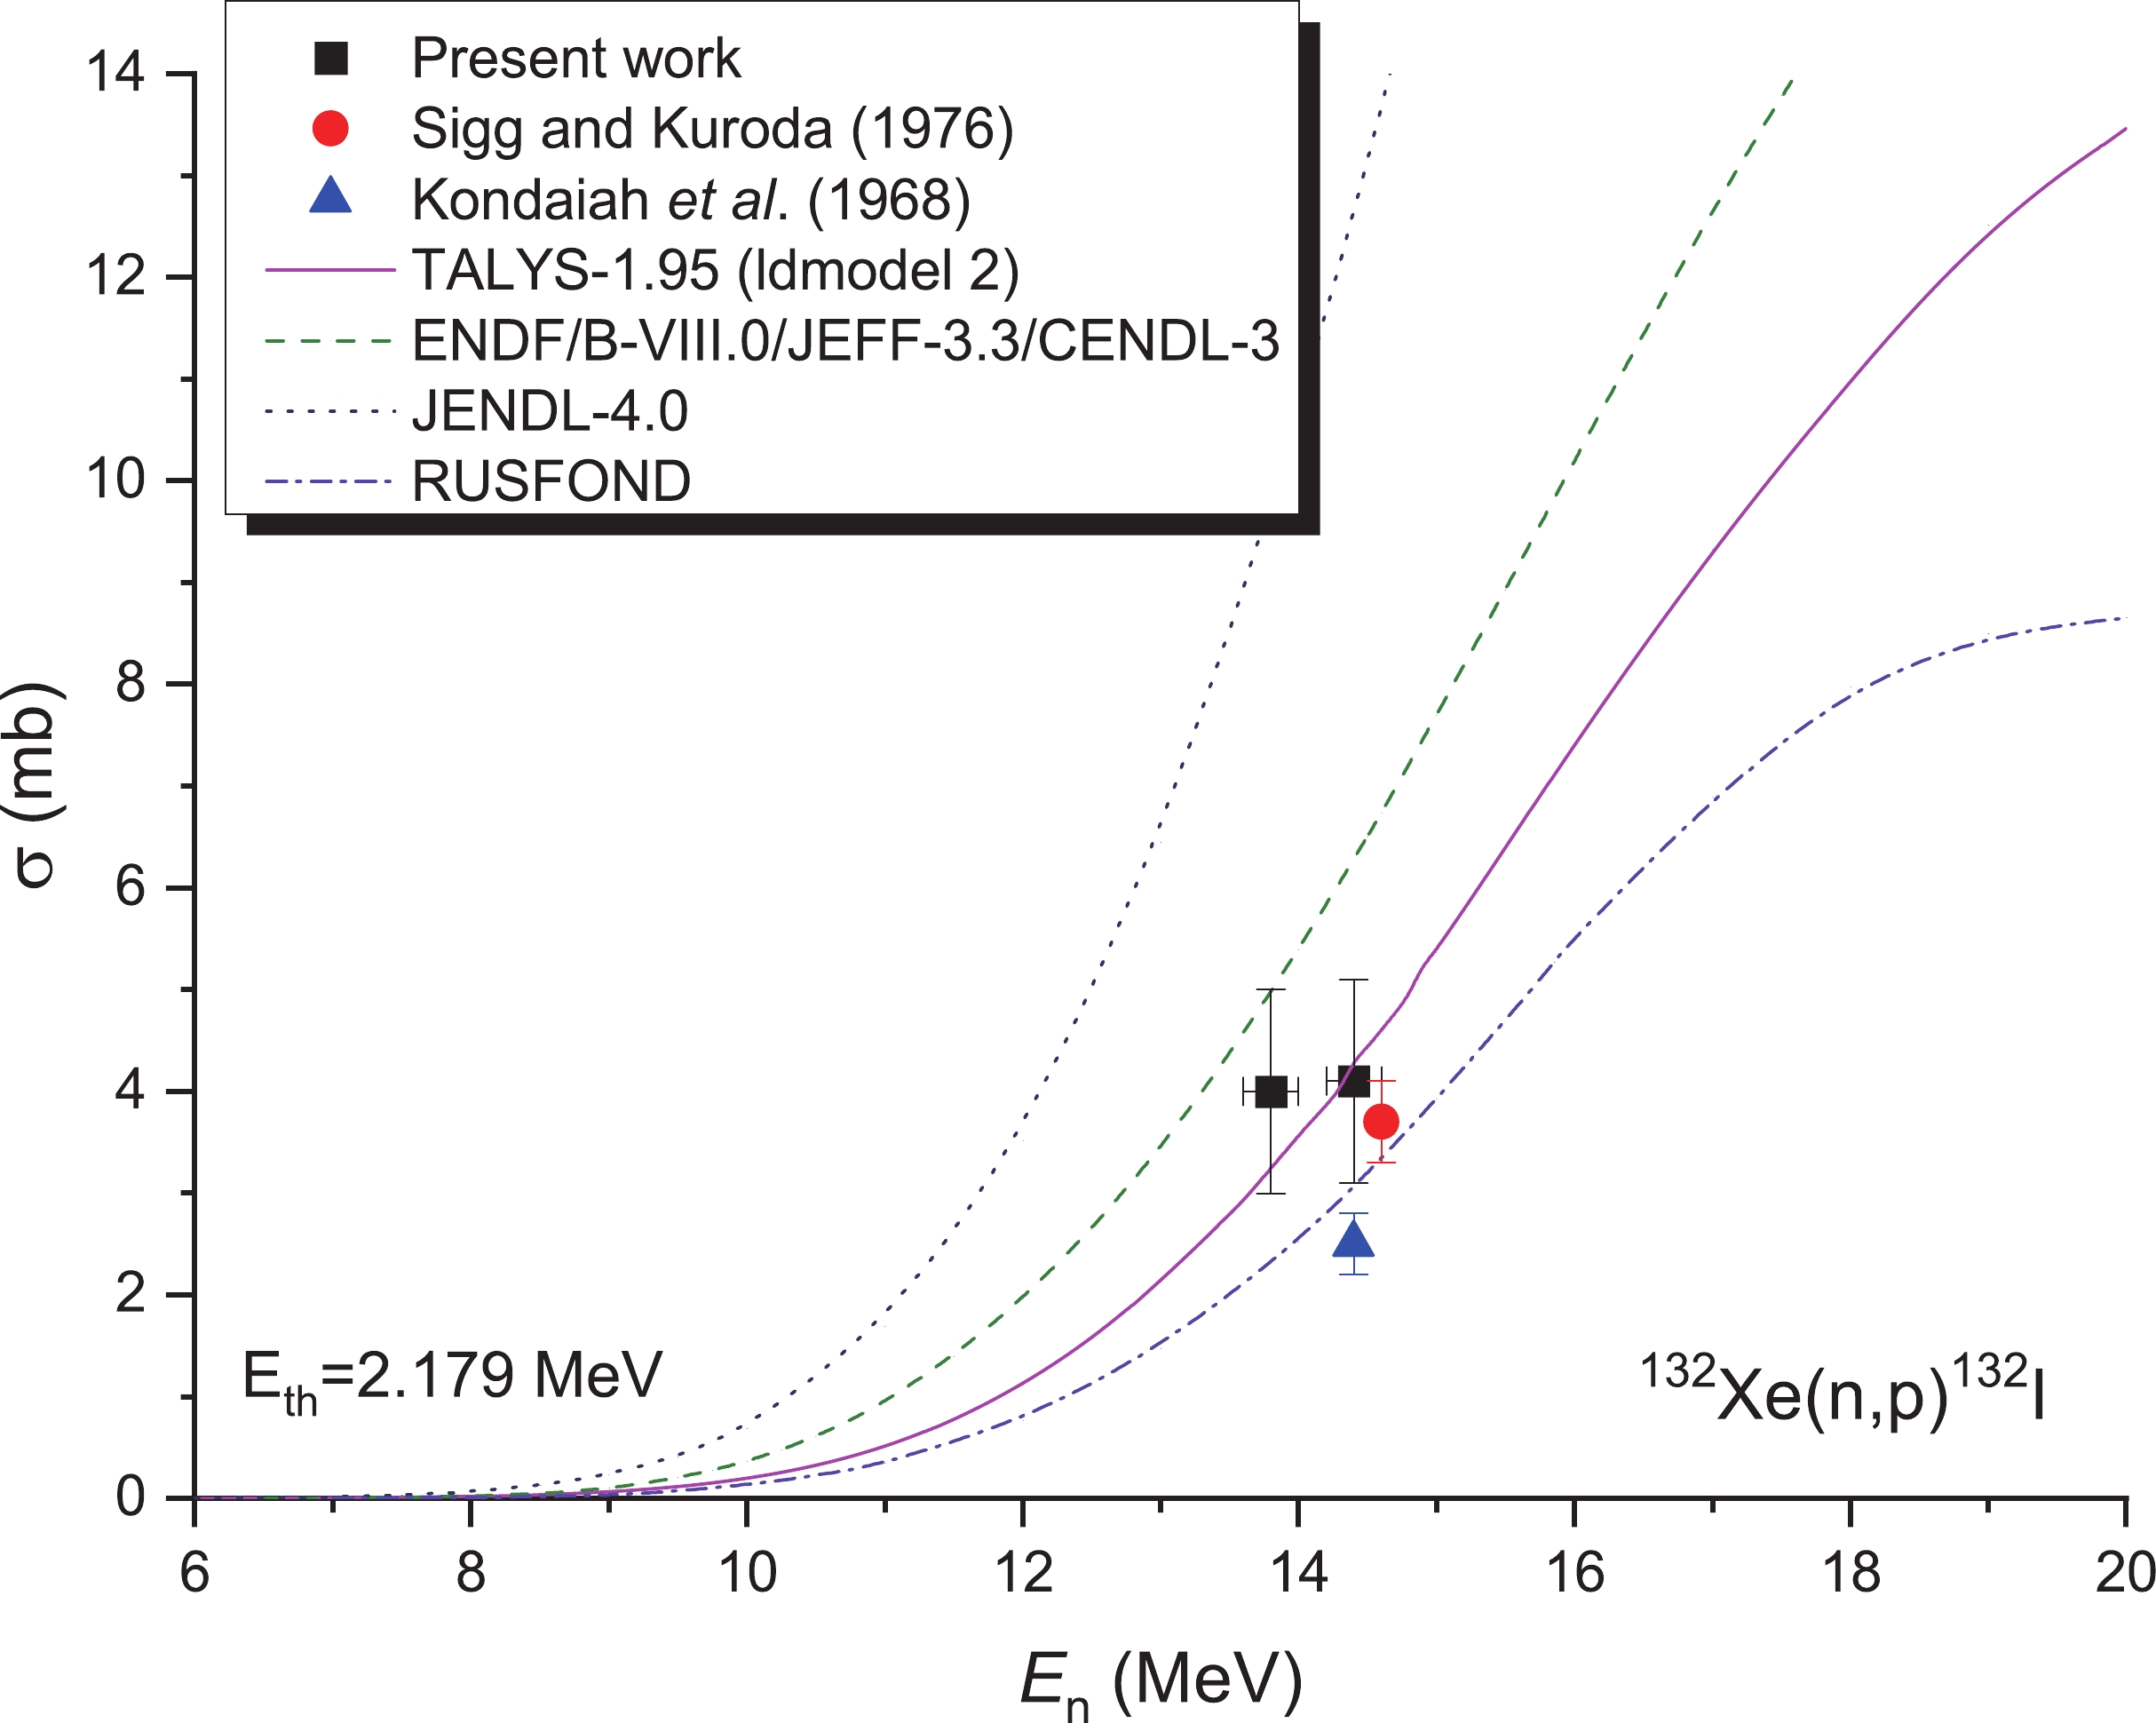
In this study, the latest decay data (half-life T1/2 = 2.295 h, characteristic γ-ray energy Eγ = 522.65 keV, and γ-ray intensity Iγ = 16.0 %) of the 132I product were used to deduce the cross-section value of the 132Xe(n,p)132I reaction. The characteristic gamma-ray energy of 773 keV was selected in [10,11] to determine the activity of the 132I product. However, this line originates from both 132I and also from 132mI (half-life T1/2 = 1.387 h, γ-ray energy Eγ = 772.6 keV, and intensity Iγ = 14.0 %) of the 132Xe(n, p)132mI reaction, including the 131m1Te (half-life T1/2 = 33.25 h, γ-ray energy Eγ = 773.67 keV, and intensity Iγ = 36.8 %) of the 134Xe(n, α)131m1Te reaction. The results obtained in this study are presented in Fig. 11, together with all other data from previous reports [10,11], theoretical calculation results form the TALYS-1.95 (ldmodel 2) code, and the evaluation data from the ENDF/B-VIII.0 [16], CENDL-3 [17], JEFF-3.3 [18], and RUSFOND [19] libraries. As can be observed from Fig. 11, the divergence of the three group evaluation data curves and theoretical curve is relatively large, and this difference gradually becomes larger with an increase in neutron energy. At around 14 MeV, the result of the JENDL-4.0 database [15] was 4 times that of RUSFOND [19]. In this case, the experimental results play an important role in eliminating the differences between the evaluation data and optimizing the parameters of the nuclear theoretical model.
-
The cross-sections of multiple reactions including 124Xe(n, 2n)123Xe, 126Xe(n, 2n)125Xe, 128Xe(n, 2n)127Xe, 130Xe(n, 2n)129mXe, 132Xe(n, 2n)131mXe, 130Xe(n, p)130I, 131Xe(n, p)131I, and 132Xe(n, p)132I reactions were measured for the 13–15 MeV neutron energies via the activation approach. The excitation functions for these reactions up to a neutron energy of 20 MeV were calculated by the Talys-1.95 program using adjusted parameters. The obtained results were compared with previous experiments, evaluated data, and theoretical results based on the Talys-1.95 code. In general, within the experimental uncertainties, the present cross-section values were consistent with those of previous experiments and the theoretical excitation curves at corresponding energies. Our novel achievements are expected to facilitate the quality of the neutron cross-section databases and assist possible novel evaluations of the cross sections of xenon isotopes in the incident neutron energy range from the threshold energy to 20 MeV. Moreover, reliable cross section data can play a key role in the verification of nuclear reaction models and the determination of model parameters, especially nuclear reactions for which experimental data are scarce. Evidently, for the first time, this study reports the experimental values of cross-sections at 13.5, 13.8, and 14.1 MeV for the 126Xe(n, 2n)125Xe, 128Xe(n, 2n)127Xe, 130Xe(n, 2n)129mXe, 132Xe(n, 2n)131mXe, 130Xe(n, p)130I, and 131Xe(n, p)131I reactions, as well as at 13.5 MeV for the 132Xe(n, p)132I reaction. Hence, this study addresses the limitations of the single energy of some cross section data and also broadens the energy range of neutron cross section data.
-
We would like to thank the Intense Neutron Generator group at the China Academy of Engineering Physics for performing the irradiations.
Cross-section measurements of (n, 2n) and (n, p) reactions on 124,126,128,130,131,132Xe in the 14 MeV region and theoretical calculations of their excitation functions
- Received Date: 2021-09-23
- Available Online: 2022-04-15
Abstract: The reaction cross-sections of 124Xe(n, 2n)123Xe, 126Xe(n, 2n)125Xe, 128Xe(n, 2n)127Xe, 130Xe(n, 2n)129mXe, 132Xe(n, 2n)131mXe, 130Xe(n, p)130I, 131Xe(n, p)131I, and 132Xe(n, p)132I were measured at the 13.5, 13.8, 14.1, 14.4, and 14.8 MeV neutron energies. The monoenergetic neutrons were generated via the 3H(d,n)4He reaction at the China Academy of Engineering Physics using the K-400 Neutron Generator with a solid 3H-Ti target. A high-purity germanium detector was employed to measure the activities of the product. The reactions 93Nb(n, 2n)92mNb and 27Al(n, α)24Na were adopted for neutron flux calibration. The cross sections of the (n, 2n) and (n, p) reactions of the xenon isotopes were obtained within the 13–15 MeV neutron energy range. These cross-sections were then compared with the IAEA-exchange format (EXFOR) database-derived experimental data, together with the evaluation results of the CENDL-3, ENDF/B-VIII.0, JENDL-4.0, RUSFOND, and JEFF-3.3 data libraries, as well as the theoretical excitation function obtained using the TALYS-1.95 code. The cross-sections of the reactions (except for the 124Xe(n, 2n)123Xe and 132Xe(n, p)132I) at 13.5, 13.8, and 14.1 MeV are reported for the first time in this study. The obtained results are beneficial in providing better cross-section constraints for the reactions in the 13–15 MeV region, thus improving the quality of the corresponding database. Meanwhile, these data can also be used for the verification of relevant nuclear reaction model parameters.


 Abstract
 HTML
HTML Reference
 Related
 PDF
PDF






 DownLoad: