-
The projectile fragmentation (PF) technique is one of the main methods of producing rare isotopes [1], in which the projectile nucleus is bombarded on the target nucleus with an incident energy above several tens of MeV/u. In the era of the third generation (3G) of rare isotopes beam (RIB) (also known as the radioactive nuclear beam, RNB) factory [2], which is denoted as the Radioactive Isotope Beam Factory (RIBF) at RIKEN, Japan, the upcoming Factory for Rare Ion Beams (FRIB) [3] at Michigan State University, USA, and in building other RNB factories such as the HIAF-HFRS [4] and FAIR-SuperFRS [5], new opportunities will be provided for the experimental search for rare isotopes at the boundaries of the nuclide chart (which will be referred to as extreme rare isotopes in this article) or antimatter [6], and it will be possible to study their exotic properties [7–11]. The typical advantages of the 3G RNB factory, including the two-stage structure installed in the separation beamline (a pre-separator plus a main separator), the ability to spatially separate the isotopic beams of all elements, and a beam energy of up to 1 GeV/u, make it possible to employ projectile beams with large neutron-proton asymmetry in experiments and enhance the production possibility of extreme rare isotopes [2].
Many theoretical models have been employed to describe fragment production in PF reactions. For example, EPAX2 [12] and EPAX3 [13] parametrizations, the statistical abrasion-ablation model [14–18], thermal dynamics models [19–22], the macroscopic-microscopic heavy-ion phase space exploration (HIPSE) model [23–25], the statistical multifragmentation model (SMM) [26, 27], and more complex transport models [25, 28–36] (or see review models for transport models [37, 38]). Reviews for models describing PF reactions have been conducted [2, 39]. However, the precision of typical nuclear reaction models or empirical approaches for the theoretical prediction of extreme rare isotope production is inadequate. Realizing the shortage of available models, efforts have been made to improve the prediction quality for rare isotope production in PF reactions from empirical phenomena. For example, FRACS parametrization [40] and its modified version [41] have been verified to be suitable for fragment production. The FRACS results at 300 MeV/u have been implanted in the LISE++ toolkit [42]. The empirical formulas extracted from massive data analysis also indicate a good ability to reproduce the measured data [43–46]. For extreme rare isotopes, new approaches are still required because the available models cannot provide satisfactory results.
Recently, many crucial properties of atomic nuclei have been accurately predicted using machine learning (ML) techniques, such as the nuclear mass [10, 47–49], charge radii [50], and β-decay half-lives [51, 52]. Considering the difficulties of precisely predicting extreme rare isotopes at third generation radioactive nuclear beam factories, it was previously suggested to construct ML models for fragments produced in PF reactions [2] owing to their successful applications for fission and spallation reactions [53–56]. Two different types of ML models for fragment predictions can be constructed: the direct ML model and the physical model guided ML model. In the direct ML model, massive learning is directly performed on the experimental data, whereas in the physical guided ML model, massive learning aims at learning and reducing the difference between the prediction by the guided physical model and experimental data. Models with direct ML [55, 56] and physical guiding ML [56] via the Bayesian neural network (BNN) technique have been proposed to predict isotope production in proton induced nuclear spallation reactions. Considering the similarity between the nuclear spallation reaction and PF reaction, the BNN technique will be applied to establish the direct ML and physical guiding ML models to predict fragment productions in PF reactions. The FRACS formula is chosen to serve as the physical guiding model for its high precision in fragment prediction.
This article is organised as follows: In Sec. II, a brief introduction to the BNN and FRACS guiding BNN (BNN + FRACS) model is presented. In Sec. III, model predictions by FRACS, BNN, and BNN + FRACS are compared, and the results are discussed. A summary of the study is presented in Sec. IV.
-
The statistical methodology of Bayesian learning is distinguished by its use of probability to express all forms of uncertainty [57]. Before the start of Bayesian learning, a prior distribution
$ P(\theta) $ should be defined for the parameters θ based on the problem derived from known knowledge. If the real observations$ D(X^{n}_{u},Y^{n}_{v}) $ are available, where$ Y^{n}_{v} $ represents the corresponding outputs to inputs$ X^{n}_{u} $ and$ n,u,v $ are the number of training cases, inputs, and outputs, respectively, the prior distribution can be updated to a posterior distribution according to Bayes' rule.$ P(\theta |D)=P(D|\theta)P(\theta)/P(D)\propto L(\theta|D)P(\theta) $

(1) where
$ L(\theta|D) $ is the likelihood function, which represents the impact of the real observations on the parameters θ.$ P(D) $ is a normalization constant, which can be calculated with an integral formula.$ P(D)=\int_{\theta }^{}P(D|\theta)P(\theta){\rm d}\theta . $

(2) In this study, the prior distributions
$ P(\theta) $ are adopted as Gaussian distributions with zero means to describe the model parameters θ. The precisions (inverse of variance) of these Gaussian distributions are set as gamma distributions, as in Refs. [47, 51], which varies the precision over a large range, to automatically choose suitable parameter values in the sampling process. The likelihood function$ L(\theta|D) $ is set as a Gaussian distribution$ \exp(-\chi^{2}/2) $ based on an objective (or "loss") function$ \chi^{2} $ obtained from least-squares fitting to the observational data.$ \chi^{2} $ is given by$ \chi^{2}=\sum\limits_{n=1}^{N}\left [\frac{f_{w}^{n}(X_{u}^{n};\theta)-Y_{v}^{n}}{\eta^{n}} \right ]^{2}, $

(3) where
$ \eta^{n} $ is the standard deviation of the$n$ th observable, regarded as a hyperparameter. The function$ f_{w}^{n}(X_{u}^{n};\theta) $ uses a typical framework of the multilayer perceptron network. The output values are connected to the real inputs$ X^{n}_{u} $ with one hidden layer containing a certain number of hidden units, as shown the following:$ f^{n}_{w}(X_{u}^{n};\theta)=a_{w}+\sum\limits_{v=1}^{H}b_{vw}\tanh\left(c_{v}+ \sum\limits_{u=1}^{I}d_{uv}X_{u}^{n}\right), $

(4) in which I and H are the numbers of inputs and hidden units, respectively. The parameter θ represents the network parameter biases (
$ a_{w},c_{v} $ ) and weights ($ b_{vw},d_{uv} $ ), which are learned based on the real observations D, also known as training cases. Each neural unit in the hidden layer is connected to the inputs by the hyperbolic tangent function, which allows the hidden units to represent "hidden features" of the inputs that are useful in appropriately computing the network outputs. The main objective of Bayesian learning is to produce predictions for test cases, which are not contained in the training cases. With the posterior distribution$ P(\theta|D) $ and function$ f_{w}^{n} $ , one can obtain the mean value of the predictive distribution for test case outputs using$ <{Y}_{v}^{n+1}>=\int f_{w}^{n}(X_{u}^{n+1};\theta)P(\theta|D){\rm d}\theta, $

(5) where
$ X_{u}^{n+1} $ and$ Y_{v}^{n+1} $ represent the inputs and outputs for test cases, respectively. The uncertainty can be naturally calculated using$ \Delta Y_{v}=\sqrt{<Y_{v}^{2}>-<Y_{v}>^2} $ . The Markov chain Monte Carlo method is used to solve the high-dimensional integral in Eq. (5), which can be simplified to$ <{Y}_{v}^{n+1}>=\frac{1}{K}\sum\limits_{k=1}^{K} f_{w}^{n}(X_{u}^{n+1};\theta_k), $

(6) where K is the number of iteration samples.
-
FRACS parametrization was proposed to predict fragment production in projectile fragmentations at incident energies above 100 MeV/u [40], which determines the values of parameters using a variety of measured fragments. Following the basic ideas of EPAX3 parametrization [13], the main formula for predicting the residual cross section of a fragment
$ \sigma(A_f,Z_f) $ is expressed as$ \sigma(A_f,Z_f)=Y(A_f)Y(Z_{\rm prob}-Z_f)\Delta_{\rm OES}(A_f,Z_f), $

(7) where the mass yield
$ Y(A_f) $ is the summation of all isobaric cross sections. The precision of$ Y(A) $ is crucial to determine fragment production because it is the main term in Eq. (7). The key improvement from EPAX3 to FRACS is that the energy dependence of$ Y(A) $ has been included, which makes it possible to present differences between fragment productions in reactions of difference incident energies. The isobaric distribution$Y(Z_{\rm prob}-Z_f)$ has a Gaussian-like shape about the most probable charge$ Z_{\rm prob} $ and the fragment charge$ Z_f $ with a given mass$ A_f $ , except for fragments close to the projectile. It is dominated by three parameters, namely the width of the charge distribution R, the position of the most probable charge$ Z_{\rm prob} $ , and the exponent U to decide the second allocation, and it is expressed as$ Y(Z_{\rm prob}-Z_f)=N\exp(-R|Z_{\rm prob}-Z_{f}|^{U}), $

(8) where
$ N=\sqrt{R/\pi} $ is the normalization factor. Although the first two terms of Eq. (7) can effectively describe the general smooth tendency of the fragment cross section, the odd-even staggering (OES) in fragment production has been omitted in EPAX3. To improve the prediction precision, a new term$\Delta_{\rm OES}(A_f,Z_f)$ is introduced, which makes FRACS capable of dealing with OES phenomena in fragment distributions. Through a comparison with the measured cross sections in various reactions, FRACS shows a better ability to reproduce the experimental data than EPAX3.In this article, FRACS parametrization will be taken as the physical guidance for the BNN model, for which predictions by FRACS will first be calculated. For a thorough description of FRACS parametrization, see Ref. [40].
-
Following the methods in Ref. [56], a direct BNN model and FRACS guiding BNN model (BNN + FRACS) will be constructed to predict fragment cross sections in PF reactions. The measured fragments cross sections in 53 reactions, which include 6393 data (complied from Ref. [58] to [90]), as listed in Table 1, are collected as comprehensively as possible to form the training dataset. In the training dataset, the incident energy of the reactions ranges from 44 MeV/u to 1 GeV/u. The mass and charge range of the projectile nucleus are
$40\leq A_p \leq 208$ and$ 18\leq Z_p \leq 82 $ , respectively. The target nuclei include the generally used 9Be, 12C, and 27Al, which are relatively light nuclei, and 181Ta, 197Au, and 208Pb, which are heavy nuclei. The asymmetry of the projectile nucleus, that is,$(I/A)_{\rm pr}$ with$ I=N-Z $ , ranges from 0 to 0.242. The direct BNN model is constructed by performing massive learning on the measured fragment cross sections in the training dataset. Seven parameters are involved in the inputs to cover the main information for fragment production in a PF reaction system, that is,$X_{u}= (E,A_p,Z_p, A_t,Z_t,A_f, Z_f)$ , in which E is the incident energy (unit of MeV/u) of a reaction,$ A_{p} $ and$ Z_{p} $ are the mass and charge numbers of the projectile nucleus,$ A_{t} $ and$ Z_{t} $ are the mass and charge numbers of the target nucleus,$ A_{f} $ and$ Z_{f} $ are the mass and charge numbers of a specific fragment, and$ \sigma_{\exp}(A_f,Z_f) $ is the measured cross section of a fragment and is related to the output$ Y_v $ .Reaction $(I/A)_{\rm pr}$ 

E Data $ Z_{\rm fr} $ 

Ref. Reaction $ (I/A)_{\rm pr} $ 

E Data $ Z_{\rm fr} $ 

Ref. 80Kr+9Be 0.100 1050 28 32-37 [58] 58Ni+9Be 0.034 140 196 5-29 [78] 112Sn+9Be 0.107 1015 66 38-52 [59] 58Ni+181Ta 0.034 140 189 5-28 [78] 112Sn+112Sn 0.107 1000 249 10-50 [60] 64Ni+9Be 0.125 140 243 5-29 [78] 124Sn+124Sn 0.194 1000 266 10-50 [60] 64Ni+181Ta 0.125 140 234 5-29 [78] 136Xe+9Be 0.206 1000 111 40-55 [61] 78Kr+9Be 0.077 140 10 32-34 [79] 124Xe+208Pb 0.129 1000 491 10-55 [62] 76Ge+9Be 0.158 132 111 14-27 [80] 136Xe+208Pb 0.206 1000 626 10-56 [62] 40Ar+9Be 0.100 128 69 4-15 [81] 208Pb+9Be 0.212 1000 191 70-83 [63] 40Ar+58Ni 0.100 128 67 4-16 [81] 208Pb+64Cu 0.212 1000 282 59-82 [64] 40Ar+181Ta 0.100 128 65 4-16 [81] 40Ar+9Be 0.100 1000 39 5-9 [65] 48Ca+181Ta 0.167 128 54 4-14 [81] 132Sn+9Be 0.242 950 46 45-51 [66] 112Sn+9Be 0.107 120 6 48-50 [82] 197Au+9Be 0.198 950 33 72-78 [67] 69Cu+9Be 0.159 98.1 106 17-31 [83] 129Xe+27Al 0.163 790 216 40-55 [68] 72Zn+9Be 0.167 95.4 137 17-31 [83] 58Ni+9Be 0.034 650 58 21-28 [69] 68Ni+9Be 0.176 94.3 89 17-29 [83] 86Kr+9Be 0.163 500 28 21-28 [70] 40Ar+9Be 0.100 94 13 5-9 [84] 92Mo+9Be 0.087 500 89 31-42 [71] 40Ar+181Ta 0.100 94 112 3-19 [85] 48Ca+9Be 0.167 345 47 5-16 [72] 64Ni+9Be 0.125 93.7 84 17-29 [83] 78Kr+9Be 0.077 345 14 22-36 [73] 40Ar+9Be 0.100 90 116 4-15 [86] 124Xe+9Be 0.129 345 37 42-52 [74] 70Ge+58Ni 0.086 71.6 16 29-33 [87] 40Ar+12C 0.100 213 72 8-16 [75] 86Kr+9Be 0.163 64 180 25-36 [78] 136Xe+12C 0.206 168 176 40-55 [76] 86Kr+181Ta 0.163 64 70 25-36 [78] 40Ar+9Be 0.100 140 69 4-15 [77] 48Ca+181Ta 0.167 60 36 11-17 [88] 40Ar+181Ta 0.100 140 63 4-15 [77] 40Ar+9Be 0.100 57 111 9-20 [89] 40Ca+9Be 0 140 111 5-21 [78] 40Ar+181Ta 0.100 57 96 9-20 [89] 40Ca+181Ta 0 140 116 5-21 [78] 129Xe+90Zr 0.163 44 29 47-50 [90] 48Ca+9Be 0.167 140 202 5-22 [78] 129Xe+197Au 0.163 44 29 47-50 [90] 48Ca+181Ta 0.167 140 199 6-22 [78] Table 1. Source data of measured fragments in the training set to construct BNN models for projectile fragmentation reactions.
$(I/A)_{\rm pr}$ refers to the asymmetry of the projectile nucleus with$ I=N-Z $ . E denotes the incident energy of the reaction with a unit of MeV/u. Data refers to the number of fragments measured in the reaction, and$Z_{\rm fr}$ denotes the charge number range of the measured fragments.According to Ref. [56], the predicted cross section is reconstructed as
$ \lg\sigma_{\exp} $ in the direct BNN model and ($\lg\sigma_{\exp}-\lg\sigma_{\rm FRACS}$ ) in the BNN + FRACS model; thereby, the original negative value outputs can be avoided. The FRACS predictions for fragments are first calculated, and then the difference between the predicted and measured cross sections are calculated to construct the BNN + FRACS model. With the structure of seven parameters in the input and one in the output, hidden neural units between 30 and 50 are assessed, and 46 hidden neural units are verified to be the best. According to Eq. (6), in the direct BNN model, the predicted cross section for a fragment is given by$ \sigma_{\rm BNN}=10^{<{Y}_{v}^{n+1}>}, $

(9) and in the BNN + FRACS model, the predicted cross section for a fragment has the form
$ \sigma_{\rm BNN+FRACS}=10^{<{Y}_{v}^{n+1}>}\cdot\sigma_{\rm FRACS}\, . $

(10) -
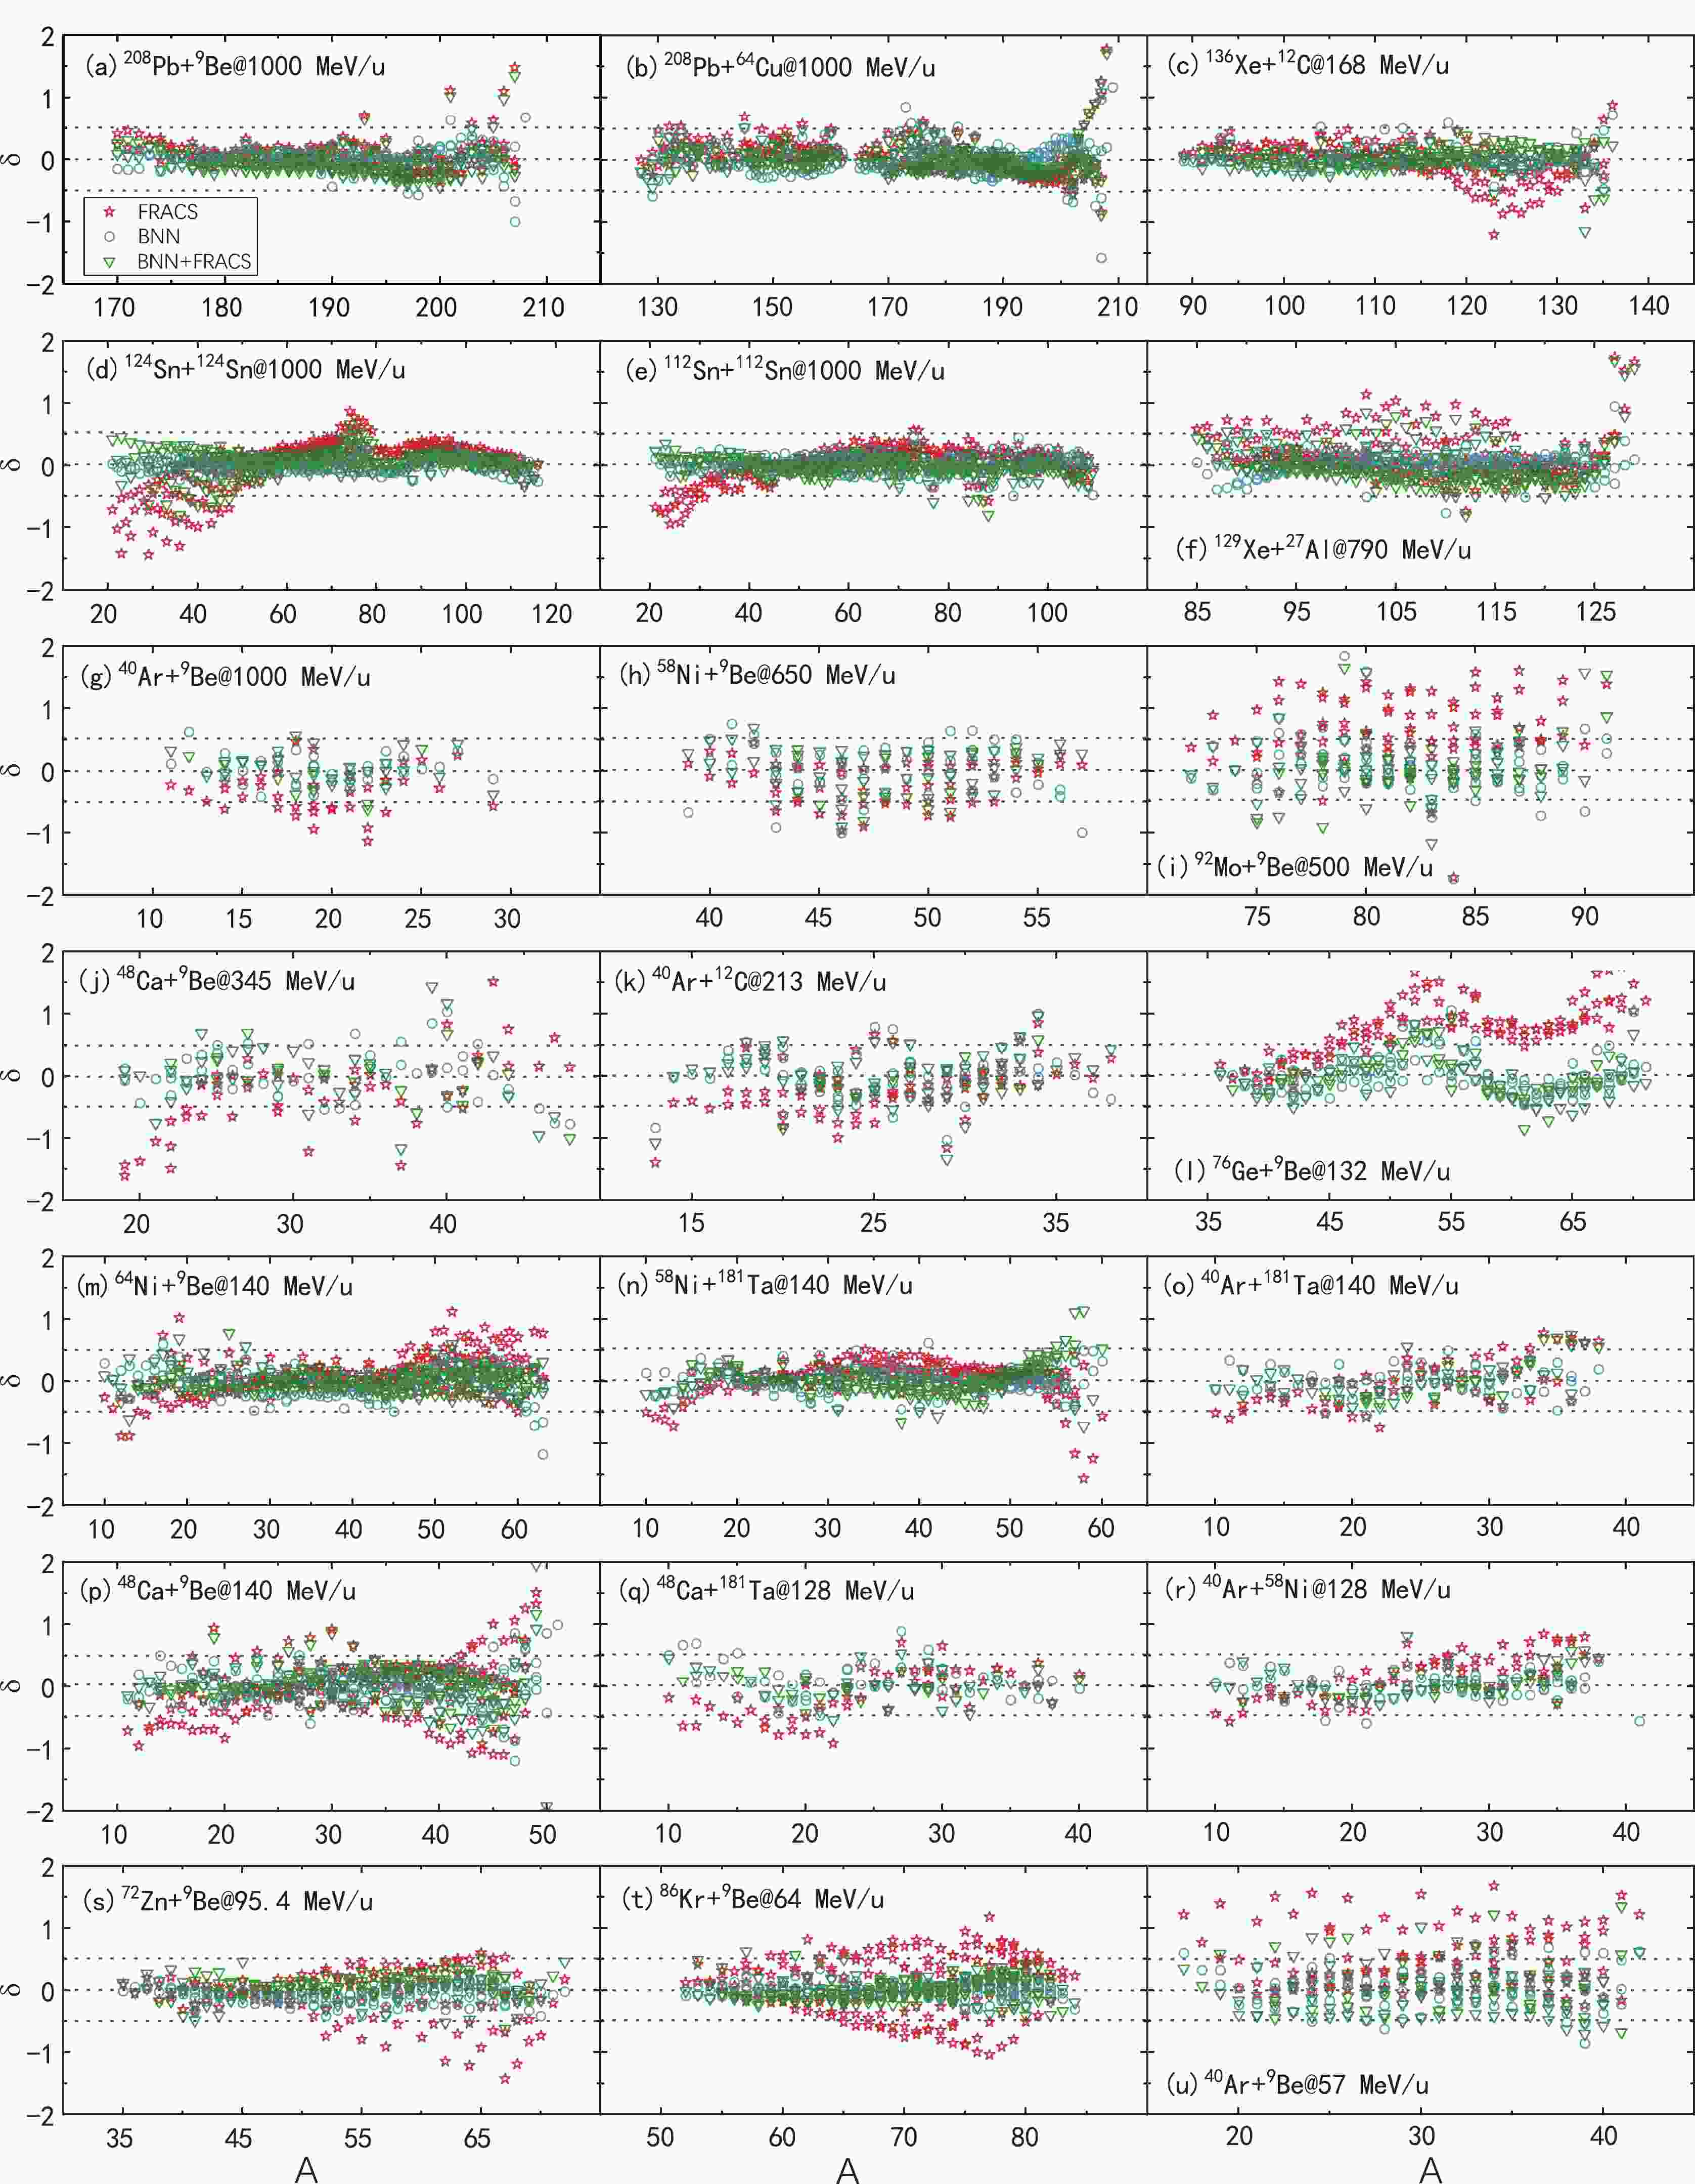
To compare the predictive accuracy of the models, the quantity
$\delta=\log_{10}(\sigma_{\rm th}/\sigma_{\exp})$ is defined, in which$\sigma_{\rm th}$ and$ \sigma_{\exp} $ denote the predicted and measured cross sections, respectively. The predicted results by FRACS (stars), BNN (circles), and BNN + FRACS (triangles) for fragments produced in 21 reactions are plotted in Fig. 1. The chosen reaction systems cover a wide range of incident energies, from 57 MeV/u to 1000 MeV/u, and projectile nucleus mass (charge) numbers, from 40 (18) to 208 (82). Generally, the values of δ for the FRACS, BNN, and BNN + FRACS predictions are close to zero, indicating that the predicted results are similar to the experimental ones. It is clearly revealed that FRACS can successfully predict fragment cross sections in reactions of heavy projectiles such as 208Pb and light projectiles such as 40Ar as well as the neutron-rich projectiles 136Xe, 124Sn, 64Ni, and 48Ca and proton-rich projectile 112Sn. The inadequacy of FRACS for reactions below 100 MeV/u, as mentioned in Ref. [40], is revealed by the results shown in Fig. 1 (t) and (u). It is also shown that FRACS is not very suitable for intermediate mass fragments ($ A<40 $ ), for example, in panels (d) and (e) for the 124Sn + 124Sn and 112Sn + 112Sn reactions [60]. Additionally, as shown in panel (i) and (l), for the neutron-deficient projectile 92Mo$ [(N-Z)/A=0.087] $ and neutron-rich projectile 76Ge [$ (N-Z)/A=0.158 $ ], the FRACS predictions reveal significant differences to the measured data. The predictions by the BNN and BNN + FRACS models are generally similar. The precision of the predicted results by both BNN and BNN + FRACS are improved compared to those by the FRACS formula. Most of the δ values for the BNN and BNN + FRACS predictions are within the range of –0.5 to 0.5, particularly for light fragments produced in reactions induced by heavy projectiles. As for the reactions below 100 MeV/u, that is, the 64 MeV/u 86Kr +$ ^9 $ Be and 57 MeV/u 40Ar +$ ^9 $ Be reactions, the BNN and BNN + FRACS predictions also have very small δ values. For adopted data in the training dataset, 80.06%, 95.40%, and 91.66% of predicted cross sections by FRACS, BNN, and BNN + FRACS fall into the range of$ -0.5<\delta<0.5 $ . These comparisons indicate a good improvement of BNN and BNN + FRACS from FRACS. It can be concluded from the comparisons that the constructed BNN and BNN + FRACS models can effectively reproduce measured fragments in PF reactions for incident energies from 40 MeV/u to 1 GeV/u, projectile nuclei from 40Ar to 208Pb, from neutron-deficient nuclei to neutron-rich nuclei, and within a large range of target nuclei.
Figure 1. (color online) Comparison of accuracy for fragment prediction in the form of
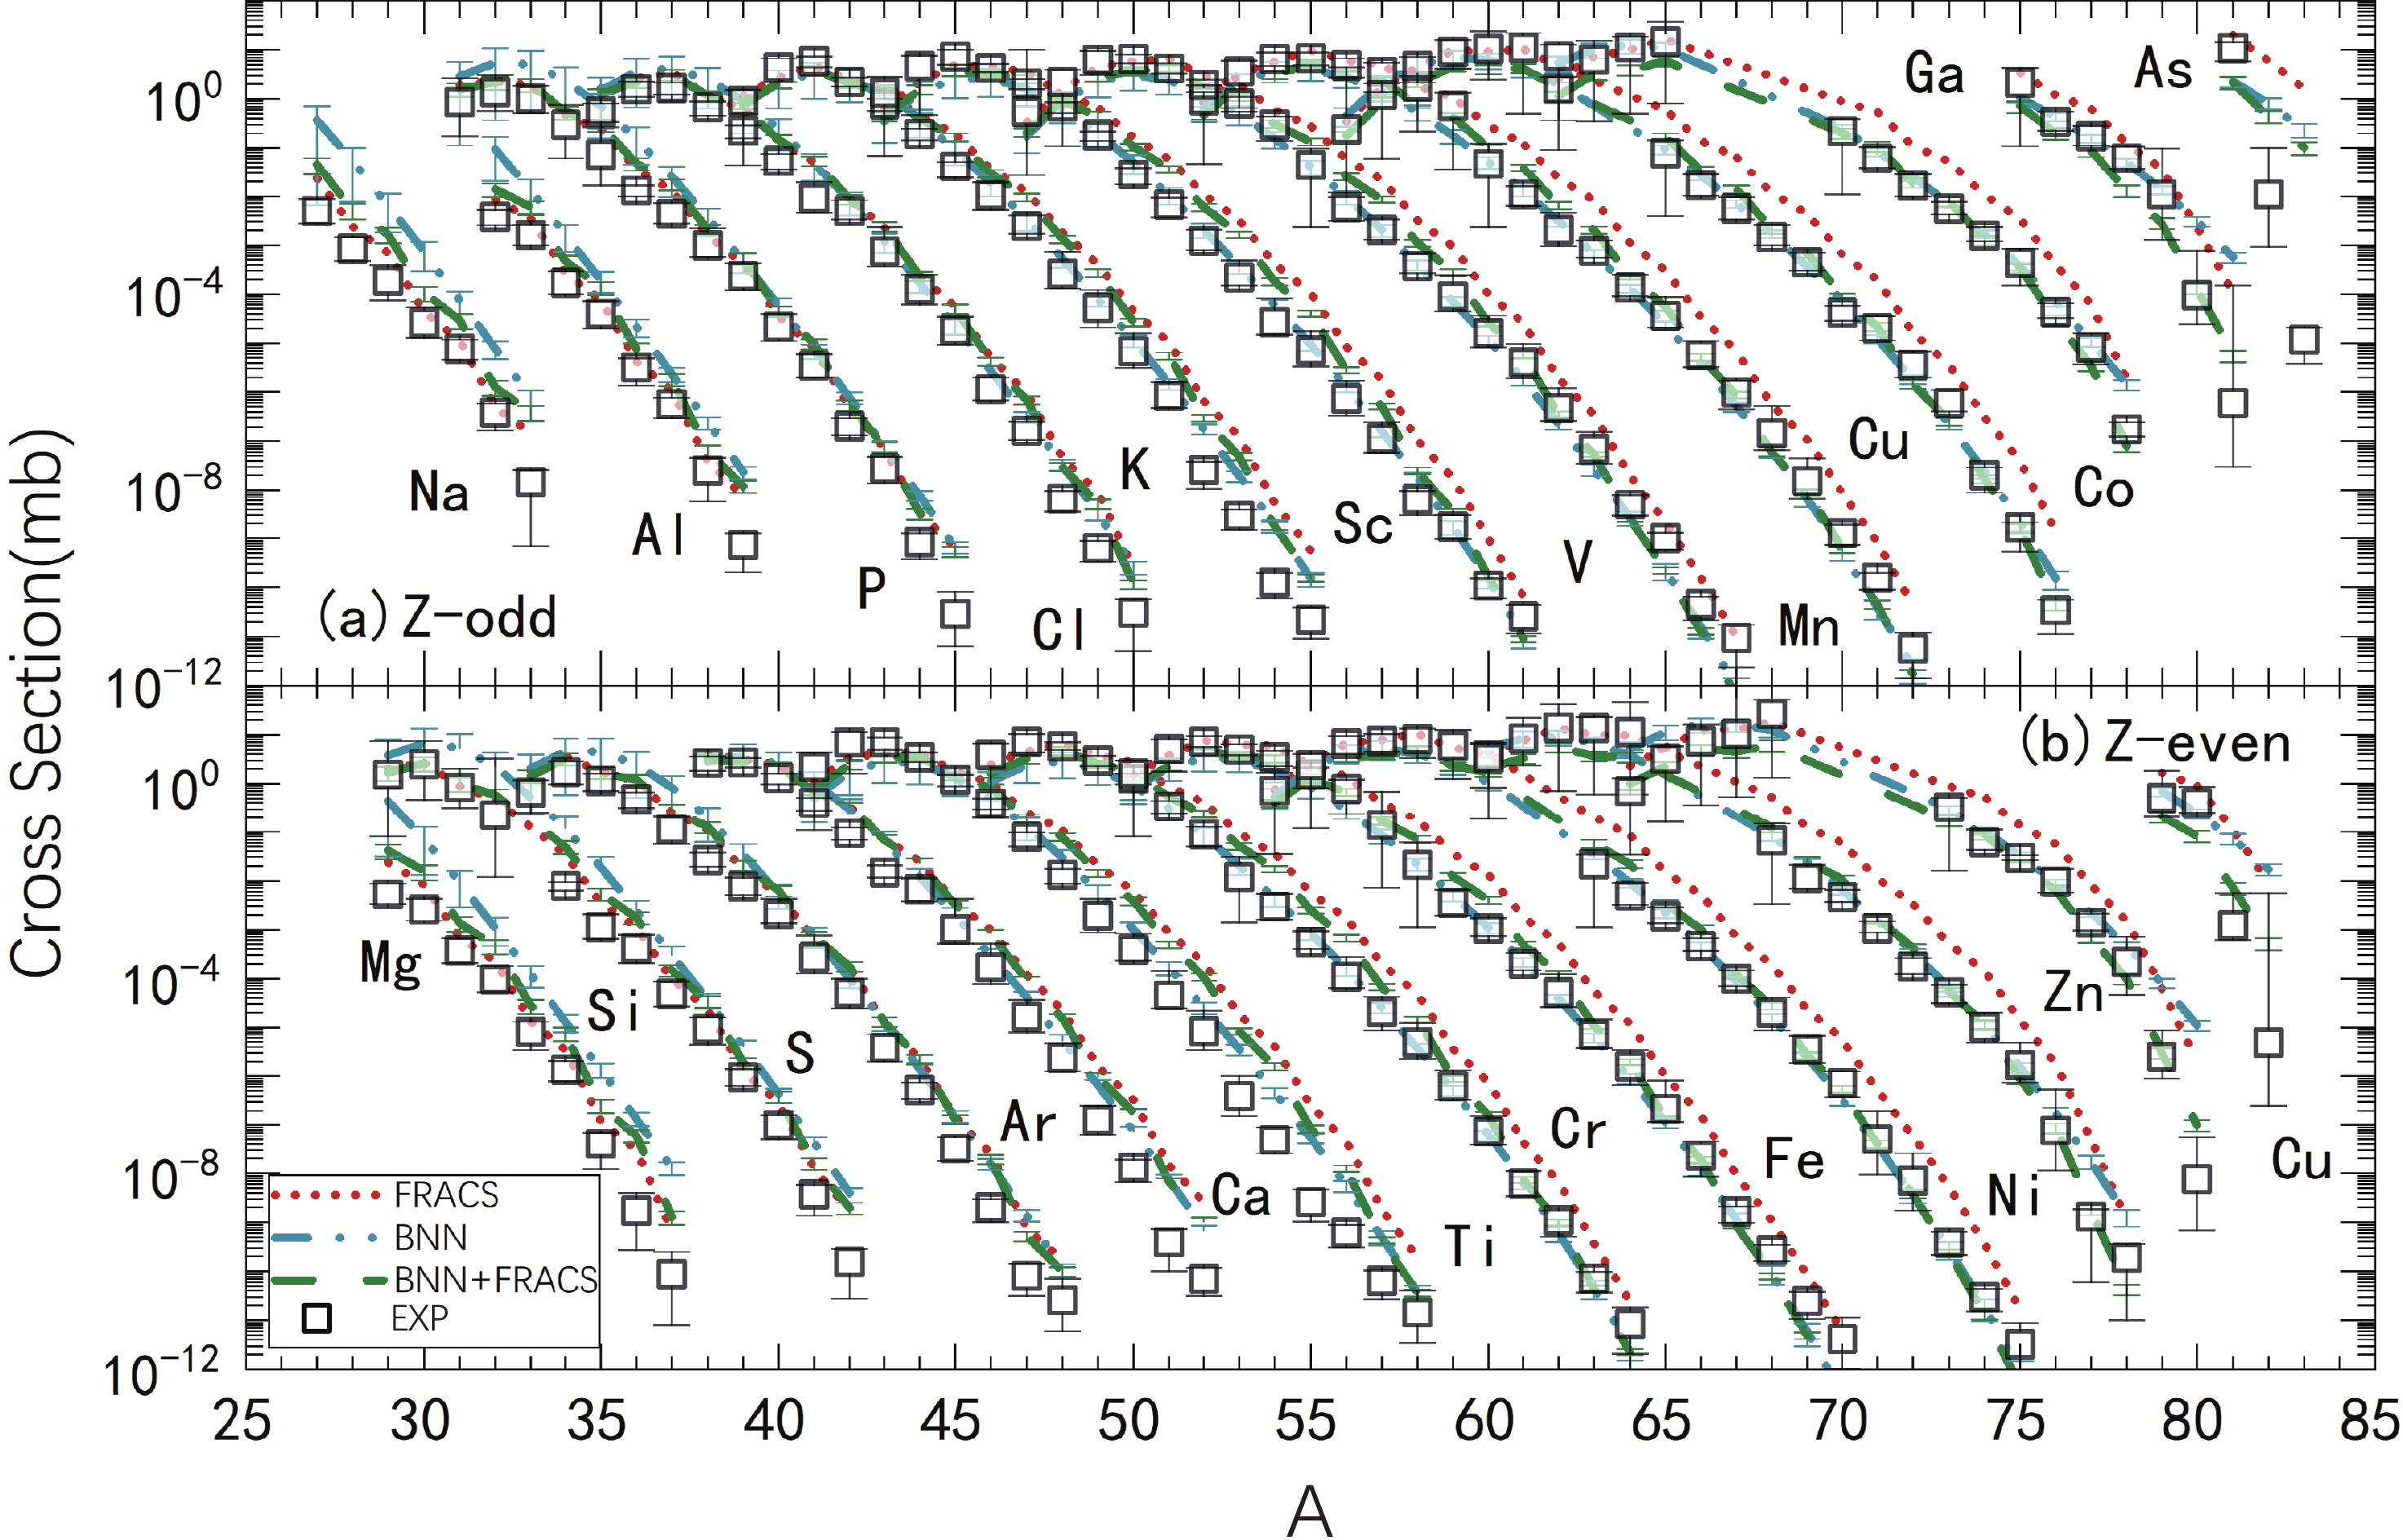
$\delta=\log_{10}(\sigma_{\rm th}/\sigma_{\exp})$ , with$\sigma_{\rm th}$ as the predicted cross sections by the FRACS (stars), BNN (circles), and BNN + FRACS (triangle) models, and$ \sigma_{\exp} $ as the measured values. References for the adopted reactions are listed in Table 1.In Fig. 2, the predicted isotopic cross sections for the 1000 MeV/u 136Xe + 208Pb reaction are compared to the measured values. The measured data in this reaction have been incorporated in the training dataset to form the BNN and BNN + FRACS models. For simplicity, fragments with even-Z (from 10–30) and odd-Z (from 21–41) are separately plotted in panels (a) and (b), respectively. Compared to the underestimation of neutron-rich fragments with
$ Z\leq 25 $ by the FRACS formulas, the BNN and BNN + FRACS models reproduce the measured isotopic cross sections well, in particular for those with a relatively small Z.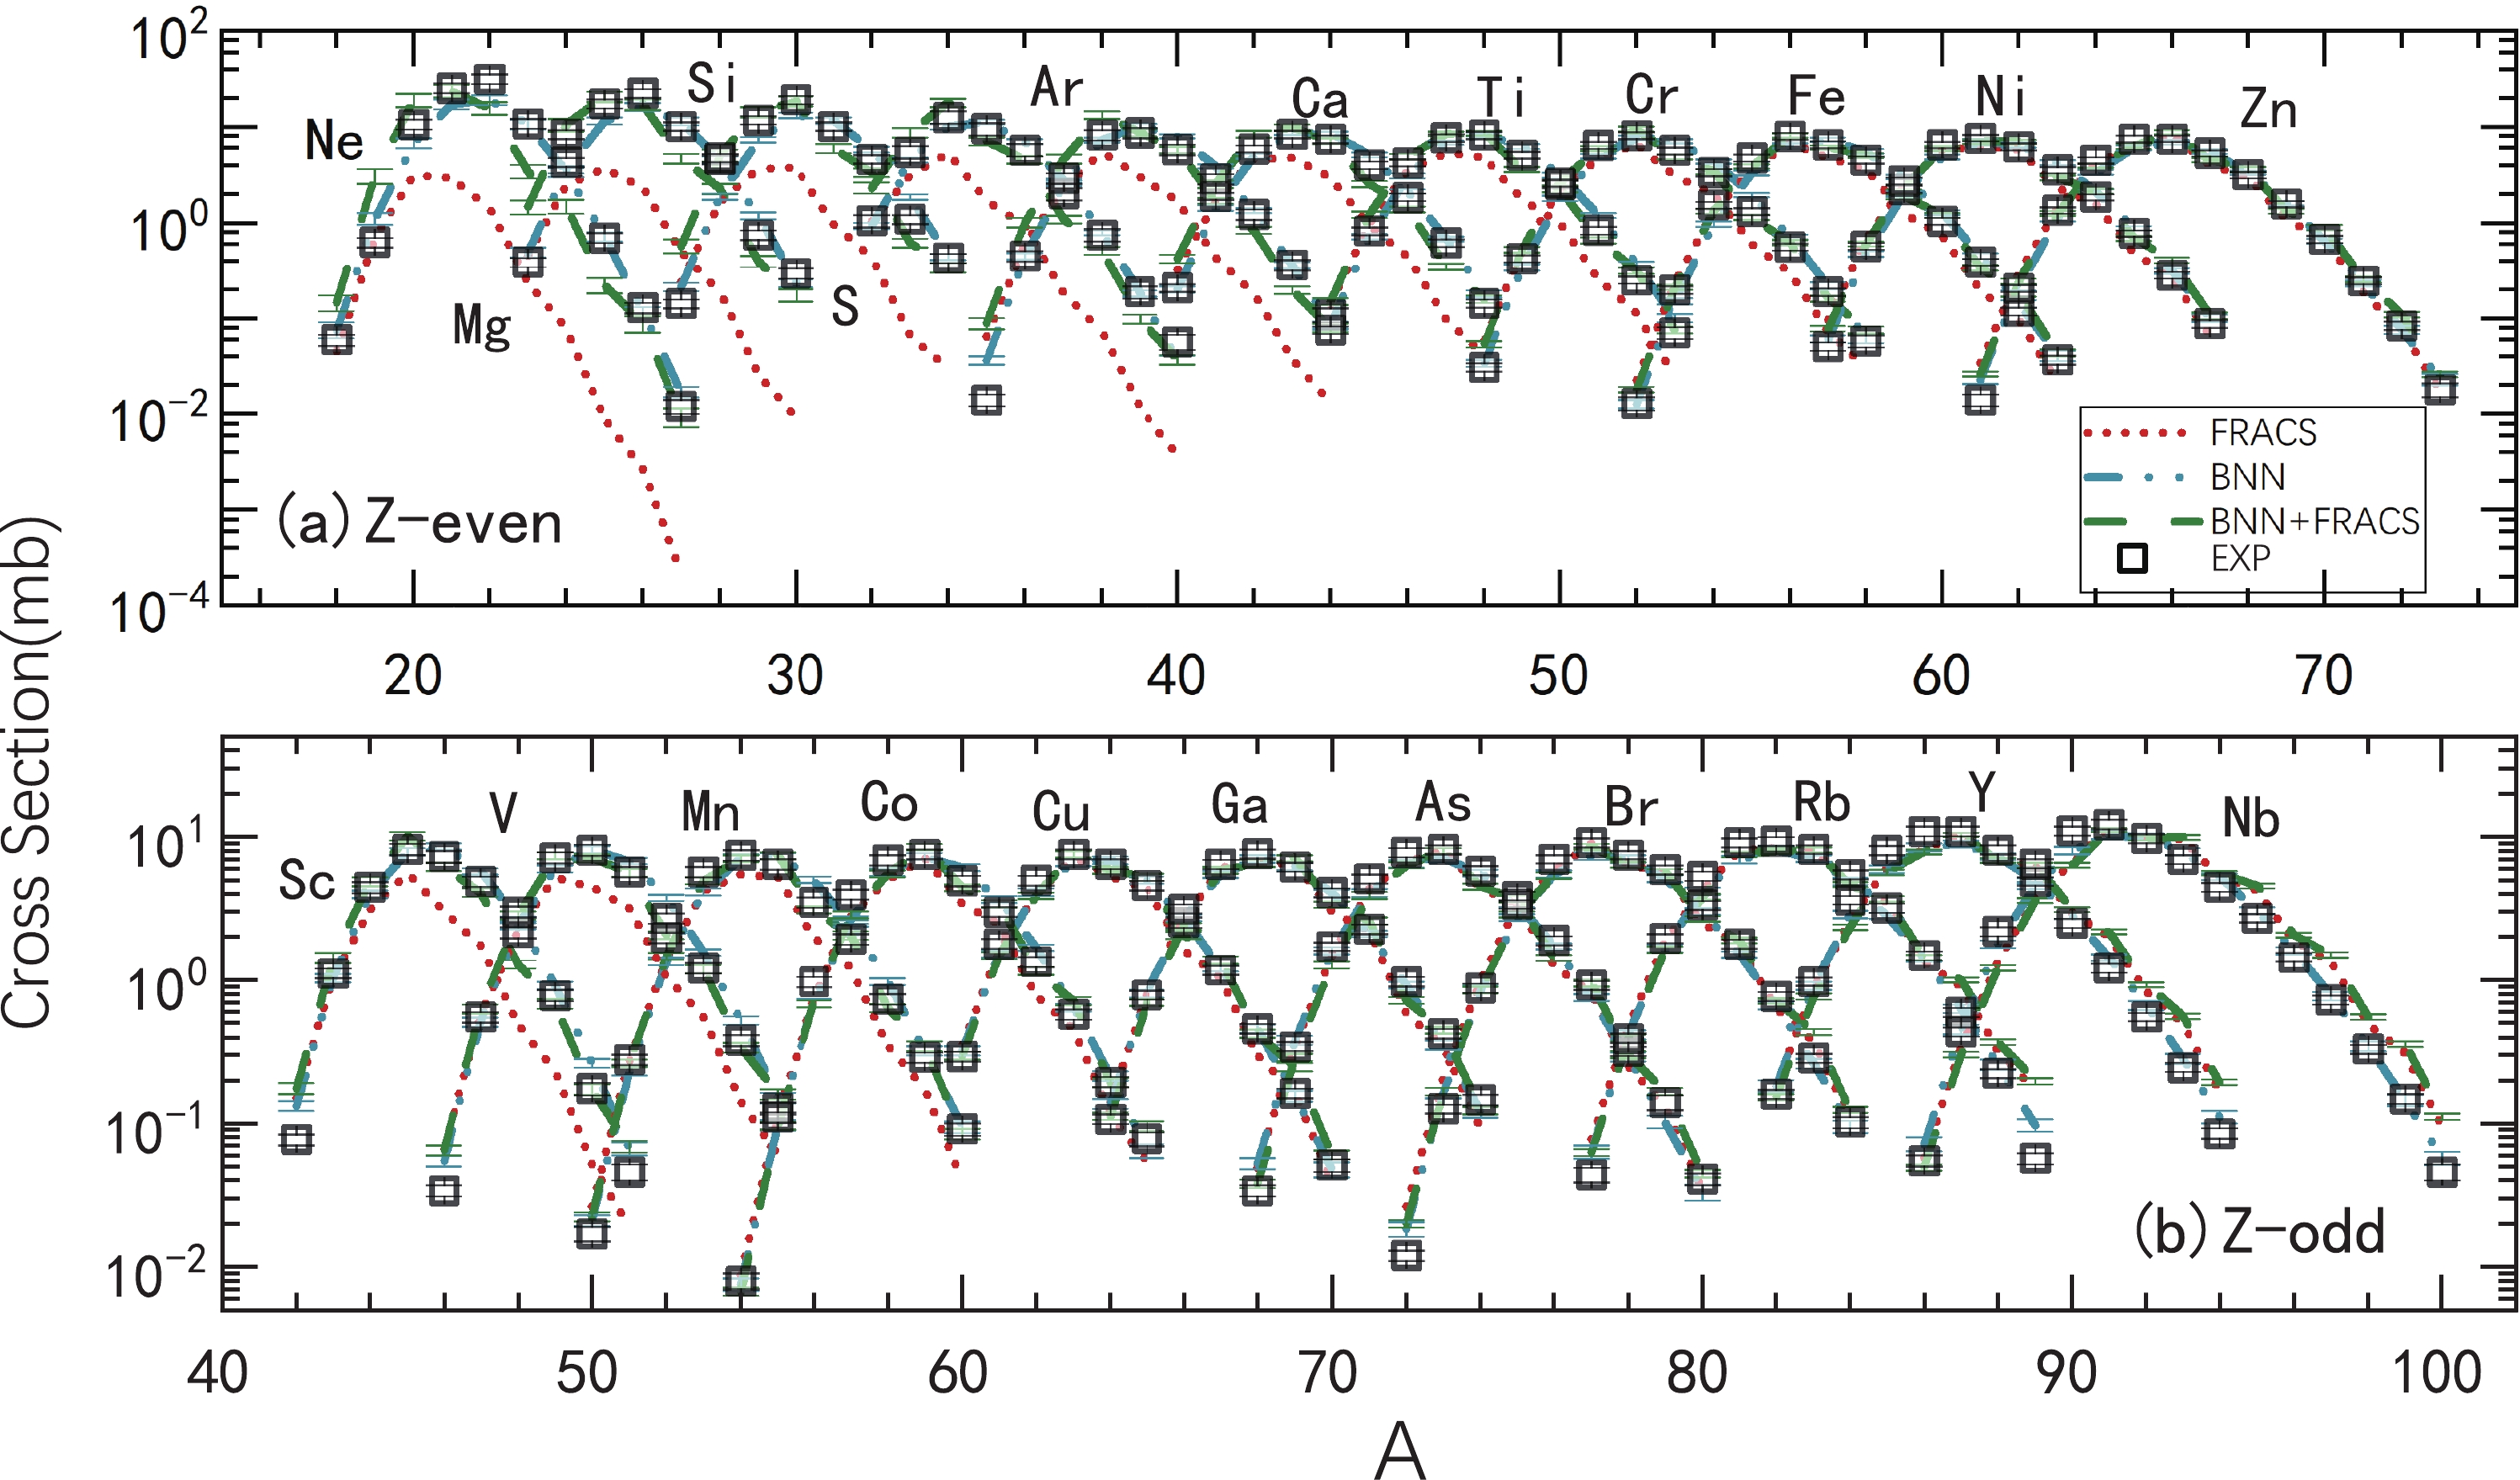
Figure 2. (color online) Isotopic cross section for fragments in the 1000 MeV/u 136Xe +
$ ^9 $ Be reaction (measured data taken from Ref. [61]). The predicted results by FRACS (dot lines), BNN (dash dot lines), and BNN + FRACS (dash lines) are compared to the measured values (squares).As discussed in Sec. II.B, the mass yield in projectile fragmentation reactions is a crucial term for predicting fragment cross sections, and its precision significantly influences the isotopic distribution in many empirical parametrizations, such as EPAX2 and EPAX3 [12, 13], FRACS [40, 41], and empirical scaling formulas [44]. It is interesting to verify whether the proposed BNN and BNN + FRACS models can produce a reasonable mass yield in PF reactions. In Fig. 3, the predicted mass production distributions for the 1050 MeV/u 80Kr + 9Be, 140 MeV/u 58Ni + 9Be, 98.1 MeV/u 69Cu + 9Be, 140 MeV/u 64Ni + 181Ta, 128 MeV/u 48Ca + 181Ta, and 64 MeV/u 86Kr + 181Ta reactions are compared to the measured distributions. In panels (a)–(c), reactions with the light 9Be target are shown, while in panels (d)–(f), reactions with the heavy 181Ta target are shown. In general, the FRACS model effectively reproduces the mass distributions, although it tends to underestimate the results for light fragments, for example, in panel (d) and (f) for the 140 MeV/u 64Ni + 181Ta and 64 MeV/u 86Kr + 181Ta reactions. The odd-even staggering in the mass distributions are reproduced by FRACS, which is the main improvement compared with EPAX [40]. In panel (f), the FRACS predictions significantly underestimate the measured results for the
$ A < 70 $ fragments because it did not consider the incident energy dependence of mass production. The BNN model can effectively reproduce the mass distributions as well as odd-even staggering in the distributions. The BNN + FRACS predictions of the mass distributions are similar to those by the BNN model. This makes it possible to guide the experiments so that only the mass or charge cross sections are measured [91–93].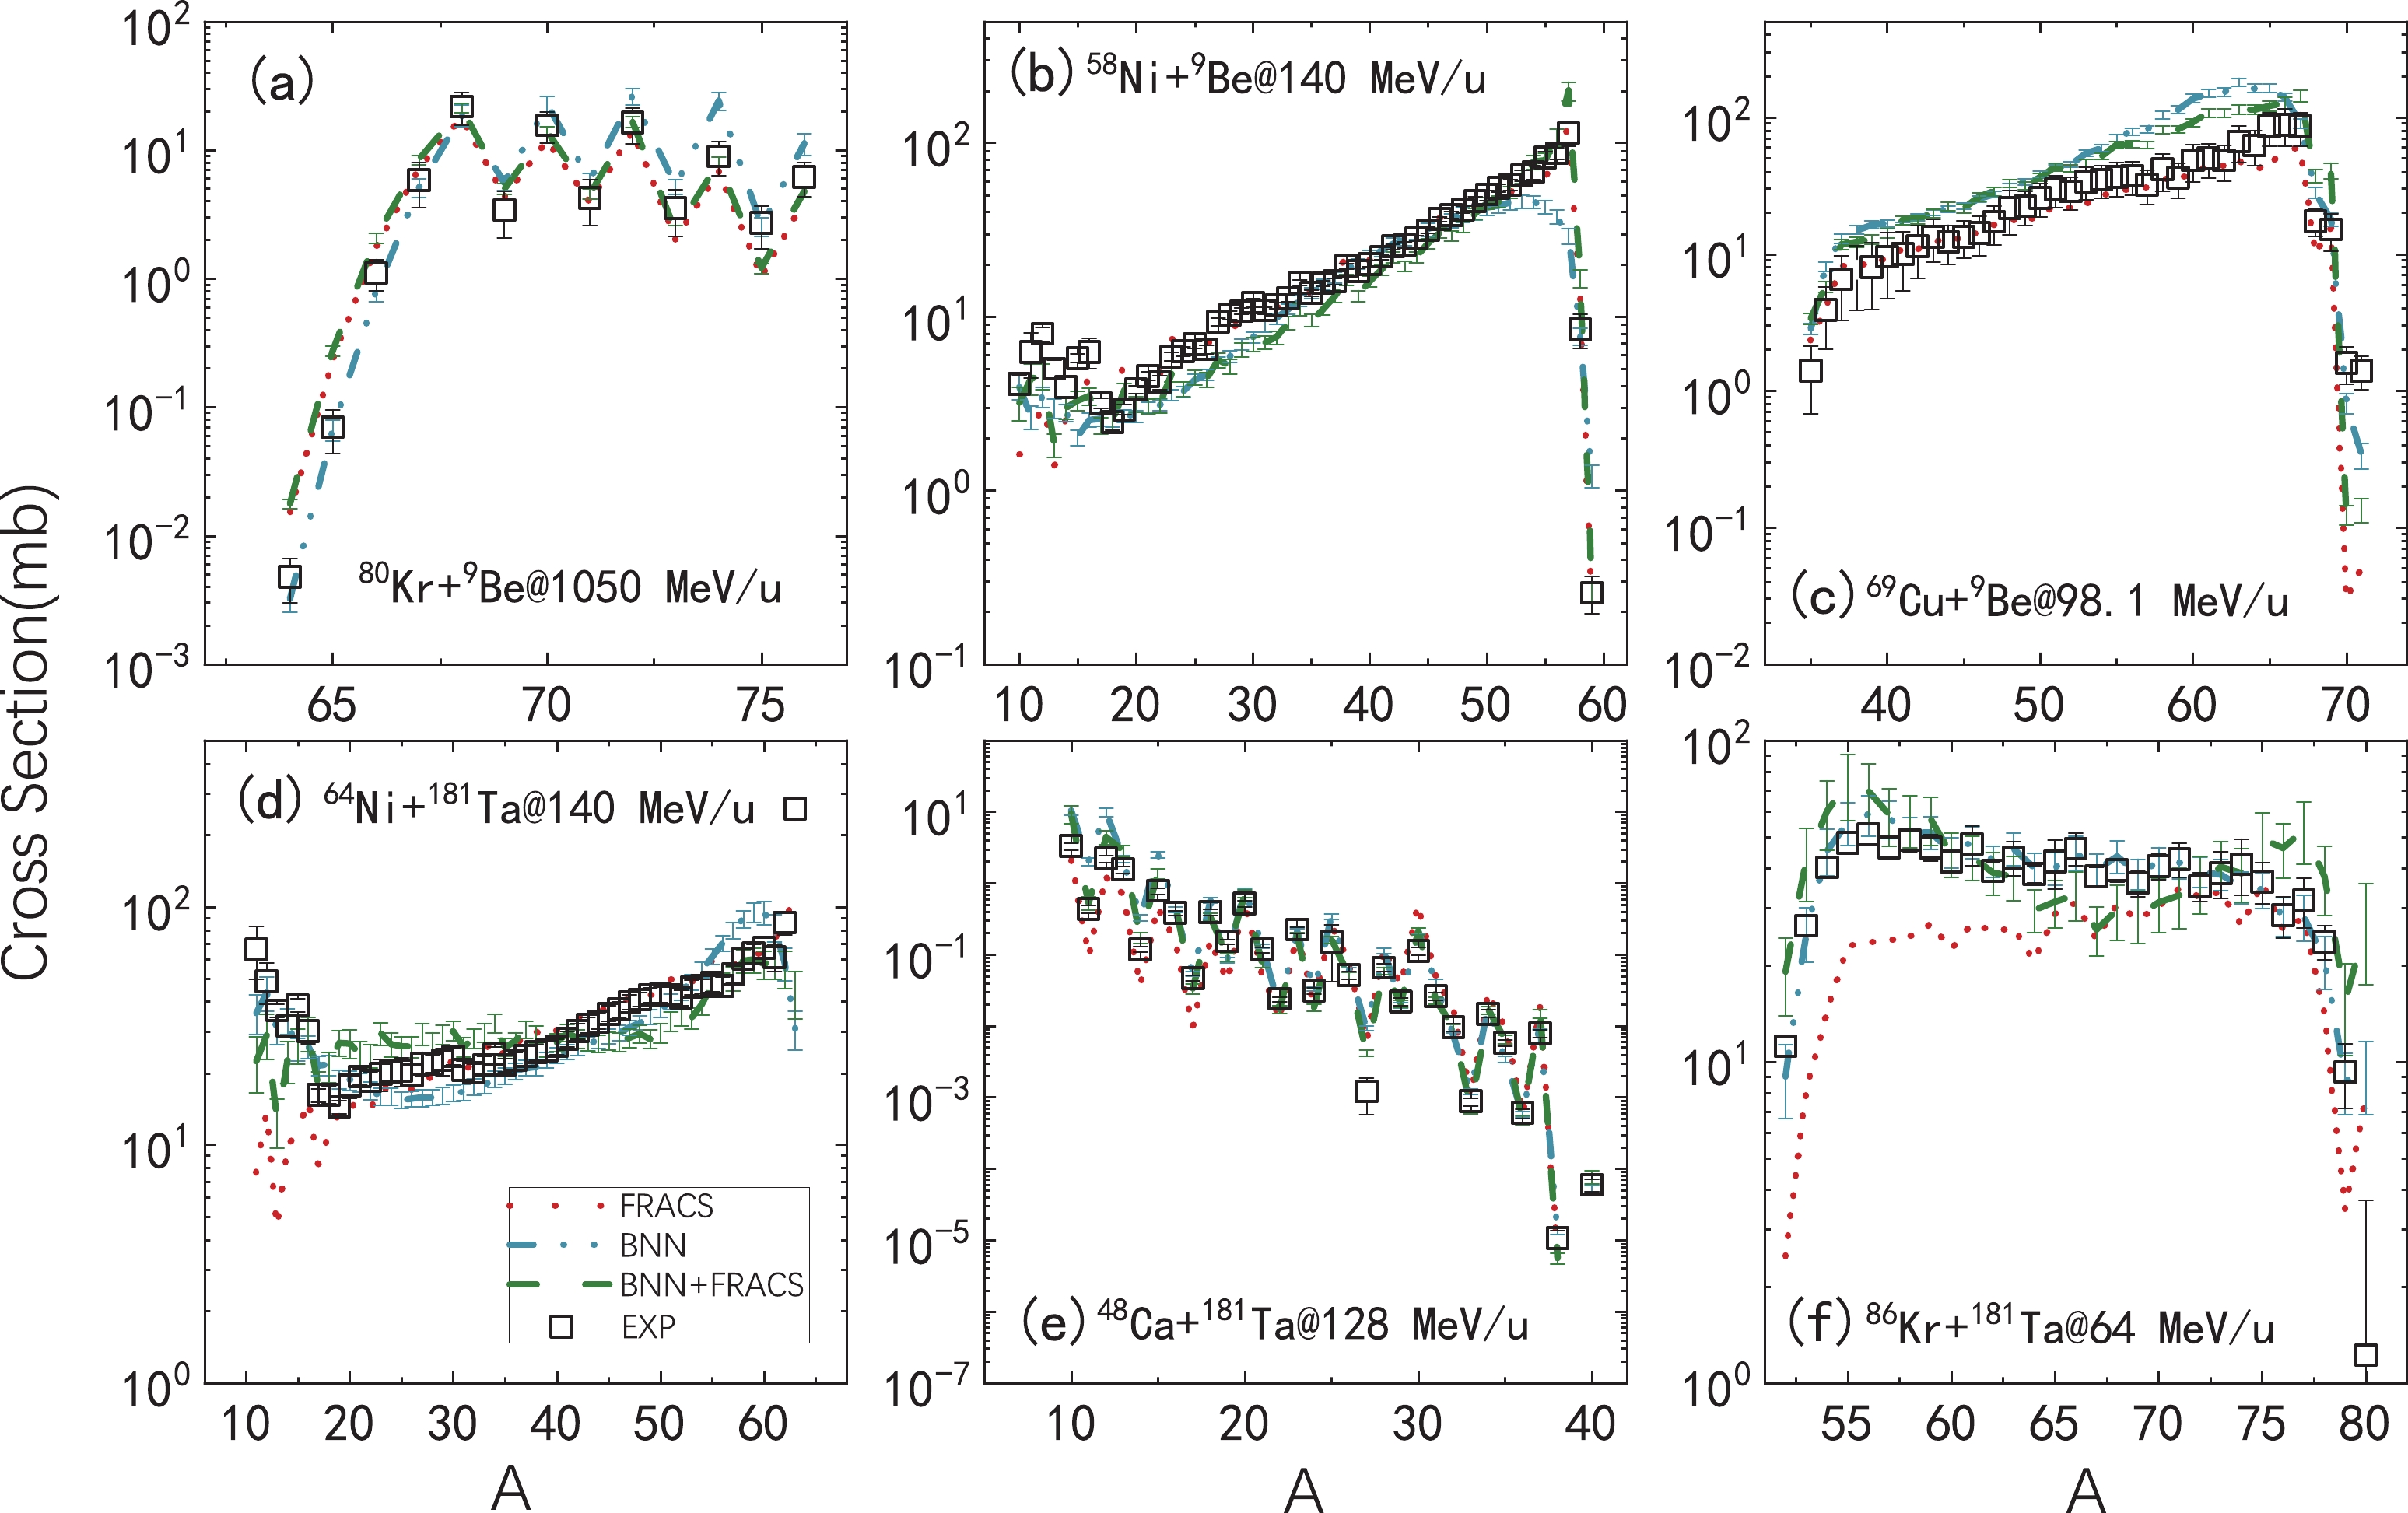
Figure 3. (color online) Mass production distributions using the BNN (dash-dotted lines), BNN + FRACS (dashed lines), and FRACS (dotted lines) models compared to the measured data (squares) in reactions of 1050 MeV/u 80Kr + 9Be, 140 MeV/u 58Ni + 9Be, 98.1 MeV/u 69Cu + 9Be, 140 MeV/u 64Ni + 181Ta, 128 MeV/u 48Ca + 181Ta, and 64 MeV/u 86Kr + 181Ta. For the data source of the measured reactions, see Table 1.
To further verify the precision of the model predictions, an empirical formula relating the production cross section to the average binding energy of a fragment is adopted [22, 94].
$ \sigma(A_f,Z_f) = C\exp[(<B'>-8)/\tau], $

(11) where
$< B' > =(B-\varepsilon_{\rm pair})$ , C and τ are free parameters, and$\varepsilon_{\rm pair}=1/2[(-1)^{N_f}+(-1)^{Z_f}]\varepsilon \cdot A_f^{-3/4}$ minimizes odd-even staggering in the fragment distributions. This has been shown to be well obeyed by both neutron-rich [45] and neutron-deficient fragments [43, 95, 96], which provides an empirical approach to study the properties of recently produced neutron-deficient rare isotopes [97–99] and the validity of model predictions.The results in Fig. 4 show the fitting to the correlation between
$ \sigma_{\exp} $ and$ <B'> $ according to Eq. (11) for the 128 MeV/u 40Ar + 9Be [81], 140 MeV/u 48Ca + 9Be and 64Ni + 9Be [78], and 500 MeV/u 86Kr + 9Be [70] reactions. The binding energies of nuclides are adopted from the new version of the atomic mass evaluation, AME2020 [8]. The fittings end at 31F, 39Na, 41Mg, 61Ca, 65Ti, and 70Cr owing to the absence of their binding energies in AME2020. It is observed that the BNN and BNN + FRACS predictions are close to those from the empirical formula, although for BNN, underestimations appear for the highly neutron-rich sodium isotopes in the 40Ar and 48Ca reactions and the titanium isotopes in the 64Ni reactions. The BNN also overestimate the neutron-rich calcium isotopes in the 64Ni reaction. For the BNN + FRACS model, a larger underestimation is observed for the neutron-rich sodium isotopes in the 40Ar and 48Ca reactions compared to those by the BNN model, as well as the titanium isotopes in the 64Ni reaction.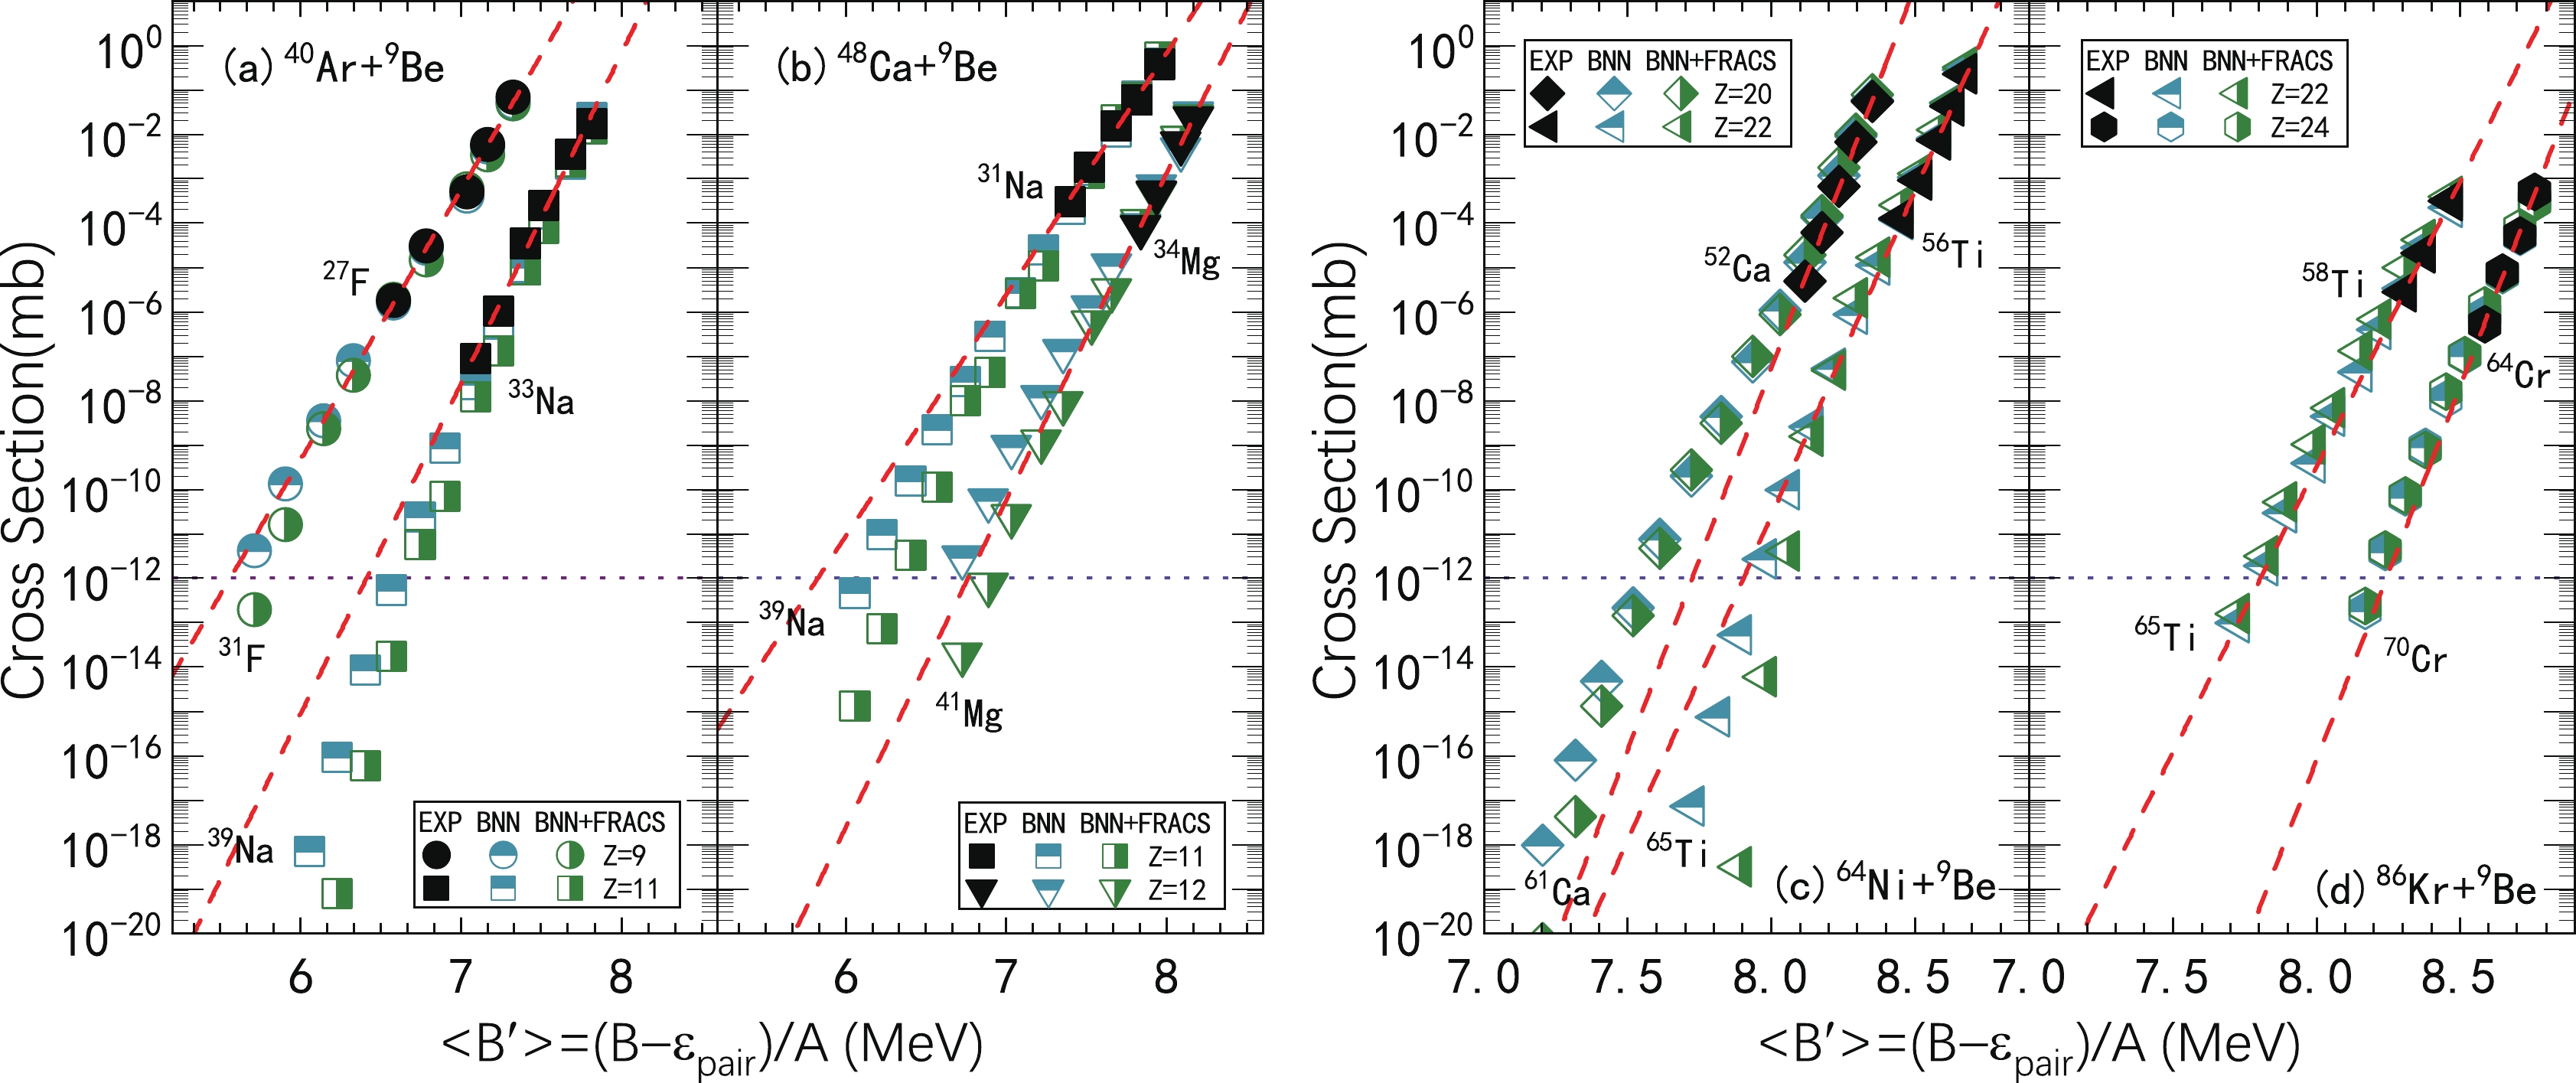
Figure 4. (color online) Isotopic cross-section distributions of neutron-rich fragments produced in the 128 MeV/u 40Ar + 9Be [81], 140 MeV/u 48Ca + 9Be and 64Ni + 9Be [78], and 500 MeV/u 86Kr + 9Be [70] reactions plotted as a function of average binding per nucleon with pairing corrections
$ <B'> $ . The dashed lines indicate the best fitting to the correlation from Eq. (11). The predicted cross sections by the BNN and BNN + FRACS models are denoted by half-full symbols with different colors (see text for details). For clarity, the$ <B'> $ values for the fluorine (Z=9) and calcium isotopes (Z=20) are reduced by 0.3 and those for the magnesium (Z=12) and chromium (Z=24) isotopes are increased by 0.3.Finally, the constructed BNN and BNN + FRACS models are used to predict some reaction systems that are not incorporated in the training dataset. The isotopic cross sections in the 139 MeV/u 82Se + 9Be reaction [100] are compared. In Fig. 5, the predicted isotopic cross sections by the BNN and BNN + FRACS models are compared to the measured values. From the sodium (
$ Z =11 $ ) isotopes to the copper ($ Z=29 $ ) isotopes, the FRACS model first reproduces the isotopic cross sections well (within$ 11\leq Z \leq 17 $ ) before generally overestimating the measured results. Except for the overestimation of the fragments of$ Z = $ 11–13, the BNN predictions effectively reproduce the measured data. The BNN + FRACS model predictions are close to those by FRACS for fragments with$ Z = $ 11–13; however, the general prediction precision is enhanced. The complementary relationship between the BNN and BNN + FRACS models is manifested.Predictions for the extreme rare isotopes are also verified. At the RIKEN-RIBF, highly neutron-rich
$ ^{59,60} $ Ca have been measured in the 345 MeV/u 70Zn + 9Be reaction [101], and highly neutron-deficient$ ^{54-56} $ Zn have been measured in the 345 MeV/u 78Kr + 9Be reaction [102]. Predictions for$ ^{59,60} $ Ca production have been performed [45,46] using FRACS and other empirical methods, which are shown to be in good agreement with the measured data. In Fig. 6, the predicted results by the FRACS, BNN, and BNN + FRACS models are compared to the measured values. For neutron-rich calcium isotopes in the 70Zn + 9Be reaction, from 57Ca to 65Ca, the FRACS, BNN, and BNN + FRACS predictions are similar, whereas a significantly lower cross section is obtained for 66Ca by FRACS compared to those by BNN and BNN + FRACS. For neutron-deficient zinc isotopes, FRACS, in general, overestimates the measured data, whereas the results from BNN and BNN + FRACS are in good agreement with the measured data. The predictions by BNN and FRACS are similar for$ ^{48-50} $ Zn and significantly larger than those by BNN + FRACS. It is indicated by the predictions that if the limit for extreme rare isotopes is extended to above 10$ ^{(-15)} $ mb, it is possible for 61Ca and$ ^{50-53} $ Zn to be discovered in typical beams of 70Zn and 78Kr at 345 MeV/u at the RIKEN-RIBF factory.
Figure 6. (color online) Cross sections for
$ ^{57-66} $ Ca produced in the 345 MeV/u 70Zn + 9Be reaction (panel (a)), and those for$ ^{48-58} $ Zn produced in the 345 MeV/u 78Kr+9Be reaction (in panel (b)). The measured cross sections are denoted by squares, and the FRACS, BNN, and BNN + FRACS predictions are plotted as stars, circles, and triangles, respectively. The measured data for the 345 MeV/u 70Zn + 9Be and 78Kr+9Be reactions are taken from Refs. [101] and [102], respectively.To conclude, the constructed BNN and BNN + FRACS models can effectively reproduce the measured fragments of the training dataset in Table 1 and are potentially applicable to PF reactions with incident energies from tens of MeV/u to 1 GeV/u, projectile nuclei with mass numbers from approximately 40 to 208 and charge numbers from approximately 18 to 82, and a wide range of fragments in PF reactions. For extreme rare isotopes produced in typical RNBs provided by the RIKEN-RIBF, the BNN and BNN + FRACS models can effectively reproduce the cross sections of fragments, which indicates that they can be further applied to experiments performed at the new generation of RNB factories.
-
In this study, a direct BNN and physical guiding BNN + FRACS model were constructed to predict fragment production in projectile fragmentation reactions. A comprehensive training dataset was constructed based on the available experiments on 53 reactions and 6393 measured fragments, which cover a wide range of incident energies from 40 MeV/u to 1 GeV/u, projectile nuclei from intermediate mass 40 (argon) to as heavy as 208 (lead), and various targets of both light and heavy nuclei. Compared to the measured data and predictions by FRACS parametrization, the BNN and BNN + FRACS models revealed high reproduction of fragment production in PF reactions, particularly of fragments near the drip lines. It is suggested that the BNN and BNN + FRACS models can serve as a new method of predicting extreme rare isotope production in new experiments at 3G RNB factories.
All data from this study have been compiled and uploaded as a supplement to this article.
Precise machine learning models for fragment production in projectile fragmentation reactions using Bayesian neural networks
- Received Date: 2022-02-08
- Available Online: 2022-07-15
Abstract: Machine learning models are constructed to predict fragment production cross sections in projectile fragmentation (PF) reactions using Bayesian neural network (BNN) techniques. The massive learning for BNN models is based on 6393 fragments from 53 measured projectile fragmentation reactions. A direct BNN model and physical guiding BNN via FRACS parametrization (BNN + FRACS) model have been constructed to predict the fragment cross section in projectile fragmentation reactions. It is verified that the BNN and BNN + FRACS models can reproduce a wide range of fragment productions in PF reactions with incident energies from 40 MeV/u to 1 GeV/u, reaction systems with projectile nuclei from 40Ar to 208Pb, and various target nuclei. The high precision of the BNN and BNN + FRACS models makes them applicable for the low production rate of extremely rare isotopes in future PF reactions with large projectile nucleus asymmetry in the new generation of radioactive nuclear beam factories.


 Abstract
 HTML
HTML Reference
 Related
 Supplemental material
 PDF
PDF






 DownLoad: