


 Abstract
 HTML
HTML Reference
 Related
 PDF
PDF


-
The correlation between cosmic ray variations and thunderstorm electric fields has been an important topic in the interdisciplinary science of cosmic ray physics and atmospheric physics. During thunderstorms, the intensity of atmospheric electric fields (AEFs) can reach 2000 V/cm [1–3], and the polarity can change dramatically [4]. By acceleration/deceleration of strong electric fields, the secondary charged particles in extensive air showers (EAS) can be significantly affected.
In 1924, the concept of “runaway electrons” was first suggested by Wilson [5] and then developed by Gurevich et al. in 1992 [6]. A secondary electron (with tiny mass) in an EAS can be accelerated by the strong AEF in thunderclouds and gain energy exceeding that lost in ionization and bremsstrahlung. The acceleration of secondary electrons there can be runaway, which may ionize more air molecules, generating even more electrons, which are further accelerated by the field, resulting in an avalanche. This process is now commonly called the relativistic runaway electron avalanche (RREA) [7]. Building on the RREA theory, Dwyer et al. [8–11] presented the relativistic feedback mechanism, including X-ray feedback (important for a stronger AEF) and positron feedback (dominating at lower field strengths).
Over the years, several high-altitude experiments, i.e., the Carpet air shower array [12], EAS-TOP [13], ASEC [14, 15], Tibet ASγ [16], ARGO-YBJ [17], SEVAN at Lomnický Štít [18, 19], a network of thermal neutron detectors [20], and detectors on Mount Norikura [21, 22] and Mount Fuji [23], have reported flux variations of cosmic rays associated with thunderstorm episodes. The RREA mechanism could be the source of the strong thunderstorm ground enhancements (TGEs), where the particle flux measured at the ground level exceeds the background values by several times. Several satellite-based experiments, such as CGRO [24], AGILE [25], and Fermi-GBM [26], have observed thousands of terrestrial gamma-ray flashes (TGFs), sub-millisecond gamma-ray emissions originated from bremsstrahlung by runaway electrons. The RREA process is thought to be responsible for TGFs.
According to the proposed theory [8, 27], the AEF strength threshold (Eth) required to generate the RREA process is a function of the altitude. At the altitude of the LHAASO site, Eth ≈ 1660 V/cm, and because the field strength required to trigger the RREA process is very large, it should only occur rarely. Some ground-based experiments observed smaller TGEs with flux increases of less than 10% [15, 18, 28]. Several teams have reported decreases in secondary particle intensity during thunderstorms [12, 17, 29]. These phenomena cannot be reasonably explained by the RREA process. By performing Monte Carlo simulations, it was found [30] that the flux of the secondary positions and electrons decreased in a certain range of positive fields (a positive AEF is defined as the direction pointing towards the ground) and increased in negative fields. This phenomenon was attributed to the asymmetry in number and energy of electrons and positrons in EAS. This hypothesis was supported by the experimental results of ARGO-YBJ in scaler mode and the simulated development of electrons and positrons in EAS [17].
In addition, there have been some reports on the energy and lateral distribution of secondary particles during thunderstorms. The effect of the electric fields on the energy of secondary particles was analyzed [31–33] and it was found that the energy spectrum was softened in the presence of the field. The variation in the lateral density of secondary positrons and electrons was simulated, and it was shown that the lateral distribution became wider [34].
During a thunderstorm, the intensity and polarity of the AEF may vary dramatically, which is mostly caused by the discharge of lightning. Lightning is a common geophysical phenomenon, which is characterized as a very long electrical spark and usually divided into two categories, cloud-to-ground (CG) lightning and intra-cloud (IC) lightning [35, 36].
The correlation between lightning and cosmic ray variations has also been studied. Numerous TGF-related lightning events have been observed by satellites and it is widely believed that IC lightning triggers the TGF events [37–39]. However, according to the ground-based experiments, terminations of TGEs by lightning have been observed [40, 41].
Even though many insights about the correlation between cosmic rays and thunderstorms have been obtained via studies by many authors, because of the complexity of thunderstorms, some questions still remain unresolved. For example, does the IC lightning trigger or terminate the enhancement of cosmic rays? To date, there is no complete image of the flux variations of cosmic rays from different incident directions during thunderstorms. These issues are still far from being understood completely, and more observations and simulations are required to shed light on them.
LHAASO is suitable to study the correlation between thunderstorms and the variations in cosmic rays owing to its large active area and its location at high altitude with frequent thunderstorms. In this study, the variations measured by KM2A during a thunderstorm on June 10, 2021, were investigated in detail. Comparing the data to the Monte Carlo simulations, a simple model of the AEF was obtained.
-
LHAASO, a new generation hybrid extensive air shower (EAS) array, has been constructed at Haizi Mountain (4410 m a. s. l., in Daocheng, Sichuan province, China) aiming at the study of cosmic ray physics and γ-ray astronomy [42, 43]. It consists of three types of detector arrays: a 1.3 km2 array (KM2A), a 78000 m2 water Cherenkov detector array (WCDA), and a wide field-of-view air Cherenkov telescope array (WFCTA) with 18 telecopes. As the largest component of LHAASO, KM2A contains 5216 electromagnetic particle detectors (EDs) and 1188 muon detectors (MDs). The ED array covers an area of 1.3 km2 in a triangular grid. It is divided into two parts: a central part with 4911 EDs (15 m spacing) in a circular area with radius of 575 m, and a guard ring with 305 EDs (30 m spacing) surrounding the central area with outer radius of 635 m. The EDs mainly detect the electromagnetic particles in the shower, which are used to reconstruct the shower parameters (i.e., core position, arrival direction, and primary energy). The 1188 MDs are deployed in a triangular grid with spacing of 30 m in the central part of the array. Enclosed within a cylindrical concrete tank, the entire MD detector is covered by a soil layer with a thickness of 2.5 m to absorb the secondary positrons, electrons, and γ-rays in showers, but not the muons. More details about the designs of the ED and MD can be found elsewhere [43].
The KM2A detectors were constructed and merged into the data acquisition system (DAQ) in stages. The first 33 EDs started operating in February 2018. Half of the KM2A array, including 2365 EDs and 578 MDs, started running on December 27, 2019. Through the analysis of the 136 live days of data detected by the 1/2 KM2A array, the first observation of the Crab Nebula and the detector performance were presented [44]. The 3/4 KM2A array (including 3978 EDs and 917 MDs) began acquiring data on December 1, 2020. Finally, the entire array has been running stably since July 20, 2021. By analyzing the partly completed KM2A data, some important results, such as PeVatrons from Galactic sources, were obtained [45].
For some ground-based experiments, there are two independent data acquisition systems, corresponding to the shower and scaler operation modes [17, 46]. In KM2A, the scaler mode [47] is under study. In this study, data of the shower mode are analyzed. In the shower mode, the trigger logic requires at least 20 EDs fired within a time window of 400 ns. For each shower event, the DAQ records 10 μs of data from all the EDs and MDs that have signals over the thresholds. The ED signals are used for shower reconstruction, while the MD signals are used to select γ-ray induced showers [44].
To study the cosmic ray variations during thunderstorms, a ground-based electric field mill (Boltek EFM-100) was installed at LHAASO on September 17, 2019. The EFM-100 is designed to measure the AEF and provide a real-time electric field versus time graph. With the help of the time rate of change of the step electric field change, the lightning distance is estimated. The EFM-100 can record lightning out to approximately 48 km, and the location accuracy is ~1.6 km [48]. To prevent the rotor from being damaged, the mill was located on the roof of the WCDA-2 building. Considering the AEF enhancement due to the location above the ground level, the reference field mill was mounted flush with the surface of the ground to calibrate. After the correction factor was applied, the dynamic range of the AEF measurement was from –270 to 270 V/cm.
-
Thunderstorms are common weather phenomena at high altitudes. From October 2019 to March 2022, there were more than 200 thunderstorm events detected by the field mill at LHAASO. Most of them were recorded from April to September. A thunderstorm that occurred on June 10, 2021 (here, we call it Thunderstorm 20210610), is the most notable one. The specific information is presented in Fig. 1. Thunderstorm 20210610 is a complex episode, which is characterized by frequent changes in electric field polarity, a long time of field strength in saturation, and the presence of 11 nearby (<1.6 km) lightning strikes. In this study, the cosmic-ray variations detected by KM2A during Thunderstorm 20210610 were studied in detail.

Figure 1. (color online) Variation in the near-earth AEF and distance to the lightning strike (<10 km) recorded by Boltek EFM-100. Time zero of the x-axis is 10:10:00 UT (the same below).
From Fig. 1, it can be observed that the AEF disturbance lasted approximately two and a half hours, from 10:15:36 to 12:42:48 (UT) on June 10, 2021. For most of this period, the field mill was saturated. During this interval, the AEF polarity changed as many as 46 times. There were 1712 lightning strikes estimated by EFM-100. Most of them were distant lightning strikes with a mean distance of approximately 27 km. For ground-based experiments, if the thundercloud is far from the detector, the cosmic ray variations are small due to the heavy atmospheric attenuation [49]. Here, we only consider the effects of near-earth AEF and nearby lightning strikes on the cosmic rays measured by KM2A. The 24 lightning strikes with distances less than 10 km are also shown in Fig. 1.
To ensure the validity of our results, the operational status of detectors was carefully checked from different angles (such as the distributions of anode/dynode charge of particles for each detector and the distributions of hit number for each detector as a function of time). Some detectors were powered off due to strong lightning. We found that approximately 8% of the detectors were not working properly after 10:57:06. Only data from detectors that were operating normally before 10:57:06 were used in this study. They are shown in Fig. 2.
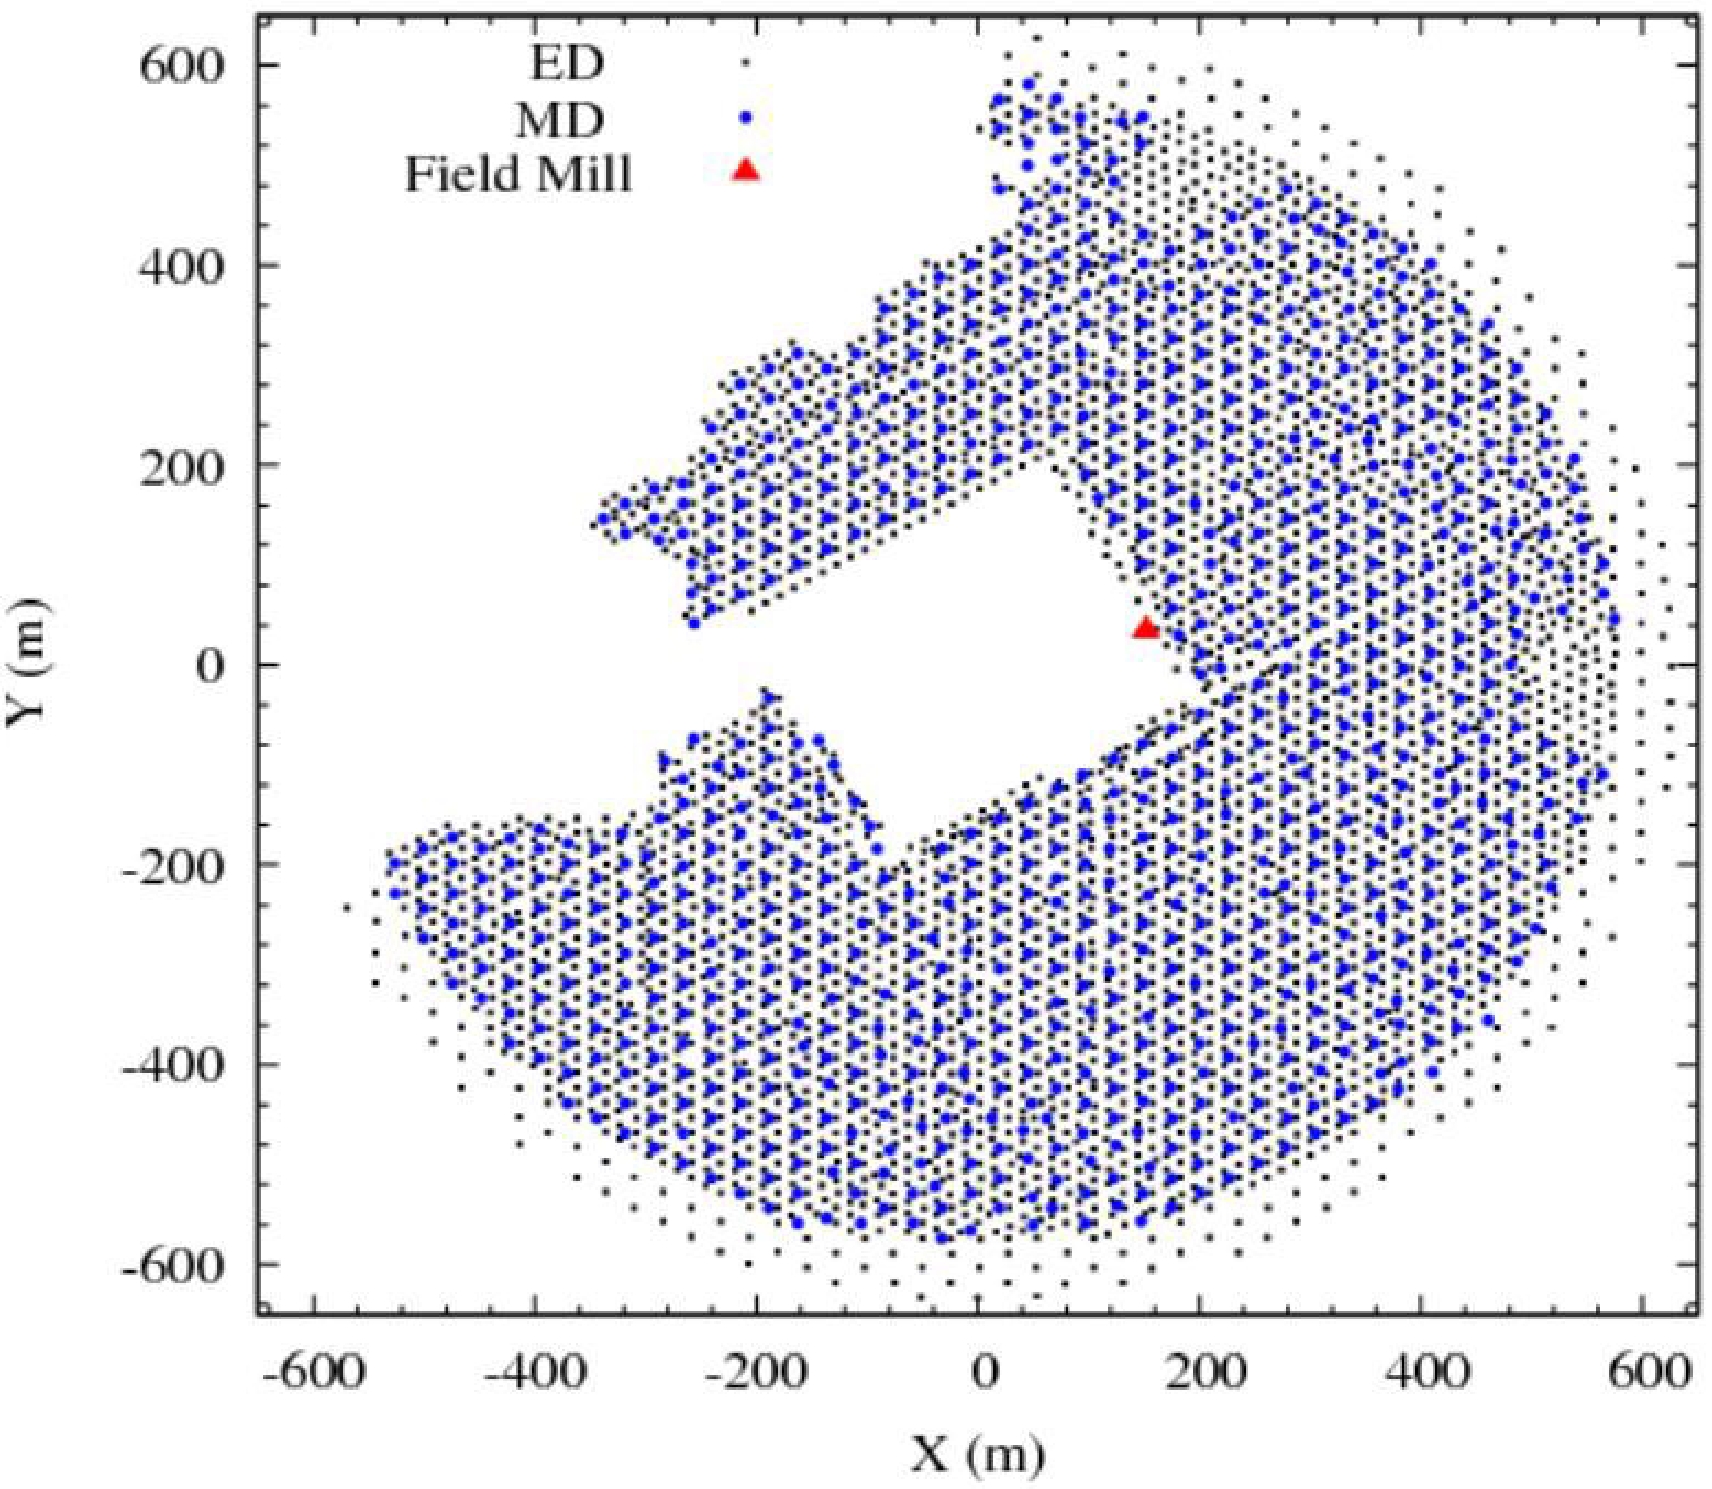
Figure 2. (color online) Layout of the 3/4 KM2A array with detectors that were operating normally during Thunderstorm 20210610. The black squares and blue dots indicate the EDs and MDs, respectively. The red solid triangle indicates the position of Boltek EFM-100.
-
Analyzing the data detected by KM2A, the flux variations of cosmic ray shower events and ground secondary particles during Thunderstorm 20210610 are as follows.
-
During thunderstorms, the secondary particles in EAS are strongly affected by the AEFs. As a result, the number of shower events that meet the KM2A trigger conditions (at least 20 fired EDs within 400 ns) will also change. During Thunderstorm 20210610, the distributions of the AEF, nearby lightning distance, and shower rate detected by KM2A are shown in Fig. 3.

Figure 3. (color online) Variations in AEF, distance to lightning strike(a), and shower rate (b) per second during Thunderstorm 20210610.
From Fig. 3(a), it can be observed that the thunderstorm event is very complex. From 720 to 2826 s (after 10:10:00 UT), the polarity and strength of the fields changed sharply. During the thunderstorm, the absolute values of AEF intensity exceeded the measuring range of the field mill several times. The total time in saturated status was 165 s in positive AEF and 918 s in negative AEF. There were 11 nearby lightning strikes (with distances less than 1.6 km) measured by the Boltek EFM-100 during these 24 min. Based on the variations in AEFs, these lightning strikes are most likely negative CG flashes. The thunderclouds can be simply assumed to be dipolar [50]. The main negative charge region is distributed at the lower dipole, and the positive one is located at the top of thundercloud. If the negatively charged area is close to the ground, a large amount of positive charge will be induced on the ground. When the induced charge is sufficient, strong negative CG flashes will be initiated. As a result, the lightning will destroy the lower dipole (negative charge), and positive charges at the top of the thundercloud will be exposed, resulting in the AEF value jumping from negative saturation to positive saturation [51]. Within 10–50 s, the lower negative charge can recover.
With respect to the shower rate measured in a period of 2000 s before the thunderstorm (defined as fair weather), the percent variations were calculated. As can be observed in Fig. 3(b), the shower rate significantly increases in thunderstorm fields, with the maximum increase exceeding 20%. Due to the acceleration by AEFs, the secondary particles with energy exceeding the detector threshold increases, and then more shower events satisfy the trigger conditions, resulting in the increase in shower rate.
From the studies in references [30, 52], the AEFs have different effects on cosmic rays with different zenith angles (θ). By analyzing the reconstructed events in KM2A (the details about event reconstruction can be found elsewhere [44]), the variations in shower rate in different zenith angle ranges are shown in Fig. 4. In this study, the events with reconstructed zenith angles less than 60o were analyzed. From 820 to 2202 s, the trigger rate presented structural increases in lower zenith angle ranges (
$0^\circ < \theta \leqslant 30^\circ$ ), with the maximum exceeding 29% at 2201 s. Meanwhile, for higher zenith angle ranges ($30^\circ < \theta \leqslant 60^\circ $ ), it decreased by up to 18%. From Fig. 4, we can clearly observe the opposite variation structures. As a result, the total variations in shower rates are reduced (see in Fig. 3(b)).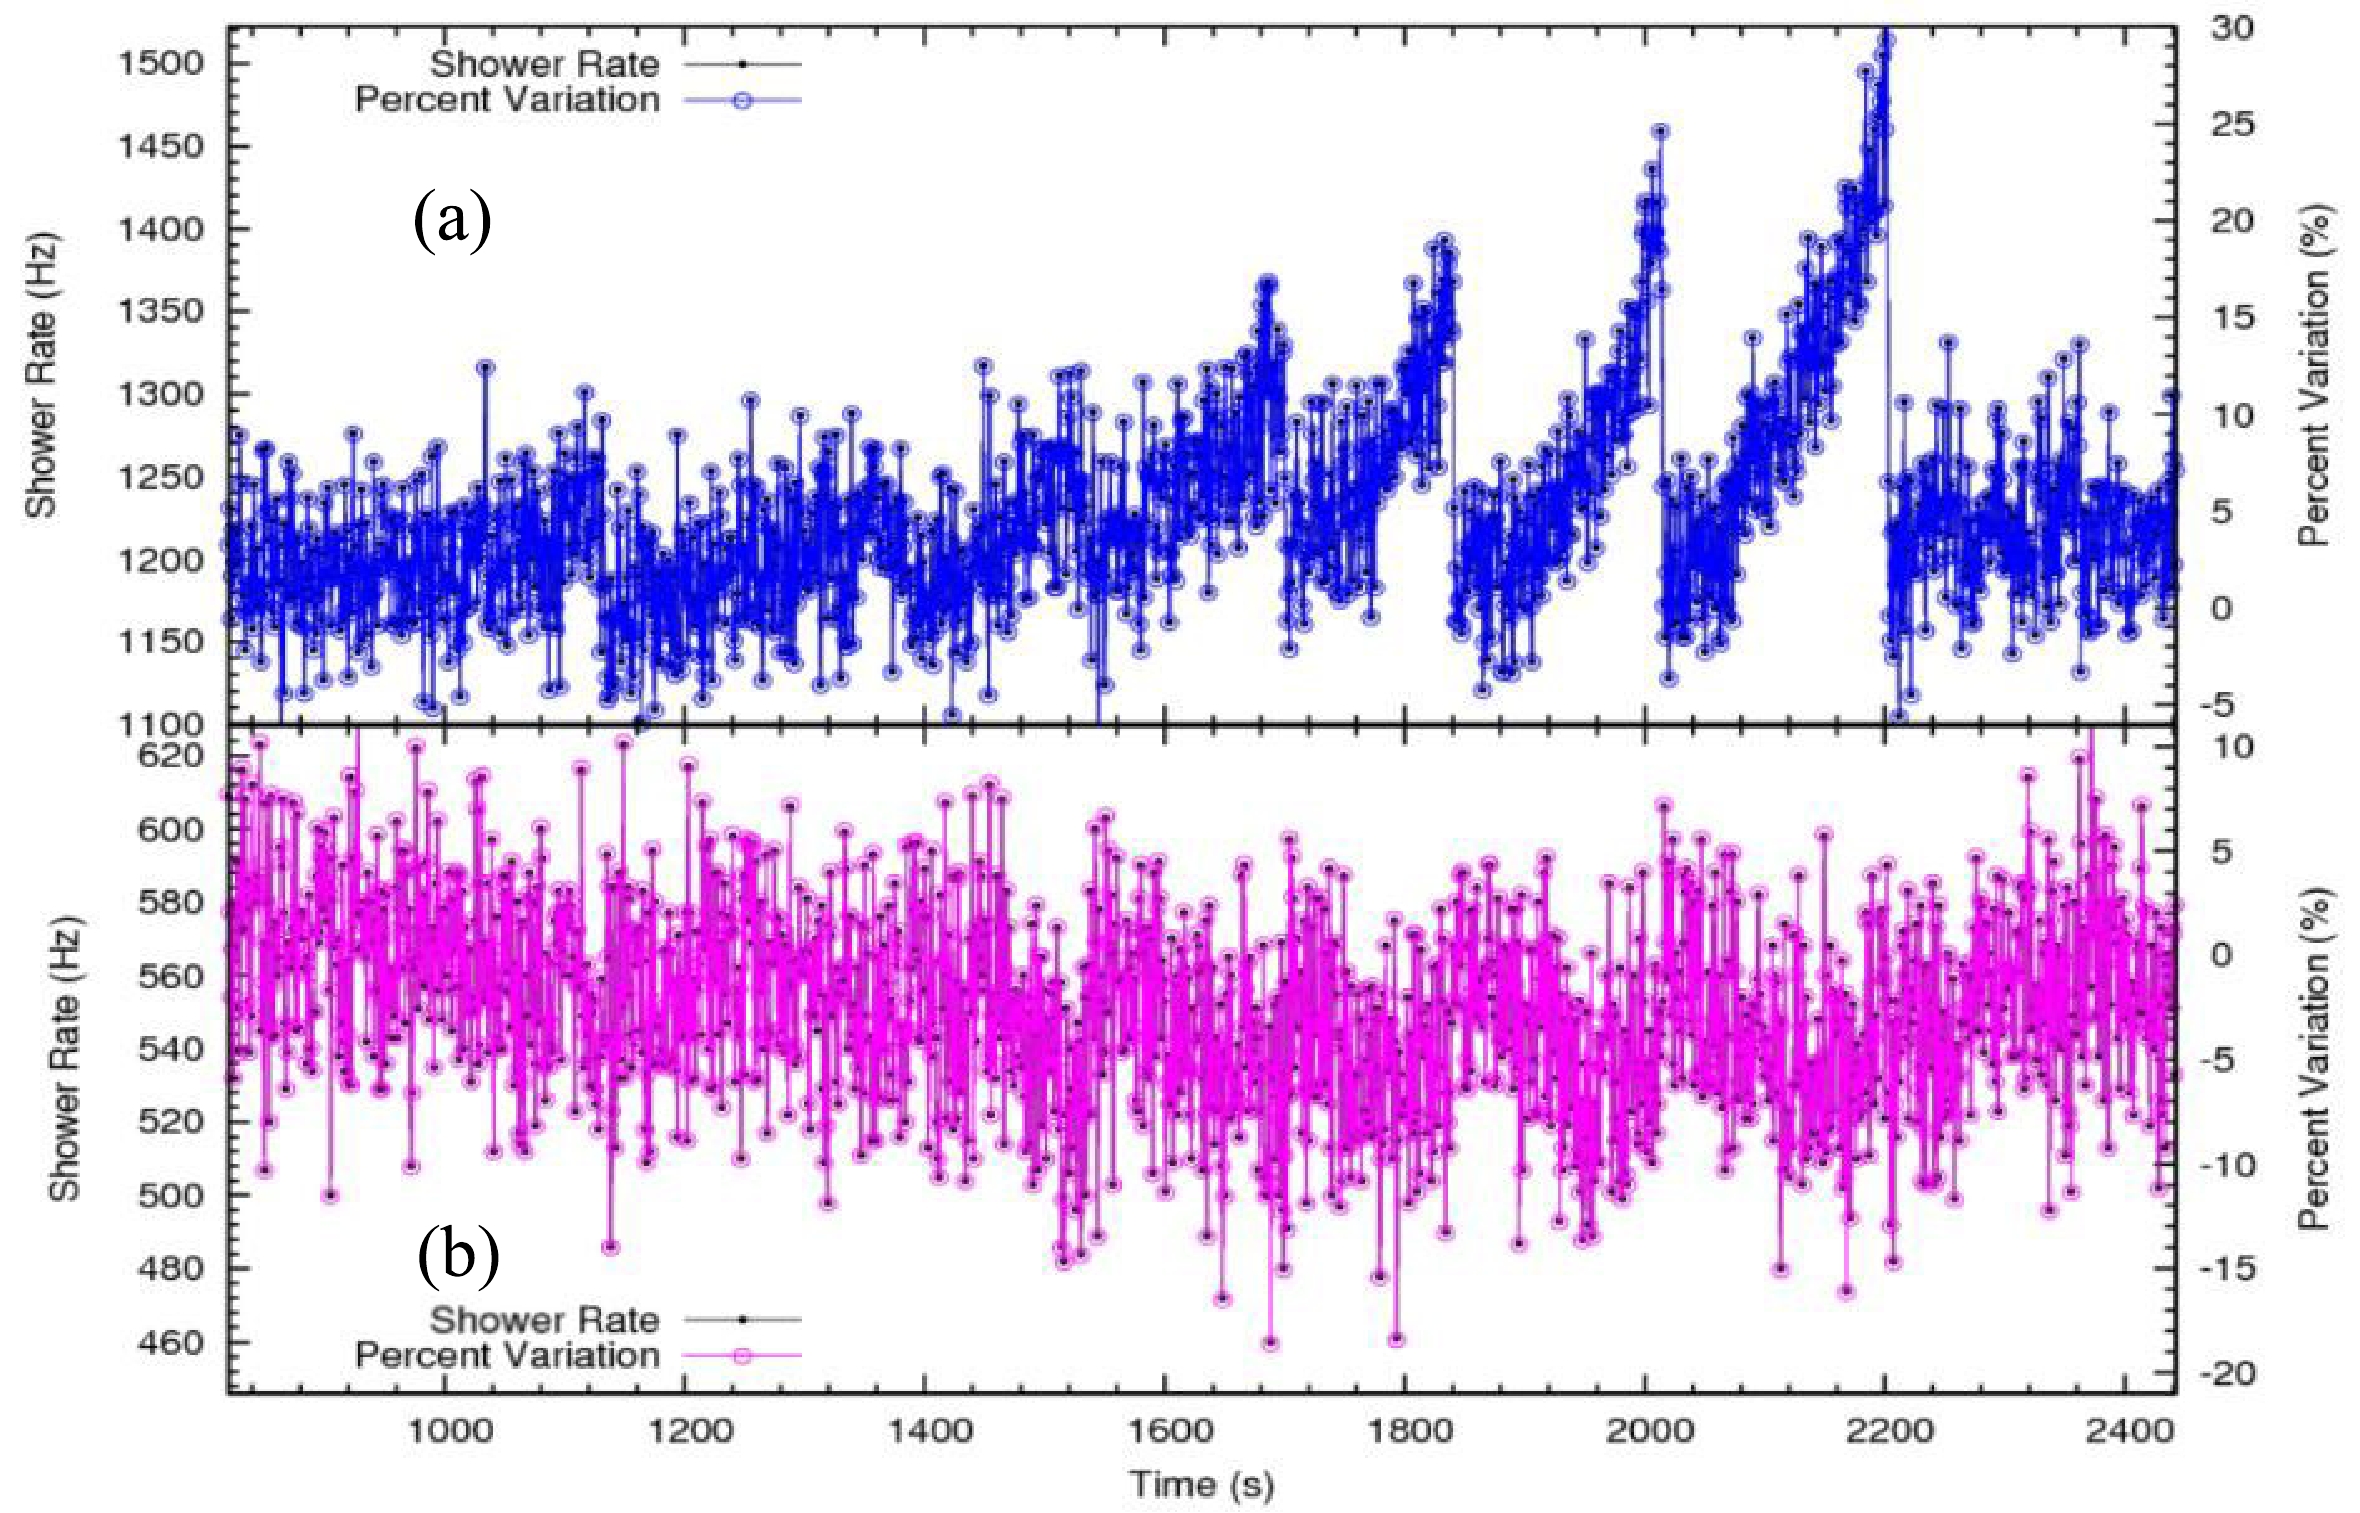
Figure 4. (color online) Shower rate variations per second in zenith angle ranges of 0o–30o (a) and 30o–60o (b), respectively.
Analyzing the data in saturated negative fields, the average value of shower rate as a function of zenith angle (4o/bin) is shown in Fig. 5. The result in fair weather is also shown for comparison. In saturated negative fields, the rate increases in smaller zenith angle ranges, and decreases in larger zenith angle ranges.

Figure 5. (color online) Shower rates of the zenith angle distributions in saturated negative fields. The results in fair weather are plotted for comparison.
With respect to the average value measured in fair weather, the percent variation of the shower rate in saturated negative fields is shown in Fig. 6. The rate increases if the zenith angle is small, with a maximum amplitude of 6.5%. However, with the increase in the zenith angle, the increase becomes gradually smaller. It starts declining at a zenith angle larger than 33o, to the maximum change of approximately –10%.

Figure 6. (color online) Average variation of the zenith angle distribution in saturated negative fields.
-
The KM2A array uses trigger conditions based on the particles recorded by the ED array [44]. To understand the changes in shower rate in AEFs, detailed studies on the flux variations of ground-level secondary particles are necessary.
For each triggered event, the DAQ records the data from all EDs and MDs that have signals over the thresholds. The variations in the average number of particles per shower recorded by EDs (Ne) and the average number of muons per shower recorded by MDs (Nμ) are shown in Fig. 7. The variation in AEF is also shown in Fig. 7.

Figure 7. (color online) Variations in AEFs (a), Ne (b), and Nμ (c) per second during Thunderstorm 20210610.
From Fig. 7(b), we can observe a significant increase in the number of particles detected by the ED array in thunderstorm fields. As shown in Fig. 7(c), the MD array shows decreases in count rate. Owing to the acceleration of the secondary charged particles when they cross the layers of the AEF, the number of ground-level secondary particles with energy above the detector threshold will increase [17, 30]. At the same time, the mean energies of secondary positrons/electrons are much lower than that of muons [33]. Most muons detected by MDs have energies of approximately 1 GeV [43]. According to the Bethe’s theory, if the energy is greater than ~1.4 MeV, the drag force increases with the particle energy [53]. This means that the AEF has more effects on particles with smaller energies, i.e., on positrons and electrons, but has small effects on muons with larger energies [30]. As a result, a clear increase in particle count rate per shower is observed in the ED array. From Fig. 7(c), it can be observed that the muon rate per shower shows no increases, but rather decreases in the MD array. This is most likely due to the enhanced rate of shower events (with lower primary energy and fewer secondary muons) when there are strong fields (see Fig. 3). As a result, the average number of muons per shower shows a decrease.
During a thunderstorm, the noise trigger recorded by the detector will increase. To study the field effects on the flux variations of ground-level secondary particles detected by the ED, the noise during thunderstorm needs to be considered. For each shower event, the trigger time is set at 0, and the DAQ records all hits within 5000 ns before or after the trigger time [44]. According to the trigger logic, the data were divided into two parts. The hits (Noff) between –5000 and –500 ns are mostly noise, and the hits (Non) from –500 to 5000 ns are mostly signal. From Non and Noff, the secondary particles (Ns) from EAS can be calculated by the formula:
$ N_{s} = N_{\rm on}-1.22·N_{\rm off} , $

(1) where 1.22 = 5500/4500 is the ratio between the widths of time windows.
The distributions of AEFs, Non, Noff, and Ns per second in the ED array are shown in Fig. 8. With respect to the rate measured in fair weather, the calculated percent variations are also shown in Fig. 8. As can be observed, the particle numbers in both time windows are clearly increasing. From Fig. 8(c), it can be observed that the electronic noise increases and the increased number of Noff is less than 7. From Fig. 8(d), after removing the electronic noise, Ns still shows a significant increase in strong negative fields, with a maximum value up to 20%. In positive fields, the variation in Ns is not significant.

Figure 8. (color online) Variations in AEFs (a), Non (b),
Noff (c), and Ns (d) per second during Thunderstorm 20210610. From 820 to 2202 s (see Fig. 8), the ED count rate presents structural changes, and seven peaks appear at times of negative AEF. After reaching the maximum value, it drops abruptly (mostly within 4–12 s) and then starts to increase again. Why did the particle flux decrease rapidly? According to some previous observations [40, 41], lightning may terminate the flux increase. In Refs. [17, 30], the variation in cosmic ray fluxes is related to the intensity and thickness of the AEF during thunderstorms. Unfortunately, the Boltek EFM-100 was in a saturation state during the sharp drops; therefore, the data on AEF changes and lightning strikes were not recorded. This means it is impossible to analyze their effects on the particles directly in this study. It should be noted that another electric field mill with a wider dynamic range of ±1000 V/cm was installed at LHAASO on October 27, 2021. In future work, more thunderstorm events will be analyzed with detailed information on electric fields and lightning strikes.
-
To understand the data recorded by KM2A, the EAS development and detector response were simulated.
The CORSIKA code (version 7.7410) [54] was used to simulate air showers in the atmosphere. The Quark Gluon String model with JETs (QGSJET) and the Gamma Hadron Electron Interaction SHower code (GHEISHA) are programs developed to describe hadronic interactions. In this study, the selected hadronic interaction models were QGSJETII-04 in the high energy range (> 80 GeV) and GHEISHA in the low energy range (< 80 GeV). In view of the acceleration by the field, the energy threshold of the secondary particles (positrons, electrons, and photons) has been set to the lowest possible value, 50 keV. This means that secondary particles below this energy are discarded before they may be accelerated by the AEF to higher energies. As a result, the AEF effects may be underestimated. The horizontal and vertical strengths of the geomagnetic field components used in the simulations were BX = 34.8 μT and BZ = 36.2 μT, calculated by the IGRF model of the Earth's magnetic field [55]. We assume proton primaries with arrival direction evenly distributed in the sky, with a zenith angle less than 60°. According to the energy threshold of KM2A [43, 44], the simulated primary particles were selected as protons with energy ranging from 1 to 105 TeV following a power-law function with a spectral index of −2.7.
To simulate the KM2A detector response, a specific software, G4KM2A [56], was developed in the framework of the GEANT4 package [57]. In these simulations, at least 20 fired EDs within 400 ns were required for a shower trigger, as in the observations.
To study the AEF effects, a simple model was used, with a vertical and uniform AEF in a layer of atmosphere. Here, the presence of a negative AEF is assumed. Figure 9 shows the variations in triggered shower events measured by 3/4 KM2A array for different AEF intensities, with the layer thickness of 1000 m (extending from the detector altitude of 4410 m up to 5410 m). As can be observed, the flux of shower events triggered by KM2A increases with the AEF strength. In a field of -1200 V/cm, the rate of shower events is enhanced by up to 20%.
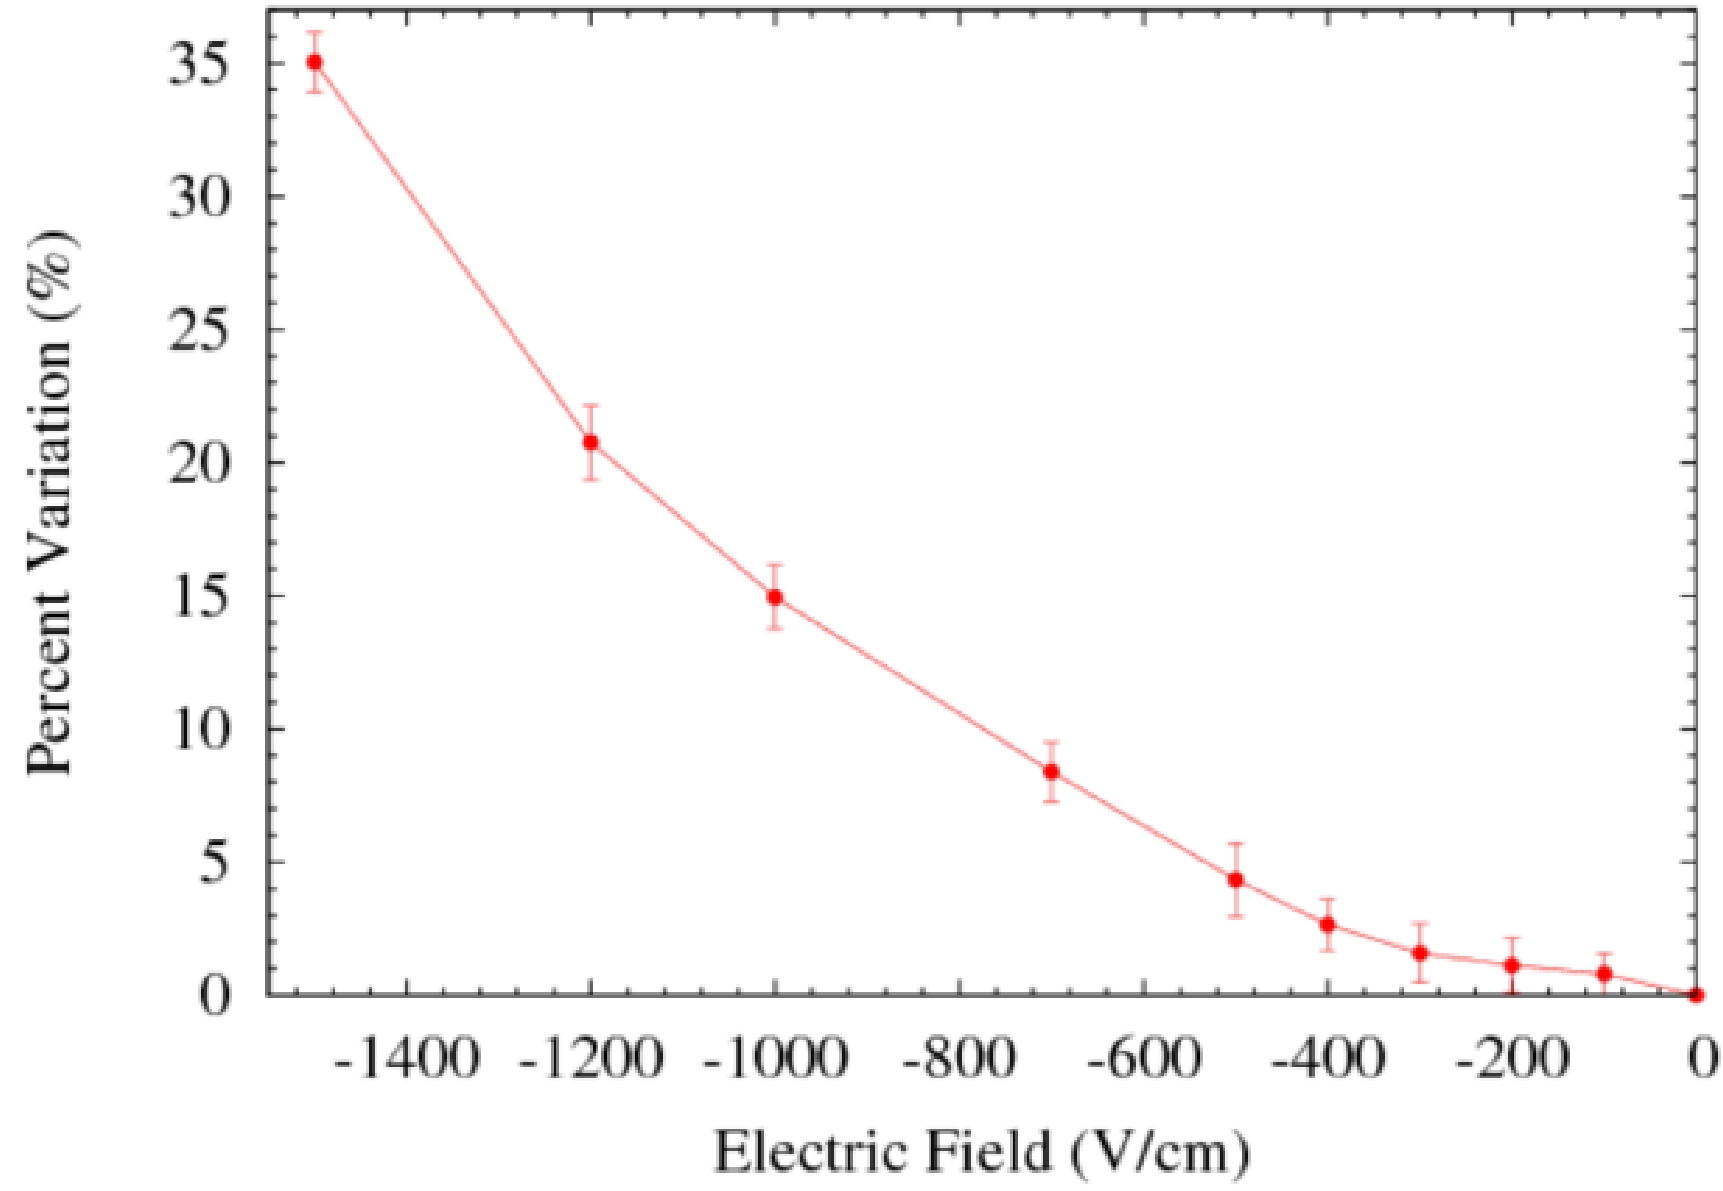
Figure 9. (color online) Simulations: Percent variations of the shower event rate as a function of the electric field intensity with AEF layer thickness of 1000 m.
Figure 10 shows the flux variations as a function of the thickness of the field in the atmosphere above the detector, assuming an AEF intensity of –1000 V/cm. The trigger event rate dramatically increases at a small thickness, and then, the curve flattens out when the thickness is higher than 1000 m. That means the AEF at higher altitudes has a small influence on the development of EAS.
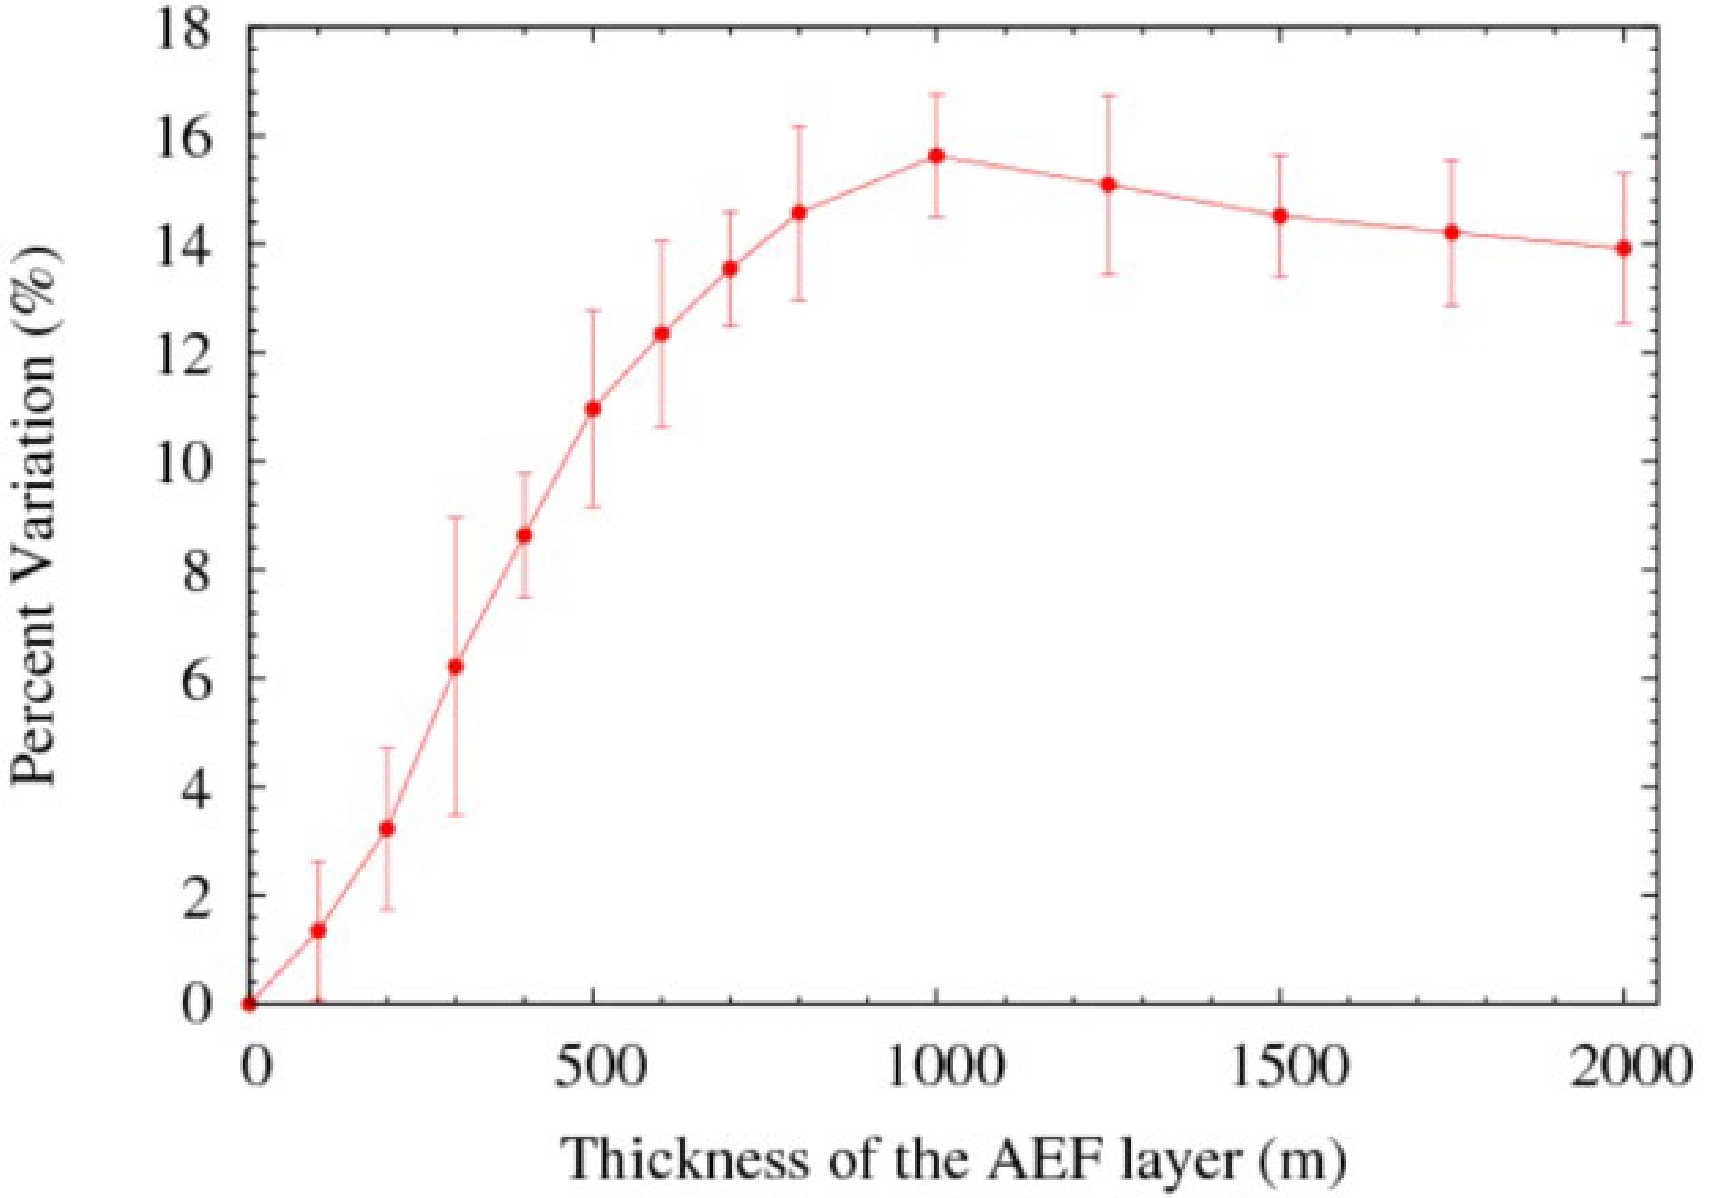
Figure 10. (color online) Simulations: Percent variations of the shower event rate as a function of the thickness of a –1000 V/cm AEF layer.
From Fig. 9 and Fig. 10, it can be observed that the variations in shower rate are related to the strength and thickness of the AEF layer. Compared with the KM2A data, the range of the saturated electric field is mostly from –1200 to –400 V/cm, and its spatial extent above the observation level is greater than 200 m.
To compare the average effects in saturated electric fields during Thunderstorm 20210610, we used several values of AEF strengths and thicknesses. The results showed that, in a field of –700 V/cm, with a layer thickness of 1500 m, the simulations agreed well with the data. The comparison of simulations with experimental data is shown in Fig. 11. The number of shower events increases for smaller zenith angles but decreases for higher zenith angles. We can see that the simulated trends are consistent with the observed data.

Figure 11. (color online) Shower event rate variations as a function of zenith angle in a field of –700 V/cm with a layer thickness of 1500 m, compared to experimental data.
-
In this study, the cosmic ray variations measured by KM2A during Thunderstorm 20210610 were investigated in detail. Significant changes in the shower events and ground-level secondary particles were found and explained.
During the thunderstorm, the shower rate detected by KM2A showed a clear increase, with percentage variation exceeding 20%. The variations in shower rate are related to the zenith angle. For smaller zenith angle ranges, the average shower rate increased by up to 6.5% in saturated negative fields. For larger zenith angles, the increase became gradually smaller. At a certain value of zenith angle, the shower rate began to decrease to approximately –10%.
Flux increases of ground-level secondary particles were observed during times of strong AEF, with maximum enhancements of 20% (after considering the effects of electronic noise). During the thunderstorm, the secondary particles increased with a special pattern, alternating between gradual increases and rapid drops.
The Monte Carlo simulations were performed using CORSIKA and G4KM2A. The flux of trigger events in the 3/4 KM2A array increased with the strength and thickness of AEFs. Assuming a uniform AEF of –700 V/cm with a thickness of 1500 m, our simulations are consistent with the experimental data in saturated negative fields.
Our data can be understood in terms of acceleration/deceleration effects of the AEF on charged particles in air showers. During a thunderstorm, the number of secondary particles hitting the detector changes, leading to a change in shower rate.
Flux variations of cosmic ray air showers detected by LHAASO-KM2A during a thunderstorm on June 10, 2021
- Received Date: 2022-07-11
- Available Online: 2023-01-15
Abstract: The Large High Altitude Air Shower Observatory (LHAASO) has three sub-arrays, KM2A, WCDA, and WFCTA. The flux variations of cosmic ray air showers were studied by analyzing the KM2A data during a thunderstorm on June 10, 2021. The number of shower events that meet the trigger conditions increases significantly in atmospheric electric fields, with a maximum fractional increase of 20%. The variations in trigger rates (increases or decreases) were found to be strongly dependent on the primary zenith angle. The flux of secondary particles increased significantly, following a trend similar to that of shower events. To better understand the observed behavior, Monte Carlo simulations were performed with CORSIKA and G4KM2A (a code based on GEANT4). We found that the experimental data (in saturated negative fields) were in good agreement with the simulations, assuming the presence of a uniform electric field of -700 V/cm with a thickness of 1500 m in the atmosphere above the observation level. Due to the acceleration/deceleration by the atmospheric electric field, the number of secondary particles with energy above the detector threshold was modified, resulting in the changes in shower detection rate.


 DownLoad: