


 Abstract
 HTML
HTML Reference
 Related
 PDF
PDF


-
The 12C+12C fusion reaction plays an important role in stellar evolution, explosion, and associated nucleosynthesis in the Universe [1, 2]. It governs carbon burning of massive stars, carbon deflagration in Type Ia supernovae (SNe Ia; [3, 4]), and the carbon flash condition of superbursts [5, 6]. The energy region of astrophysical interest extends from a few tens of keV to 3 MeV. All direct measurements are limited to energies above the center-of-mass energy
$ E_{\rm c.m.}= $ 2.1 MeV. Thus, extrapolation is inevitable to obtain the nuclear reaction rate at astrophysically relevant energies. However, owing to the strong narrow resonance structure in the 12C+12C reaction, theoretical predictions are difficult and not consistent with each other [7].In the past decades, many experiments and theoretical models have been developed to reduce the uncertainties introduced by extrapolation [8–12].
The so-called standard rate of the 12C+12C reaction was established by Caughlan and Fowler [13] (CF88) with experimental data of
$ E_{\rm c.m.}= $ 2.5 – 6.5 MeV and extrapolated using constant$ S^* $ based on the square well penetration factor [14]. They predicted a slowly rising trend of$ S^* $ (E) toward lower energies, which agrees well with various phenomenological and microscopic models [8, 11, 12, 15, 16] subsequently proposed. However, these reaction models are based on the average of the upper limits of cross section data taken at energies far higher than the energy region of astrophysical interest. Their extrapolations are far higher than the astrophysical energy region of interest and ignore the effects of possible low-lying resonances.Contrary to the rising trend of CF88, a significant suppression at lower energies owing to the hindrance effect was suggested by Gasques et al. [11]. Jiang et al. [7] predicted that the hindrance effect leads to a maximum of the modified S-factors (
$ S^* $ (E)$ =S $ (E)exp(0.46E)) of the 12C+12C reaction, which appears around$ E_{\rm c.m.}= $ 3.68 MeV. After the maximum, the$ S^* $ factors decrease rapidly at lower energies. However, the existence of such a maximum of the$S^* $ factors is clearly ruled out by the more precise measurement of the 12C+13C reaction at the deep sub-barrier owing to the strong correlation of$ S^* $ factors between the 12C+12C and 12C+13C fusion reactions [17].In contrast, a dramatic increase in
$ S^* $ factors in the 12C+12C reaction was predicted by Tumino et al. [18], for which an indirect measurement technique known as the Trojan Horse Method (THM) was applied. They obtained$ S^* $ factors from 2.8 to 0.7 MeV, overlapping the entire region of astrophysically relevant energies. This indirect measurement successfully overcomes the experimental limits of direct measurements and avoids the uncertainties introduced by extrapolation. However, it also leads to more complex results. The reaction rates of 12C+12C obtained by different studies exhibit trends in different directions and deviate from each other by 1 – 7 orders of magnitude below 3 MeV.Recently, several new measurements [19–22] and theoretical models [23, 24, 25] were reported. An overall comparison of these measurements has been summarized by Aliotta et al. [26]. They indicated that these measurements generally agree down to 2 MeV within experimental errors. A clear discrepancy exists between the
$ S^* $ factor from Tan et al. [19] and those from Fruet et al. [20] and Spillane et al. [9] in the region$ E_{\rm c.m.}= $ 2.7 – 3.0 MeV. The 12C+12C reaction rate was reported by Adsley et al. [21] by considering the potential resonance contribution, which is$ \sim $ 10 times larger than that of CF88 around$ E_{\rm c.m.}= $ 1.5 MeV. For theoretical models, Mukhamedzha-nov et al. [23] (Muk19) re-evaluated the$ S^* $ factors from the THM and predicted a decreasing trend at lower energies. Based on their own independent theoretical approach, Bonasera and Natowitz [24] also evaluated the$ S^* $ factors at lower energies and showed an agreement with the trend predicted by THM measurements. The full microscopic calculation of Taniguchi and Kimura [25] presented a moderate trend.Owing to the lingering controversy among the reaction rates available in literature, devoted sensitivity studies could be performed by taking advantage of these available reaction rates. To evaluate the impact of the 12C+12C reaction rate on astrophysical models, we choose the THM and Muk19 because these two rates currently present the upper and lower limit of 12C+12C reaction rates.
This paper is organized as follows: In Section II, we compare the reaction rates of 12C+12C used in this study. Section III describes the code and input parameters. We compare the chemical evolution from C burning for two rates in Section IV and their yields for all the isotopes used in this study in Section V. In Section VI, the theoretical abundance is compared with the observed abundance. In Section VII, we summarize our results and present the main conclusions.
-
There are three main channels for the 12C+12C reaction in C burning:
$ \begin{array}{*{20}{l}} ^{12}{\rm C}+^{12}{\rm C}\, \rightarrow \, ^{20}{\rm Ne}+\alpha \, (Q=+4.616\; {\rm MeV}), \\ ^{12}{\rm C}+^{12}{\rm C}\, \rightarrow \, ^{23}{\rm Na}+{p} \, (Q=+2.238\; {\rm MeV}), \\ ^{12}{\rm C}+^{12}{\rm C}\, \rightarrow \, ^{23}{\rm Mg}+{n} \, (Q=-2.605\; {\rm MeV}). \end{array} $

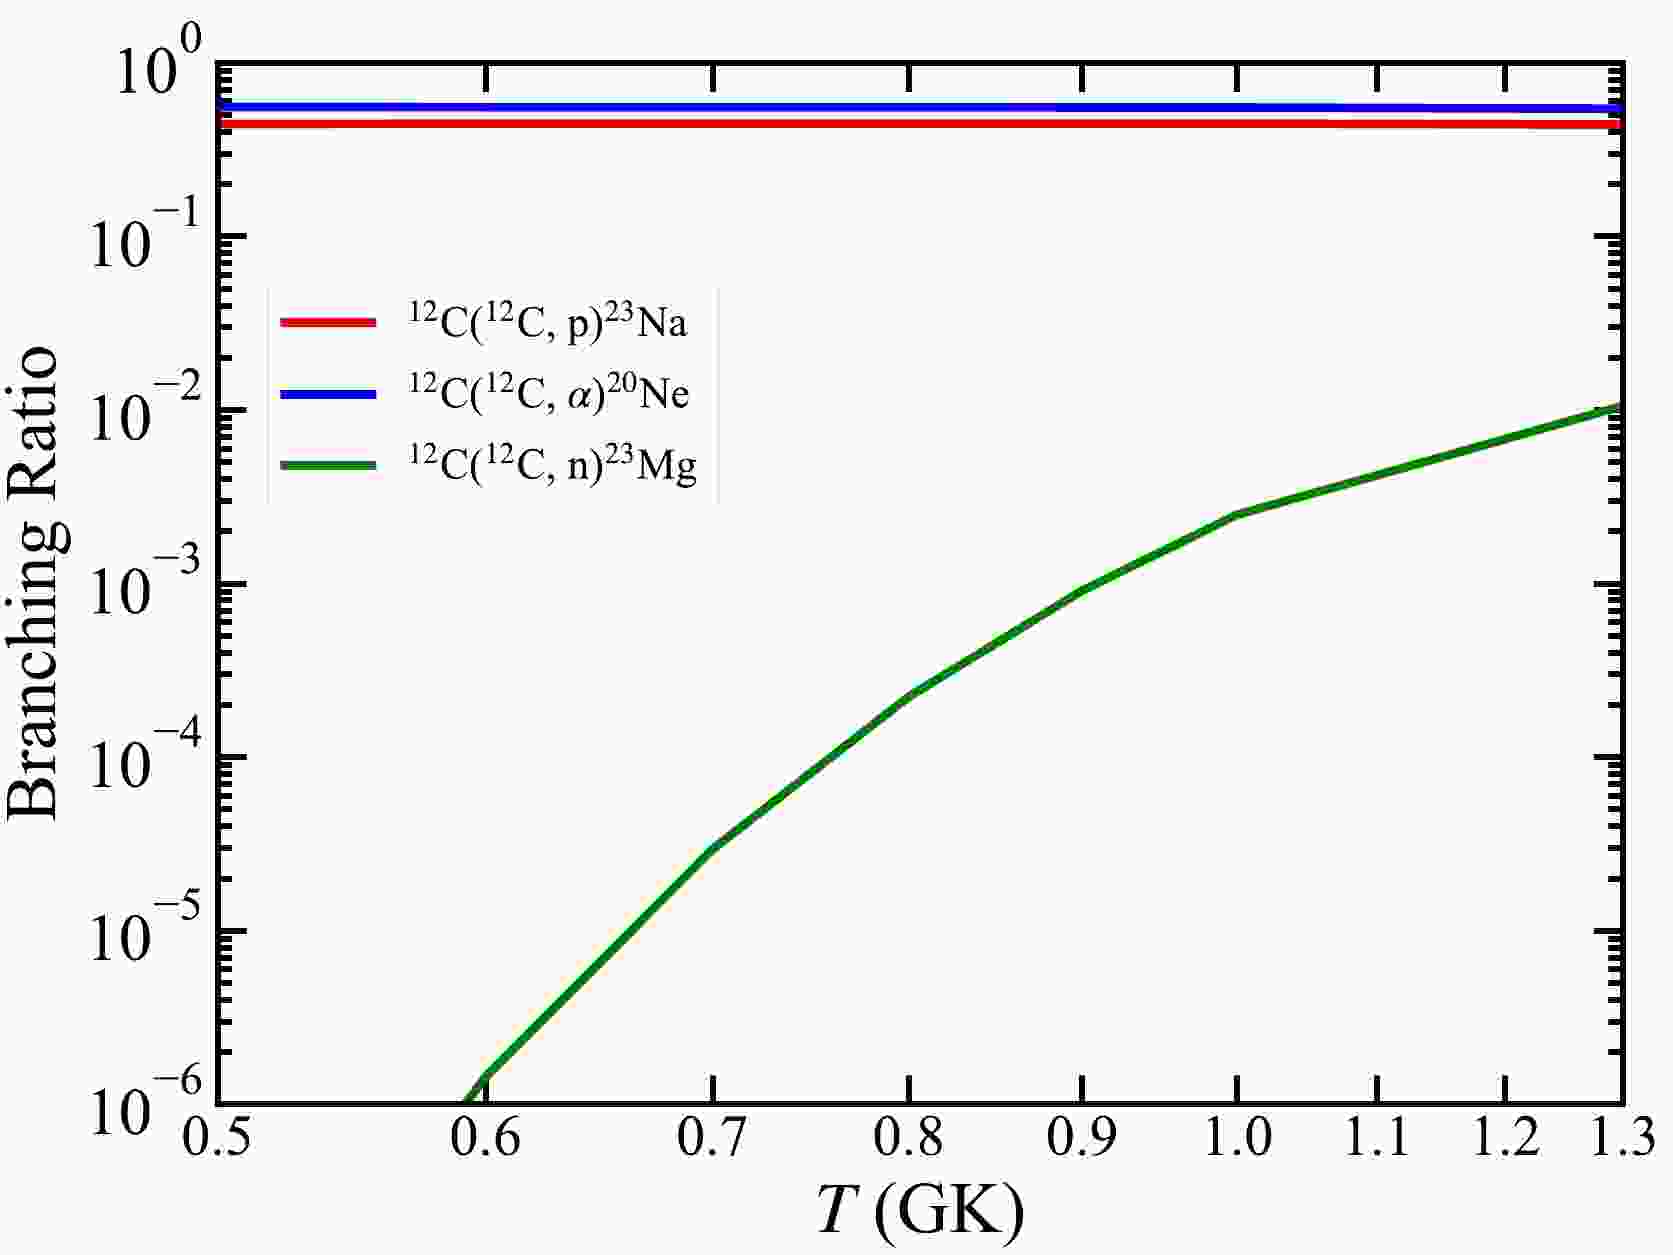
As shown in Fig. 1, in the temperature range of hydrostatic C burning, the branching ratios of 12C(12C, α)20Ne and 12C(12C, p)23Na are 55.4% (blue) and 44.6% (red), respectively, whereas the probability of 12C(12C, n)23Mg is two orders of magnitude lower owing to the negative Q value. With such a low branching ratio, 12C(12C, n)23Mg contributes little to the energy generation rate of the 12C+12C reaction; however, it is important for the production of 23Na, as discussed in Section IV.
Figure 1. (color online) Branching ratios of three main channels for the 12C+12C reaction as a function of temperature. The branching ratios of 12C(12C, α)20Ne and 12C(12C, p)23Na are 55.4% (blue) and 44.6% (red), respectively, whereas that of 12C(12C, n)23Mg ranges from
$ \sim 10 $ $ ^{-6} $ to$ \sim 10 $ $ ^{-2} $ (green) in the temperature region of hydrostatic C burning. These branching ratios are from$\mathrm{ReaclibV2.2}$ [27].At
$ T= $ 0.7 GK, for example, the THM reaction rate of Tumino et al. [18] is$ \sim 10$ times higher than that of CF88, whereas the rate derived by considering the factor proposed by Mukhamedzhanov et al. [23] is$ \sim 3$ times lower than that of CF88, as shown in Fig. 2.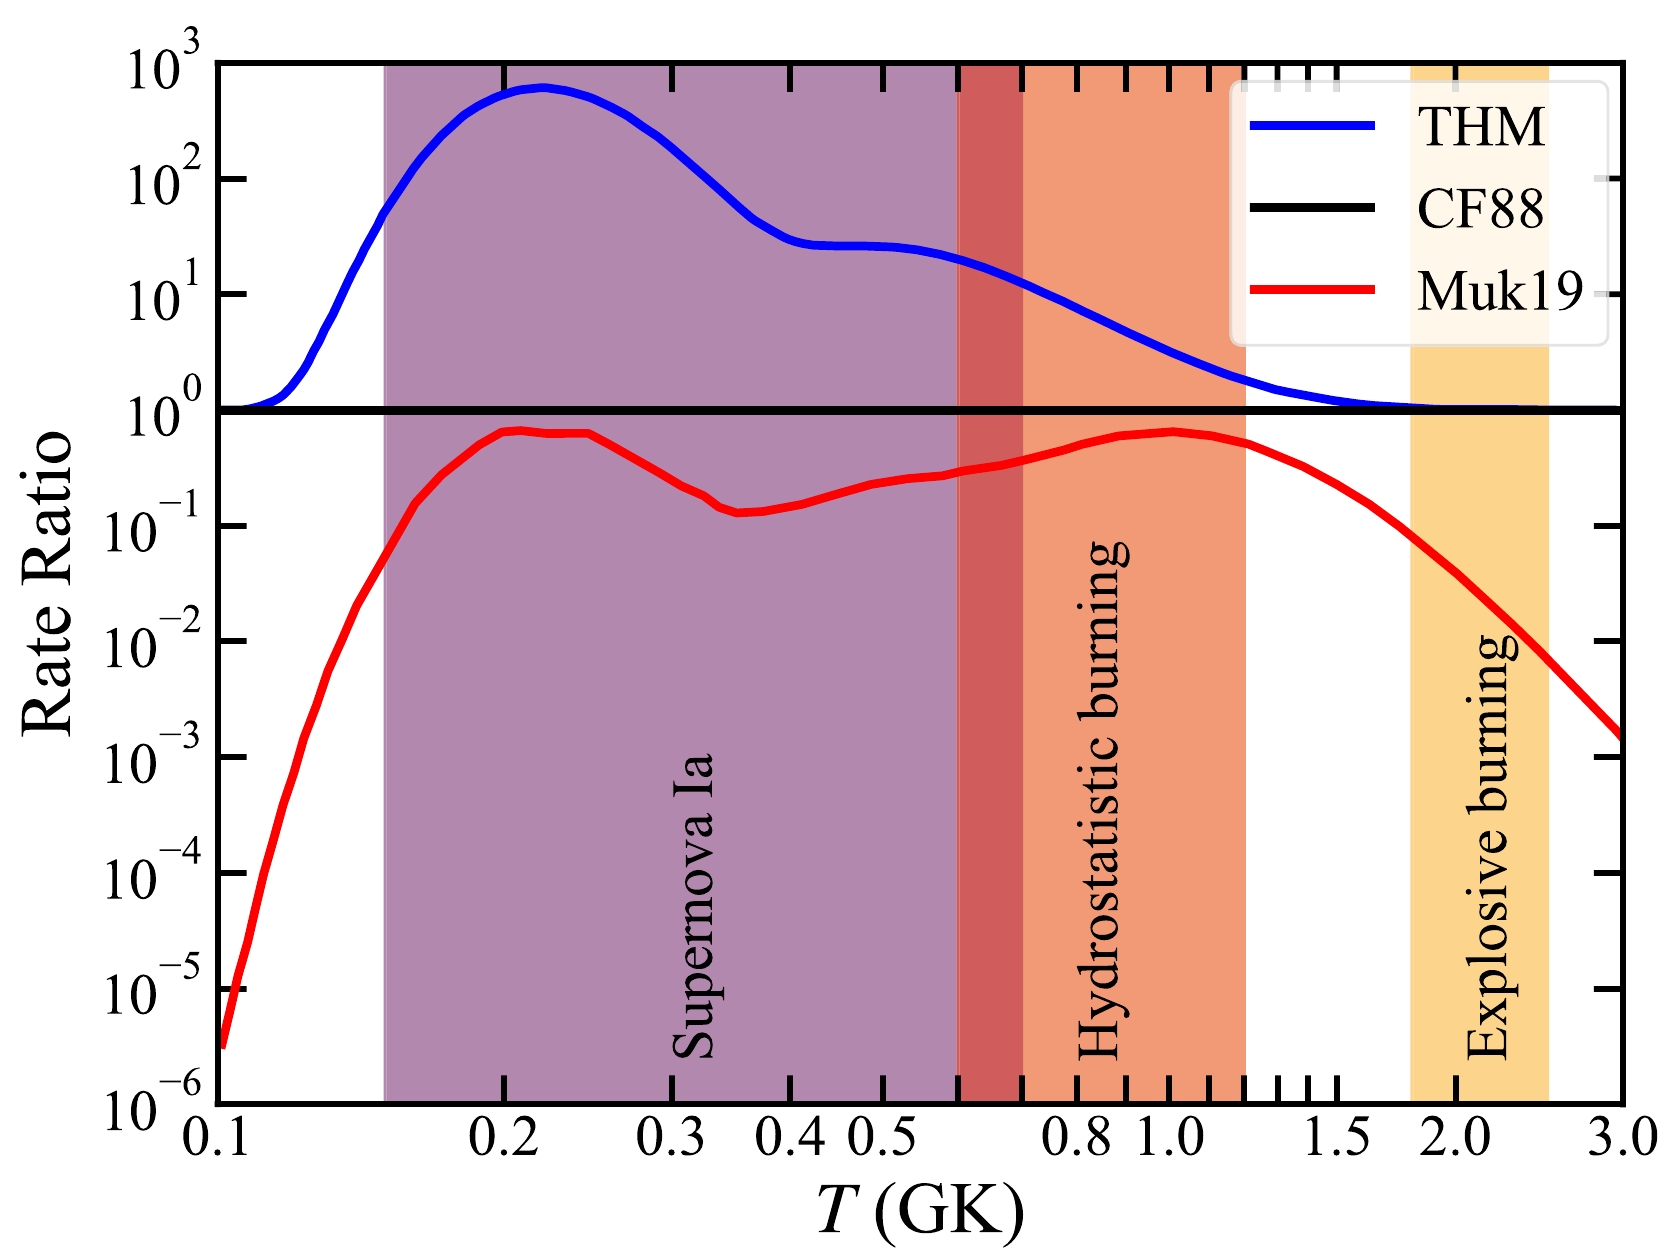
Figure 2. (color online) 12C+12C reaction rates as a function of temperature. The THM rate (blue) is from Tumino et al. [18]. The Muk19 rate (red) is obtained from the
$ S^* $ factors reported by Mukhamedzhanov et al. [23]. Both of these reaction rates are normalized by the CF88 rate (black) from Caughlan and Fowler [13]. The temperatures for C ignition in Type Ia supernovae ($ T = $ 0.15 – 0.7 GK), hydrostatic C burning ($ T= $ 0.6 – 1.2 GK), and explosive C burning ($ T = $ 1.8 – 2.5 GK) are marked by colored bands.Therefore, besides the more precise direct measurements of nuclear physics, studies on the effect of the 12C+12C reaction rate on stellar evolution are important. Furthermore, it is also necessary to make comparisons between stellar models with different 12C+12C reaction rates and astronomical observations. Gasques et al. [11] first discussed the differences in stellar C burning and nucleosynthesis between the 12C+12C reaction rates obtained from the hindrance effect and CF88. They concluded that the hindrance rate changes the abundances of many isotopes, especially enhancing the abundances of long-lived radioactive isotopes such as 26Al and 60Fe. Bennett et al. [28] and Pignatari et al. [29] discussed the effect of increasing and decreasing CF88 on the evolution of massive stars and the nucleosynthesis of s-process isotopes. Recently, two studies explored the effect of the THM rate, compared with the CF88 rate, on the ignition of Type Ia supernovae [30] and compactness and presupernova evolution [31].
Motivated by the above studies, it is necessary to compare the THM and Muk19 rates and discover how large differences in nucleosynthesis are introduced by these two rates. Then, a comparison between our theoretical presupernova yields and observational data of stellar abundances is conducted.
-
We employ the Modules for Experiments in Stellar Astrophysics (MESA, version 12778; Paxton et al. [32–36]) to follow various nuclear burnings and structure evolutions in stars from Zero-Age Main-Sequence (ZAMS) until an Fe core is formed. Three groups of models with the 12C+12C reaction rates from the THM, CF88, and Muk19 are calculated. The mass grids of the models are
$ M{\rm (ZAMS)}= $ 20, 23, 25, 28, 30, 32, 35, 38, and 40 M$ _\odot $ .In the convection zone, we use mixing-length theory with the ratio between the mixing-length and a pressure scale height of
$ \alpha_{\rm mlt}= $ 3.0 when the mass fraction of H exceeds 0.5 and$ \alpha_{\rm mlt}= $ 1.5 for other stages. We adopt the exponential scheme with$ f_{0}= $ 0.004 and$ f= $ 0.01 for the overshooting. The Dutch scheme factor$\mathrm{Dutch_scaling_factor = 0.5}$ is adopted in this study. The "Dutch" scheme in MESA is a combination of three main mass loss prescriptions from de Jager et al. [37] for cool stars, Vink et al. [38] for hot H-rich stars, and Nugis et al. [39] for Wolf-Rayet stars.For the initial elemental abundances, we assume a He mass fraction of
$ Y=2Z+0.24 $ and a H mass fraction of$ X=1-Y-Z $ . Here,$ Z= $ 0.02 denotes the sum of the initial mass fractions of heavy elements, that is, C and heavier elements. For isotopic abundance ratios among heavy elements, we assume the solar abundance ratios from Anders and Grevesse [40]. -
To ensure the convergence of the various quantities of the stellar models at the
$ \sim $ 10% level [41], we adopt a large nuclear reaction network consisting of 128 isotopes (mesa_128.net, Paxton et al. [32] and Timmes et al. [42, 43]). The isotopes included in this network are listed in Table 1. The reaction-chain 14N($ \alpha,\gamma $ )18O($ \alpha,\gamma $ )22Ne($ \alpha,\gamma $ )26Mg is also included. For the weak interaction, the tabulations of Langanke et al. [44, 45] and Fuller et al. [46] are adopted. Because only the total reaction rates of 12C+12C from the THM, CF88, and Muk19 are provided in our models, the branching ratios of each channel comply with the default of$\mathrm{MESA}$ from$\mathrm{ReaclibV2.2}$ [27]. Other reaction rates are taken from$\mathrm{ReaclibV2.2}$ .Element $ A_{\rm min} $ 

$ A_{\rm max} $ 

Element $ A_{\rm min} $ 

$ A_{\rm max} $ 

n 1 1 S 31 34 H 1 2 Cl 35 37 He 3 4 Ar 35 38 Li 7 7 K 39 43 Be 7 10 Ca 39 44 B 8 8 Sc 43 46 C 12 13 Ti 44 48 N 13 15 V 47 51 O 14 18 Cr 48 57 F 17 19 Mn 51 56 Ne 18 22 Fe 52 58 Na 21 24 Co 55 60 Mg 23 26 Ni 55 61 Al 25 28 Cu 59 62 Si 27 30 Zn 60 64 P 30 32 8Be is not included. Table 1. Nuclides included in the nuclear reaction network of mesa_128.net.
-
After He burning, stars evolve through gravitational contraction and nuclear burning until the formation of the Fe core. The default reaction rate in MESA is limited up to
$ T= $ 1010 K. Thus, the final stage of the calculation (formation of the Fe core) is defined at temperatures up to 1010 K at the center, and the time to the final stage as log$ \tau= $ log ($ t_{\rm final}-t $ ).We show the mass fraction of 12C, X(12C) as a function of M(ZAMS) after core He burning in Fig. 3. There is no difference in X(12C) between the THM and Muk19 models for M(ZAMS) considered in our study.
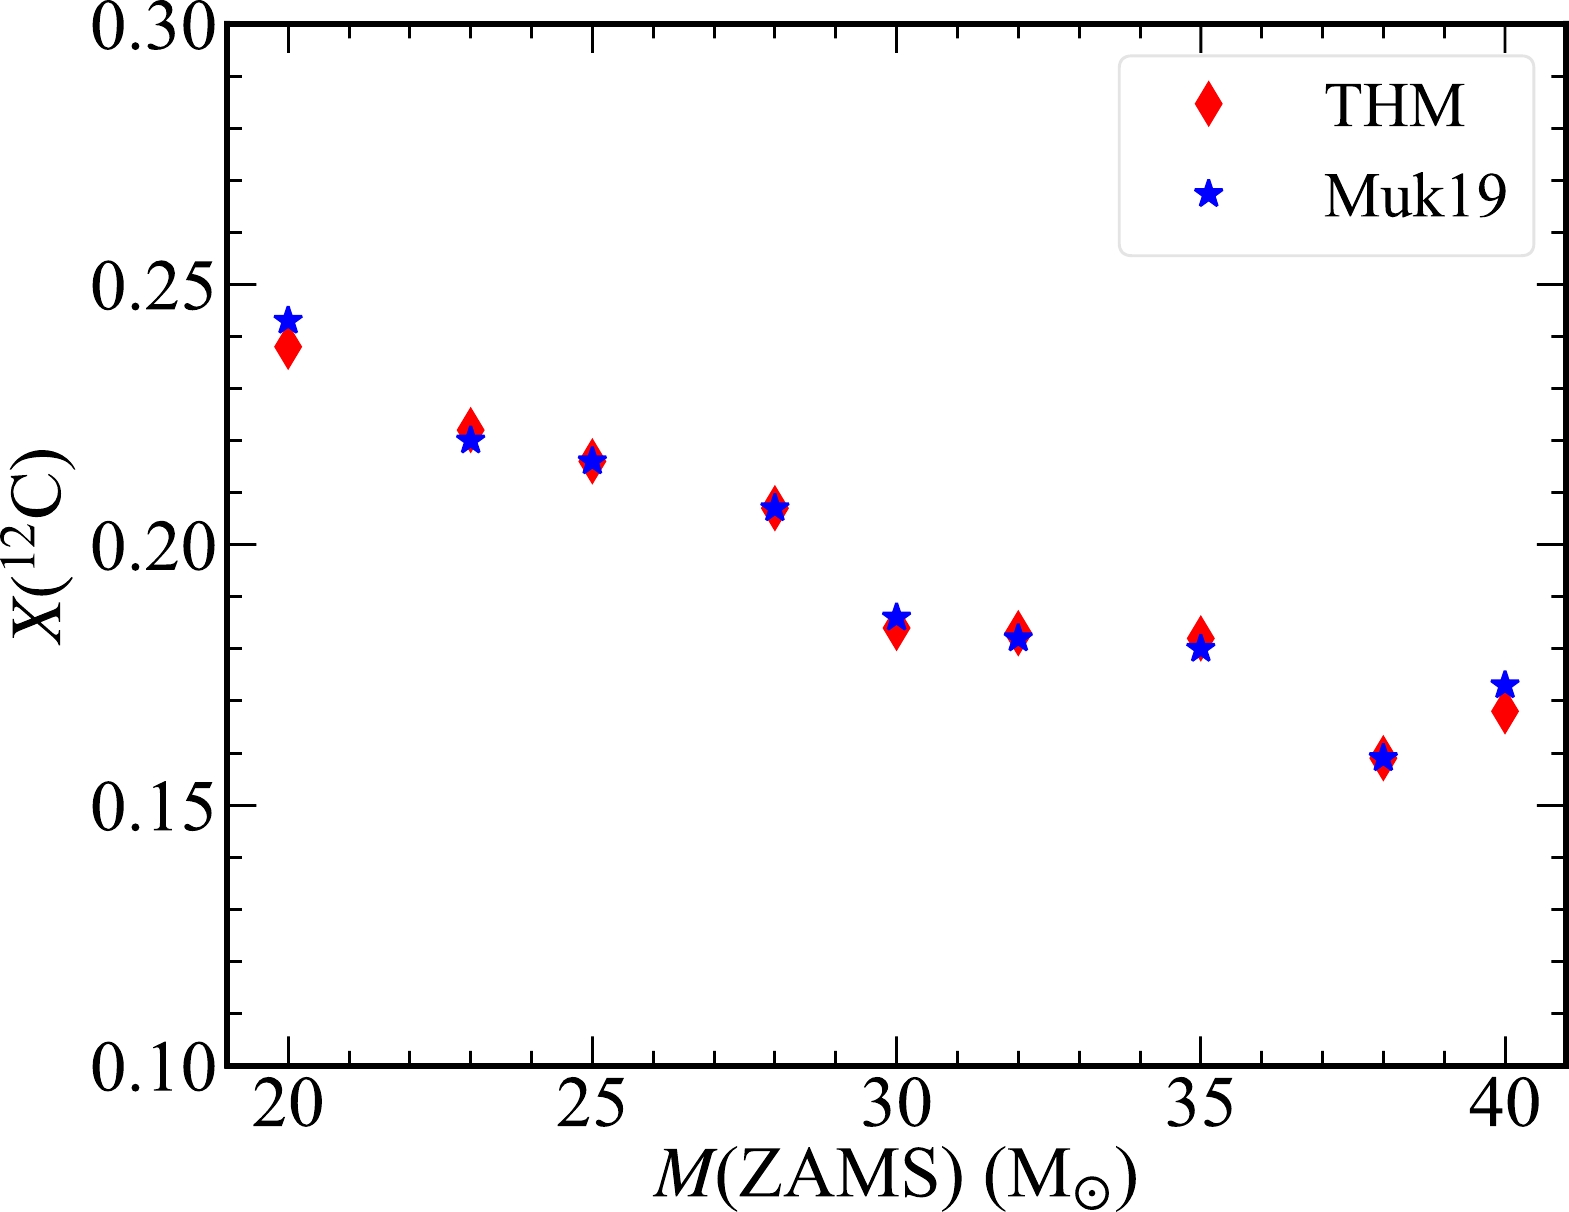
Figure 3. (color online) Mass fraction of 12C as a function of M(ZAMS) after core He burning. The models with the THM and Muk19 rates are marked by red diamonds and blue stars, respectively.
Less massive stars explode more frequently but eject less material into the interstellar medium. Conversely, more massive stars eject more material but explode less frequently [47]. Given the combined effects of ejected masses and the frequency of events, Weaver et al. [48] and Woosley et al. [49, 50] suggested that the ejecta of the explosion of the M(ZAMS) = 25 M
$ _\odot $ star makes the largest contribution to chemical enrichment of the galaxy.Therefore, we use the models of the M(ZAMS) = 25 M
$ _\odot $ star as a typical example to discuss the stellar evolution.The evolution of the central temperature and density (Fig. 4) and chemical elements (Fig. 5) from the end of He burning to the formation of the Fe core is compared between the THM and Muk19 models.
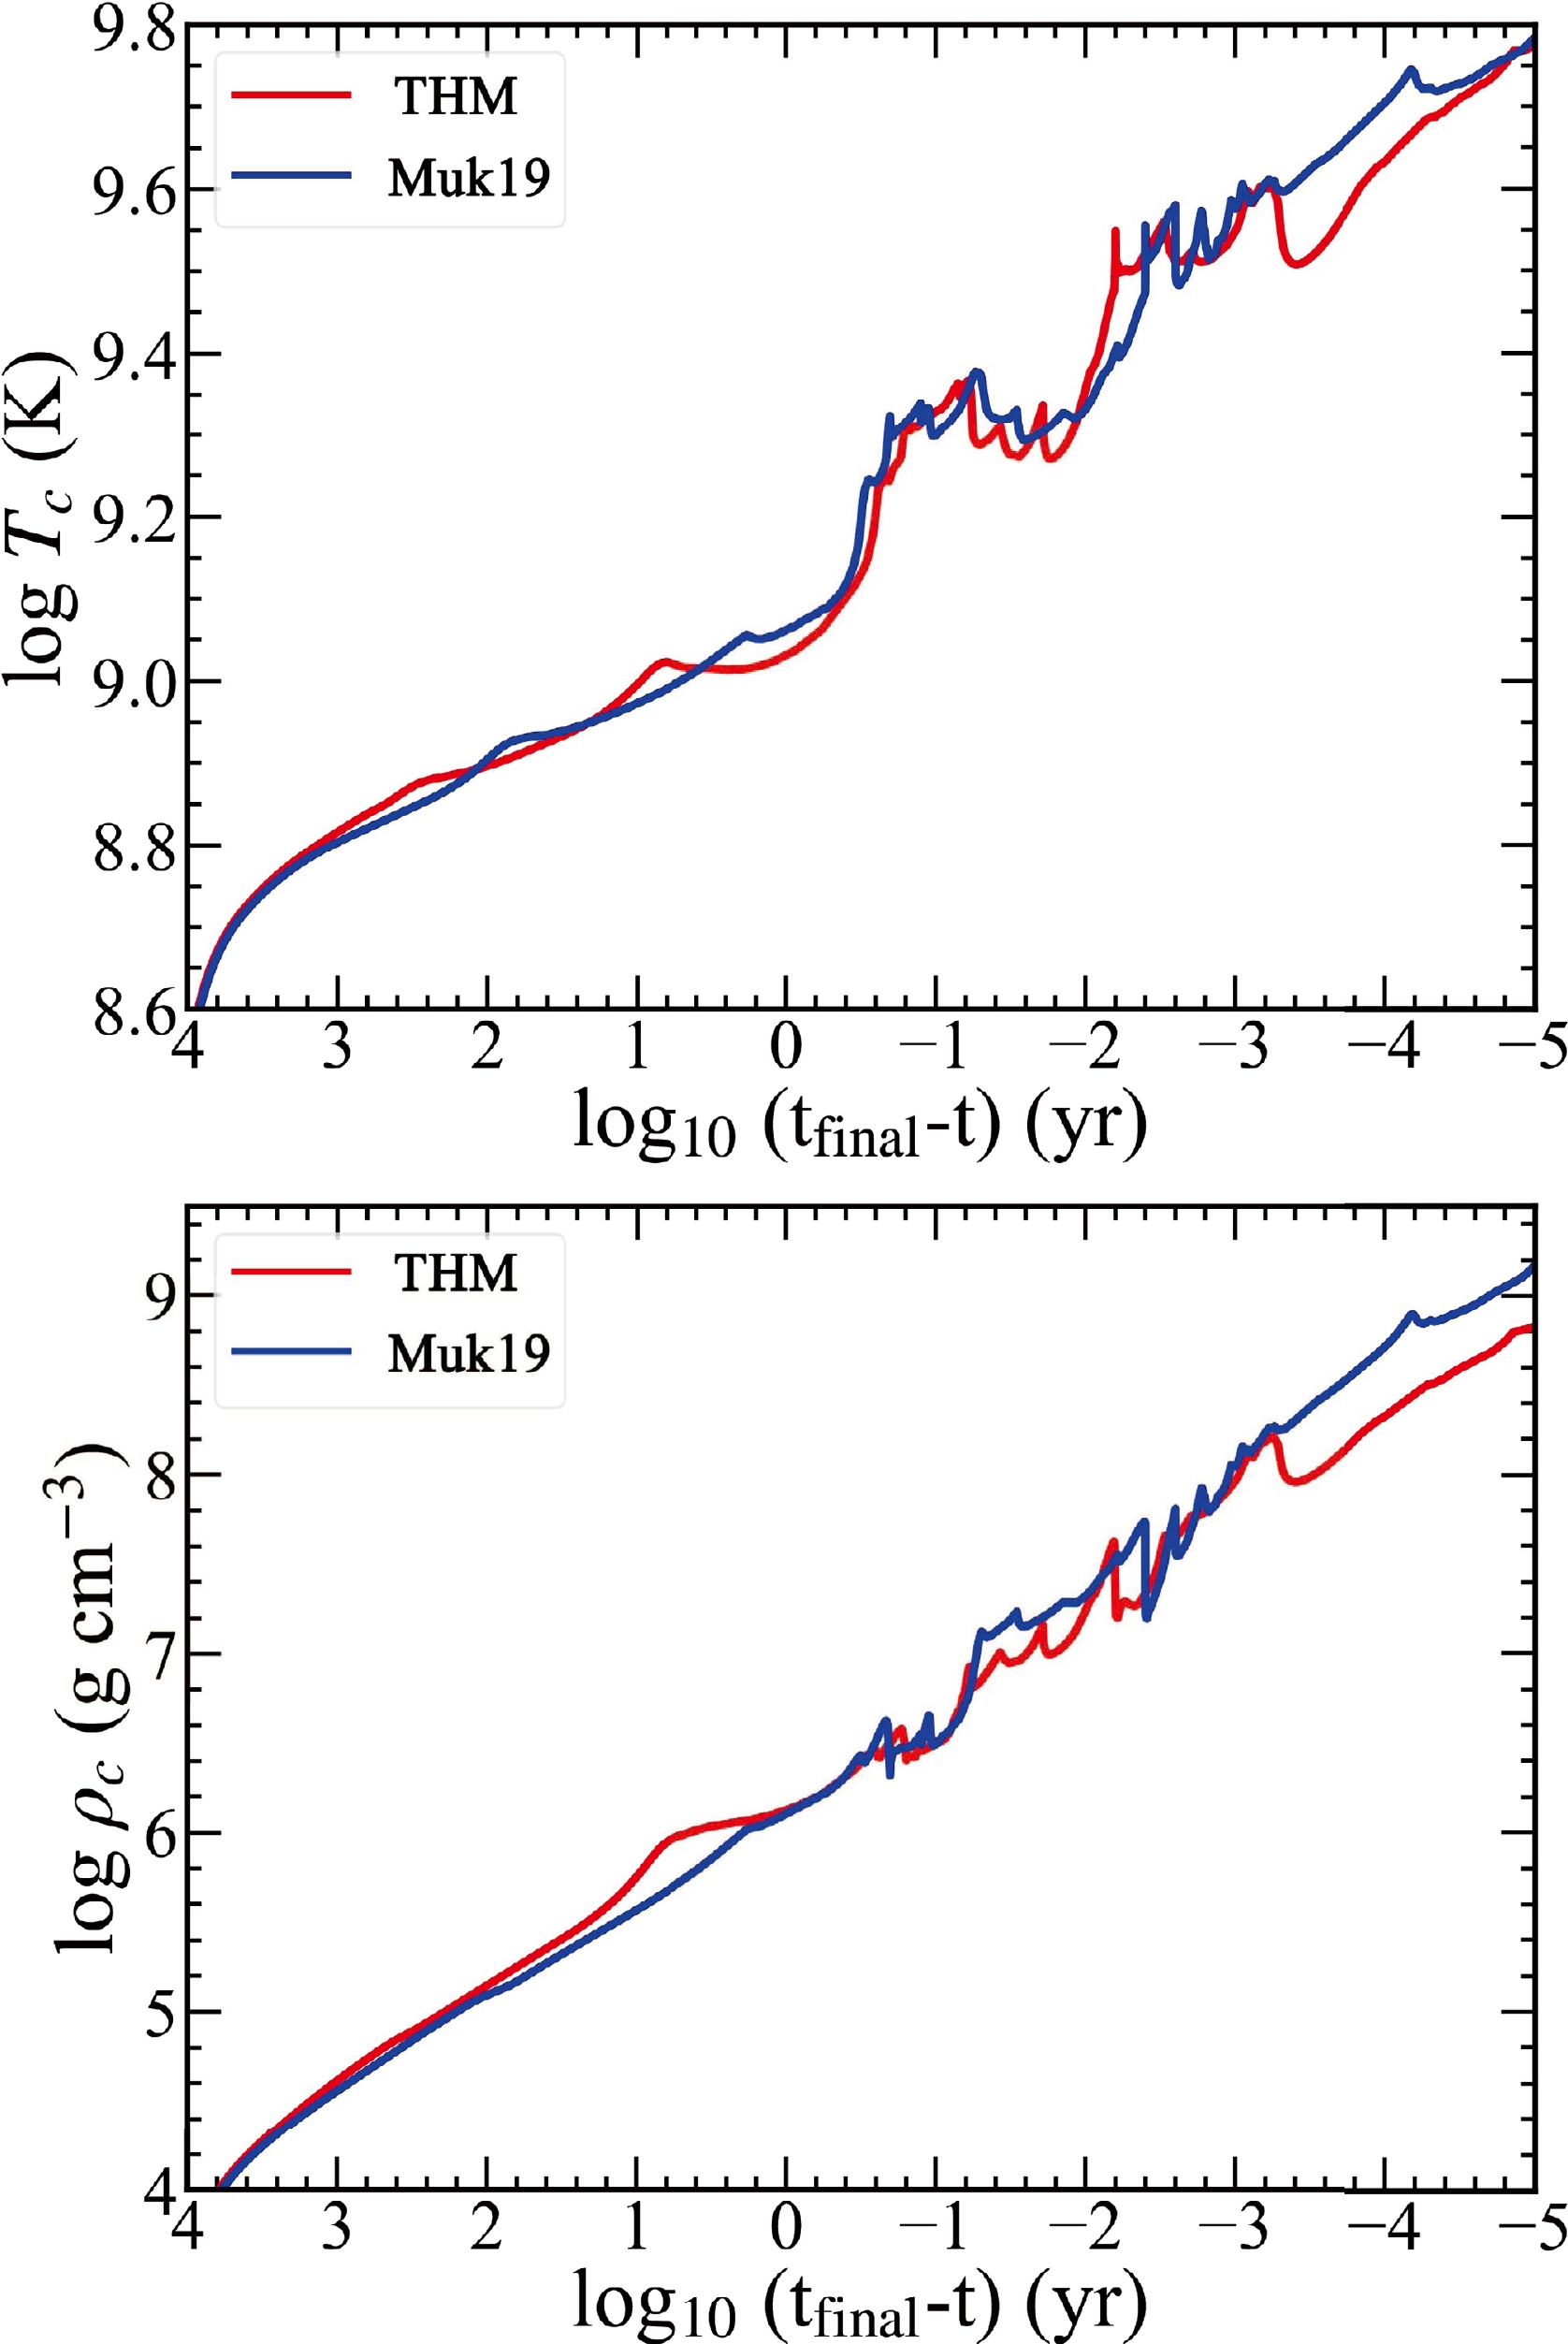
Figure 4. (color online) Time evolution of temperature (
$ T_c $ ) and density ($ \rho_c $ ) at the center of stars with M(ZAMS) = 25 M$ _{\odot} $ for the THM and Muk19 models.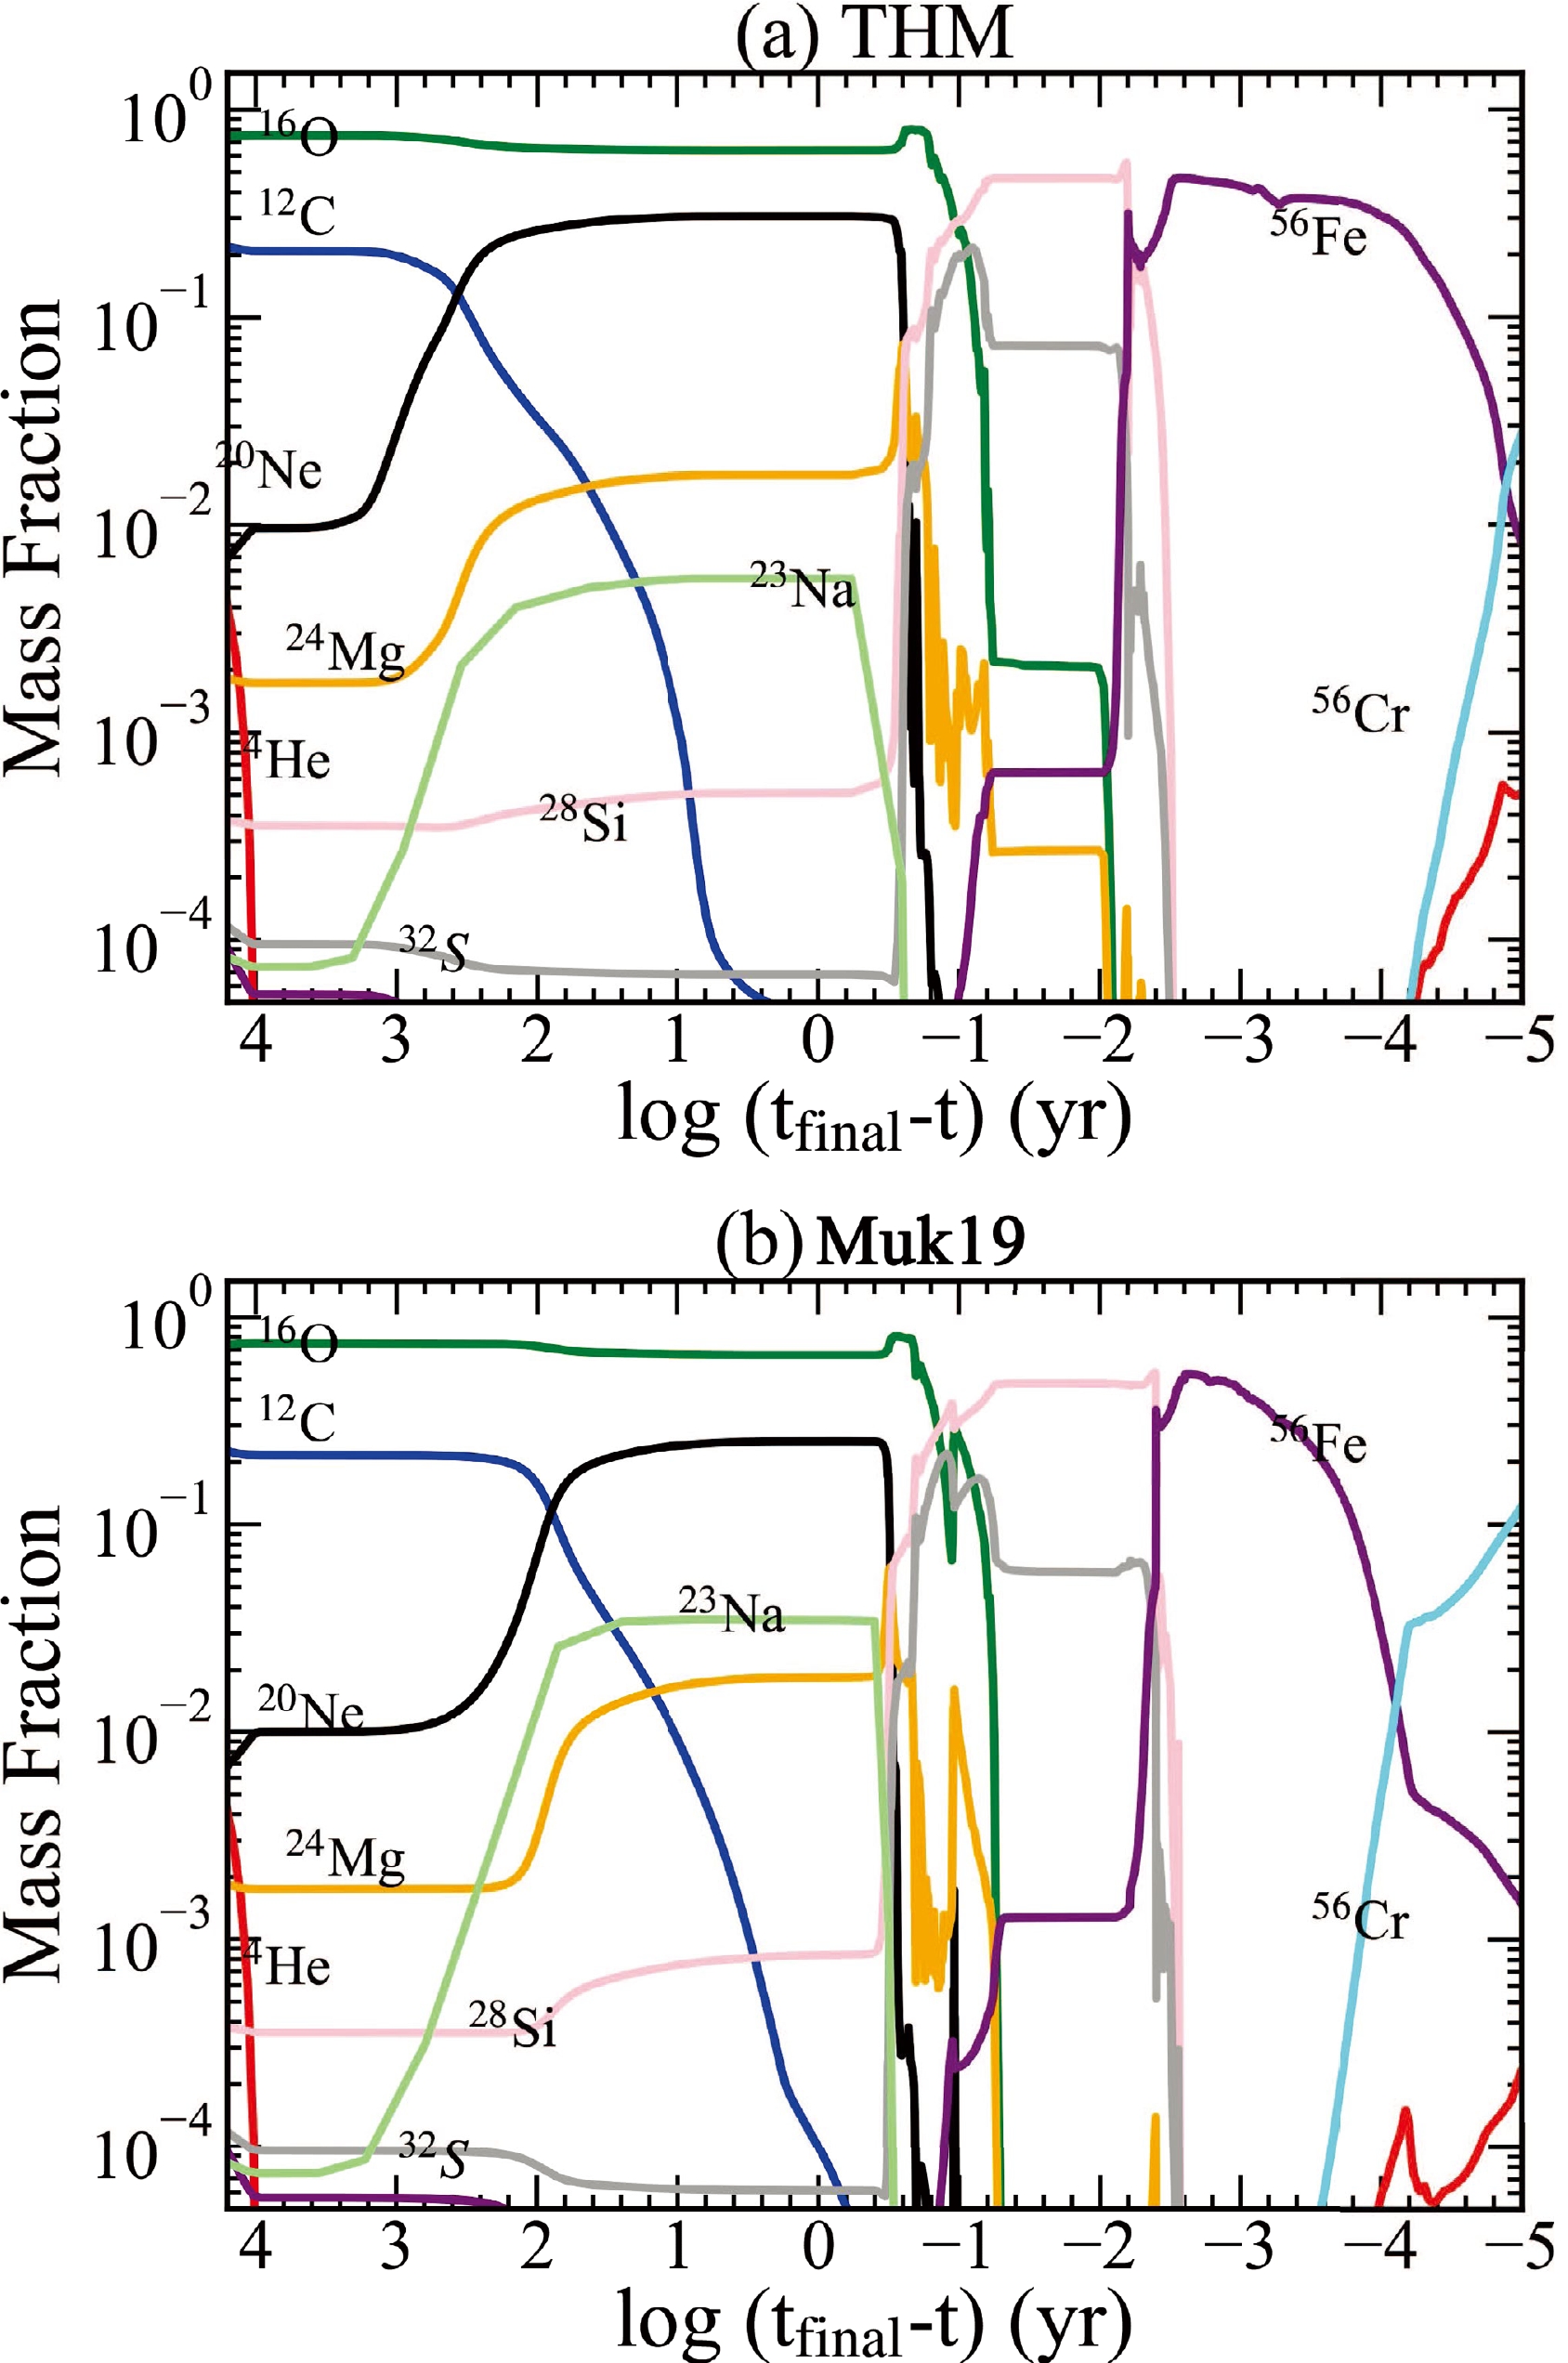
Figure 5. (color online) Time evolution of the mass fractions of several isotopes at the center of stars with M (ZAMS) = 25 M
$ _{\odot} $ for the THM (top) and Muk19 (bottom) models.The adoption of a higher rate makes C ignite earlier and burn at lower temperatures. With the Muk19 rate, stars ignite C burning at log
$ \tau \sim $ 2, where the temperature ($ T_9 \equiv T/10^9 $ K) and density are$ T_9 \sim $ 0.8 and$ \rho \sim $ 1.26$ \times $ 10$ ^5 $ g cm$ ^{-3} $ , respectively, whereas with the THM rate, C is ignited hundreds of years earlier with a lower temperature ($ T_9 \sim $ 0.63) and density ($ \rho \sim $ 5.01$ \times $ 10$ ^4 $ g cm$ ^{-3} $ ) in the core. Of course, with a higher rate (THM), C is also exhausted more rapidly. The time for C exhaustion in the core is log$ \tau \sim $ 1 and 0 for the THM and Muk19 rates, respectively. The evolution of the mass fractions of 12C, 20Ne, 23Na, and 24Mg with the temperature at the center is shown in Fig. 6.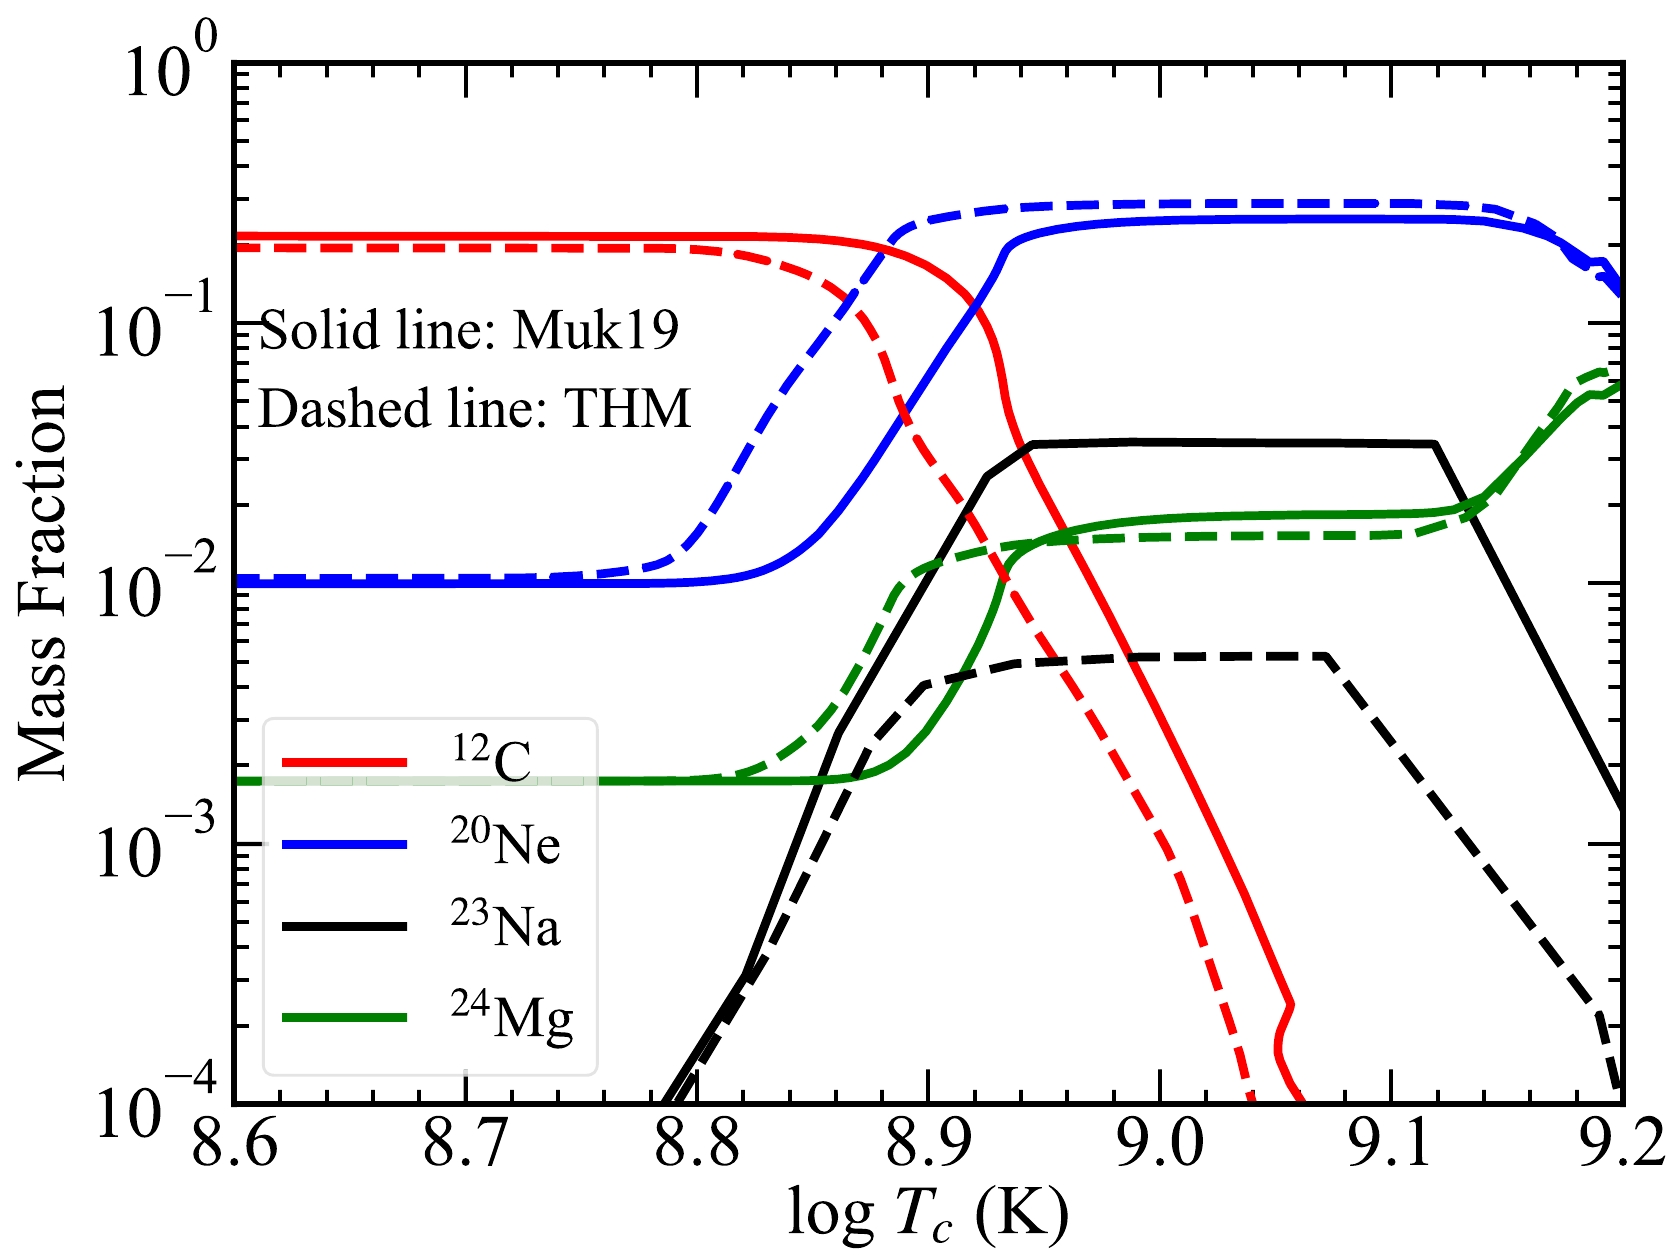
Figure 6. (color online) Mass fraction of 12C, 20Ne, 23Na, and 24Mg as a function of temperature at the center. The models with the THM and Muk19 rates are marked by dashed and solid lines, respectively.
Figure 7 (a) and (b) compare the distributions of several isotopes against
$ M_r $ for the THM and Muk19 models when C is exhausted. We define the end of C burning as when X(C)$ < $ 10$ ^{-4} $ at the center. In addition to 16O remaining after He burning, the abundant product is 20Ne, followed by 23Na and$ ^{24,\, 25} $ Mg in the ONe core. As mentioned in Fig. 1, the α and p channels have the equivalent branching ratio (55.4% for the α channel and 44.6% for the p channel) at the temperature of C burning. Because$ \sim $ 99% of 23Na produced through the p channel are destructed by the efficient 23Na(p, α)20Ne reaction during core C burning [28, 51], the production of 23Na is lower compared with that of 20Ne.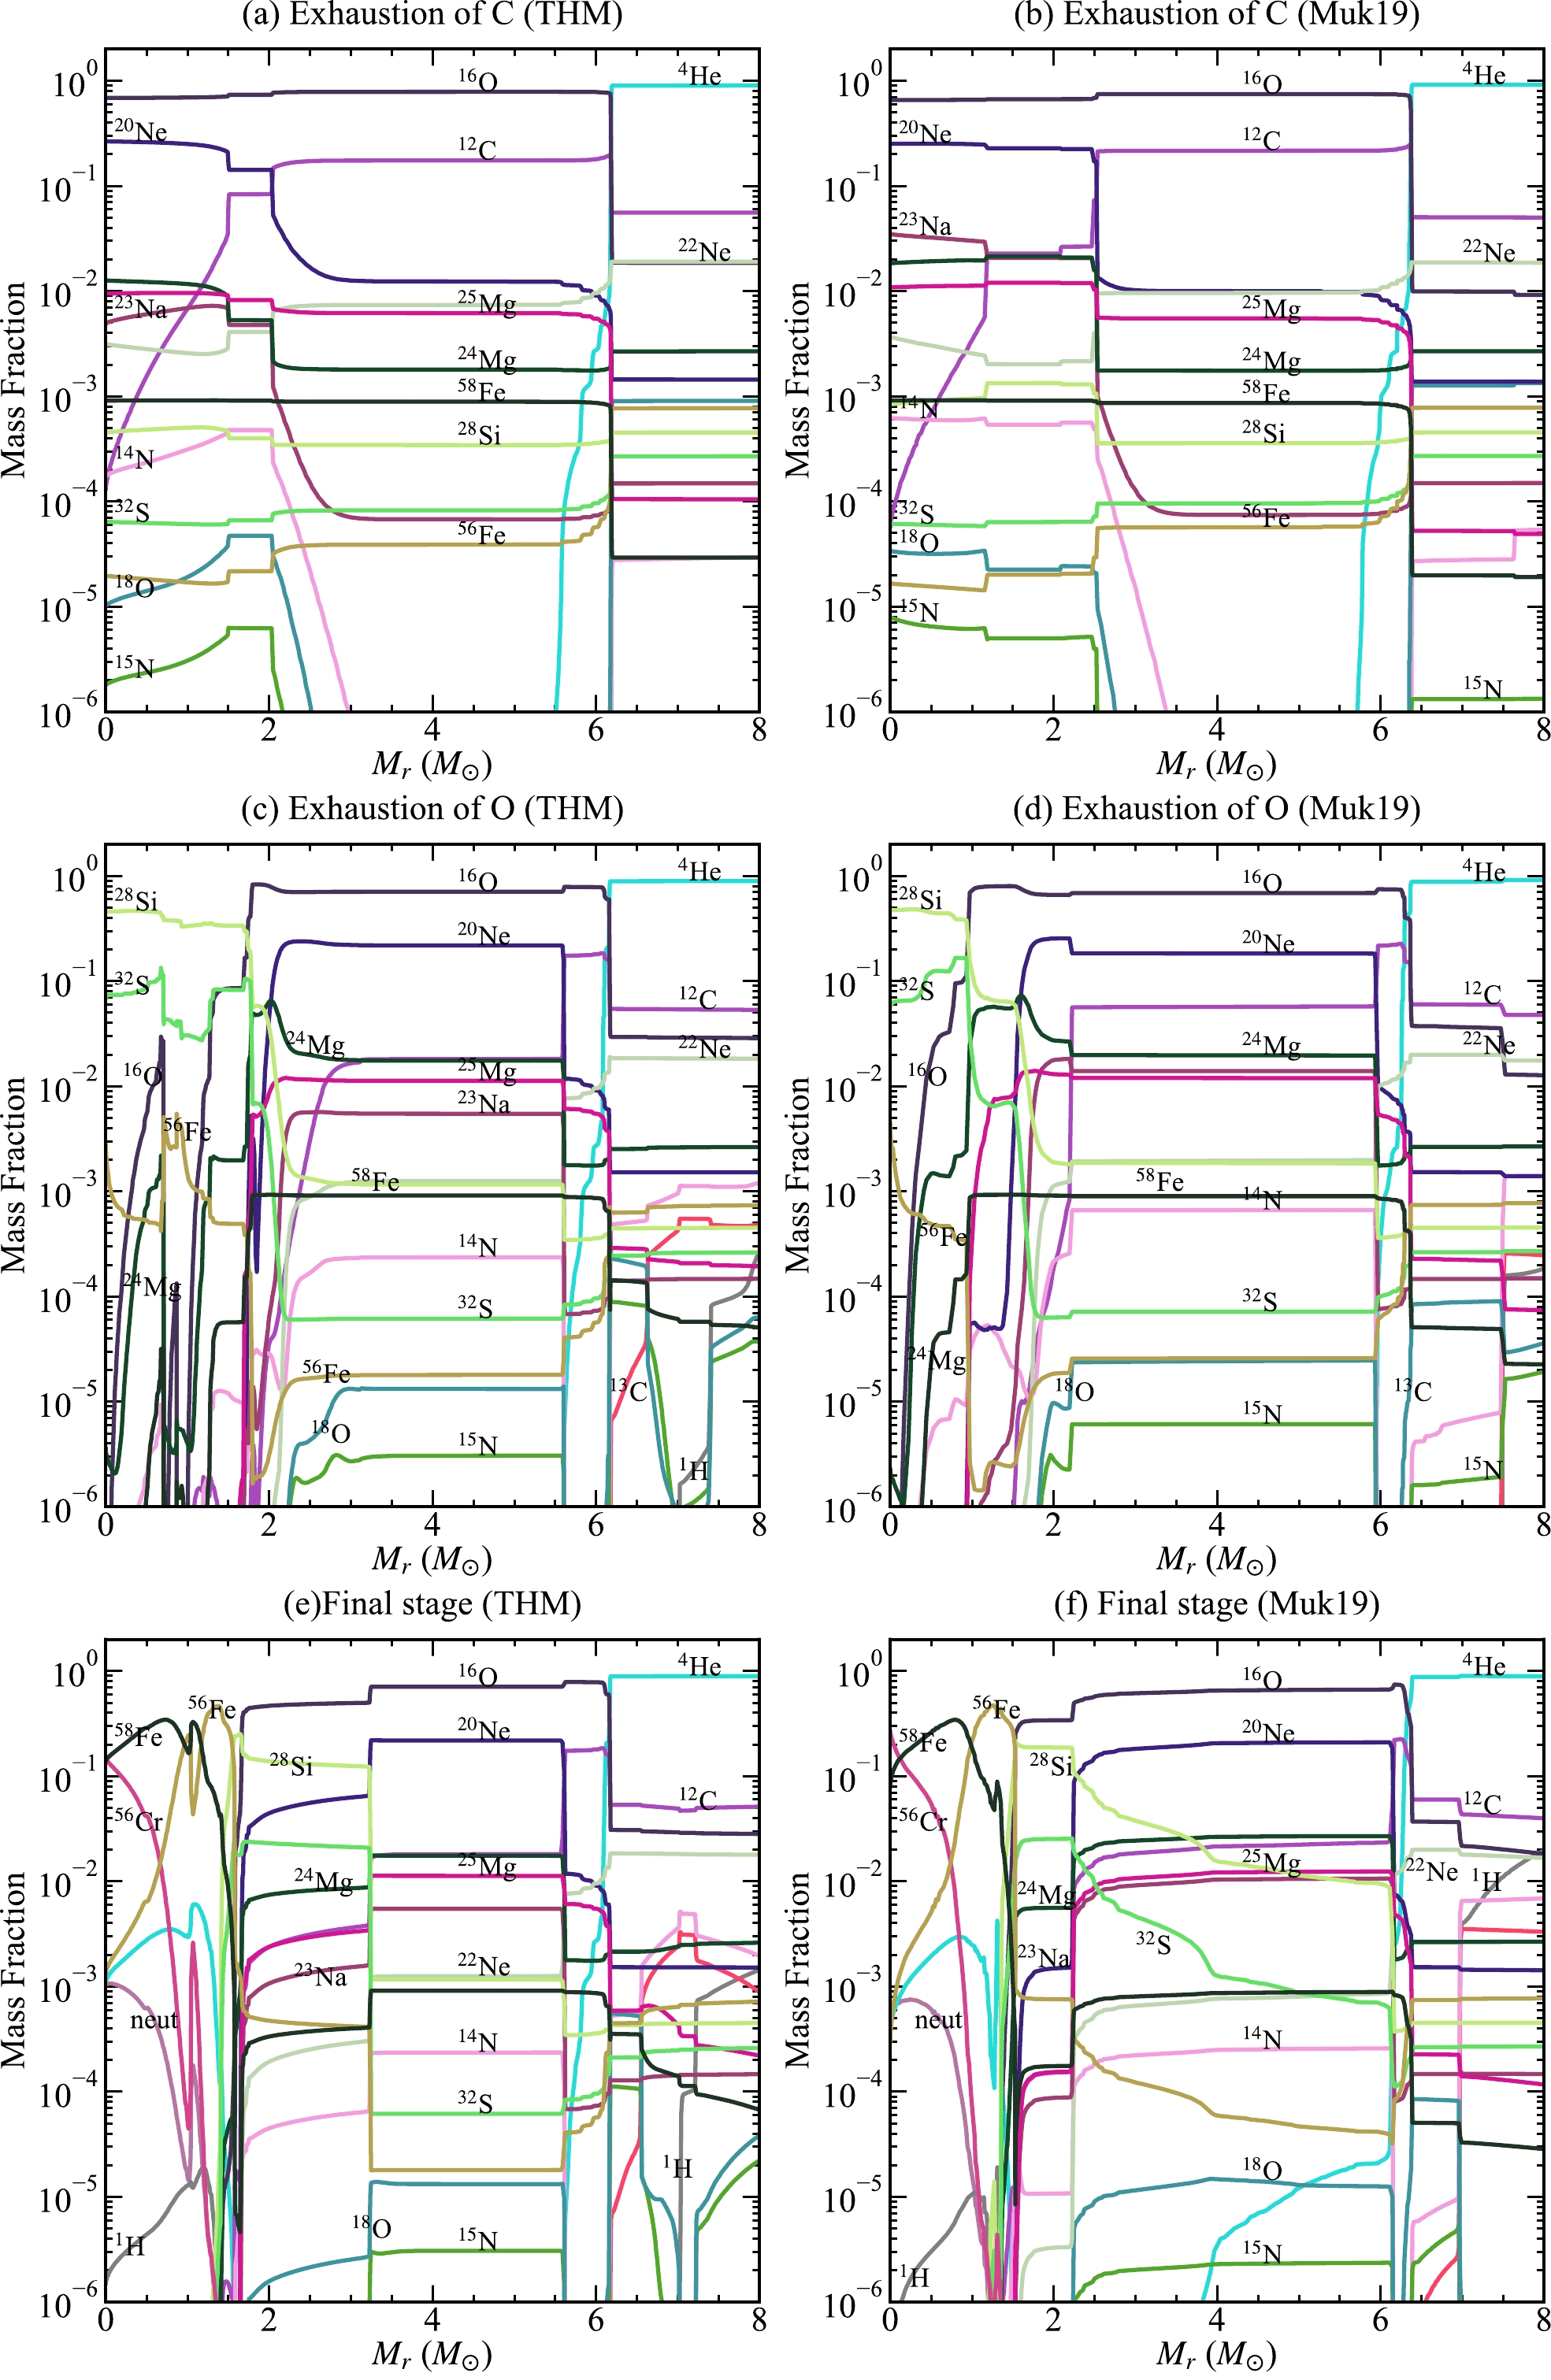
Figure 7. (color online) Abundance distributions of stars with M (ZAMS) = 25 M
$ _{\odot} $ at the exhaustion of C burning (top row), O burning (center row), and the final stage (bottom row) for the THM (left) and Muk19 (right) rates. The exhaustion of C or O is defined as X(C) or X(O) lower than 10$ ^{-4} $ at the center. The final stage is defined as when the temperature reaches 1010 K at the center.After core He burning, the neutron excess (
$\eta=1- 2Y_{\rm e}$ ) is$ \sim $ 0 in the core because 16O and 12C have an equal proton number (Z) and neutron number (N).Here,
$ Y_{\rm e} $ is the electron mole number, defined as$ Y_{\rm e} = \frac{n_{\rm e}}{\rho N_{\rm A}}, $

(1) where
$ n_{\rm e} $ is the electron number density, and$ N_{\rm A} $ is the Avogadro constant.The production of isotopes with
$ N>Z $ is sensitive to the neutron excess [52]. However, 12C(12C, p)23Na cannot change the neutron excess in the core, and thus 23Na produced by this reaction is unstable and rapidly converts to 20Ne. Bucher et al. [53] indicated that though the branching ratio of 12C(12C,n)23Mg is small, the contribution to the production of 23Na is important because β decay in the 12C(12C, n)23Mg( $ \beta^- $ )23Na chain can change the neutron excess. Woosley et al. [52] mentioned that the reaction chain 20Ne(p,γ)21Na($ \beta^- $ )21Ne(p,γ)22Na($ \beta^- $ )22Ne(p,γ)23Na (Ne-Na chain) also increases the neutron excess significantly during C burning. Therefore, the contribution of the Ne-Na chain to the production of 23Na is also important.The main contributors to the production of 23Na in the core are 12C(12C, n)23Mg(
$ \beta^- $ )23Na and the Ne-Na chain. As shown in Fig. 8, the Muk19 model has higher burning temperatures in the core. The higher temperatures lead to these two reaction chains being more active. Therefore, the neutron excess is enhanced and more 23Na is produced in the core. Owing to the larger neutron excess in the core of the Muk19 model, several neutron-rich isotopes, such as 15N and 18O, exhibit higher production.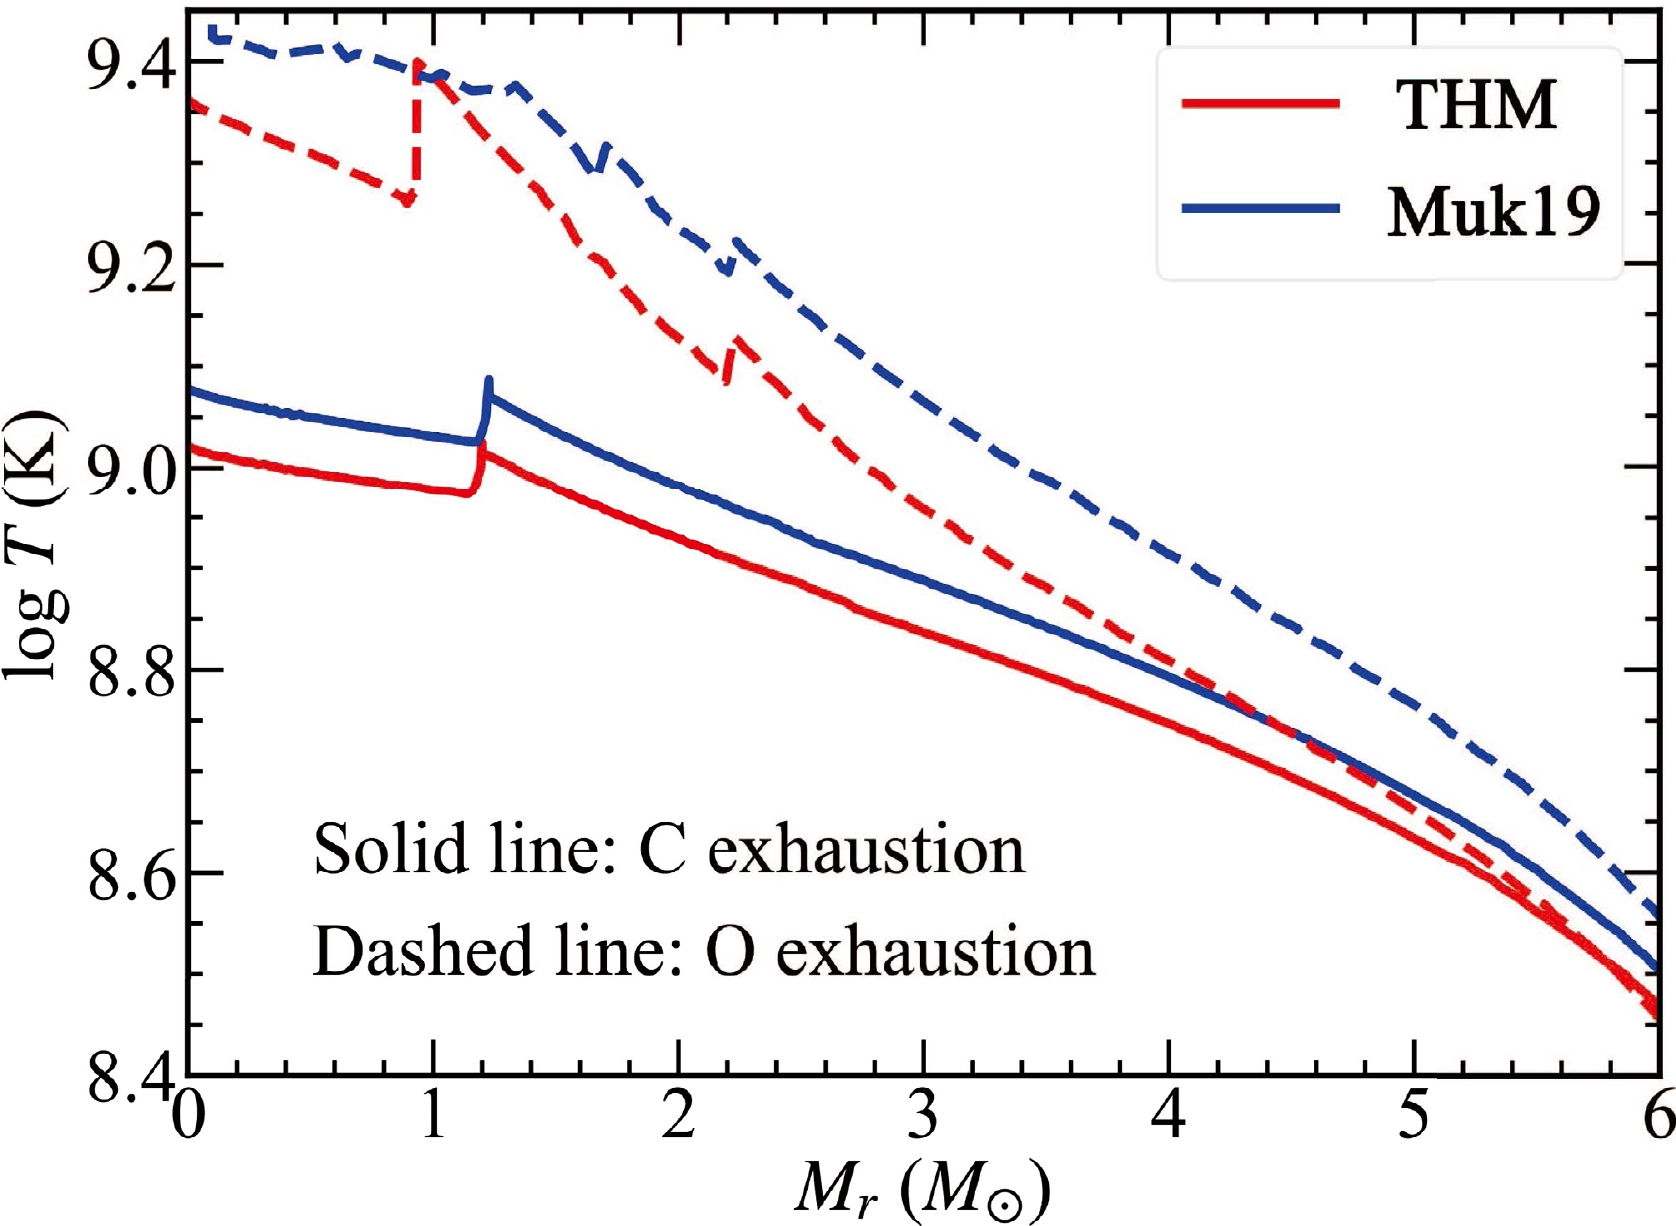
Figure 8. (color online) Temperature distribution against
$ M_r $ within$ M_r= $ 6 M$ _\odot $ for the THM (red) and Muk19 (blue) models. The solid and dashed lines represent the exhaustion of C and O, respectively.Pignatari et al. [29] noted that a higher 12C+12C rate may increase the s-process production during C burning because the 13C(α, n)16O reaction emerges as a more dominant neutron source than 22Ne(α, n)25Mg. However, this reaction is only active at the beginning of C burning in the THM model, which is not high enough to have an obvious effect on the s-process. Thus, s-process isotopes, such as 58Fe, behave with no obvious difference at the end of C burning in the two models. When C at the core is almost exhausted (log
$ \tau \simeq $ 1 yr), the core contracts and gravitational energy is released to balance the energy lost by neutrinos. Owing to the lower temperature in the core, stars with the THM rate require more time to contract and reach the temperatures of the Ne and O ignitions.In Fig. 7 (c) and (d), when O is exhausted (X(O)
$ < $ 10$ ^{-4} $ ) at the center, a core composed mainly of 28Si and 32S is formed. Figure 8 shows that the CO shell has a lower temperature in the THM than Muk19. The THM model consumes more 12C but produces less 23Na in the shell. As mentioned, most of the 23Na produced by the p channel is destroyed by the 23Na(p, α)20Ne reaction, which is sensitive to temperature [28, 29].During massive star evolution, neutrino losses decrease the central entropy that leads to the formation and contraction of the Fe core. In Fig. 9, the Fe core at
$ t = t_{\rm final} $ has$Y_{\rm e} =$ 0.437 and 0.441 at the center of Muk19 and THM, which increases gradually to 0.461 and 0.460 at the core edge of the Muk19 and THM models, respectively. At$ M_r< $ 1.5 M$ _\odot $ , the two models have the similar$Y_{\rm e}$ , except at the center and Mr =1.2M$ _\odot $ , where the difference in Ye originated from different production of 56Cr via decay of 56Fe. At 2.2 M$ _\odot <M_r< $ 3.2 M$ _\odot $ , the THM model has a lower$ Y_e $ (larger neutron excess). In this layer, the Muk19 model is mainly composed of 16O, 20Ne, and 28Si (before O burning), whereas some 16O, 20Ne, and 28Si is consumed (during O burning) for the THM (see Fig. 7 (e) and (f)). During O burning, the neutron excess is significantly enhanced by weak interactions [50]. For the outer shell of$ M_r> $ 2.2 M$ _\odot $ , the lower$Y_{\rm e}$ is consistent with the higher production of 23Na for Muk19.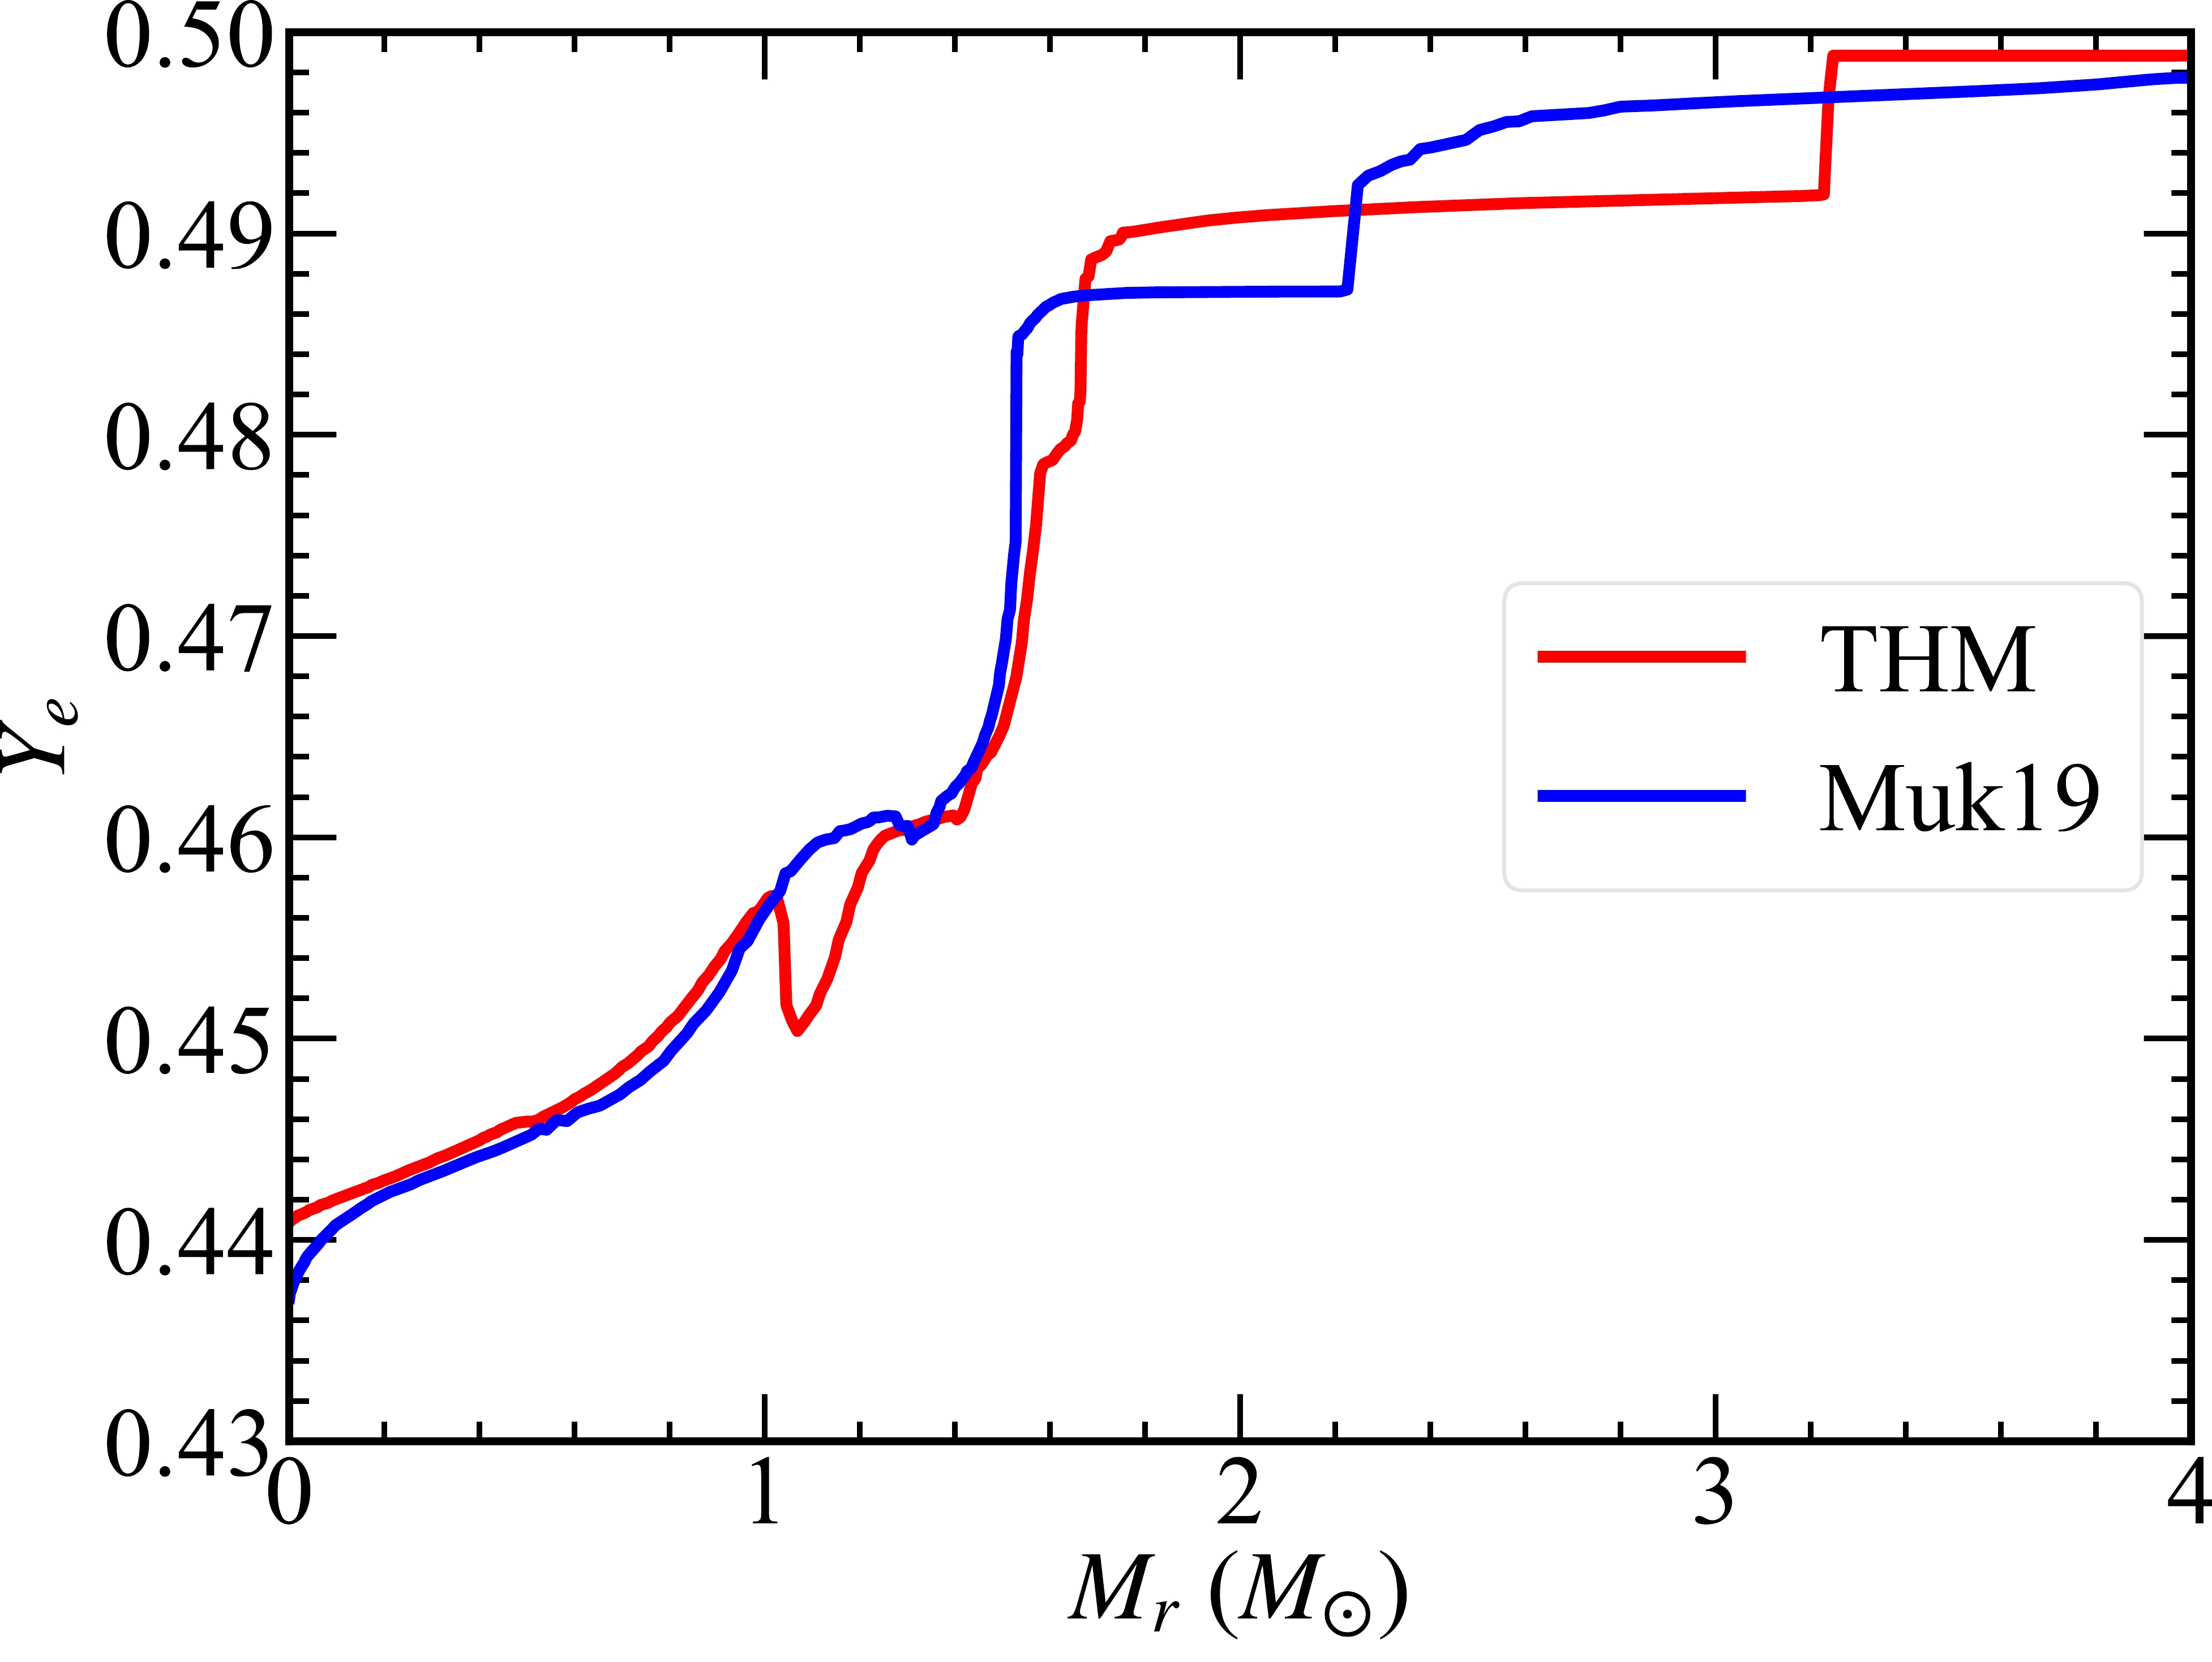
Figure 9. (color online) Distribution of electron mole number,
$ Y_e $ , against$ M_t $ within$ M_r= $ 4 M$ _\odot $ at the final stage for the THM (red) and Muk19 (blue) models.$ Y_e $ is defined in Eq. (1).Therefore, the THM model can ignite core and shell C burning at lower temperatures. This leads to a lower neutron excess and decreases the production of some neutron-rich isotopes, such as 15N, 18O, and 23Na, in the O shell. However, the burning temperature is not low enough to activate the 13C(α, n)16O reaction. Thus, the difference between the THM and Muk19 rates is not sufficiently large to have an obvious effect on the s-process during C burning.
-
In the observed solar abundance, the production of the intermediate-mass isotopes (
$ A= $ 16 – 40) is mainly contributed to by Type II supernovae (SNe II, [52, 54, 55]). Under this assumption, similar production factors are desirable for these isotopes in stars with solar metallicity. The production factor of an isotope i is given by Eq. (2) [56].$ P_i \equiv \frac{Y^*_i}{X_{i,\odot} \cdot \sum_{k} Y^*_k} , $

(2) where
$ X_{i, \odot} $ is the solar mass fraction of isotope i,$ \sum_{k} $ runs over all isotopes, and$ Y^*_i $ represents the yield interpolated by the initial mass function (IMF) for isotope i and is defined in Eq. (3).$ Y^*_i = \sum\limits_{j}\int_{m_j}^{m_{j+1}} \xi(m)\cdot(s_{i,j} \cdot [m-m_j]+Y_{i,j})\cdot {\rm d}m. $

(3) In Eq. (3), the IMF
$ \xi(m)\,= $ C$ \cdot m^\gamma $ with$ \gamma=-2.35 $ for massive stars is adopted [57]. The mass grid of$ M ({\rm ZAMS}) $ s is used here for integrations.$ Y^* $ is the yield linearly interpolated value between the mass grids$ m_j $ and$ m_{j+1} $ .$ s_{i,j} $ is the slope of the integral, which is defined as$ s_{i,j}= (Y_{i,j+1}-Y_{i,j})/(m_{j+1}-m_j) $ .Based on the assumption mentioned above, Weaver and Woosley [58] and Woosley and Heger [59] constrained the reaction rate of 12C(α, γ)16O with the production factors of presupernovae, which are modified by the explosion models later. In this study, we only calculate the massive stars from ZAMS until the onset of the Fe-core collapse, and we do not simulate the supernova explosion. Because Fe-peak isotopes are significantly affected by the explosion, in the following part, only the elements and isotopes from C to Ti are shown and discussed. The production factors of 16O, 20Ne, 23Na, 24Mg, and 27Al for all models are shown in Fig. 10. They change with
$ M{\rm (ZAMS)} $ smoothly. In Fig. 11, we compare the averaged production factors of the THM and Muk19 models. To confirm how large the supernova modification can be, the production factors of several important isotopes (gray points,$ ^{16,\,18} $ O, 20Ne, 23Na, 24Mg, 28Si, 32S, 36Ar, and 40Ca) after the explosion in Tur et al. [60] (hereinafter referred to as T07) are also compared.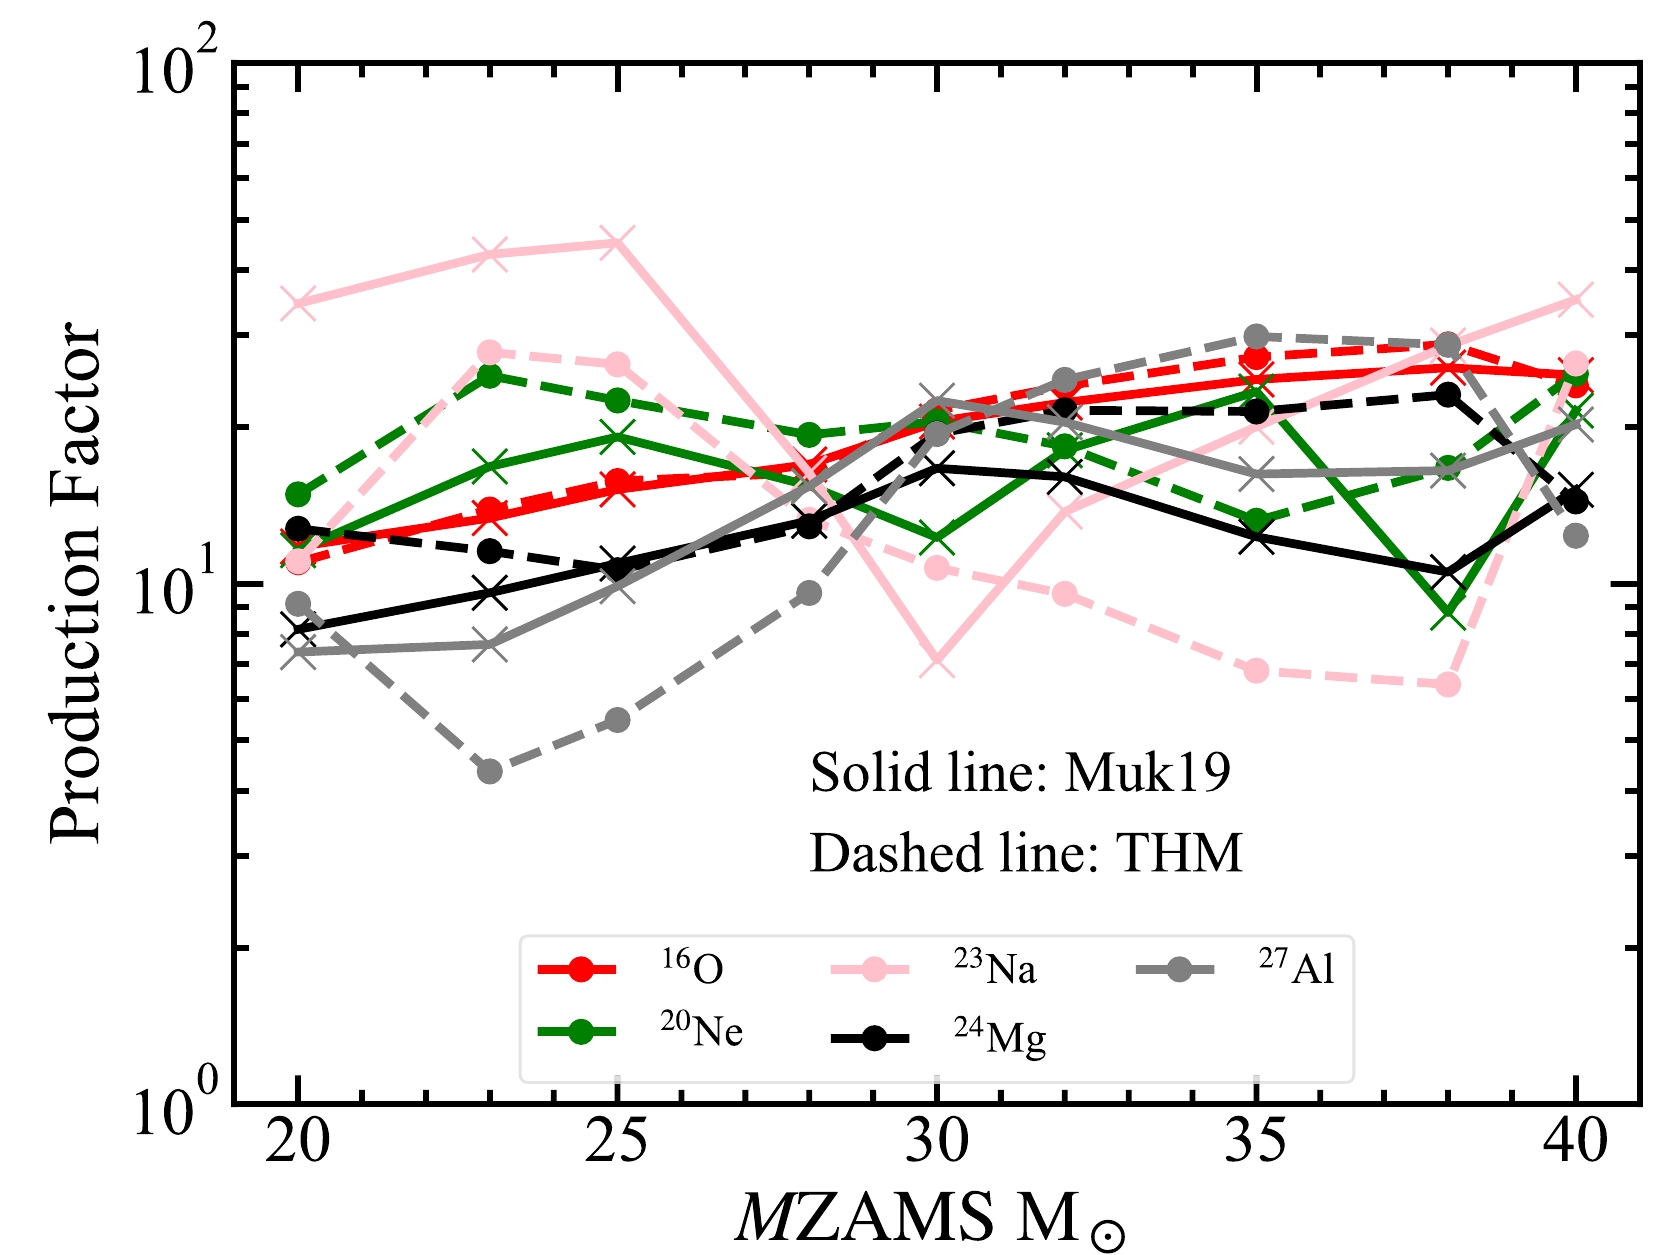
Figure 10. (color online) Production factors of 16O, 20Ne, 23Na, 24Mg, and 27Al as a function of M(ZAMS). The models with the THM and Muk19 rates are marked by dashed and solid lines, respectively.
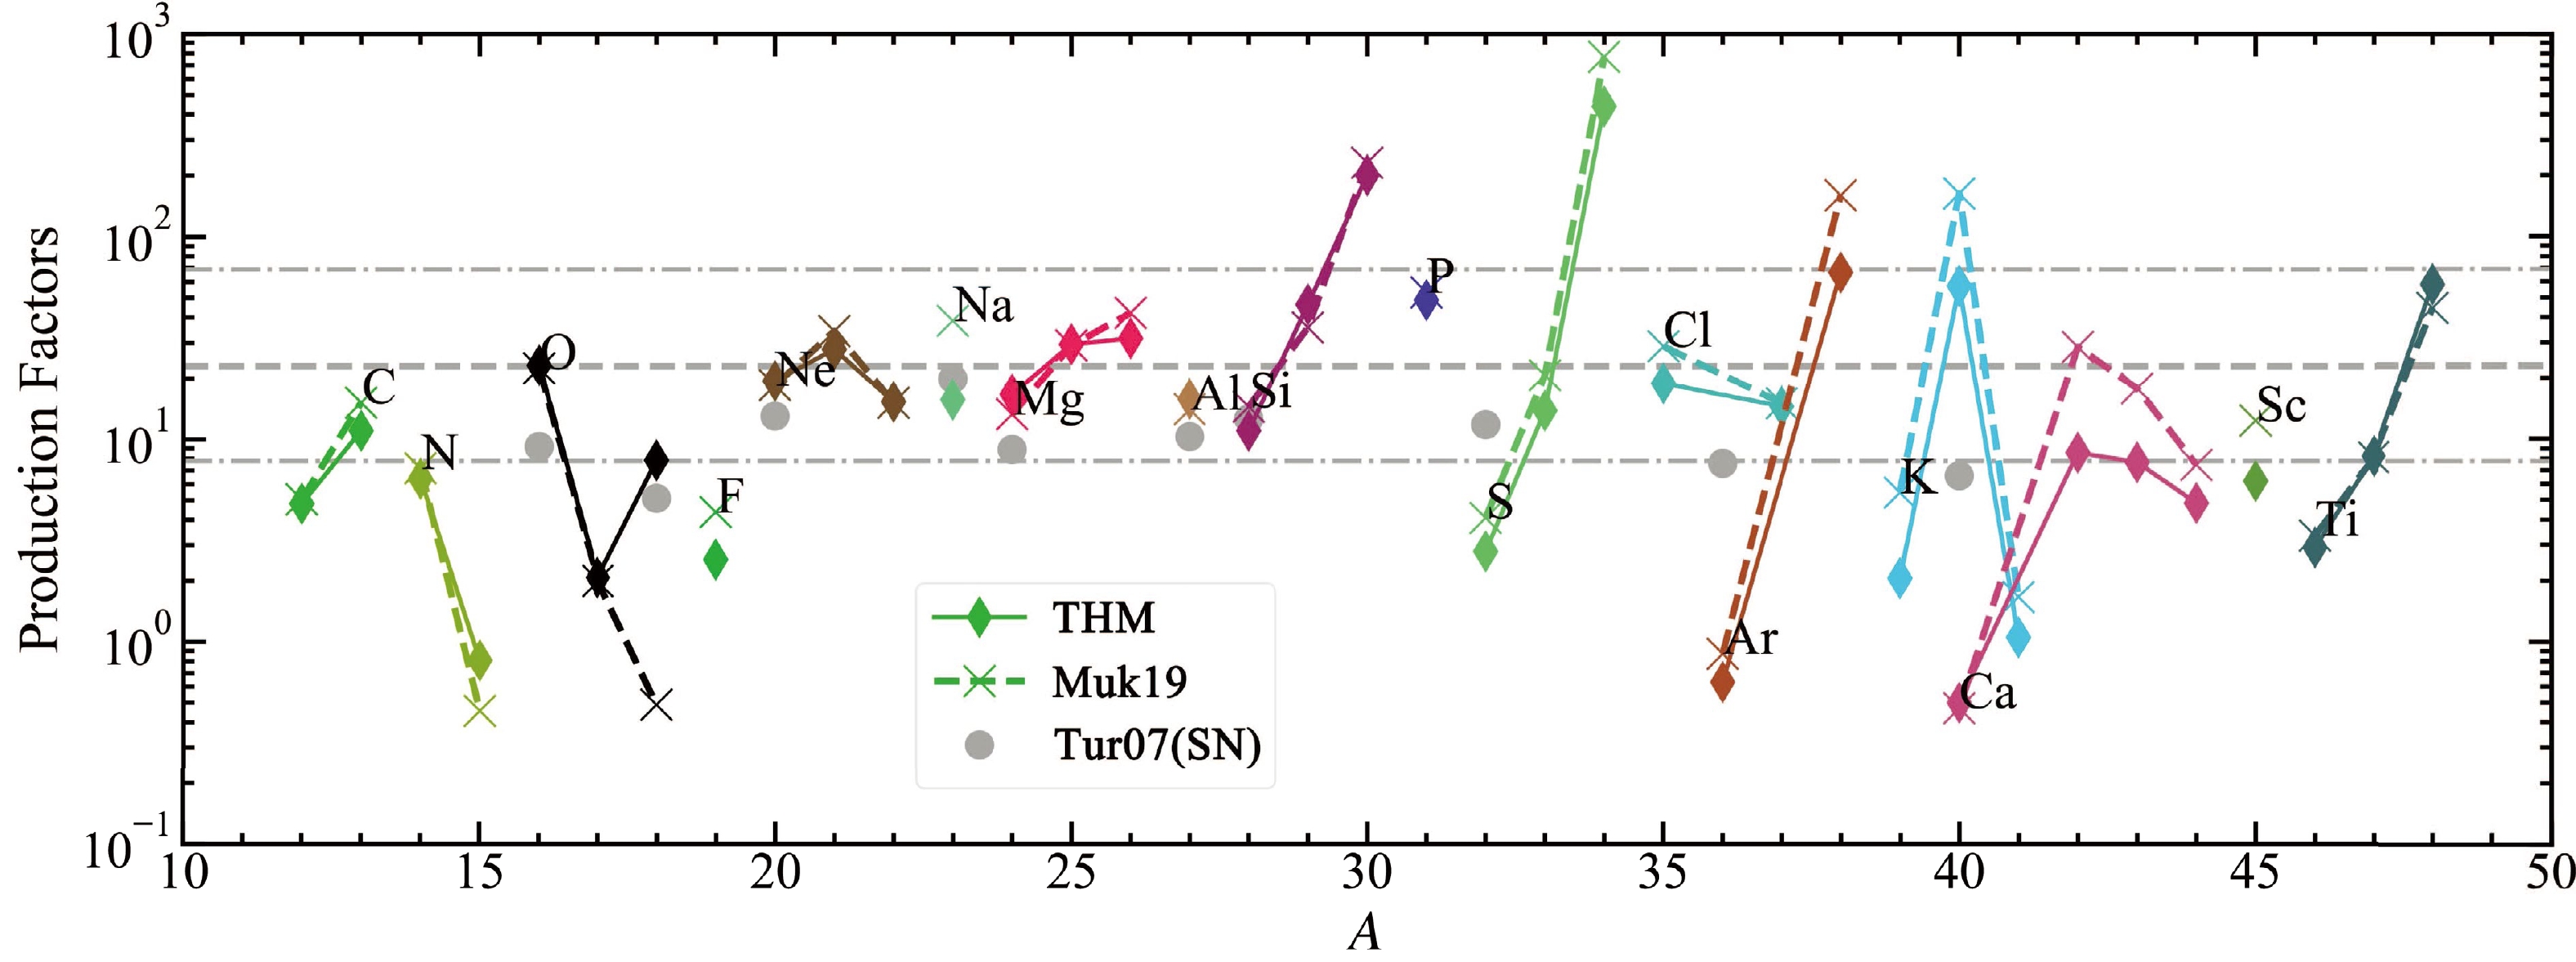
Figure 11. (color online) Production factors of isotopes averaged over the IMF from Salpeter et al. [57]. Only the isotopes from C to Ti are shown. The gray lines indicate the production factor of 16O from our pre-explosion models. The dotted lines show three times and one-third of the gray dashed line. The gray points show the production factors in the post-explosion model by Tur et al. [60].
The gray dashed line shows the production factor of 16O, which is the most abundant 'metal' produced by massive stars. We also indicate the locations of three times and one-third of the production factor of 16O using the gray dotted line. For both the THM and Muk19, most of the isotopes from C to Ti relative to O are within a factor of three of the solar ratios. Our production factor of 16O is three times larger than that of T07. The difference stems from two main sources. First, the O+Si shell outside the Fe core burns explosively during the explosion, and 16O in this layer converts to 28Si after the explosion. Second, T07 averaged their yields over
$ M{(\rm ZAMS)}= $ 13 – 27 M$ _\odot $ , whereas we average them over$ M{(\rm ZAMS)}= $ 20 – 40 M$ _\odot $ . Lower$ M{(\rm ZAMS)} $ stars produce smaller 16O and larger 12C. 20Ne, 23Na, 24Mg, 27Al, and 28Si in this study agree with those of the explosion model, whereas isotopes heavier than 28Si, especially 32S, 36Ar, and 40Ca, are underproduced. T07 also reported these differences and considered that these isotopes are significantly modified during the explosion by more than a factor of 1.5. Besides the reaction rate of 12C+12C, the production factors of these intermediate-mass isotopes are affected significantly by the reaction rate of 3α and 12C(α, γ)16O [56, 58, 60, 61].The production factors of 18O, 23Na, and
$ ^{42,\,43} $ Ca show obvious differences between the THM and Muk19 models. To present these differences more clearly, we compare the ratio of the averaged yield between Muk19 and the THM for all isotopes from C to Ti in Fig. 12. Most ratios of the averaged yield between Muk19 and the THM range from$ \sim $ 0.3 to 10. All the isotopes with the same neutron and proton number have similar production factors between the two models. For the lighter elements, owing to more H mixed into the He shell, the Muk19 model produces more isotopes related to the CNO cycle, such as 13C, 13N,$ ^{14,\,15} $ O,$ ^{17,\,19} $ F, and$ ^{18,\,19} $ Ne, in the He shell. In the CO shell, more neutron-rich isotopes are produced in the Muk19 model owing to the larger neutron excess. However, near the Fe core, the ratio of neutron-rich isotopes tends toward 1 because of the small difference in neutron excess between the two models.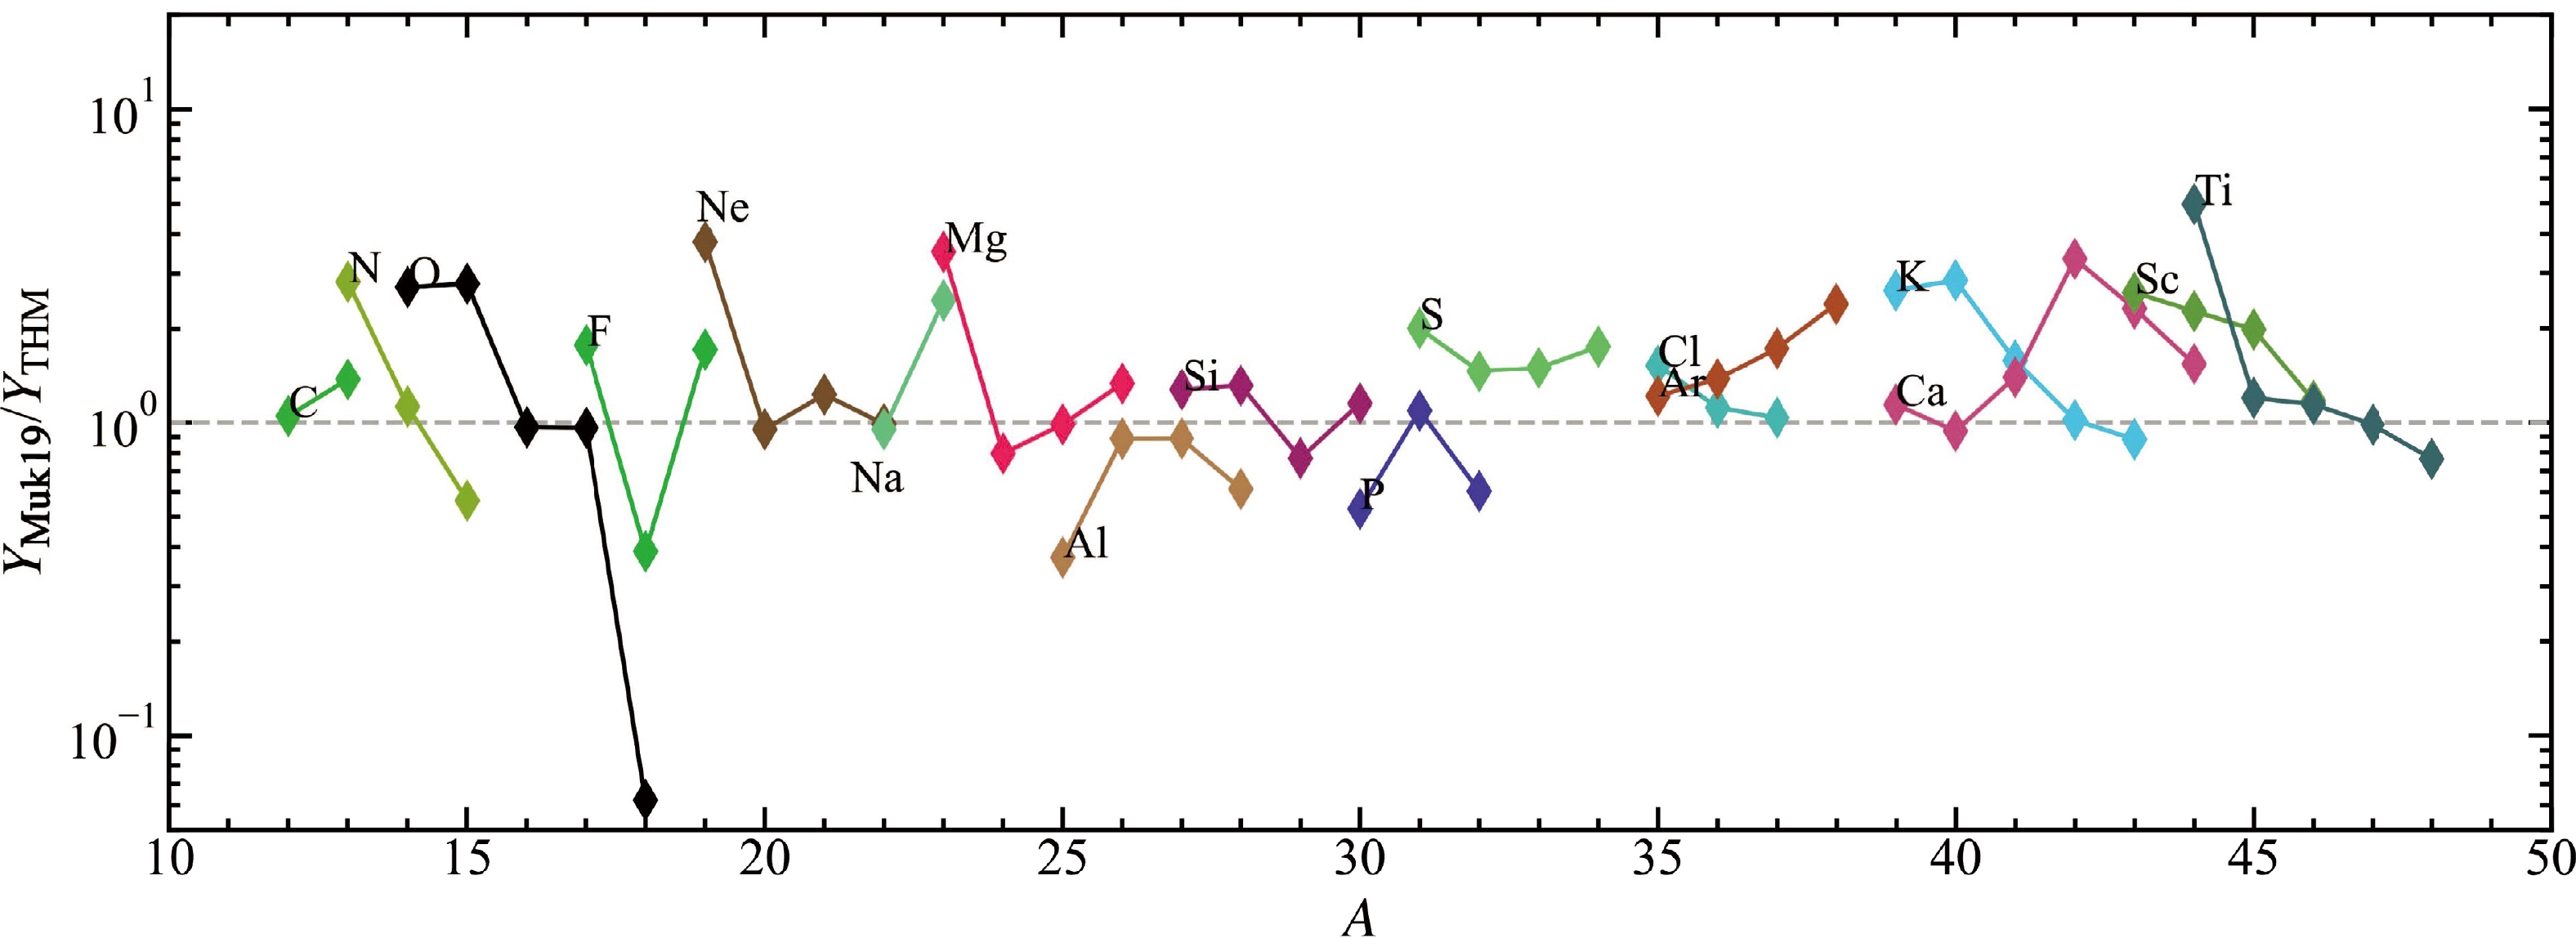
Figure 12. (color online) Ratios of the averaged yields for all isotopes used in the network, shown in Table 1, between C and Ti. The gray dashed line indicates where the ratio is 1.
-
In Sections IV and V, we conclude that owing to the lower neutron excess, the THM model produces fewer neutron-rich isotopes in the CO shell. We also confirm the conclusion made in T07 that isotopes after 28Si are significantly modified by the explosion, whereas isotopes in the outer shell, such as 20Ne, 23Na, 24Mg, and 27Al, are less affected by the explosion. The main purpose of this section is to conduct a comparison between theoretical yields and observed abundances. In Fig. 13, we show the abundance patterns of the presupernova yields of the THM and Muk19 models. The abundance ratio is defined as
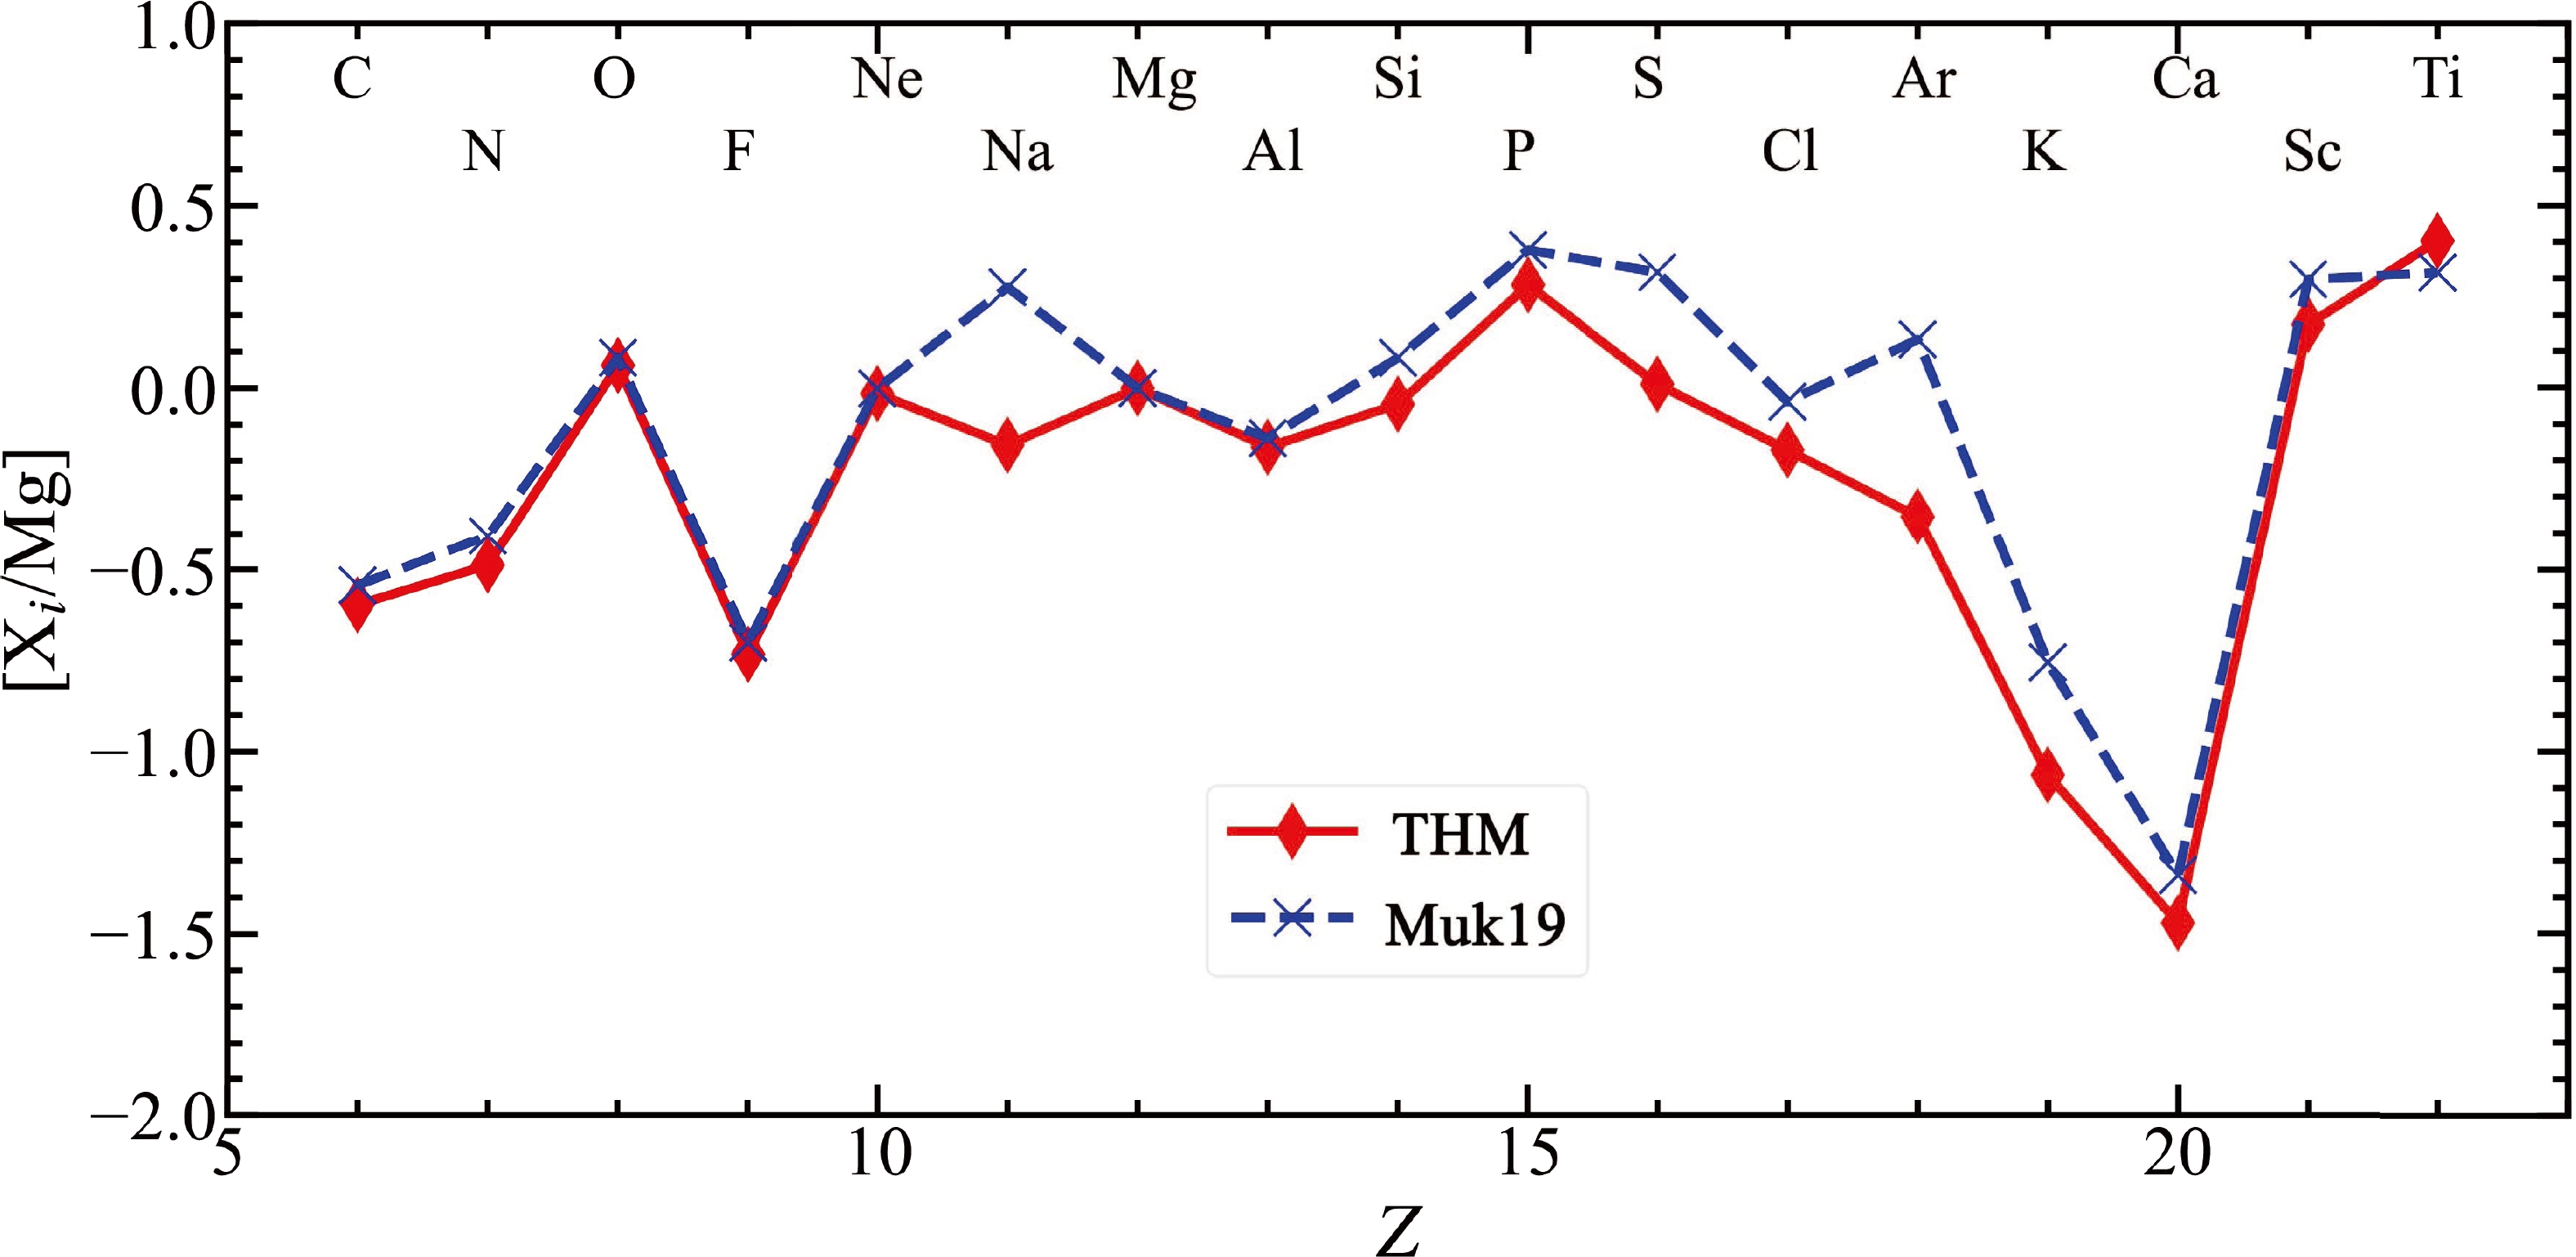
Figure 13. (color online) Abundance patterns of presupernovae averaged over the IMF from Salpeter et al. [57]. [X
$ _{i} $ /Mg] is defined in Eq. (4), where i represents the element from H to Zn.$ \begin{array}{*{20}{l}} [{N}_i/{N}_j] \equiv {\rm log} ({N}_i/{N}_j) - {\rm log} (({N}_i/{N}_j)_\odot), \end{array} $

(4) where N
$ _i $ and N$ _j $ represent the number of species i and j, respectively.We select the Mg yield rather than the Fe or O yields as a denominator because of the obvious modification of these two elements during the explosion, and the Mg yield has a small deviation between the two models. We can find that the abundances of most elements are poorly affected by the 12C+12C rate. Only [Na/Mg] =
$ - $ 0.16, 0.28, [S/Mg] = 0.01, 0.32, [Ar/Mg] =$ - $ 0.35, 0.13, and [K/Mg] =$ - $ 1.06,$ - $ 0.76 exhibit an obvious difference between the THM and Muk19 models.To make a comparison between the yields of stellar evolution models and observed abundances, the galactic chemical evolution (GCE) should also be considered. The latest GCE model from Kobayashi et al. [62] shows that α-elements (namely, O, Ne, Mg, Si, S, Ar, and Ca) are mainly produced by SNe II, and 29% of S and 34% of Ar are contributed by SNe Ia. K is produced by SNe II but underproduced at all metallicities in theoretical models with respect to observations [62, 63]. Na and Mg mainly originate from SNe II, and the contribution from the stellar wind of AGB stars is negligible. Therefore, in this study, [Na/Mg] is adopted to compare with observations. Besides this, the abundances of Na and Mg are the most accessible elements in the observation of near-solar-metallicity stars.
In Fig. 14, we indicate the observed [Na/Mg] with blue crosses from the high resolution spectrum by Bensby et al. [64]. They observed 714 dwarf stars with [Fe/H] ranging from
$ - $ 2.8 to 0.4 in the solar neighborhood and discussed the detailed elemental abundance. Here, we only show stars with [Fe/H] = 0.0$ \pm $ 0.5, that is, those near the solar abundances. The red solid and dashed lines show [Na/Mg] averaged over samples and the standard deviation of$ \pm $ 1σ. The averaged [Na/Mg] is$ \sim - $ 0.043 with$ \pm $ 1σ of$ \pm $ 0.063 at [Fe/H]$ \simeq $ 0.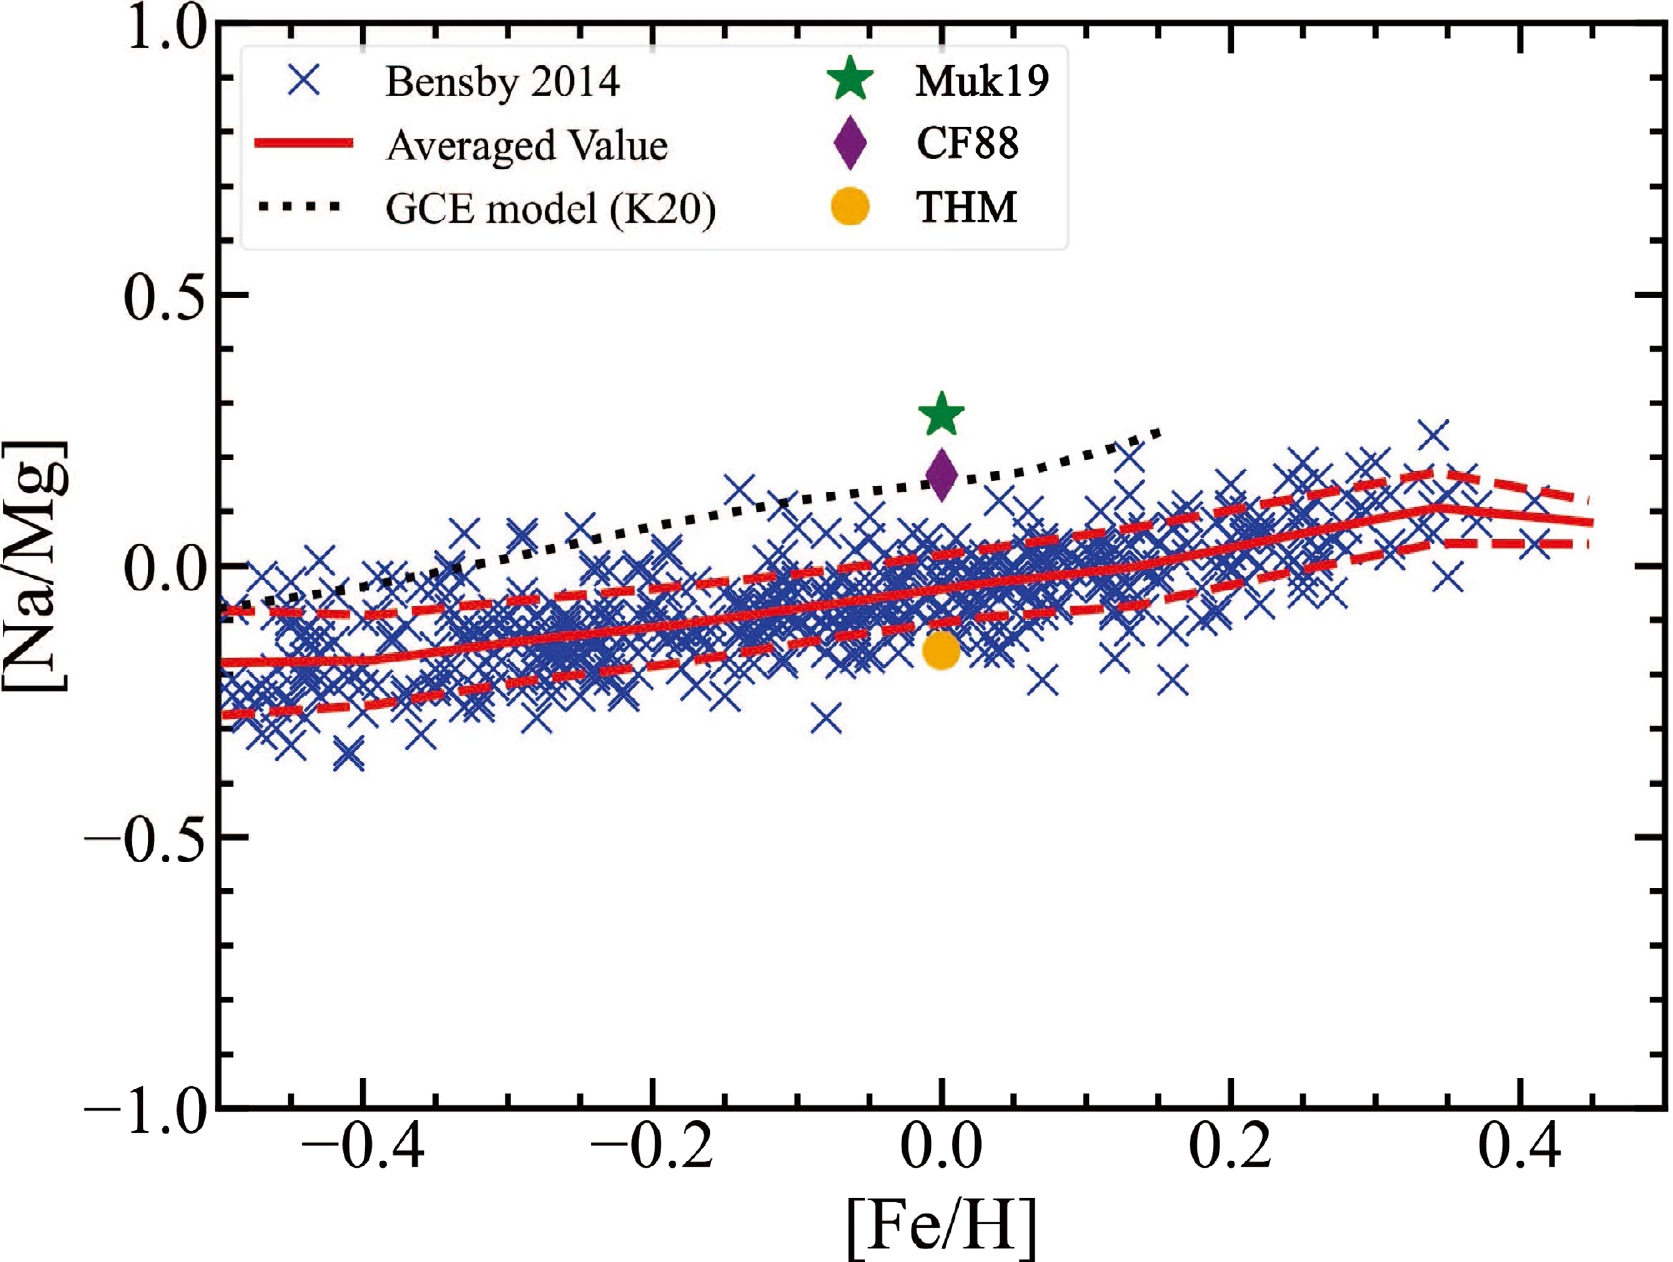
Figure 14. (color online) [Na/Mg] vs. [Fe/H]. The observation data marked with blue crosses collected from the high resolution spectrum by Bensby et al. [64]. The black dashed line shows the predicted [Na/Mg] from the latest GCE model by Kobayashi et al. [62]. Our theoretical [Na/Mg] contributed by presupernovae models with the THM, CF88, and Muk19 is shown with the orange point, purple diamond, and green star, respectively.
The observed relation between [Na/Mg] and [Fe/H] can be interpreted as follows: With decreasing [Fe/H], [Na/Mg] decreases generally because the production of Na depends on the neutron excess owing to 22Ne, which is produced in He burning by α-capture on 14N and 18O. Thus, the production of 23Na depends on the metallicity of progenitors. Mg increases with decreasing [Fe/H] in the range [Fe/H]
$ >- $ 1 due to the contribution of SNe Ia to [Fe/H] [62].The black dotted line shows [Na/Mg] predicted by the latest GCE model from Kobayashi et al. [62]. This GCE model agrees well with observation in the range of [Fe/H] from −4 to 0.2 dex. However, near [Fe/H] = 0, the GCE model exhibits [Na/Fe]
$ \sim $ 0.153, while [Mg/Fe]$ < $ 0. Thus, the predicted [Na/Mg] near [Fe/H] = 0 deviates from the observation by$ \sim $ 3σ (see Fig. 14).[Na/Mg] predicted by our pre-supernova models with the THM, CF88, and Muk19 rates is indicated by the orange point (
$ - $ 0.156), purple diamond (0.167), and green star (0.277), respectively. [Na/Mg] predicted by the GCE model agrees with that of our CF88 model. Indeed, Kobayashi et al. [62] and Nomoto et al. [55] also adopted the CF88 rate. We find that [Na/Mg] of Muk19 and CF88 is located outside of 3σ, and that of the THM model is located within 2σ. Thus, if the THM rate is to be applied in the GCE model, the production of Na would be smaller, whereas the Mg production would be slightly higher. Then, the GCE model would predict that [Na/Fe] and [Mg/Fe] are closer to the solar abundances.However, we should note that there are large uncertainties in stellar evolution models. The uncertainties of nucleosynthesis yields are not easy to quantify. Besides the uncertainties of the 12C+12C reaction rate, the 12C
$ (\alpha, \gamma)^{16} $ O reaction rate also affects the production of Na and Mg [58, 59]. The production of Na and Mg is also affected by convective mixing [52], rotation [65], mass loss [66], and magnetic fields [67]. For the yields of SN II models, the mechanisms of SN explosions and mass ejection from black hole formation are also uncertain [68]. -
The 12C+12C reaction rate plays an essential role in stellar evolution and nucleosynthesis. However, the uncertainty of this reaction rate is still large. In this study, we compare the THM rate with the Muk19 rate by discussing nucleosynthesis through the presupernova stages.
Gasques et al. [11] compared the CF88 and hindrance rates. Bennett et al. [28] and Pignatari et al. [29] also discussed the effect of the CF88 rate on nucleosynthesis. However, they focused on s-process isotopes and long-lived radioactive isotopes, such as 26Al and 60Fe. In this study, we focus on the yields of intermediate-mass isotopes (
$ A= $ 16 – 40), which are mainly produced in presupernova evolution. In$\S 4$ , we discuss the chemical evolution of 25 M$ _\odot $ stars and the production of 23Na. Compared with the Muk19 model, the THM model has lower burning temperatures during shell C burning and produces a smaller amount of 23Na and neutron-rich isotopes in the CO shell owing to the production of lower neutron excess. The burning temperature of the THM model is not sufficiently low to activate the 13C(α, n)16O reaction, and the effect of the THM rate on s-process isotopes is not significant.In Section V, we compare the production factors from our presupernova models with the explosion models from Tur et al. [60]. The production factors of 20Ne, 23Na, 24Mg, and 26Al in our models agree with the explosive nucleosynthesis models well, which would imply that the effects of the explosion may not be so large for these isotopes. Isotopes heavier than 28Si are underproduced but can be further produced by explosive Si and O burning during the explosion.
We also show the ratios of the yields between the Muk19 and THM models. Note that the difference in the ratios of 16O/18O and 14N/15N may be constrained by the study of the atmosphere of brown dwarfs or interstellar molecules. In Section VI, the abundance ratios of elements are compared between the two models. The differences between [Na/Mg], [S/Mg], [Ar/Mg], and [K/Mg] are obvious.
Finally, we compare the theoretical [Na/Mg] of our THM, CF88, and Muk19 models with the abundances in stellar atmospheres observed from high-resolution spectra near [Fe/H]
$ \sim $ 0, as well as the predicted [Na/Mg] from the latest GCE models. We find that [Na/Mg] predicted by our models are within 2σ of the observed stellar ratio for the THM, near 3σ for CF88, and larger than σ for Muk19.However, we should note that the deviation of the astronomical observations of [Na/Mg] reaches
$ \sim $ 0.378 dex for 3$ \pm \sigma $ . For theoretical [Na/Mg], the uncertainty introduced by the 12C+12C reaction rate also reaches 0.433 dex. In forthcoming studies, it is necessary to include explosion models and obtain more precise theoretical yields. Higher resolution astronomical observations and larger-sample sets are expected. Additionally, more precise and lower energy measurements of the 12C+12C reaction rate are necessary. -
We thank Xiao Fang and Xinyu Wang for calculating and providing the reaction rate of Muk19. We are also grateful for the helpful discussion with X. Tang, N. T. Zhang, H. N. Li, and X. F. Zhang.
Impact of the new 12C+12C reaction rate on presupernova nucleosynthesis
- Received Date: 2022-09-27
- Available Online: 2023-03-15
Abstract: The 12C+12C reaction rate plays an essential role in stellar evolution and nucleosynthesis. Nevertheless, the uncertainties of this reaction rate are still large. We calculate a series of stellar evolution models with the near solar abundance from the zero-age main-sequence through presupernova stages for initial masses of 20 M


 DownLoad: