


 Abstract
 HTML
HTML Reference
 Related
 PDF
PDF


-
Gallium is an important semiconductor material, and the neutron capture cross-sections on gallium isotopes are important for the development of radiation detectors, activation analysis, radiation safety, improvement of nuclear reaction model codes, etc. In the EXFOR library [1, 2], there are multiple cross section measurements for the
$ ^{71} $ Ga($n, \gamma $ )$ ^{72} $ Ga reaction, but no report was found on the detailed uncertainty propagation and covariance analysis in the fast neutron energy region, except for that of Priyada Panikkath et al. [3], which involved thermal neutrons. The quality of data is defined by the uncertainties; hence, one should be aware of all the sources of these uncertainties and the correlation between them. For the development of nuclear reaction databases, the dependability of the measured cross sections is determined by the degree of understanding of both practical information and uncertainty propagation. Otuka et al. [4] reported in their theoretical work that data evaluators often face difficulty due to lack of sufficient documentation of the uncertainties of the experiments. The purpose of the present work is to measure the cross section of the$ ^{71} $ Ga($n, \gamma $ )$ ^{72} $ Ga reaction at 2.15 and 3.19 MeV and to report the data with detailed uncertainty propagation and covariance analysis by taking into consideration the uncertainties of all the parameters involved in the activation equation. In addition to the experimental measurements, the cross section of the$ ^{71} $ Ga($n, \gamma $ )$ ^{72} $ Ga reaction was calculated using the nuclear reaction model codes EMPIRE-3.2 [5] and TALYS-1.95 [6]. Our experimental result at 2.15 MeV is compared with the existing literature data and with those of EMPIRE-3.2, TALYS-1.95, ENDF/B-VIII.0, and JEFF-3.1/A [7, 8], while our result at 3.19 MeV is compared with those of EMPIRE-3.2, TALYS-1.95, ENDF/B-VIII.0, and JEFF-3.1/A, as there are no reported data available at this energy. -
The experiment was carried out at Bhabha Atomic Research Centre (BARC), Mumbai, and the Folded Tandem Ion Accelerator (FOTIA) facility was used for the production of the proton beam [9]. Protons with energies 4.00
$ \pm $ 0.02 and 5.00$ \pm $ 0.02 MeV were accelerated and bombarded on a metallic$ ^{7} $ Li target. During the irradiation, the averaged proton beam current was 100 nA. The p +$ ^{7} $ Li$ \rightarrow $ n +$ ^{7} $ Be reaction [$ E_{th} $ = 1.880 MeV], which was the accelerator based particle neutron source, was used to generate the neutron beam. For the study of the energy dependence of the capture cross section, it is most convenient to use an accelerated-particle source involving both the activation technique and observation of the emitted γ-rays. The$ ^{7} $ Li($p,n$ )$ ^{7} $ Be reaction is widely used as the accelerated-particle neutron source because it can produce a high neutron production yield at different neutron energies [10−12]. Because the incident proton energies are higher than the threshold value of the first excited state of$ ^{7} $ Be$ ^{*} $ [$ E_{th} $ = 2.371 MeV] and three-body breakup of the$ ^{7} $ Li(p,n+$ ^{3} $ He+$ ^{4} $ He) reaction [$ E_{th} $ = 3.695 MeV], the low energy background neutron production yield ($ n_{1} $ ) will contribute along with ground state neutron ($ n_{0} $ ) production yield. However, the contribution of the neutron yield from the three-body breakup channel is negligible, and the contribution of neutrons from the first excited state ($ n_{1} $ ) is less than 10%. Hence, the main contribution of the neutron production yield is from the ground state neutrons ($ n_{0} $ ), which is approximately 90% at the incident proton energies [13, 14]. The contribution of the low energy background neutrons from the$ ^{7} $ Be$ ^{*} $ excited state ($ p,n_{1} $ ) was corrected in the present work.In this experiment, the neutron energy spectra could not be obtained using the time-of-flight approach, because the proton beam produced by the accelerator was continuous. Hence, the
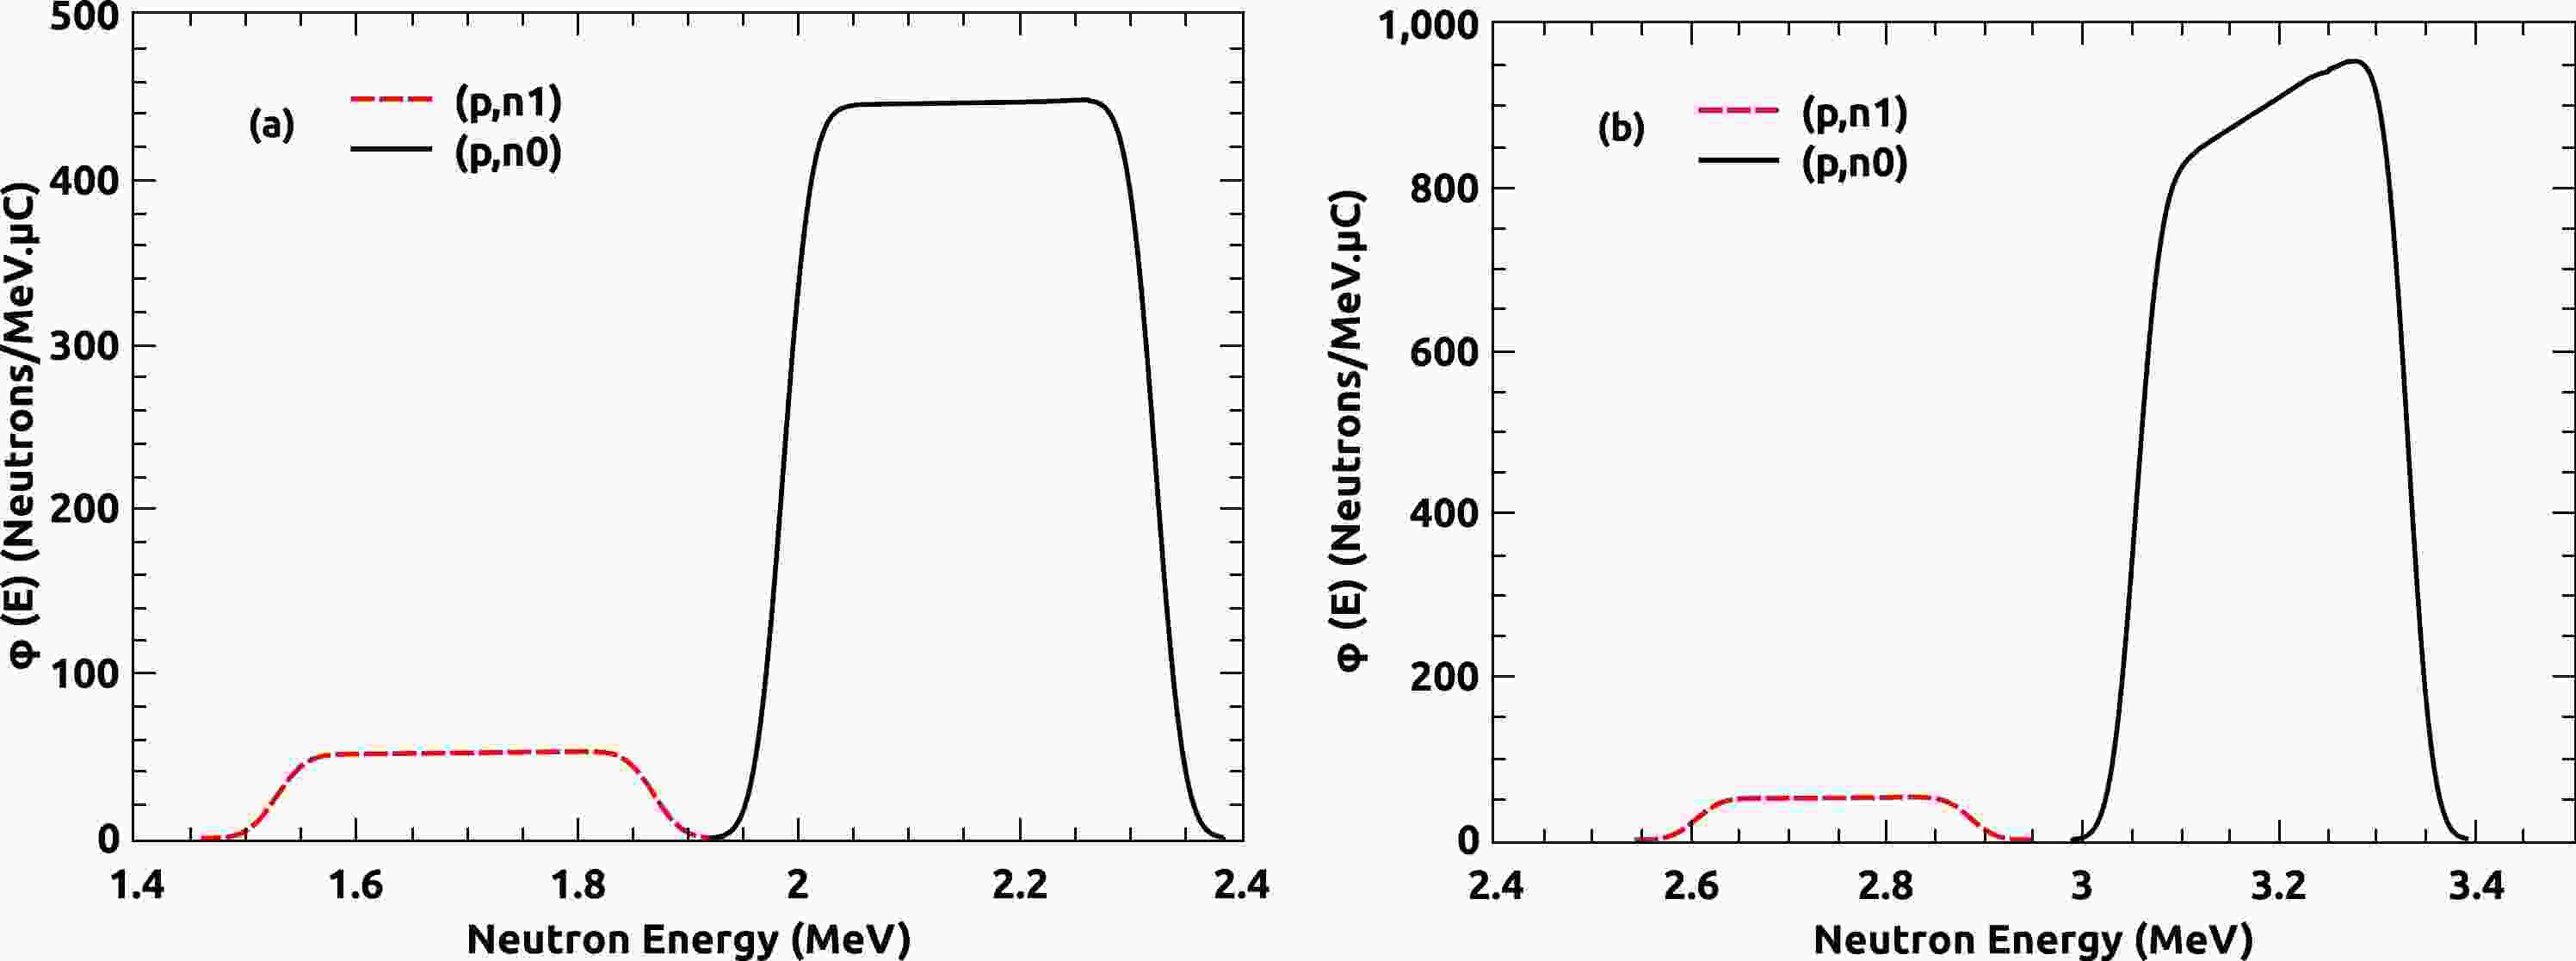
$ ^{7} $ Li($p,n$ )$ ^{7} $ Be neutron energy spectra were calculated using the neutron energy spectrum code EPEN (Energy of Proton Energy of Neutron) developed by our group [12]. The spectra obtained from EPEN at the two incident proton energies are presented in Figs. 1 (a) and (b). In these figures, the spectra of both the ($ p,n_{0} $ ) and ($ p,n_{1} $ ) neutron production yields are shown. The spectrum averaged neutron energies at the two proton energies were obtained from EPEN by using the equation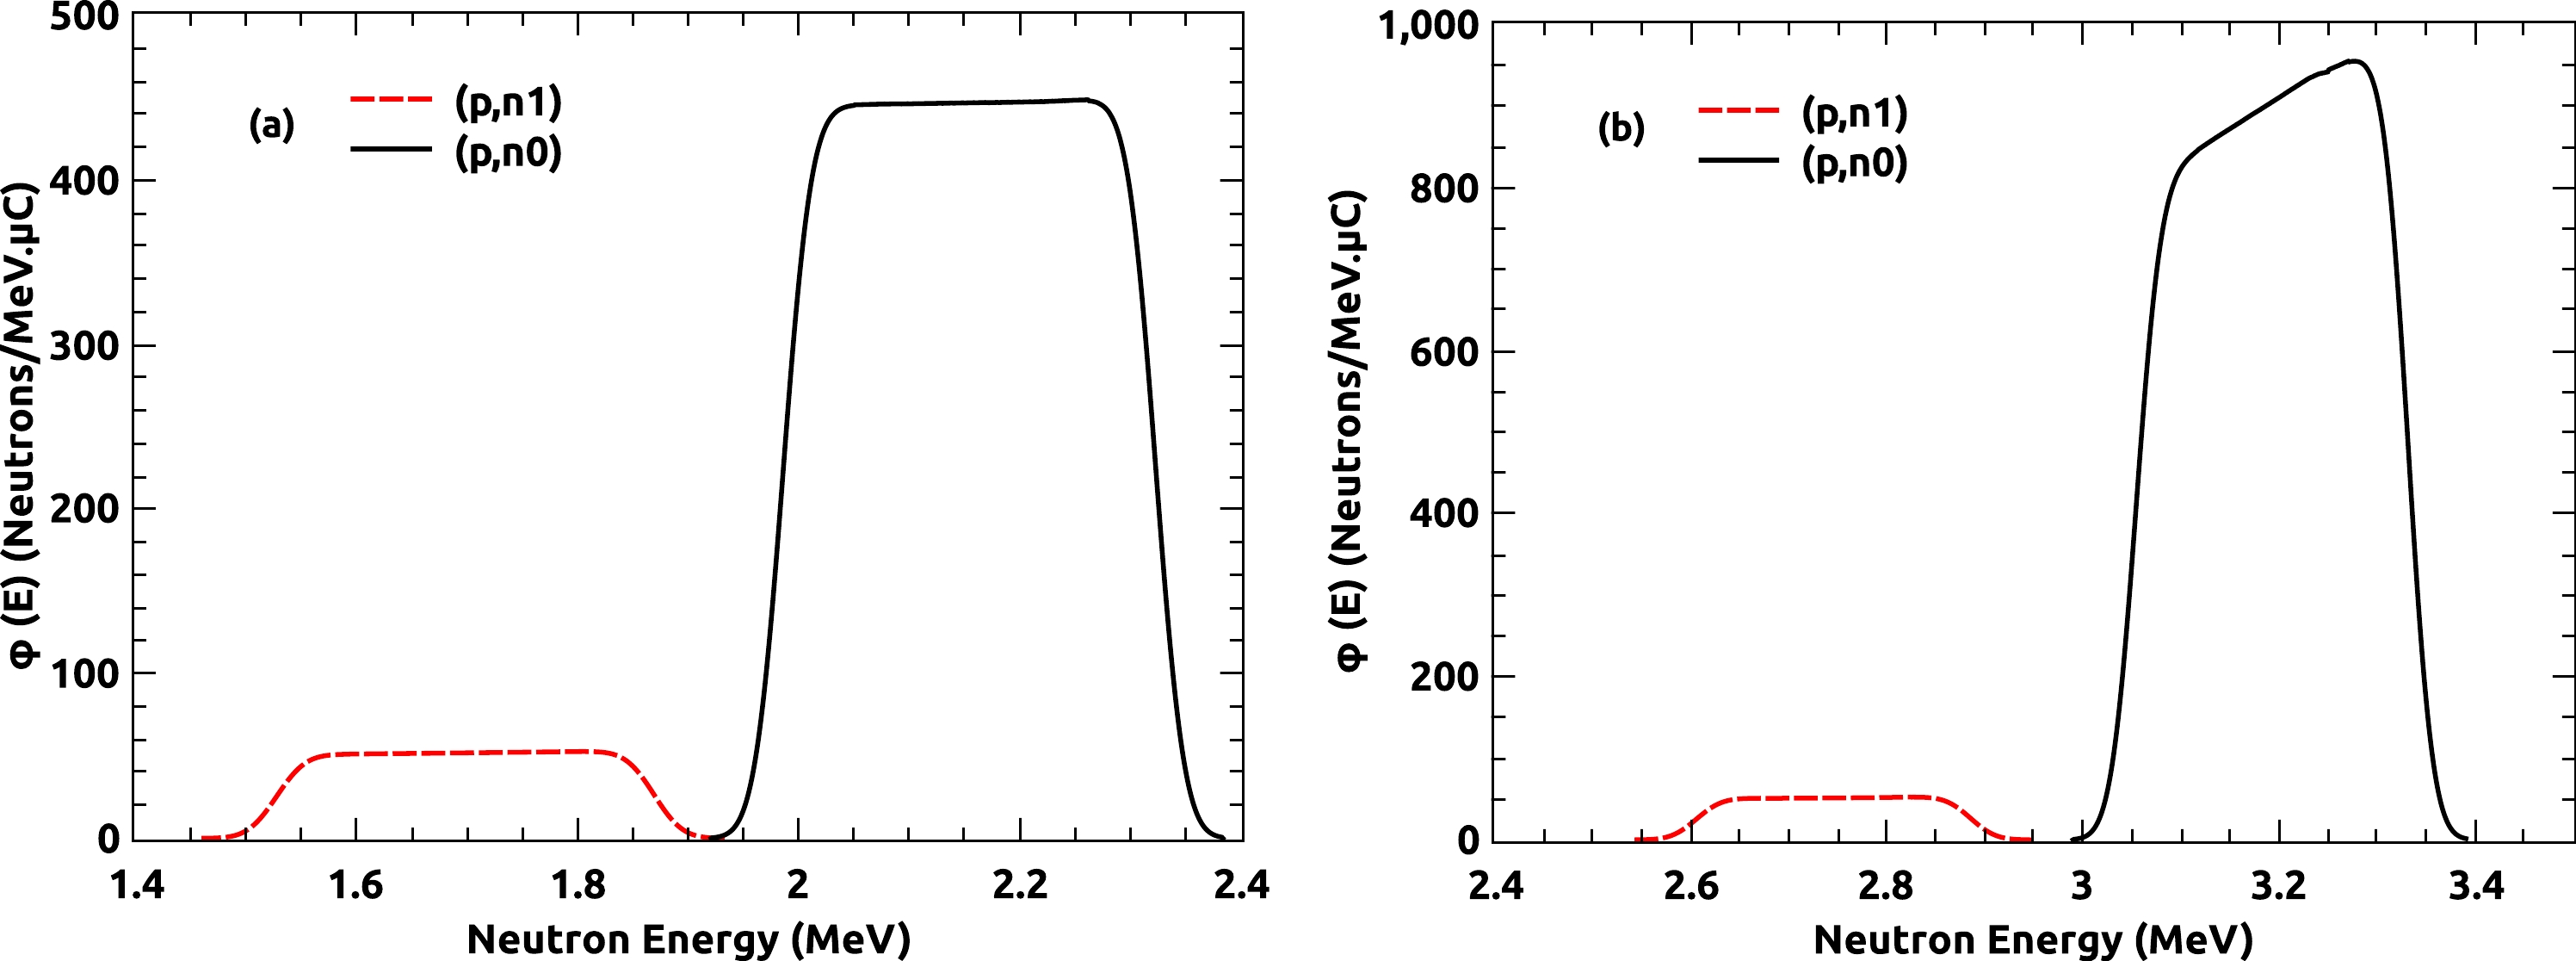
Figure 1. (color online) Neutron flux energy spectra obtained from EPEN at (a)
$ E_{p} $ = 4.00$ \pm $ 0.02 MeV and (b)$ E_{p} $ = 5.00$ \pm $ 0.02 MeV.$ \begin{equation} <E_{n}>=\frac{\displaystyle\int E \times \Phi_{0}(E){\rm d}E}{\displaystyle\int\Phi_{0}(E){\rm d}E}, \end{equation} $

(1) where
$ \Phi_{0}(E) $ represents the neutron flux of the ($ p,n_{0} $ ) neutron energy spectrum obtained from EPEN. In Figs. 1 (a) and (b), the broadening of the neutron spectra is approximately 0.30 and 0.24 MeV (FWHM), respectively. Hence, for proton energies of$ E_{p} $ = 4.00$ \pm $ 0.02 and 5.00$ \pm $ 0.02 MeV, the spectrum averaged neutron energies obtained are 2.15$ \pm $ 0.15 and 3.19$ \pm $ 0.12 MeV respectively. -
The samples of gallium and indium were in the natural form. A natural gallium lump (manufactured by Goodfellow Cambridge Limited, United Kingdom and supplied by H. Fillunger & Co. Pvt. Ltd., Bangalore, India) of purity 99.9999% was used. The neutron flux was normalized using natural indium foil with a thickness of 0.05 cm wrapped with thin aluminium foil of thickness 0.0025 cm. The 115In(
$n,n'$ ) 115Inm reaction was used as a reference reaction, and the known cross sections were retrieved from the IRDFF-1.05 library [15]. Details regarding the samples are given in Table 1. The samples were weighed using micro-balance equipment with a least count of 0.1 mg and irradiated by mounting a stack of In-Ga at a distance of 10 mm from the$ ^{7} $ Li target at zero degrees to the beam direction. The neutron fluxes were calculated by measuring the induced activity of the indium sample at the two spectrum averaged neutron energies, and their values were 1.22×10⁶ and 3.31×10⁶ neutrons/cm2/s at neutron energies of 2.15 ± 0.15 and 3.19 ± 0.12 MeV, respectively.Ep /MeV En /MeV Isotope Irradiated
sampleIsotopic abundance
(%)Sample weight
/mgIsotopic weight
/mgNumber of target nuclei
(10−4 atoms/barn)4.00 ± 0.02 2.15 ± 0.15 $ ^{71} $ Ga

$^{\rm nat}$ Ga

39.892 (50) 145.0 ± 0.1 57.84 ± 0.1 4.912 5.00 ± 0.02 3.19 ± 0.12 148.1 ± 0.1 59.08 ± 0.1 5.017 4.00 ± 0.02 2.15 ± 0.15 $ ^{115} $ In

$^{\rm nat}$ In

95.719 (52) 200.0 ± 0.1 191.42 ± 0.1 10.03 5.00 ± 0.02 3.19 ± 0.12 236.3 ± 0.1 226.16 ± 0.1 11.85 Table 1. Details of the samples used in the present experiment.
-
After the irradiation, the activated samples were allowed to cool for sufficient time and then brought to the counting room. When neutrons interact with the
$ ^{71} $ Ga isotope, the$ ^{72} $ Ga residue product is formed through the ($n, \gamma $ ) reaction, and this$ ^{72} $ Ga produces γ-rays at different energies, e.g., 834.13 keV (Iγ = 95.45%), 629.96 keV (Iγ = 26.13%), and 894.32 keV (Iγ = 10.136%) [16]. In the present work, the 834.13 keV γ-ray was used for calculating the experimental ($n, \gamma $ ) reaction cross section [17]. The latest nuclear decay data along with their uncertainties retrieved from the ENSDF library [18] are given in Table 2.Table 2. Decay data adopted in the present work.
During each irradiation, the Ga sample was placed inside a polythene bag, and it was stable even after the irradiation. Before the induced activity was counted, the samples were placed on perplex plates. A high purity germanium (HPGe) detector, which was a pre-calibrated lead-shielded 185-cc detector with 30% relative efficiency and 1.8 keV resolution at a 1.33 MeV γ-ray energy, was used to count the induced activity on the sample and reference foil. The CAMAC-based LAMPS software [20] was used for the data acquisition and data analysis of γ-ray spectra. The detector dead time was negligible. Details of the irradiation, cooling, and counting times are given in Table 3. The γ-ray spectra obtained from both the sample and monitor reaction residue products are presented in Figs. 2 and 3. Figure 2 shows that the induced activity of the 834.13 keV peak was more intense than those of the 629.96 and 894.32 keV γ-ray energies produced from the
$ ^{72} $ Ga radionuclide; hence, this peak was used for the calculation of ($n, \gamma $ ) reaction cross sections in the present work.Reaction $< E_{n} > \;{\rm{/MeV} }$ 

Irradiation time /s Cooling time /s Counting time /s $ ^{71} $ Ga(

$ n,\gamma $ )

$ ^{72} $ Ga

2.15 21600 5770 10800 3.19 21661 25805 8400 $ ^{115} $ In(

$n,n'$ )

$ ^{115} $ In

$ ^{m} $ 

2.15 21600 3471 679 3.19 21661 11804 917 Table 3. Irradiation, cooling, and counting times.
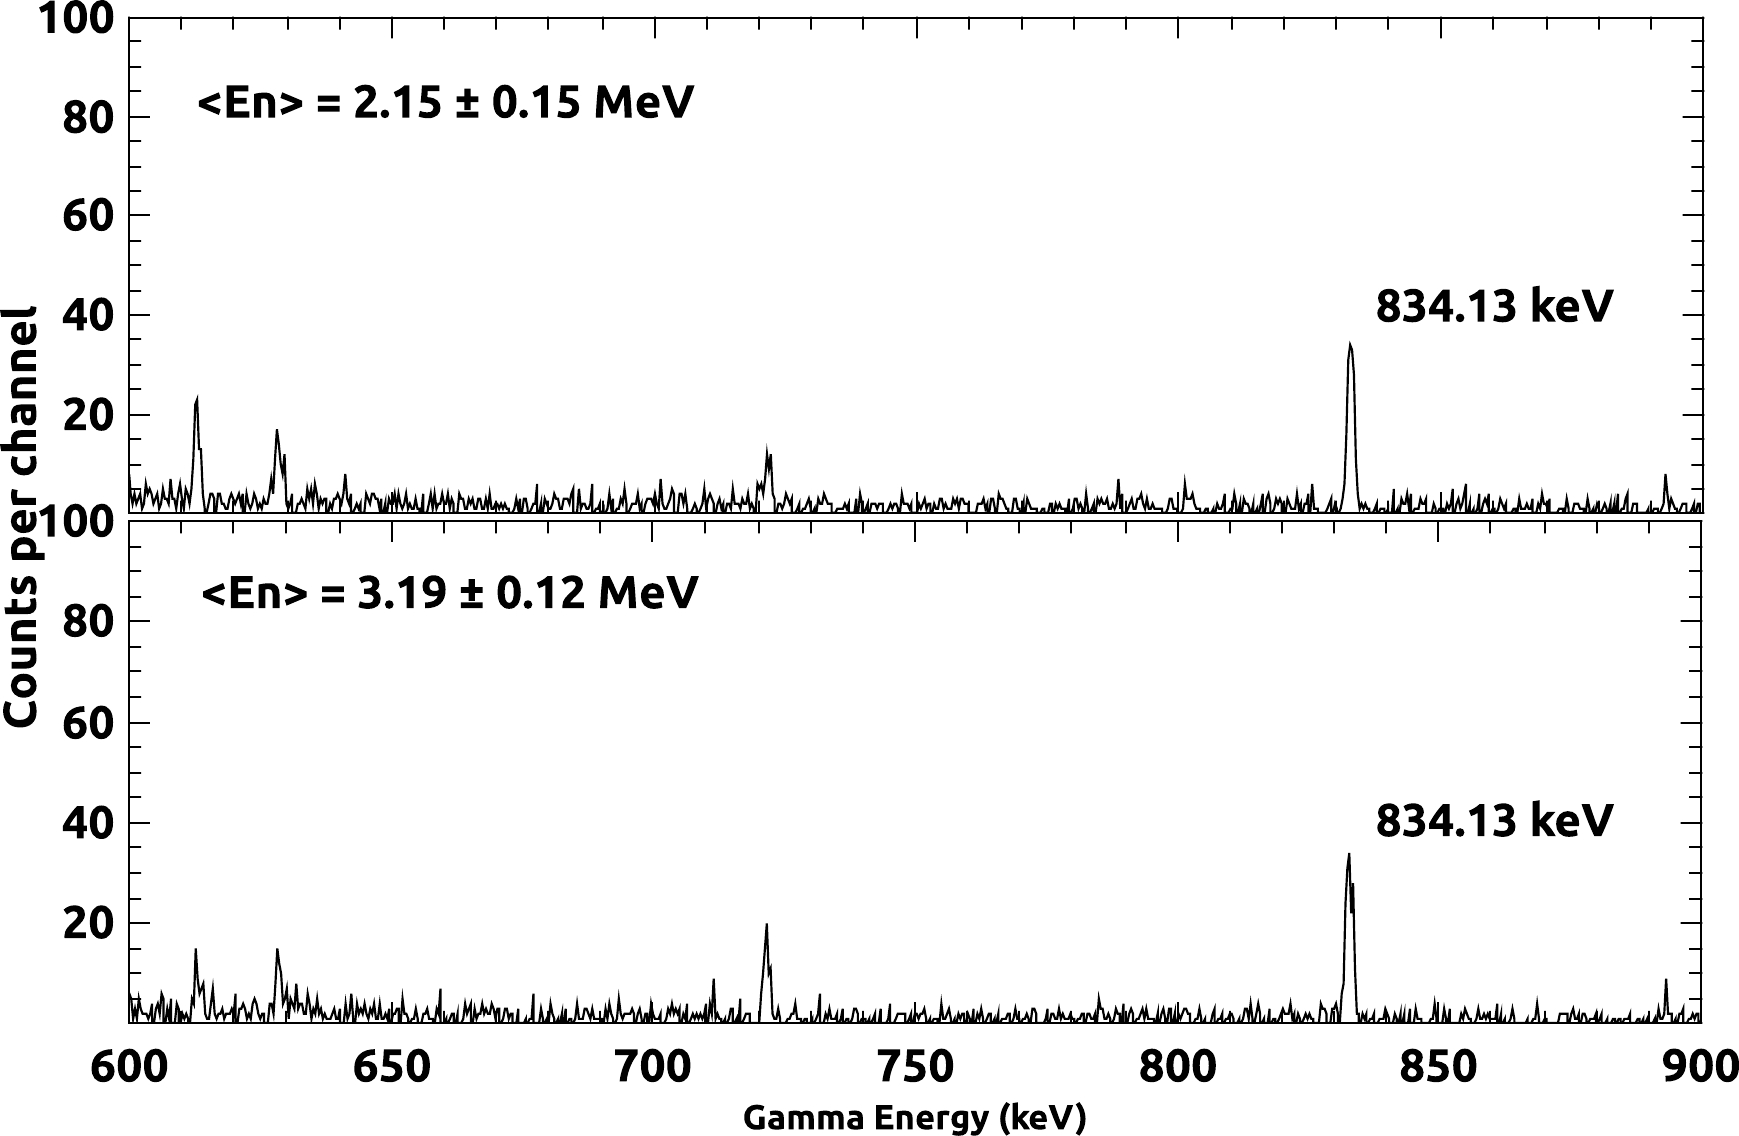
Figure 2. γ-ray spectra of the irradiated Ga samples: (i)
$< E_{n} > =2.15 \pm 0.15$ MeV; (ii)$< E_{n} > =3.19 \pm 0.12$ MeV.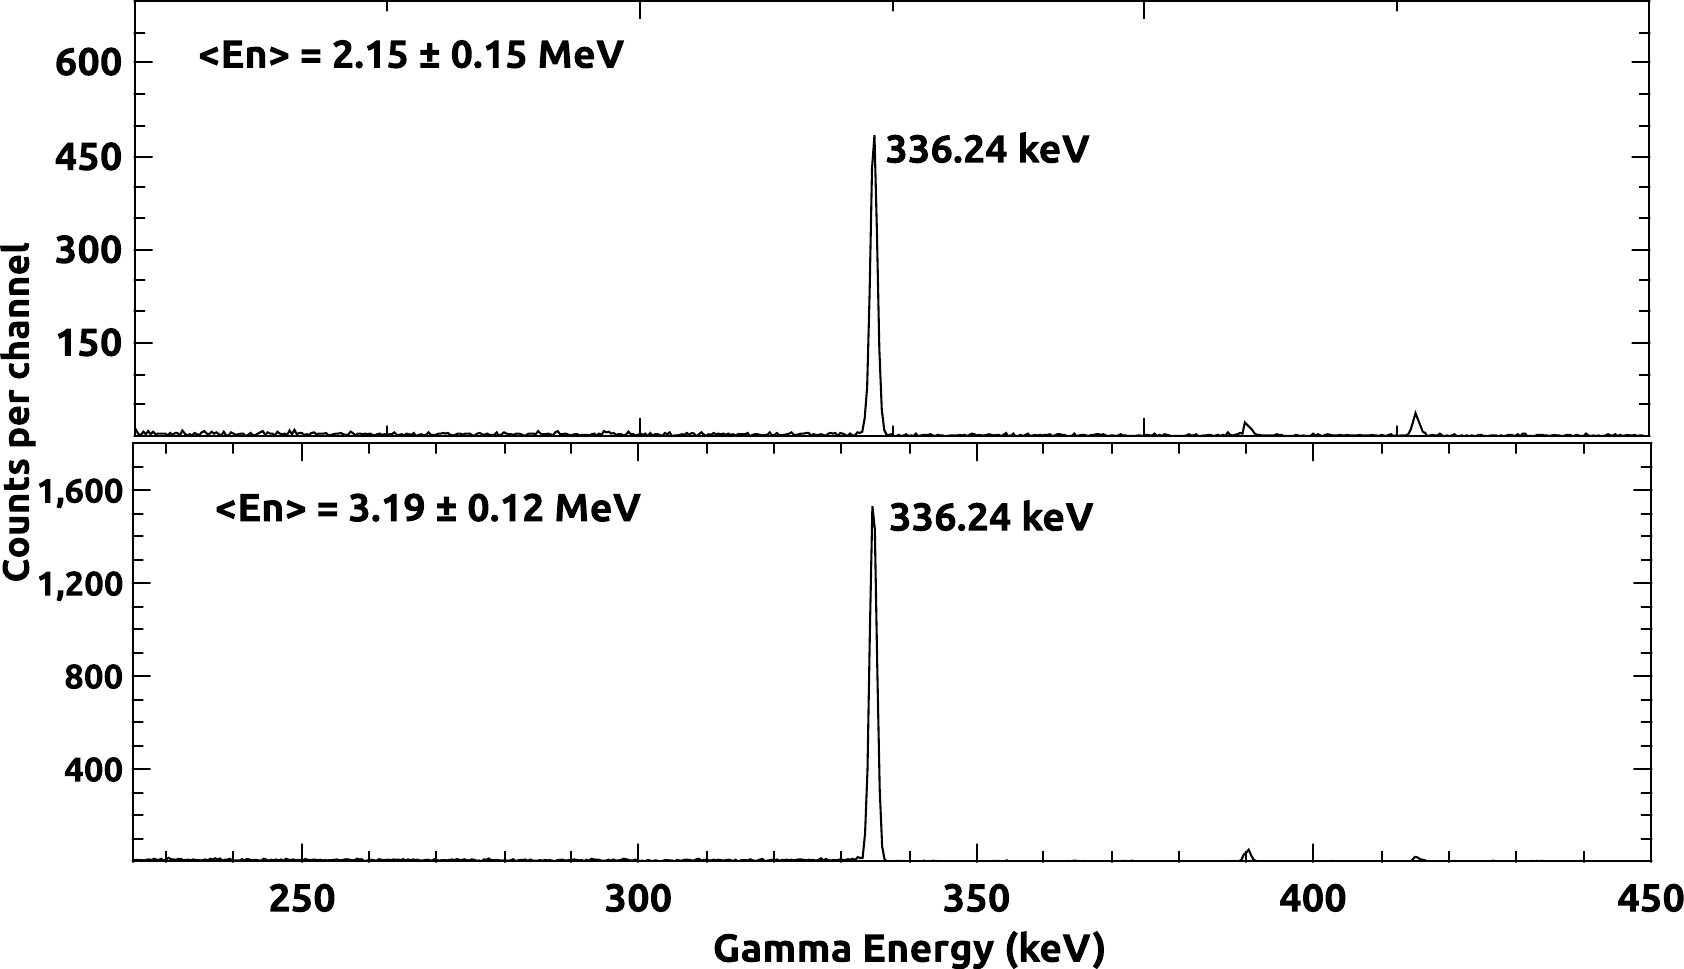
Figure 3. γ-ray spectra of the irradiated In samples: (i)
$ <E_{n}> = 2.15 \pm 0.15$ MeV; (ii)$ <E_{n}> = 3.19 \pm 0.12$ MeV.The efficiency of the HPGe detector was calibrated using a reference
$ ^{152} $ Eu point source with known activity N$ _{0} $ = 6659.21$ \pm $ 81.60 Bq and a half-life of 13.517$ \pm $ 0.009 years as of 01-10-1999 (date of manufacture). The detector efficiency for the point source was calculated using$ \begin{equation} \varepsilon_{p} = \left[\frac{A}{N_{0}I_{\gamma}{\rm e}^{-{\lambda}t}\Delta{t}}\right]\times K_{c} \end{equation}, $

(2) where A represents the number of γ-rays for a γ-ray energy of interest produced from the
$ ^{152} $ Eu source with absolute intensity I$ _{\gamma} $ in the counting period (Δt = 1358 sec). The letter t denotes the period between the production date and the date of counting of the source. To achieve a high count rate, the irradiated sample was placed very close to the detector absorber, at a distance of 2 mm. However, this introduces the γ-ray coincidence summing effect. In order to correct the coincidence-summing effect, the correction factor$ K_{c} $ was calculated using the Monte Carlo simulation code EFFTRAN [21, 22]. Since the activated sample has a finite area, the efficiency calculated for the point-source geometry ($ \varepsilon_{p} $ ) was transferred to the efficiency for the sample geometry (ε) using the EFFTRAN code. The measured efficiencies and fitted efficiency curve are presented in Fig. 4. The detector efficiencies for the characteristic γ-ray energy of the residue product nuclide from the sample and monitor reactions were calculated by interpolating the point-wise efficiencies ($ E_{\gamma} $ ) using the exponential function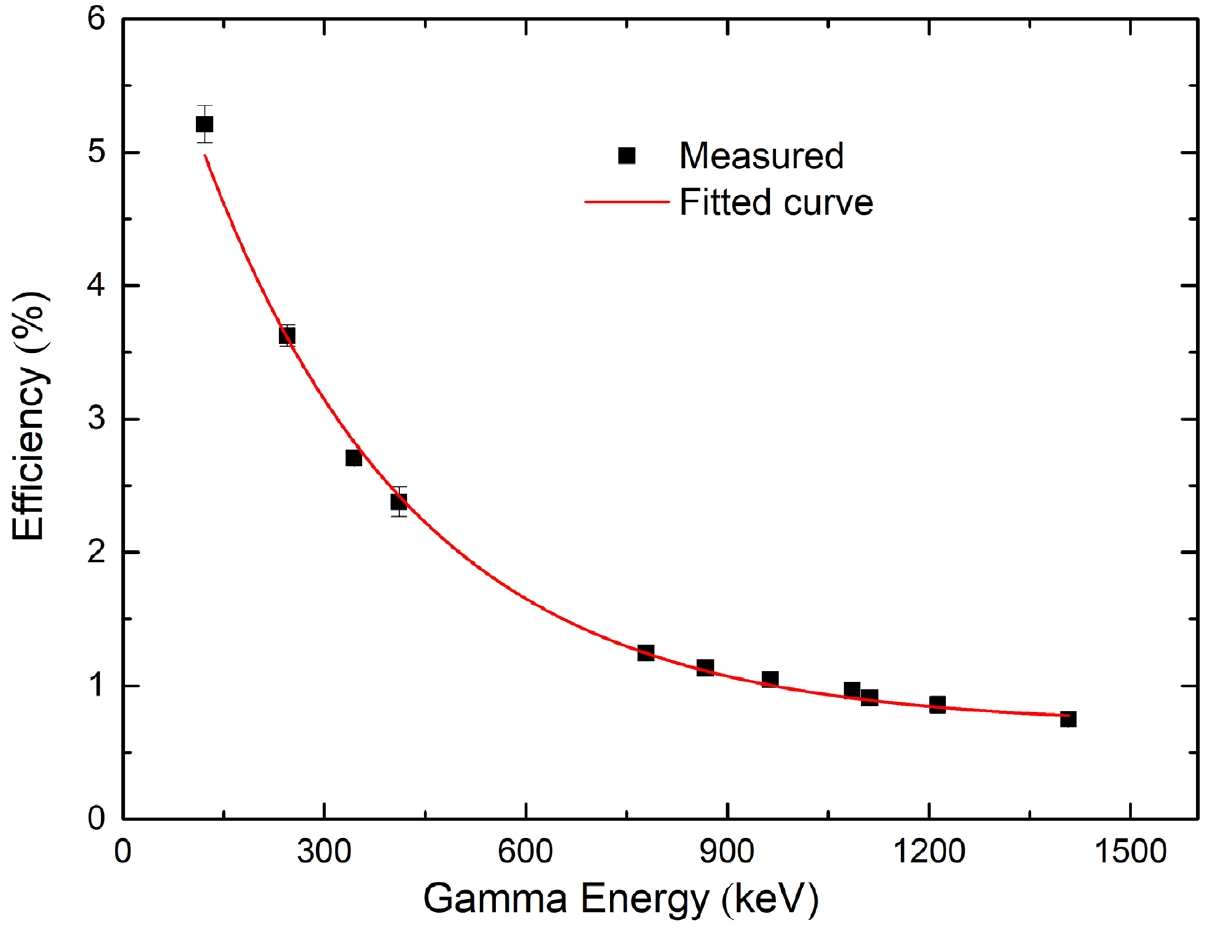
Figure 4. (color online) HPGe detector efficiency data points and its fitted curve.
$ \begin{equation} \varepsilon(E_{\gamma}) = \varepsilon_{o}{\rm exp}({-E_{\gamma}/E_{0}}) + \varepsilon_{c} \end{equation}. $

(3) The three parameters
$ \varepsilon_{c} $ ,$ \varepsilon_{o} $ , and$ E_{0} $ were calculated by fitting the aforementioned function to the observed detection efficiency (ε) data points with their uncertainties propagated from different attributes such as ΔN$ _{0} $ , Δλ, ΔC, and ΔIγ. Table 4 lists the fitting parameter values, along with their uncertainties and correlation coefficients, which were used to calculate the covariance matrix between the interpolated detection efficiencies. Equation (4) of Ref. [23] was used to calculate the covariance matrix between the sample and monitor efficiencies. Table 5 presents the detection efficiencies of the distinctive γ-ray energies of the sample and monitor reactions, along with their uncertainties and covariance matrix.Parameter Value Uncertainty Correlation matrix $ \varepsilon_{c} $ 

0.701 0.032 1.000 $ \varepsilon_{0} $ 

6.27 0.26 0.530 1.000 E $ _{0} $ /keV

318 16 −0.838 −0.827 1.000 Table 4. Parameter values of the efficiency (ε) fitting curve, along with the uncertainty and correlation coefficients.
Reaction $ E_{\gamma} $ /keV

Efficiency Covariance matrix $ ^{71} $ Ga(

$ n,\gamma $ )

$ ^{72} $ Ga

834.13 1.16 ± 0.02 0.0005 $ ^{115} $ In(

$n,n'$ )

$ ^{115} $ In

$ ^{m} $ 

336.24 2.88 ± 0.05 0.0005 0.0021 Table 5. Interpolated efficiencies of the detector with their uncertainties and covariance matrix.
-
The activation cross section of the
$ ^{71} $ Ga($n, \gamma $ )$ ^{72} $ Ga reaction at the neutron spectrum averaged energy was determined using the formula$ \begin{equation} <\sigma_{s}> = <\sigma_{m}> \eta \frac{A_{s}\lambda_{s}a_{m}N_{m}I_{\gamma(m)}f_{m}}{A_{m}\lambda_{m}a_{s}N_{s}I_{\gamma(s)}f_{s}} \times \left[\frac{C_{{\rm attn}.(s)}\times N_{{\rm low}(s)}}{C_{{\rm attn}.(m)}\times N_{{\rm low}(m)}}\right] \end{equation}, $

(4) where
$ <\sigma_{m}> $ represents the spectrum averaged monitor cross section of the$ ^{115} $ In($n,n'$ )$ ^{115} $ In$ ^{m} $ reaction, η represents the ratio of the monitor efficiency to the sample efficiency at the characteristic γ-ray of the product nuclide, A represents the photo-peak count of the characteristic γ-ray of the product nuclide having absolute intensity$ I_\gamma $ , λ is the decay constant, a represents the isotopic abundance of the target nuclei, N represents the number of atoms, and the timing factor f of the sample and monitor reaction is given by$ \begin{equation} f = (1-{\rm e}^{-{\lambda}t_{\rm irra}}){{\rm e}^{-{\lambda}t_{\rm cool}}}(1-{\rm e}^{-{\lambda}t_{\rm count}}) \end{equation}, $

(5) where
$t_{\rm irra}$ ,$t_{\rm cool}$ , and$t_{\rm count}$ represent the irradiation, cooling, and counting time, respectively. For precise estimation of the measured cross section, the correction factors with respect to the gamma-ray attenuation ($C_{\rm attn}$ ) and low-energy background neutron contributions ($N_{\rm low}$ ) are taken care of in the present work, and their values are presented in Table 6.Sample $ E_{\gamma} $ /keV

$C_{\rm attn}$ 

Proton Energy /MeV $N_{\rm low}$ 

Gallium 834.13 1.0187 4.00 ± 0.02 0.87 5.00 ± 0.02 0.94 Indium 336.24 1.0264 4.00 ± 0.02 0.92 5.00 ± 0.02 0.95 Table 6. Gamma ray self attenuation correction factor (
$C_{\rm attn}$ ) at a given γ-ray energy and low energy neutron correction factor ($N_{\rm low}$ ) at each incident proton energy. -
As the proton energies used in the present work are above the reaction threshold energy of the first excited state of
$ ^{7} $ Be, the neutrons produced by the$ ^{7} $ Li($ p,n_{0} $ )$ ^{7} $ Be reaction are contaminated by the second group of low energy background neutrons produced by the$ ^{7} $ Li($ p,n_{1} $ )$ ^{7} $ Be$ ^{*} $ reaction. Hence, the subtraction of these background neutron contributions is essential for the determination of the neutron induced reaction cross sections, and correction has been made by calculating the correction factor using the equation$ N_{\rm low} = 1 - \frac{\displaystyle\int^{E_{\rm high}}_{E_{\rm low}}\Phi_{1}(E)(\sigma_{x}(E)){\rm d}E}{\displaystyle\int^{E_{\rm high}}_{E_{\rm low}}\Phi(E)(\sigma_{x}(E)){\rm d}E}, $

(6) where
$ \Phi_{1}(E) $ represents the ($ p,n_{1} $ ) neutron flux energy spectrum calculated via the EPEN code and$ \Phi(E) $ =$ \Phi_{0}(E) $ +$ \Phi_{1}(E) $ and$ \sigma_{x}(E) $ represent the$ ^{71} $ Ga($n, \gamma $ )$ ^{72} $ Ga cross section taken from ENDF/B-VIII.0 [7] and the$ ^{115} $ In ($n,n'$ )$ ^{115} $ In$ ^{m} $ cross section taken from the IRDFF-1.05 library [15]. The obtained correction factors for the two energies are given in Table 6. -
In γ spectrometric analysis, the correction factor for self attenuation effcet due to the interaction of γ-rays within the samples has to be considered; hence, it is taken care of in the present work. The correction factor for the self attenuation of the γ-ray flux passing through a sample of thickness (d) having density (ρ) with mass attenuation coefficient (
$ \mu_{m} $ ) was determined using the formula$ \begin{equation} C_{\rm attn.}=\frac{\mu_{m}\rho d }{1-{\rm exp}(-\mu_{m}\rho d )} \end{equation}, $

(7) where (
$ \mu_{m} $ ) is calculated using XMuDat version 1.0.1 [24] and the obtained correction factors for γ-ray self attenuation are given in Table 6. Details regarding these correction factors were provided in our earlier reports [12, 23, 25, 26]. -
The neutron flux obtained from the
$ ^{7} $ Li(p,n)$ ^{7} $ Be reaction is not monoenergetic (Figs. 1 (a) and (b). Hence, the reference cross section was obtained by folding the IRDFF$ - $ 1.05 [15] monitor cross section$ \sigma_{m}(E) $ with the ($ p,n_{0} $ ) neutron flux energy spectrum obtained from EPEN.The IRDFF-1.05 library also includes information on uncertainties and correlation matrices for different neutron energy groups, which are used to propagate the uncertainty and obtain the correlation coefficient between averaged monitor cross sections for spectrum averaged neutron energies.
Using Eq. (6), the neutron fluxes
$ \Phi_{i,j} $ obtained from EPEN were defined into group-wise neutron fluxes similar to the group-wise correlation matrix information of$ \sigma_{m}(E) $ provided in the IRDFF$ - $ 1.05 library to quantify the uncertainties and correlation coefficients between the monitor cross sections at the two neutron energies:$ \begin{equation} \Phi_{i,j} = \int_{Ej,{\rm min}}^{Ej,{\rm max}}\Phi_{i}(E){\rm d}E \end{equation}. $

(8) Equation (6) satisfies the condition
$ \sum_{j}\Phi_{i,j} $ = 1 for the ($ p,n_{0} $ ) neutron flux spectrum averaged neutron energies 2.15$ \pm $ 0.15 and 3.19$ \pm $ 0.12 MeV, where i is defined as 1 and 2 for$ <E_{n}> $ = 2.15$ \pm $ 0.15 and 3.19$ \pm $ 0.12 MeV, respectively. In the IRDFF$ - $ 1.05 library, there are j energy groups specified by the energy group boundaries for each i.$E _{j,{\rm min}}$ and$E _{j,{\rm max}}$ are used to represent the lower and higher bounds of the$j ^{th} $ energy group, respectively.The group-wise results for the spectrum averaged neutron energy flux and the averaged monitor cross sections, along with their uncertainties and correlation coefficients, are given in Table 7, where j = 1
$ - $ 3 and 4$ - $ 5 groups are defined for$ <E_{n}> $ = 2.15$ \pm $ 0.15 and 3.19$ \pm $ 0.12 MeV, respectively.i j ${E} _{j,{\rm min}} \;{\rm{/MeV} }$ 

${E}_{j,{\rm max}}\;{\rm{/MeV} }$ 

$ \phi_{i,j}/\sum\phi_{i,j} $ 

$< \sigma_{j} > \;{\rm{/mb} }$ 

$ \bigtriangleup \sigma_{j} $ (

$ \% $ )

Correlation coefficient Cor ( $ \sigma_{j},\sigma_{l}) $ 

1.800 2.000 2.200 2.800 3.000 1 1 1.800 2.000 0.051 254.213 2.679 1.000 2 2.000 2.200 0.584 295.404 2.632 0.833 1.000 3 2.200 2.400 0.366 325.907 2.625 0.494 0.856 1.000 2 4 2.800 3.000 0.060 343.626 2.460 0.315 0.225 0.322 1.000 5 3.000 3.391 0.940 369.647 2.173 0.432 0.347 0.263 0.788 1.000 Table 7. Group-wise neutron monitor cross sections (
$ \sigma_{j} $ ) with their fractional uncertainties and correlation coefficients retrieved from the IRDFF-1.05 library along with the group-wise fractional neutron flux calculated via the EPEN code.Using the covariance matrix given in the IRDFF-1.05 library, the covariance matrix for the present spectrum averaged monitor cross sections is propagated using Eq. (45) of Ref. [4]. The covariance matrix is then used to generate the correlation coefficients between the monitor cross sections. The obtained spectrum averaged monitor cross sections
$ <\sigma_{m}> $ at each spectrum averaged neutron energy and their corresponding uncertainties and correlation coefficients are presented in Table 8. These correlation coefficients are further used to propagate the correlation matrix between$ ^{71} $ Ga($n, \gamma $ )$ ^{72} $ Ga reaction cross sections at different energies.Reaction $< E_{n} > \;{\rm{/MeV} }$ 

Cross section $<\sigma_{m}> $ /mb

$ \bigtriangleup<\sigma_{m}> $ (%)

Cor( $<\sigma_{m}>_{i},<\sigma_{m}>_{j}) $ 

$ ^{115} $ In(

$n,n'$ )

$ ^{115} $ In

$ ^{m} $ 

2.15 ± 0.15 303.40 ± 7.99 2.63 1.00 3.19 ± 0.12 337.39 ± 8.03 2.38 0.29 1.00 Table 8. Spectrum averaged monitor cross sections along with the uncertainties and correlation coefficients.
-
Many fields of experimental nuclear research have become extremely quantitative, and nuclear data is one of these experimental quantitative sciences, with applications ranging from reactor design to nuclear medicine. As a result, in studies that yield such quantitative information and have such applied influence, researchers must adequately perform the experiment and report the experimental data in detail, including the experimental uncertainties and covariance matrix. This extensive information aids the assessor in precisely and correctly evaluating the nuclear data.
In this study, the
$ ^{71} $ Ga($n, \gamma $ )$ ^{72} $ Ga reaction cross section was measured at two different spectrum averaged neutron energies. Both the irradiated samples at the two energies were counted using the same detection system; hence, the measured reaction cross sections were correlated with the detector efficiency, as shown in Table 5. For the calculation of the uncertainty in the measured cross sections and to generate the covariance matrix, numerous additional factors with certain uncertainties were taken into account in addition to the counts from the recorded γ-ray spectra.The fractional uncertainty from various attributes, such as the timing factor (f
$ _{s} $ , f$ _{m} $ ), efficiency ratio (η), γ-ray intensity of the sample and monitor ($ I_{\gamma(s)} $ ,$ I_{\gamma(m)} $ ), spectrum averaged monitor cross section ($ <\sigma_{m}> $ ), isotopic abundance of the sample and monitor nuclei ($ a_{s} $ ,$ a_{m} $ ), number of atoms ($ N_{s} $ ,$ N_{m} $ ), and γ-ray photo-peak counts ($ A_{s} $ ,$ A_{m} $ ), were also used to propagate the uncertainty in the measured cross sections, which are summarized in Table 9. The fractional uncertainty in the timing factor (f) was calculated by following the methodology given in Sec 4.1.3 of Ref. [4], and the fractional uncertainty in efficiency ratio ($ {\eta} $ ) was calculated by using the formulaParameter (x) Neutron energy /MeV Correlation coefficient
(Cor($ \bigtriangleup{x_i} $ ,

$ \bigtriangleup{x_j} $ )

2.15 ± 0.15 ( $ \bigtriangleup{x_i} $ )

3.19 ± 0.12 ( $ \bigtriangleup{x_j} $ )

$f _{s} $ 

0.10 0.06 1 $f _{m} $ 

0.04 0.01 1 η 1.82 1.82 1 $I _{s} $ 

0.08 0.08 1 $I _{m} $ 

0.22 0.22 1 $ \sigma_{m} $ 

2.63 2.38 0.29 $ a_{m} $ 

0.05 0.05 1 $ a_{s} $ 

0.02 0.02 1 $ N_{s} $ 

0.07 0.07 0 $N _{m} $ 

0.05 0.04 0 $A _{s} $ 

7.96 8.11 0 $A _{m} $ 

2.38 1.33 0 Total error 8.90 8.76 0.26 Table 9. Fractional uncertainties (%) and correlation coefficients of the parameters associated with the
$ ^{71} $ Ga($n, \gamma $ )$ ^{72} $ Ga reaction cross section measurement at different spectrum averaged neutron energies.$ \begin{equation} (\bigtriangleup\eta/\eta)^{2}=\left[(\bigtriangleup\varepsilon_{s}/\varepsilon_{s})^{2} + (\bigtriangleup\varepsilon_{m}/\varepsilon_{m})^{2} - 2{\rm Cov}(\varepsilon_{m},\varepsilon_{s})/(\varepsilon_{s}\times \varepsilon_{m})\right] \end{equation}, $

(9) where
$ {\varepsilon_{s}} $ and$ {\varepsilon_{m}} $ represent the efficiency values of the sample and monitor, respectively. The values of the input parameters of the above equation are given in Table 5. The obtained detector efficiency ratio ($ {\eta} $ ) and its uncertainty is 2.4902$ \pm $ 0.0454.Table 9 presents the fractional uncertainties and correlation coefficients between various attributes associated with the measured cross sections.
$ \bigtriangleup{x_i} $ and$ \bigtriangleup{x_j} $ are specified for energies of 2.15$ \pm $ 0.15 and 3.19$ \pm $ 0.12 MeV respectively. Uncorrelated (Cor($ x_{1} $ ,$ x_{2} $ ) = 0) and completely correlated (Cor($ x_{1} $ ,$ x_{2} $ ) = 1) coefficients are used to describe the correlation coefficient between two parameters ($ x_{1} $ ,$ x_{2} $ ) [4, 27, 28].According to the fractional uncertainties and correlation coefficients presented in Table 9, the matrices of 12 subsets (or attributes) were combined using the following equation to propagate the total uncertainty and covariance matrix between two reaction cross sections, e.g., (
$ \sigma_{s_i},\sigma_{s_j} $ ).$ \begin{equation} {\rm Cov}(\sigma_{s_i},\sigma_{s_j}) = \sum\limits^{}_{i} \sum\limits^{}_{j}\bigtriangleup{x_i}\times {\rm Cor}(\bigtriangleup{x_i},\bigtriangleup{x_j}) \times \bigtriangleup{x_j} \end{equation}. $

(10) Using Eq. (10), a [2
$ \times $ 2] covariance matrix was produced, which was used to calculate the overall uncertainty in the measured cross section [4, 23]. Finally, the correlation coefficients between the measured cross sections at the two incident spectrum averaged neutron energies were obtained using Eq. (11):$ \begin{equation} {\rm Cor}(\sigma_{s_i},\sigma_{s_j})=\frac{{\rm Cov}(\sigma_{s_i},\sigma_{s_j})}{(\bigtriangleup\sigma_{s_i}) \times (\bigtriangleup\sigma_{s_j})}. \end{equation} $

(11) -
The theoretical nuclear model codes TALYS-1.95 and EMPIRE
$ - $ 3.2 were used for the prediction of the excitation function of the$ ^{71} $ Ga($n, \gamma $ )$ ^{72} $ Ga reaction at neutron energies up to 20 MeV [5, 6]. The TALYS$ - $ 1.95 code incorporates the best parameter library containing the parameters for a number of nuclei, which provide the best fit to the experimental data of different reaction channels. With the “best y” option in the input file, the TALYS code uses the adjusted parameters, such as the optical model and level density, which are stored in the code. For the present reaction, under the “best y” option, the level density model used is the Back-shifted Fermi gas model (ldmodel 2), and the normalization factor for the average radiative width$ \Gamma_{\gamma} $ , gamgamadjust 31 72 1.20, was used to scale the (n,γ) cross section. The optical model parameters used in the calculations were obtained using a local potential given by A. J. Koning and J. P. Delaroche [29]. The main contribution to the reaction cross section is from the compound nucleus in the defined energy range, and this was calculated in the code using the Hauser-Feshbach statistical model with width model correction using the Moldauer model [30, 31]. In the case of EMPIRE, the estimation of compound nucleus contribution, the parameters such as optical potentials, level density parameters, and γ-ray strength functions were done with the OM potential parameters by A. J. Koning and J. P. Delaroche [29] stored in the code, LEVDEN 3, define for RIPL-3 microscopic HFB level densities [32] and GSTRFN 1, which define for the MLO1 modified Lorentzian version 1 (Plujko, RIPL-2) model as a gamma strength function [33], respectively. The input parameters for nuclear models used for (n,γ) cross section calculations in TALYS and EMPIRE are retrieved in the code from the RIPL-3 database [34]. -
Table 10 presents the cross section values of the
$ ^{71} $ Ga($n, \gamma $ )$ ^{72} $ Ga reaction measured at spectrum averaged neutron energies 2.15$ \pm $ 0.15 and 3.19$ \pm $ 0.12 MeV as well as their uncertainties and correlation coefficients. The total uncertainty found in the measured cross sections is less than 9%. Figure 5 shows a comparison between the cross section values of the$ ^{71} $ Ga($n, \gamma $ )$ ^{72} $ Ga reaction measured in this work and the existing experimental data available in the EXFOR database [35–46], as well as the data of EMPIRE-3.2, TALYS-1.95, ENDF/B-VIII.0, and JEFF-3.1/A.Reaction Neutron energy $<E_{n}> $ /MeV

Cross section /mb ( $ \sigma \pm \bigtriangleup\sigma $ )

Correlation coefficient Cor ( $ \sigma_{s_i},\sigma_{s_j} $ )

$ ^{71} $ Ga(

$n, \gamma $ )

$ ^{72} $ Ga

2.15 ± 0.15 9.14 ± 0.81 1.00 3.19 ± 0.12 5.74 ± 0.50 0.26 1.00 Table 10.
$ ^{71} $ Ga($n, \gamma $ )$ ^{72} $ Ga reaction cross sections measured in the present work, along with their uncertainties and correlation coefficients.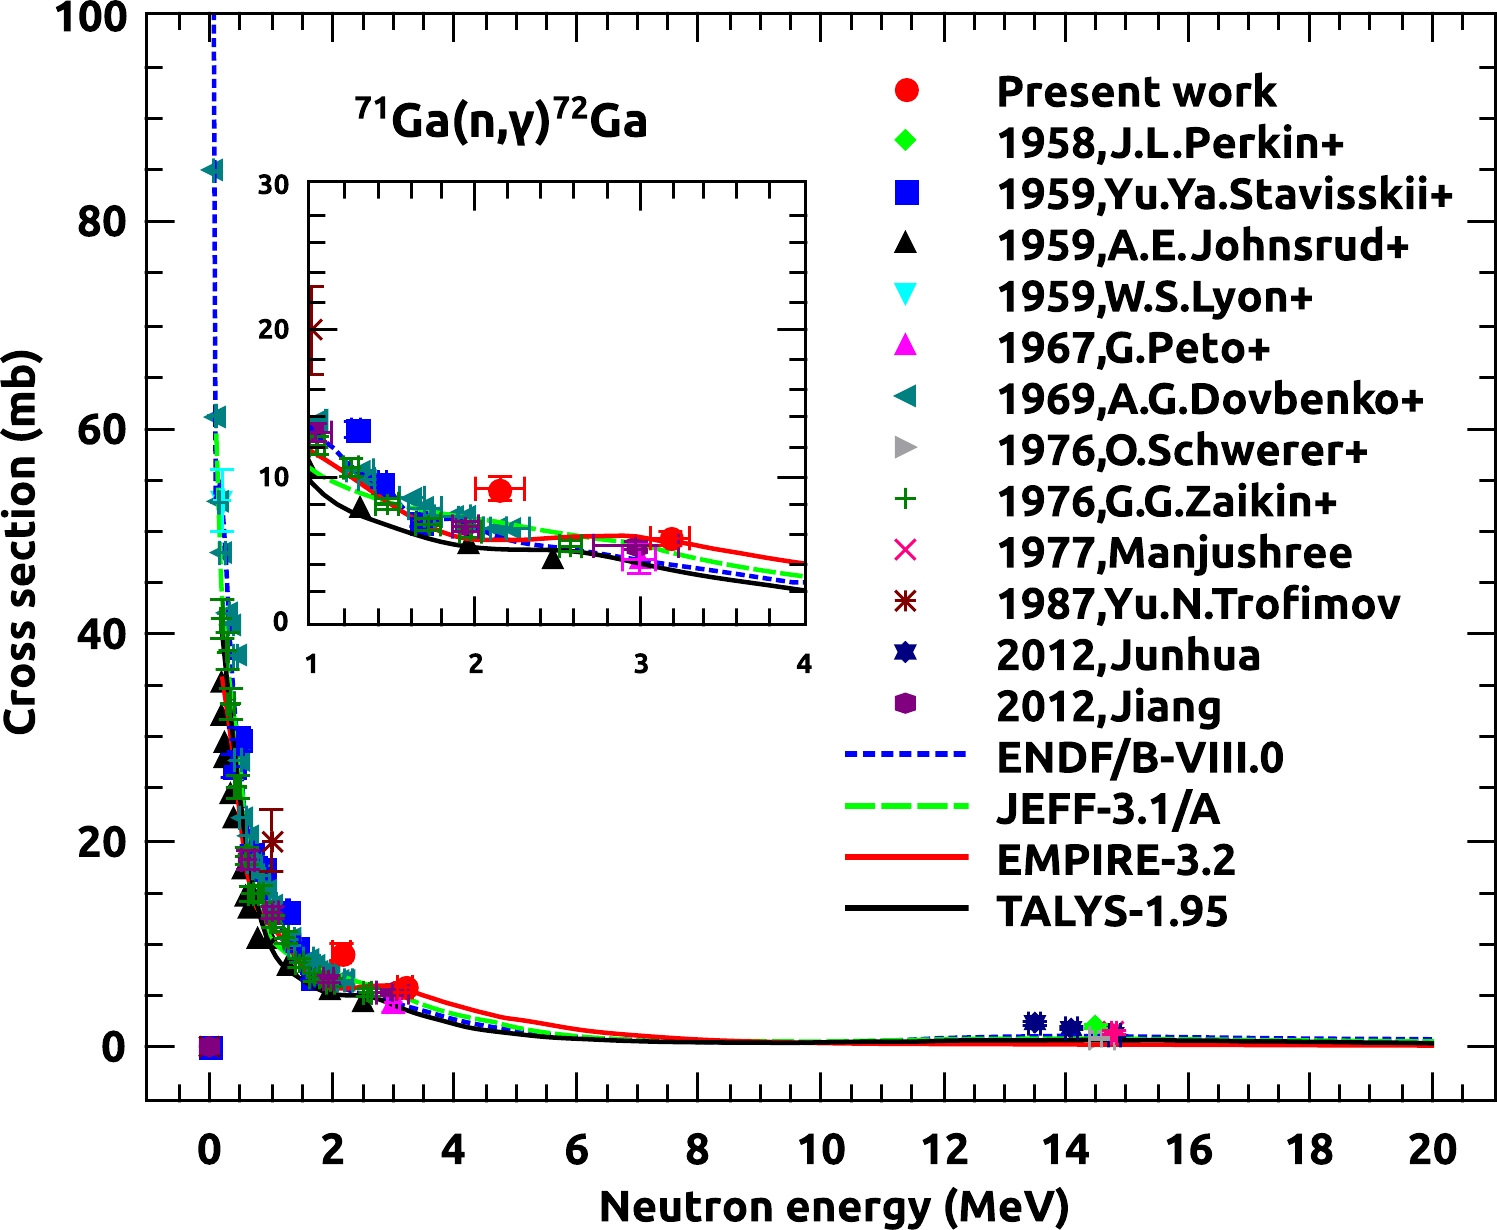
Most of the available data were reported a few decades ago, resulting in discrepancies in the monitor cross sections and decay data. Hence, to maintain accuracy in the comparison, the reported values are normalized with the latest decay data and evaluated files adopted in the present work, wherever possible. The present experimental results are also compared with the evaluated nuclear data files ENDF/B-VIII.0 and JEFF-3.1/A and the nuclear reaction model codes TALYS
$ - $ 1.95 and EMPIRE-3.2. The comparison results indicate that the cross section at 3.19$ \pm $ 0.12 MeV agrees with EMPIRE-3.2 and JEFF-3.1/A and slightly overestimates the ENDF/B-VIII.0 and TALYS$ - $ 1.95 results, while the cross section at 2.15$ \pm $ 0.15 MeV is slightly higher than the literature data, evaluated data, and theoretically predicted results, as shown in the enlarged view of Fig. 5. The cross section values are reported with the uncertainties and correlation coefficients between the measured cross sections. In the fast neutron energy region, detailed uncertainty propagation is performed for the first time; hence, these newly reported data will also help in the evaluation process of the covariance matrix in the region for the$ ^{71} $ Ga($n, \gamma $ )$ ^{72} $ Ga reaction cross sections. It is also worth mentioning that the present experimental cross sections are the results of spectrum averaged neutron energy, whereas the evaluated and theoretically calculated cross sections are for monoenergetic neutrons. -
The cross section of the
$ ^{71} $ Ga($n, \gamma $ )$ ^{72} $ Ga reaction was measured at the spectrum averaged neutron energies 2.15 and 3.19 MeV, and the results are 9.14$ \pm $ 0.81 mb and 5.74$ \pm $ 0.50 mb respectively. The cross section values reported are compared with the data available in literature, theoretical calculations using the TALYS$ - $ 1.95 and EMPIRE-3.2 codes, and evaluated data from ENDF/B-VIII.0 and JEFF-3.1/A. The comparison results indicate that the cross section at 3.19$ \pm $ 0.12 MeV is consistent with the data available at 2.98$ \pm $ 0.26 and 3.0$ \pm $ 0.1 MeV, agrees well with the EMPIRE-3.2 & JEFF-3.1/A data, and slightly overestimates the ENDF/B-VIII.0 and TALYS$ - $ 1.95 data, while the cross section at 2.15$ \pm $ 0.15 MeV is higher than the reported data available in EXFOR, evaluated data, and theoretically predicted results. These newly measured reaction cross section values in the present work are presented with the detailed uncertainties and covariance matrix between the measured cross sections, which is performed for the first time in the fast neutron energy region. -
The authors appreciate the FOTIA facility operators for their support in keeping the accelerator running smoothly during the experiment and also acknowledge the Analytical Chemistry Division, BARC, for their assistance in preparing the samples.
Measurement of neutron capture cross section on 71Ga at 2.15 and 3.19 MeV and uncertainty propagation and covariance analysis
- Received Date: 2022-10-03
- Available Online: 2023-07-15
Abstract: The cross section values of the


 DownLoad: