


 Abstract
 HTML
HTML Reference
 Related
 PDF
PDF


-
Nuclei in the A
$ \approx $ 120 region are well suited for studying the effects of shape-driving properties of different quasiparticle configurations. In this region, the Fermi surface for the protons lies close to the low-Ω h$ _{11/2} $ orbitals, which drives the nucleus toward a prolate shape, whereas for the neutrons, it is situated among the medium-Ω h$ _{11/2} $ orbitals, which induces an oblate deformation [1]. Owing to the conflicting deformation driving properties of protons and neutrons, the nucleus can have a prolate, oblate, or triaxial shape depending on the intrinsic configuration. Additionally, band crossings due to the alignment of h$ _{11/2} $ neutrons as well as protons are expected at low rotational frequencies [2]. The presence of octupole driving h$ _{11/2} $ and d$ _{5/2} $ orbitals near the Fermi surface makes them suitable to exhibit octupole correlation. Octupole correlation in atomic nuclei is due to the interaction between the orbitals of opposite parity having Δj = Δl = 3 near the Fermi level. This situation is found between an intruder orbital and normal parity sub-shell, i.e., for particle number N and/or Z$ \approx $ 34 (g$ _{9/2} \rightarrow $ p$ _{3/2} $ ), 56 (h$ _{11/2} \rightarrow $ d$ _{5/2} $ ), 88 (i$ _{13/2} \rightarrow $ f$ _{7/2} $ ), and 134 (j$ _{15/2} \rightarrow $ g$ _{9/2} $ ) [3, 4]. The nuclei that have their Fermi surface in close proximity to these pairs of orbitals will be particularly susceptible to octupole correlation. Enhanced E1 transitions between alternate-parity bands, parity doublet structures, and highly collective E3 transitions are the experimental fingerprints of octupole correlations. In the A$ \approx $ 120 region, octupole correlations in several isotopes of Xe-Cs-Ba having N$ < $ 70 have been reported [5−7]. Previously, high-spin γ-ray spectroscopy measurements in$ ^{118} $ Xe were reported [8−10], but in almost all the cases, precise data on the polarisation leading to confirmation of parity assignments were missing. In Ref. [10], the issue of octupole collectivity was discussed in relation to the observed interband transitions at 1022 keV (7$ ^{-} \rightarrow $ 6$ ^{+} $ ), 846 keV (9$ ^{-} \rightarrow $ 8$ ^{+} $ ), 726 keV (11$ ^{-} \rightarrow $ 10$ ^{+} $ ), and 924 keV (8$ ^{-} \rightarrow $ 8$ ^{+} $ ); however, the quoted B(E1)values have errors in the range of 4% to 28%. Additionally, in Ref. [10], although the transition at 924 keV (8 $ ^{-} \rightarrow $ 8$ ^{+} $ ), from Band 4 to Band 6, was marked as the E1 transition, the parity assignments of Band 4 (negative parity) were based on systematics. In the present work, the excited states in$ ^{118} $ Xe were reinvestigated with the following objectives: 1) to update the level scheme with inclusion of more γ transition in the non-yrast bands (if any), 2) to fix the parities (especially of Band 4) with polarisation measurements, and 3) to provide more precise data on the octupole collectivity (transition). We also performed triaxial projected shell model (TPSM) calculations to investigate the observed band structures further. -
High spin states in
$ ^{118} $ Xe nuclei were populated via the$ ^{93} $ Nb($ ^{28} $ Si, p2n) fusion-evaporation reaction at a beam energy of 115 MeV. A monoisotopic Nb target of thickness$ \sim $ 0.9 mg/cm$ ^2 $ was rolled on a 9.2 mg/cm$ ^2 $ thick Pb backing foil to form the target [11]. The target was fabricated at the Target Development Laboratory of the Inter-University Accelerator Centre (IUAC), New Delhi [12]. The 115 MeV accelerated beam was provided by the 15 UD pelletron accelerator facility at IUAC [13]. For detecting γ-rays produced in the reaction, the Indian National Gamma Array (INGA) set-up [14] was used. The detectors in the INGA set-up are arranged in five different rings making angles of 32$ ^{\circ} $ , 57$ ^{\circ} $ , 123$ ^{\circ} $ , 148$ ^{\circ} $ (having four clover detectors each), and 90$ ^{\circ} $ (with eight clover detectors) with the beam direction. At the time of the experiment, only 16 clover detectors (three clover detectors at 32$ ^{\circ} $ , one clover detector at 57$ ^{\circ} $ , two clover detectors at 123$ ^{\circ} $ , four clover detectors at 148$ ^{\circ} $ , and six clover detectors at 90$ ^{\circ} $ ) were available; thus, data were acquired with 16 clover detectors only. For the measurement purpose, the resolution of the clover detectors in the INGA set-up was found to be ΔE$ \sim $ 2.2 – 2.5 ($ \pm $ 0.1%) keV (FWHM at 1332 keV). The energy calibration of the clover detectors (up to a level better than 0.1%) has been done with an$ ^{152} $ Eu source following the standard procedure. The data were collected using a CAMAC based high speed distributed analog data acquisition system called CANDLE [15]. Data were collected in the coincidence mode under the condition that at least two clover detectors in the INGA set-up should record γ-rays within the specified time window (coincidence window of 150 ns was set for the real coincidence events). -
Offline data analysis was carried out using the INGAsort [16] and RADWARE [17] software packages. For the analysis, all the detectors were properly gain-matched using the INGAsort software, and the necessary numbers of symmetric and asymmetric matrices were constructed. To determine the spin of an excited state, the multipolarities of the γ-ray transitions were determined via angular correlation analysis by using the directional correlation of oriented states (DCO) ratio [18]. This method is based on the analysis of the anisotropic distribution of the emitted γ-rays, which depends on the multipolarity of the transition. For the DCO ratio, an asymmetric γ-γ coincidence matrix was constructed using coincidence events registered by detectors placed at 90
$ ^{\circ} $ and 148$ ^{\circ} $ with respect to the beam direction. The anisotropic intensity ratio of two mutually coincident gamma-ray transitions can be evaluated using the formula$ R_{\rm DCO} = \frac{I_{\gamma_{1}} ~ {\rm at} ~ 148^\circ ~{\rm gated ~ by}~ \gamma_{2} ~ {\rm at} ~ 90^\circ }{I_{\gamma_{1}} ~ {\rm at}~ 90^\circ ~ {\rm gated ~ by} ~ \gamma_{2} ~ {\rm at} ~ 148^\circ } $

(1) where the numerator denotes the intensity of the γ-ray transition (γ
$ _{1} $ ) at angle θ$ _{1} $ = 148$ ^{\circ} $ gated by the transition of known multipolarity (γ$ _{2} $ ) at angle θ$ _{2} $ = 90$ ^{\circ} $ , and the denominator denotes the intensity of γ$ _{1} $ at 90$ ^{\circ} $ gated by γ$ _{2} $ at 148$ ^{\circ} $ . The DCO ratio depends on the multipolarities of the transition and the geometry of the spectrometer. The R$_{\rm DCO}$ value for stretched γ-ray transitions (γ$ _{1} $ and γ$ _{2} $ ) of the same multipolarity is close to unity. The DCO ratio for pure dipole (quadrupole) transitions gated on stretched quadrupole (dipole) transitions is 0.5 (2.0) in the present work.Definite parities of the excited states have been deduced from the linear polarization asymmetry ratio (A
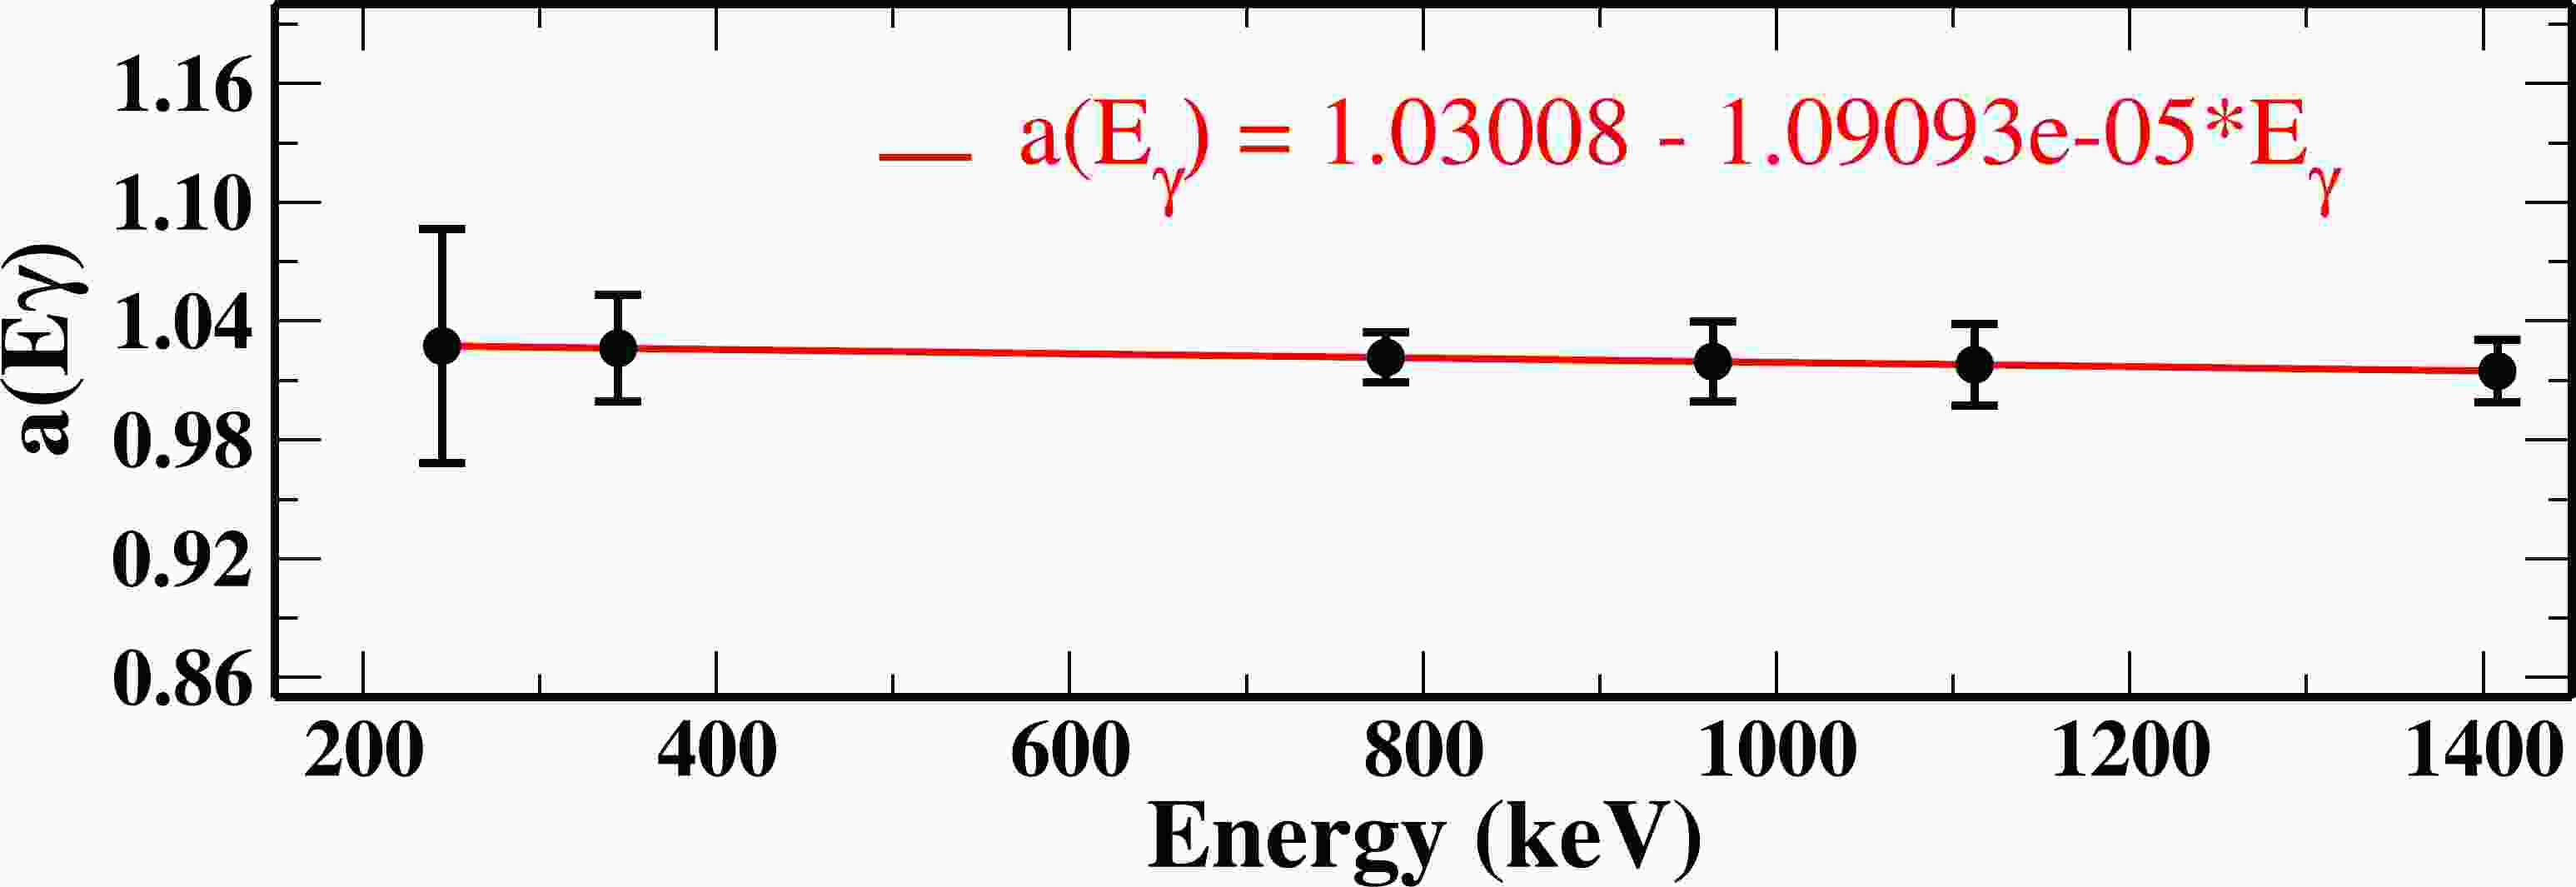
$_{\rm as}$ ) extracted from the parallel and perpendicular Compton scattering of the γ-ray photons inside the Clover detectors, i.e., between the Clover germanium crystals [19]. The measured value of A$_{\rm as}$ provides information about the nature of the γ-ray transition i.e., electric or magnetic. The linear polarization asymmetry ratio (A$_{\rm as}$ ) of the γ-ray transition was calculated using the formula$ A_{\rm as} = \frac{a(E_{\gamma})N_\perp-N_\parallel}{a(E_{\gamma})N_\perp+N_\parallel }, $

(2) where N
$ _\parallel $ and N$ _\perp $ represent the counts for the actual Compton-scattered γ rays in the directions parallel and perpendicular to the reaction plane, respectively. The correction factor a(E$ _\gamma $ ), which was introduced for handling the asymmetry in the response of the segments of the clover detector [20], was estimated using an unpolarized$ ^{152} $ Eu source and is evaluated using the relation$ a(E_{\gamma}) = \frac{N_\parallel}{N_\perp}. $

(3) The energy dependence of a(E
$ _{\gamma} $ ) is obtained using the equation a(E$ _{\gamma} $ ) = a + b*E$ _{\gamma} $ . The fitted plot of a(E$ _{\gamma} $ ) with the value of the coefficients is shown in Fig. 1. A positive value of (A$_{\rm as}$ ) indicates the electric (E) nature of the transition, whereas a negative value indicates the magnetic (M) nature. The low energy limit for the polarization measurement was approximately 200 keV in the present work. The linear polarization analysis of the 676 keV γ ray transition in$ ^{118} $ Xe is shown in Fig. 2.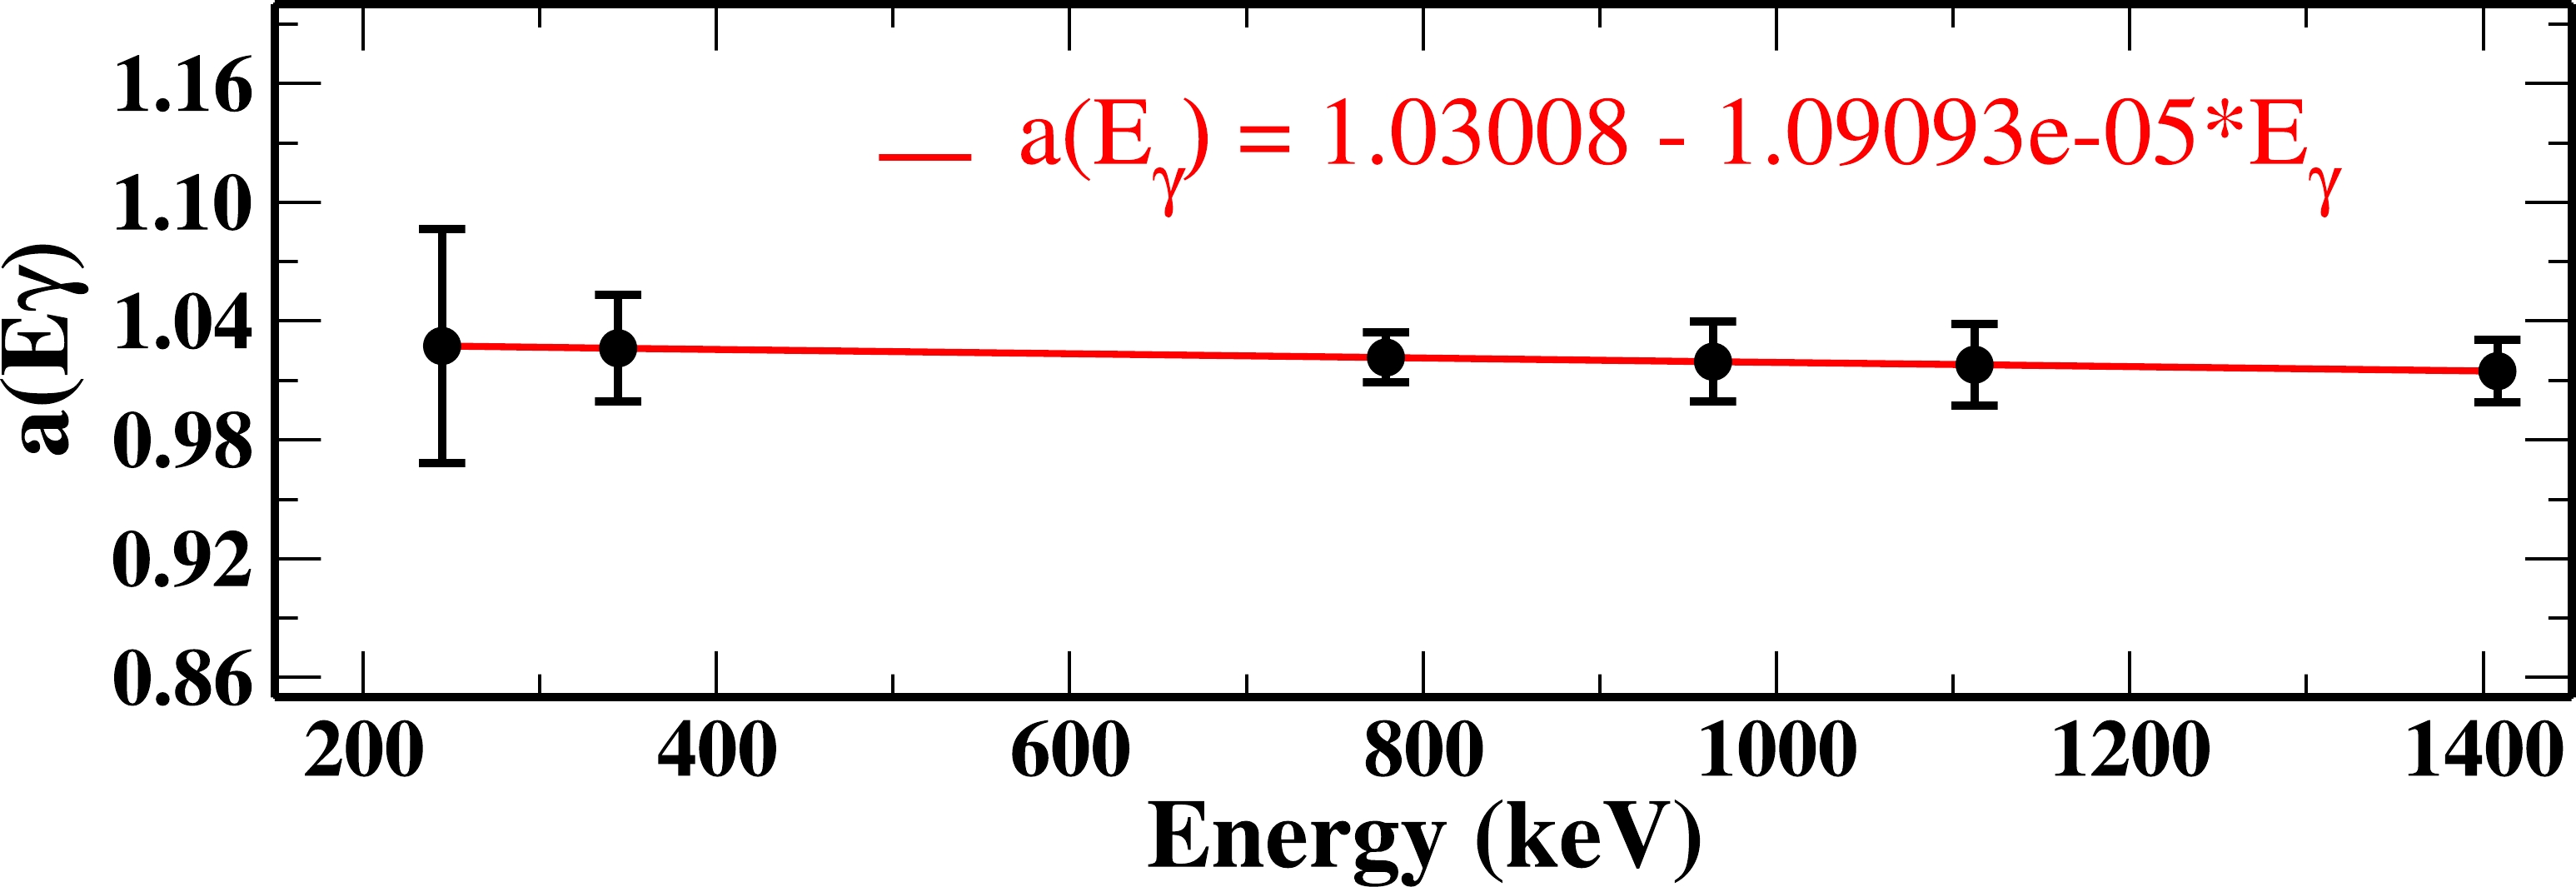
Figure 1. (color online) Plot of the correction factor a(E
$ _{\gamma} $ ) vs. E$ _{\gamma} $ obtained with an unpolarized$ ^{152} $ Eu source. The solid red line represents the linear fit of the data. The errors in the correction factor values are approximately 5%−10%.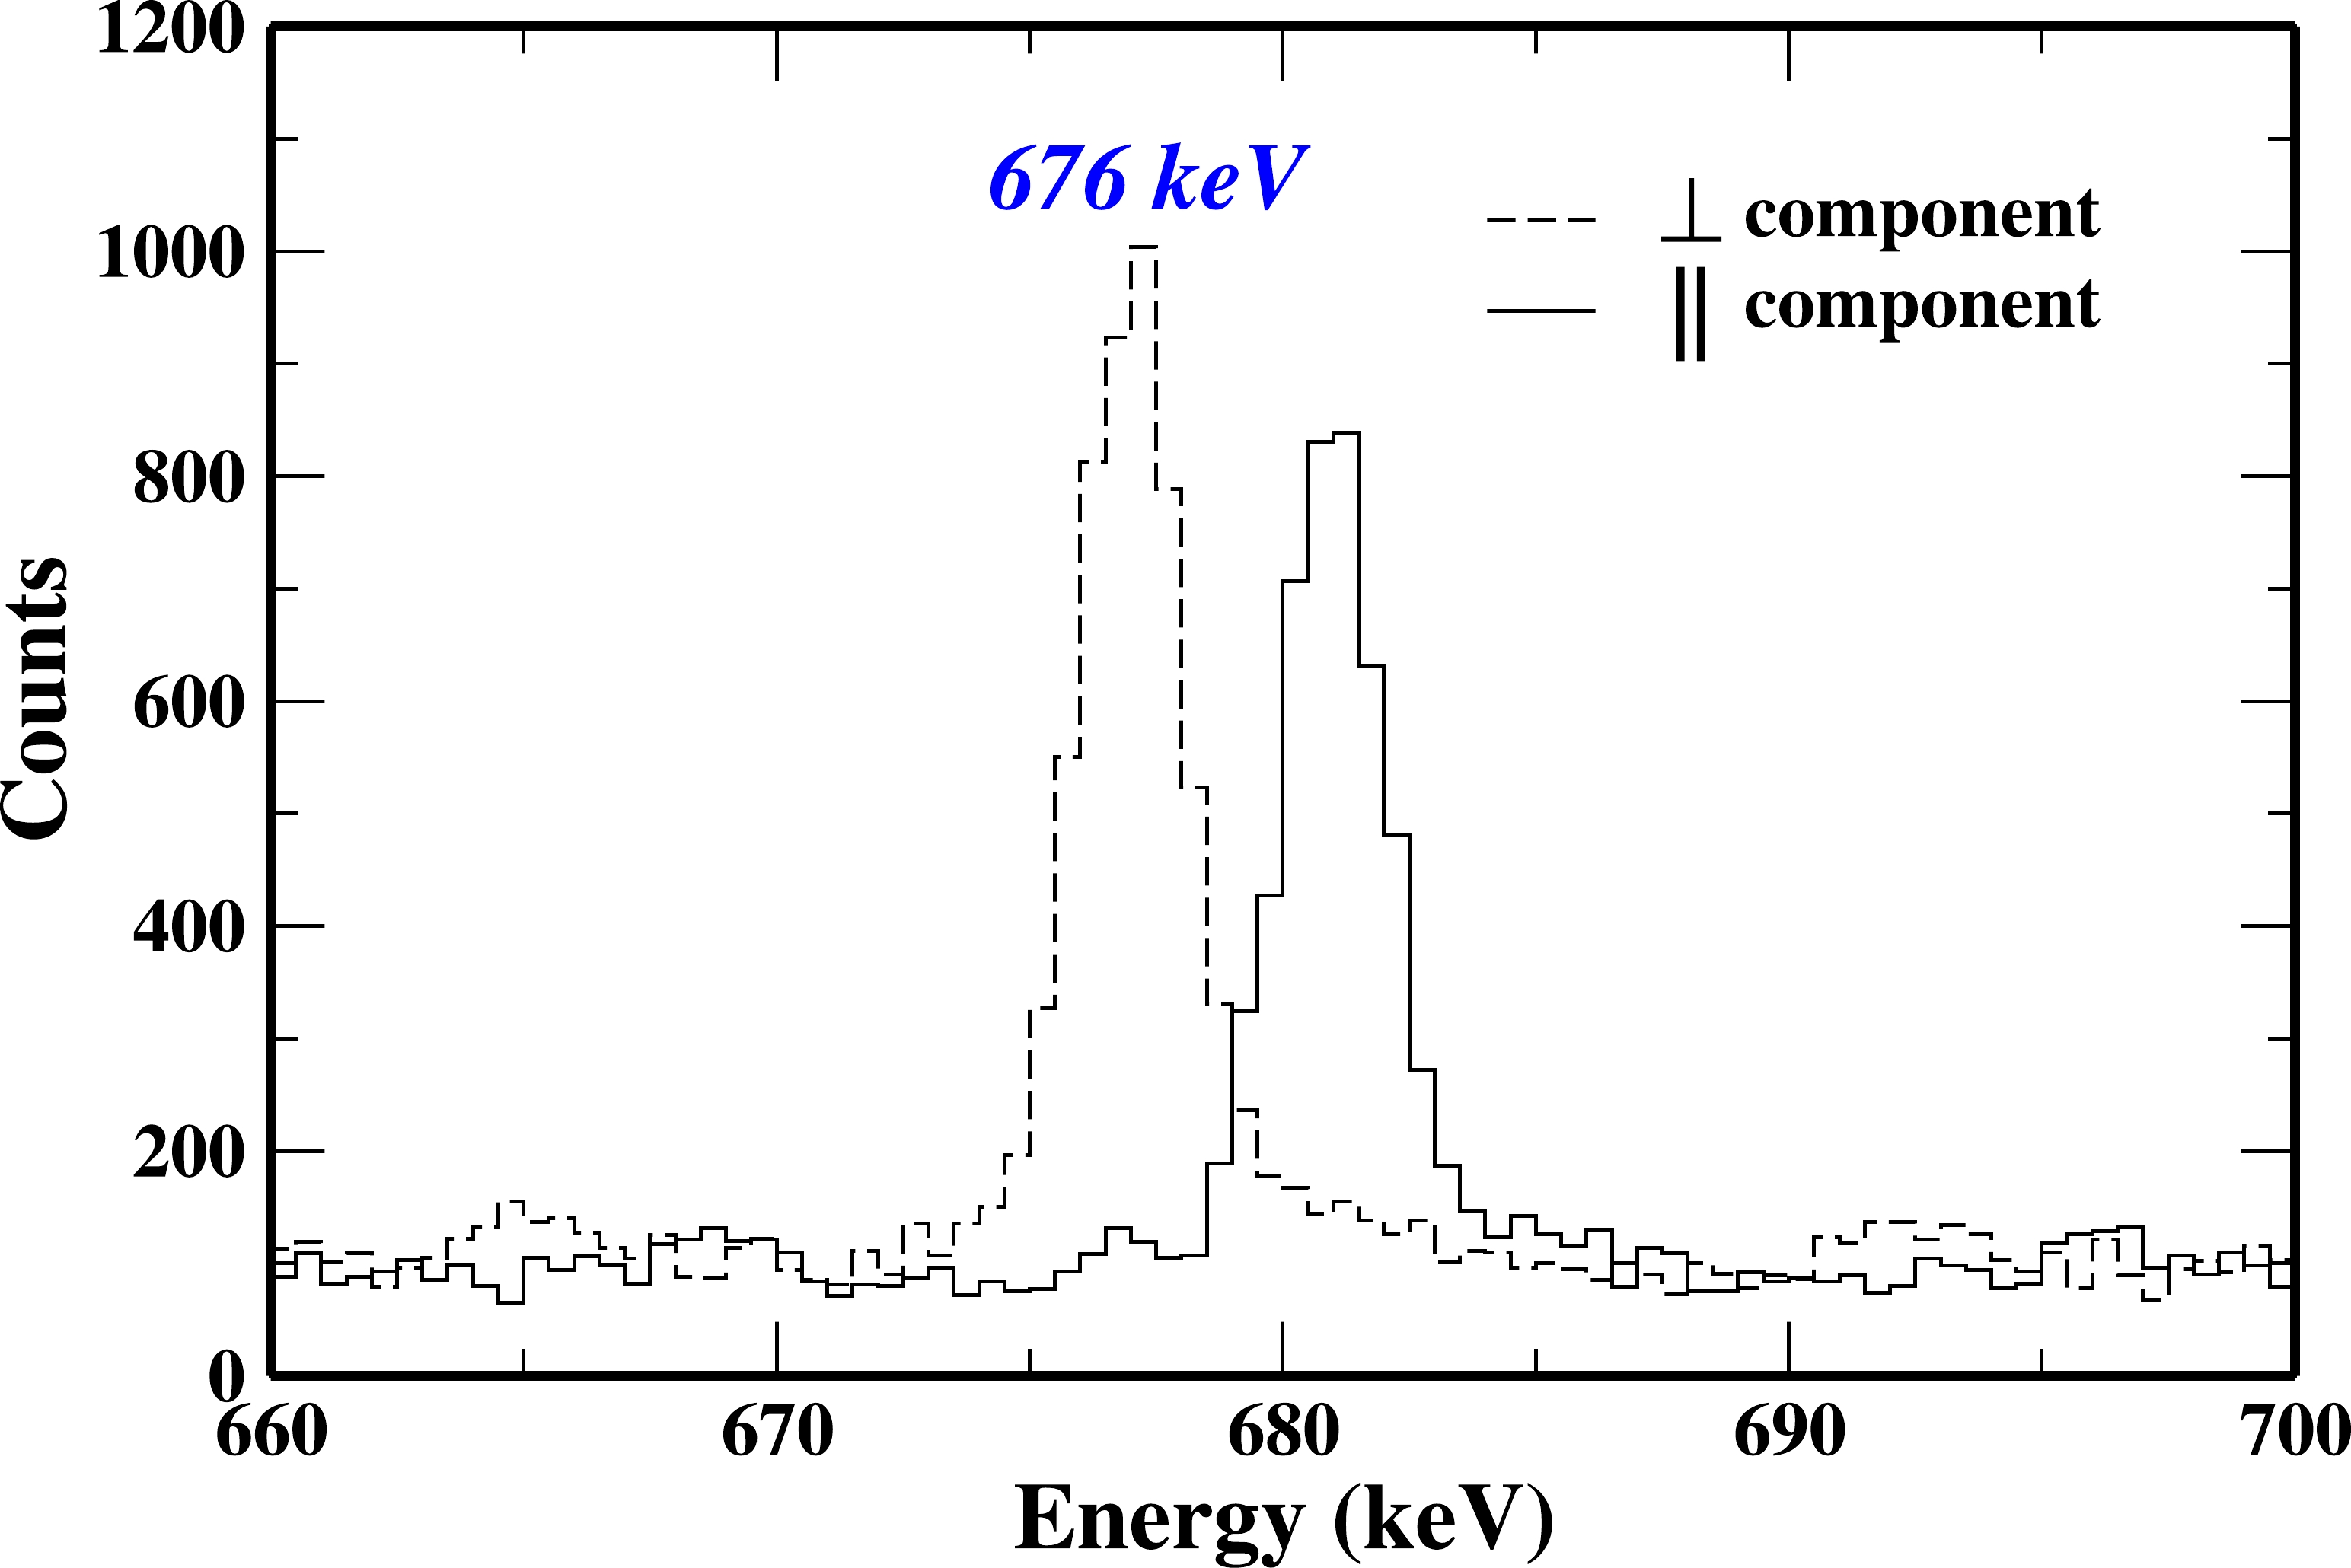
Figure 2. (color online) Perpendicular (dashed line) and parallel (solid line) components of the 676 keV γ ray in
$ ^{118} $ Xe, obtained from the linear polarization analysis in the present work. The parallel component is deliberately shifted (5 keV energy to the right) to give a clearer view and aid understanding. -
The level scheme of
$ ^{118} $ Xe has been modified in the present work by placing seven new γ-transitions based on the γ-γ coincidence and intensity relationship, as shown in Fig. 3. Most of the γ-transitions presented in this level scheme were reported in Ref. [10]. This study revisits all the excited states populated, and all the previous placements were either confirmed or updated according to the γ-γ coincidence and intensity relationship. The experimental results obtained in the present work are summarized in Table 1. The measured relative intensities of the γ rays from the single-gated spectra were normalized for the 337-keV transition. Relevant energy gated spectra in support of the present γ-transition placement are presented in Figs. 4, 5, and 6. These spectra show the previously reported γ rays in$ ^{118} $ Xe [8−10] along with the newly observed γ rays. All the new γ rays belonging to$ ^{118} $ Xe have been observed in the low lying 473 keV energy gated spectrum shown in Fig. 4. Moreover, observation of these γ rays in all other coincidence γ-spectra shown in Figs. 5(a)−(e), confirms the placement. Figure 6 shows the self-gated 429 keV spectra, which support our tentative placement of the transition in the level-scheme.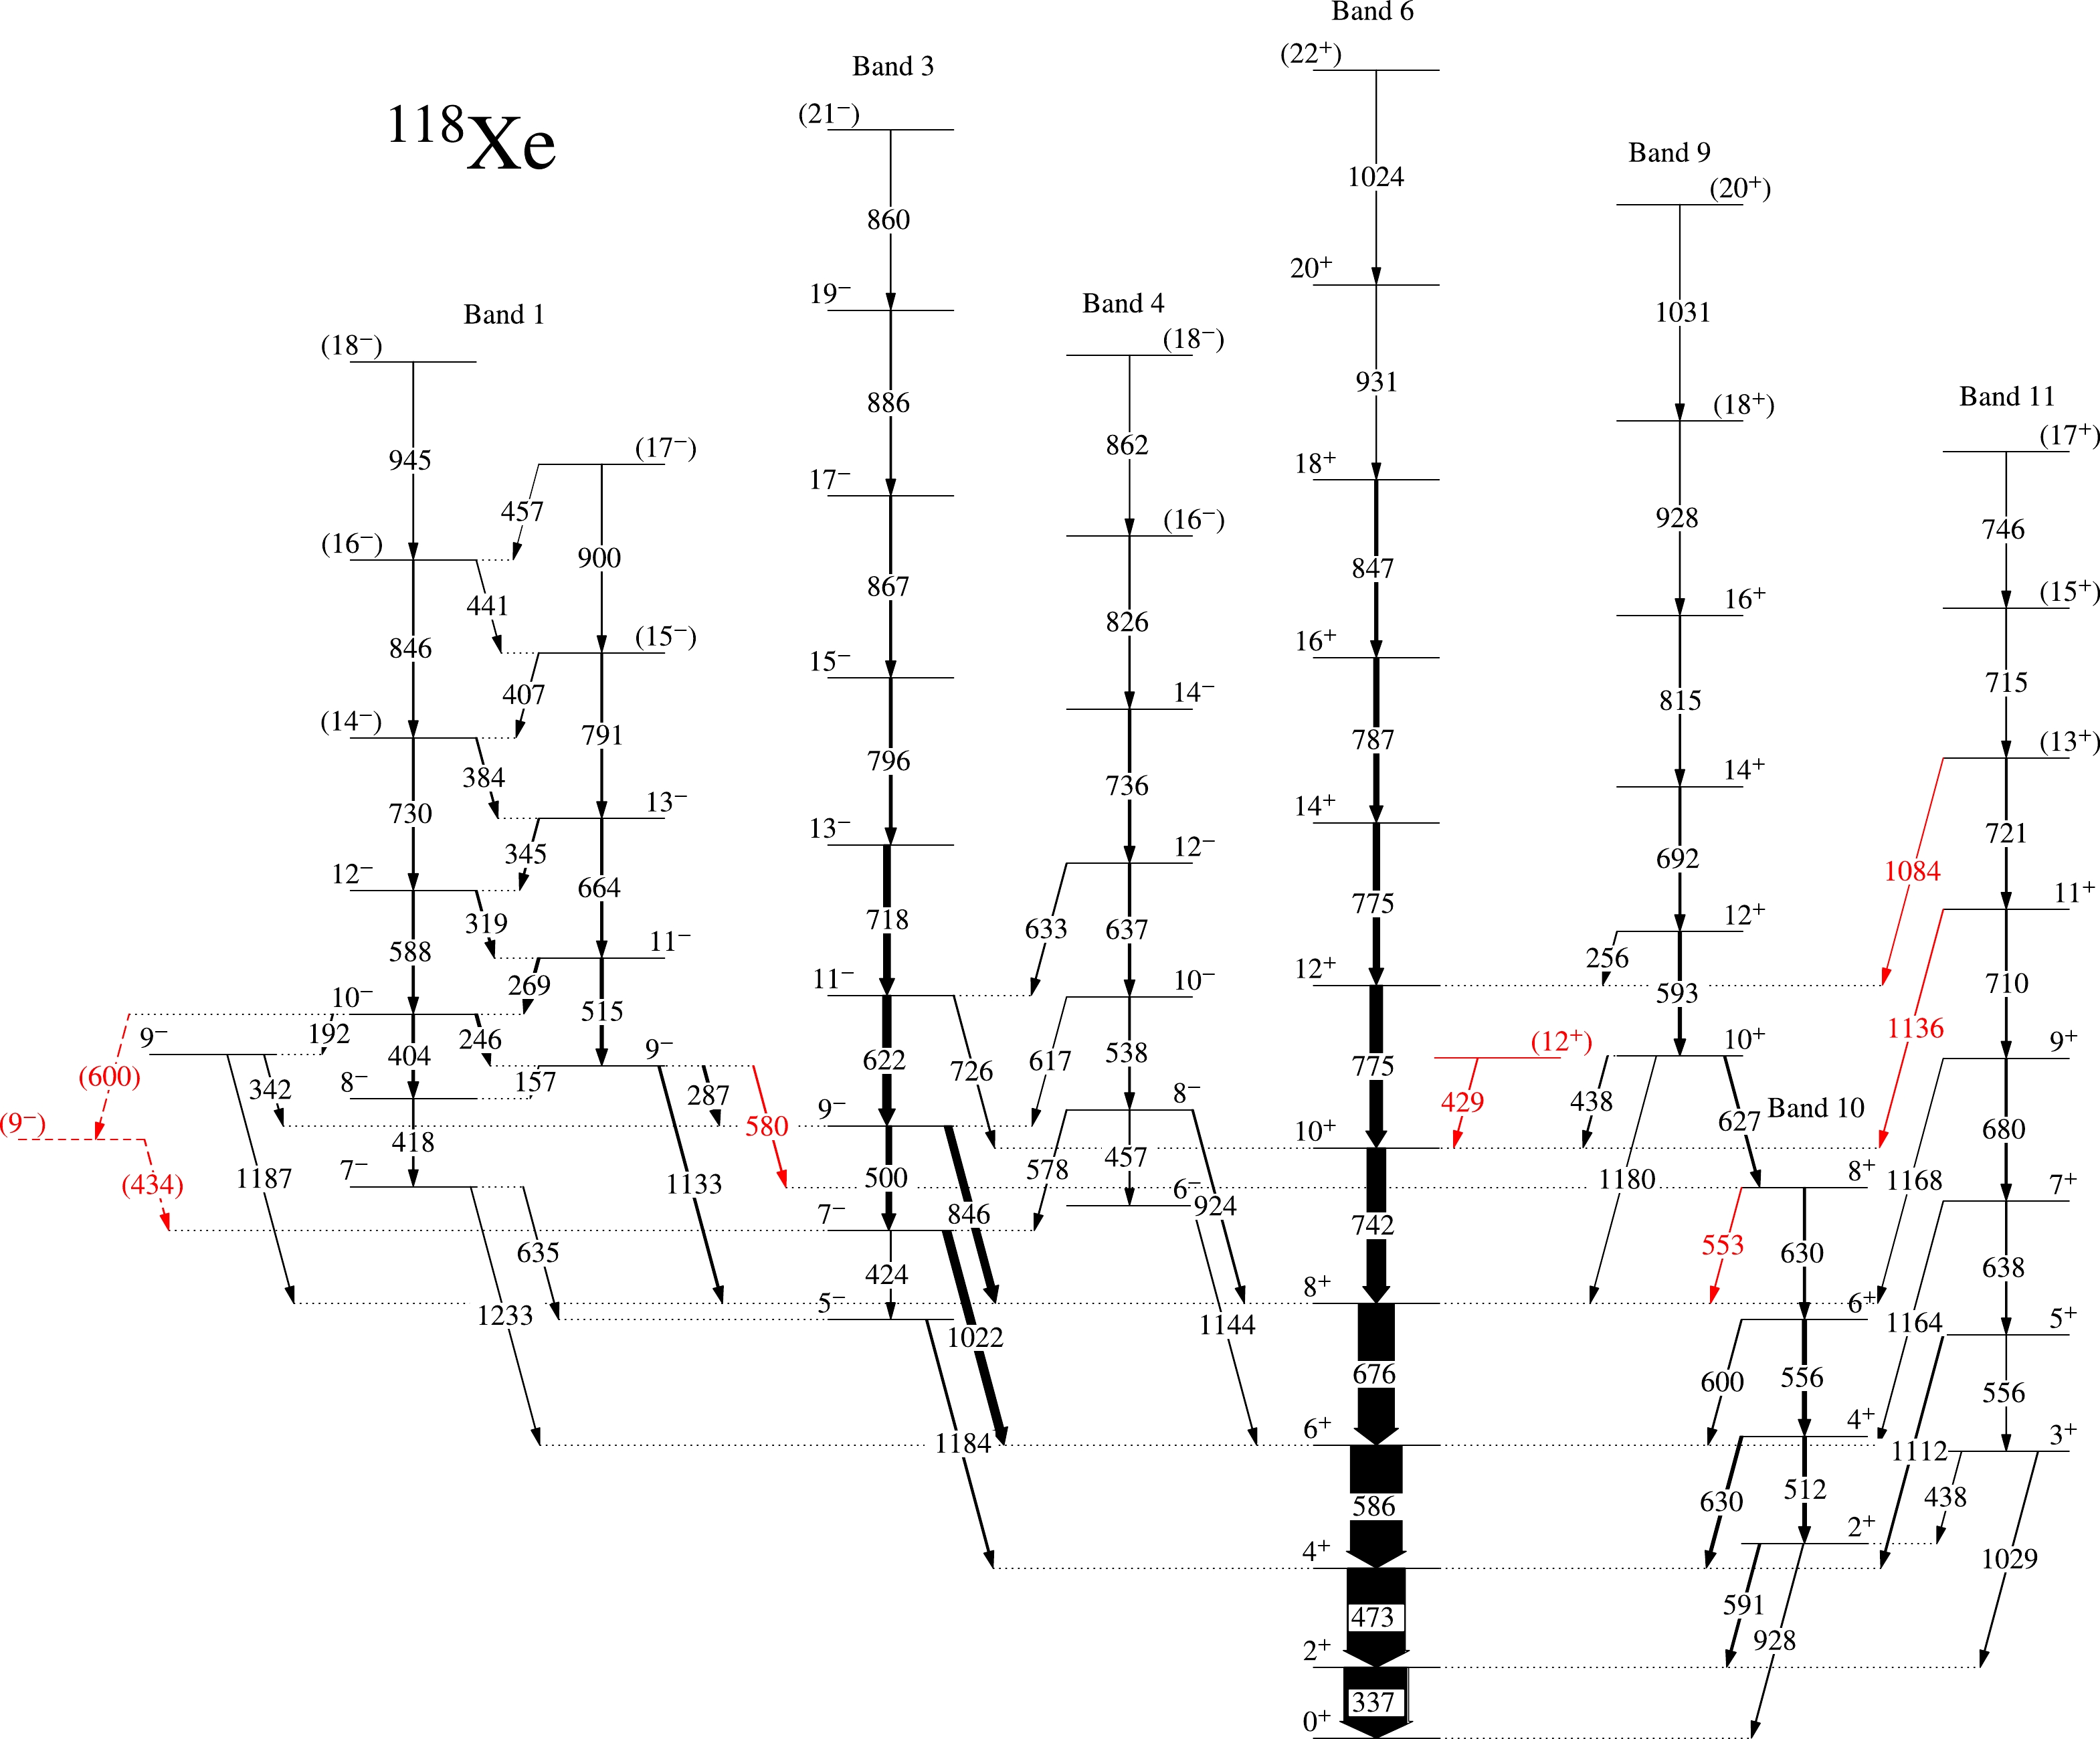
Figure 3. (color online) Level scheme of
$ ^{118} $ Xe deduced in the present work. Newly identified γ-rays are marked in red. Other peaks shown here were previously reported in [10]. Only bands that were reproduced in the present work are shown and discussed in the text.E $_{\gamma}$ /keV

$E_i$ 

I $_{\gamma}$ 

$^{b}$ 

${ R}_{\rm {DCO} }$ 

$^{c}$ 

A $_{\rm as}$ 

I $_i \rightarrow$ I

$_f$ 

Multipolarity Band 156.8(7) 3205 8.3(7) 9 $^{-}$ 

$\rightarrow$ 8

$^{-}$ 

M1/E2 1 191.7(5) 3452 15.6(10) 0.67(17) 10 $^{-}$ 

$\rightarrow$ 9

$^{-}$ 

M1/E2 1 $\rightarrow$ 

246.5(5) 3452 41.6(30) 0.83(12) 10 $^{-}$ 

$\rightarrow$ 9

$^{-}$ 

M1/E2 1 255.6(5) 3845 11.5(13) 0.99(26) 12 $^{+}$ 

$\rightarrow$ 12

$^{+}$ 

M1/E2 9 $\rightarrow$ 6

268.7(5) 3721 39.8(31) 0.79(14) 11 $^{-}$ 

$\rightarrow$ 10

$^{-}$ 

M1/E2 1 286.9(5) 3205 39.0(32) 1.26(14) 9 $^{-}$ 

$\rightarrow$ 9

$^{-}$ 

M1/E2 1 $\rightarrow$ 3

319.4(5) 4040 29.0(23) 0.73(17) 12 $^{-}$ 

$\rightarrow$ 11

$^{-}$ 

M1/E2 1 337.4(1) 338 1000 1.00 0.13(5) 2 $^{+}$ 

$\rightarrow$ 0

$^{+}$ 

E2 6 341.6(5) 3260 13.4(14) 9 $^{-}$ 

$\rightarrow$ 9

$^{-}$ 

M1/E2 $\rightarrow$ 3

344.9(5) 4385 22.2(19) 0.57(6) 13 $^{-}$ 

$\rightarrow$ 12

$^{-}$ 

M1/E2 1 384.3(5) 4770 21.6(22) (14 $^{-}$ )

$\rightarrow$ 13

$^{-}$ 

(M1/E2) 1 403.7(5) 3452 37.0(34) 1.03(11) 10 $^{-}$ 

$\rightarrow$ 8

$^{-}$ 

E2 1 406.6(5) 5176 12.7(18) (15 $^{-}$ 

$\rightarrow$ 14

$^{-}$ )

(M1/E2) 1 418.5(5) 3048 21.5(14) 8 $^{-}$ 

$\rightarrow$ 7

$^{-}$ 

M1/E2 1 423.5(5) 2418 10.1(7) 1.18(29) 7 $^{-}$ 

$\rightarrow$ 5

$^{-}$ 

E2 3 429.1(5) 3244 13.1(17) 0.99(20) (12 $^{+}$ )

$\rightarrow$ 10

$^{+}$ 

(E2) $\rightarrow$ 6

434.5(5) 2852 12.5(16) 1.10(19) (9 $^{-}$ )

$\rightarrow$ 7

$^{-}$ 

(E2) $\rightarrow$ 3

437.9(7) 1366 7.7(12) 3 $^{+}$ 

$\rightarrow$ 2

$^{+}$ 

M1/E2 11 $\rightarrow$ 10

438.1(5) 3253 18.7(13) 1.01(15) 10 $^{+}$ 

$\rightarrow$ 10

$^{+}$ 

M1/E2 9 $\rightarrow$ 6

441.1(7) 5617 8.6(13) (16 $^{-}$ 

$\rightarrow$ 15

$^{-})$ 

(M1/E2) 1 456.9(7) 6074 3.8(9) (17 $^{-}$ 

$\rightarrow$ 16

$^{-}$ )

(M1/E2) 1 457.3(5) 2997 14.6(16) 1.03(9) 8 $^{-}$ 

$\rightarrow$ 6

$^{-}$ 

E2 4 472.7(1) 810 910.0(463) 1.02(2) 0.12(4) 4 $^{+}$ 

$\rightarrow$ 2

$^{+}$ 

E2 6 500.4(5) 2918 89.2(58) 0.98(9) 0.18(14) 9 $^{-}$ 

$\rightarrow$ 7

$^{-}$ 

E2 3 512.3(5) 1440 57.6(35) 1.05(17) 4 $^{+}$ 

$\rightarrow$ 2

$^{+}$ 

E2 10 515.2(5) 3721 50.0(33) 1.26(10) 11 $^{-}$ 

$\rightarrow$ 9

$^{-}$ 

E2 1 538.5(5) 3535 24.9(24) 1.35(20) 10 $^{-}$ 

$\rightarrow$ 8

$^{-}$ 

E2 4 553.1(5) 2626 10.1(10) 0.84(11) 8 $^{+}$ 

$\rightarrow$ 8

$^{+}$ 

M1/E2 10 $\rightarrow$ 6

555.8(5) 1996 65.2(31) 1.10(15) $^{e}$ 

6 $^{+}$ 

$\rightarrow$ 4

$^{+}$ 

E2 10 556.0(5) 1922 11.5(14) 1.10(15) $^{e}$ 

5 $^{+}$ 

$\rightarrow$ 3

$^{+}$ 

E2 11 577.8(5) 2997 14.3(24) 8 $^{-}$ 

$\rightarrow$ 7

$^{-}$ 

M1/E2 4 $\rightarrow$ 3

579.6(5) 3205 19.4(27) 0.60(7) 9 $^{-}$ 

$\rightarrow$ 8

$^{+}$ 

E1 1 $\rightarrow$ 10

586.3(1) 1397 814.9(487) 0.97(3) 0.13(3) 6 $^{+}$ 

$\rightarrow$ 4

$^{+}$ 

E2 6 588.2(5) 4040 32.5(69) 12 $^{-}$ 

$\rightarrow$ 10

$^{-}$ 

E2 1 590.6(5) 928 45.2(37) 2 $^{+}$ 

$\rightarrow$ 2

$^{+}$ 

M1/E2 10 $\rightarrow$ 6

592.6(5) 3845 51.0(42) 1.12(13) 12 $^{+}$ 

$\rightarrow$ 10

$^{+}$ 

E2 9 599.6(5) 1996 17.4(15) 6 $^{+}$ 

$\rightarrow$ 6

$^{+}$ 

M1/E2 10 599.8(7) 3452 8.6(12) 10 $^{-}$ 

$\rightarrow$ (9

$^{-}$ )

(M1/E2) 1 $\rightarrow$ 

617.2(5) 3535 16.1(13) 10 $^{-}$ 

$\rightarrow$ 9

$^{-}$ 

M1/E2 4 $\rightarrow$ 3

622.1(3) 3541 131.4(76) 1.08(11) 0.16(9) 11 $^{-}$ 

$\rightarrow$ 9

$^{-}$ 

E2 3 Continued on next page Table 1. Gamma-ray energies, initial level energies, relative intensities, DCO ratio, polarisation asymmetry parameter, multipolarity, and band number assigned to the transitions in
$ ^{118} $ Xe.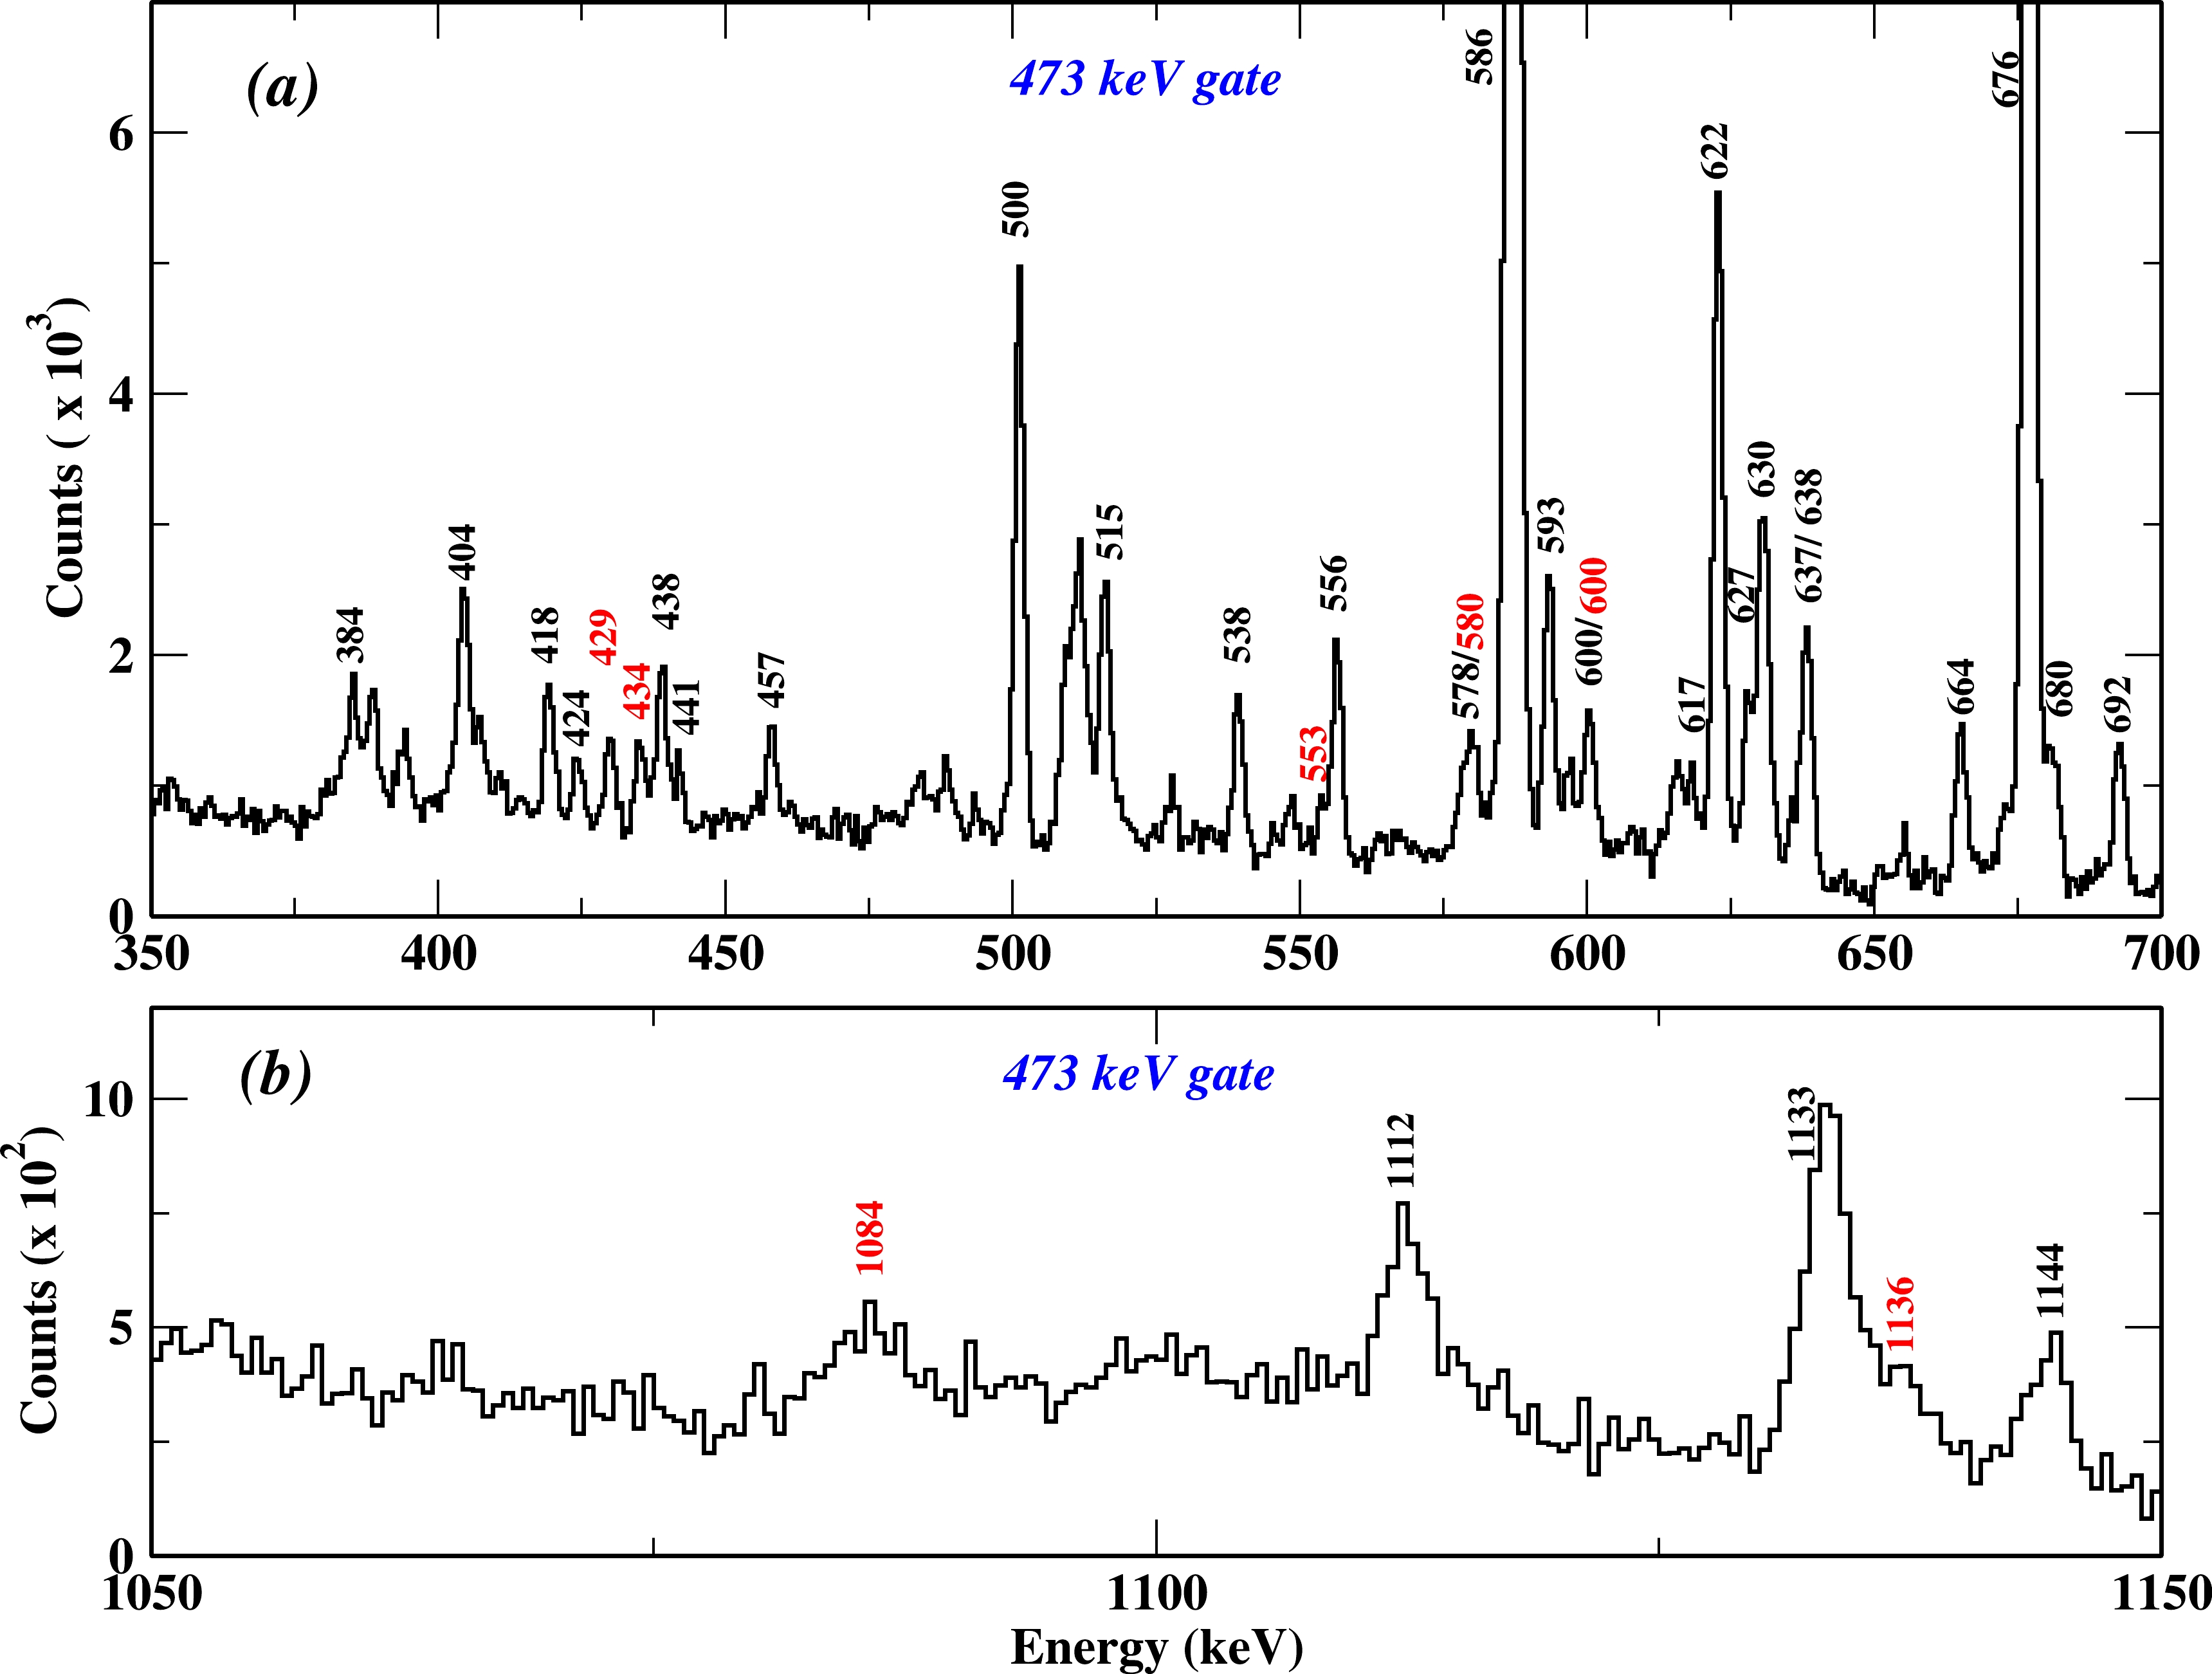
Figure 4. (color online) Prompt
$ {\gamma}-{\gamma} $ coincidence spectra showing (a) 350 to 700 keV γ-ray transitions and (b) 1050 to 1150 keV γ-ray transitions, gated by the 473 keV gamma transition of the yrast band in$ ^{118} $ Xe. Newly observed transitions are marked in red. Only transitions of present interest are shown in keV. One channel at the x-axis corresponds to 0.5 keV.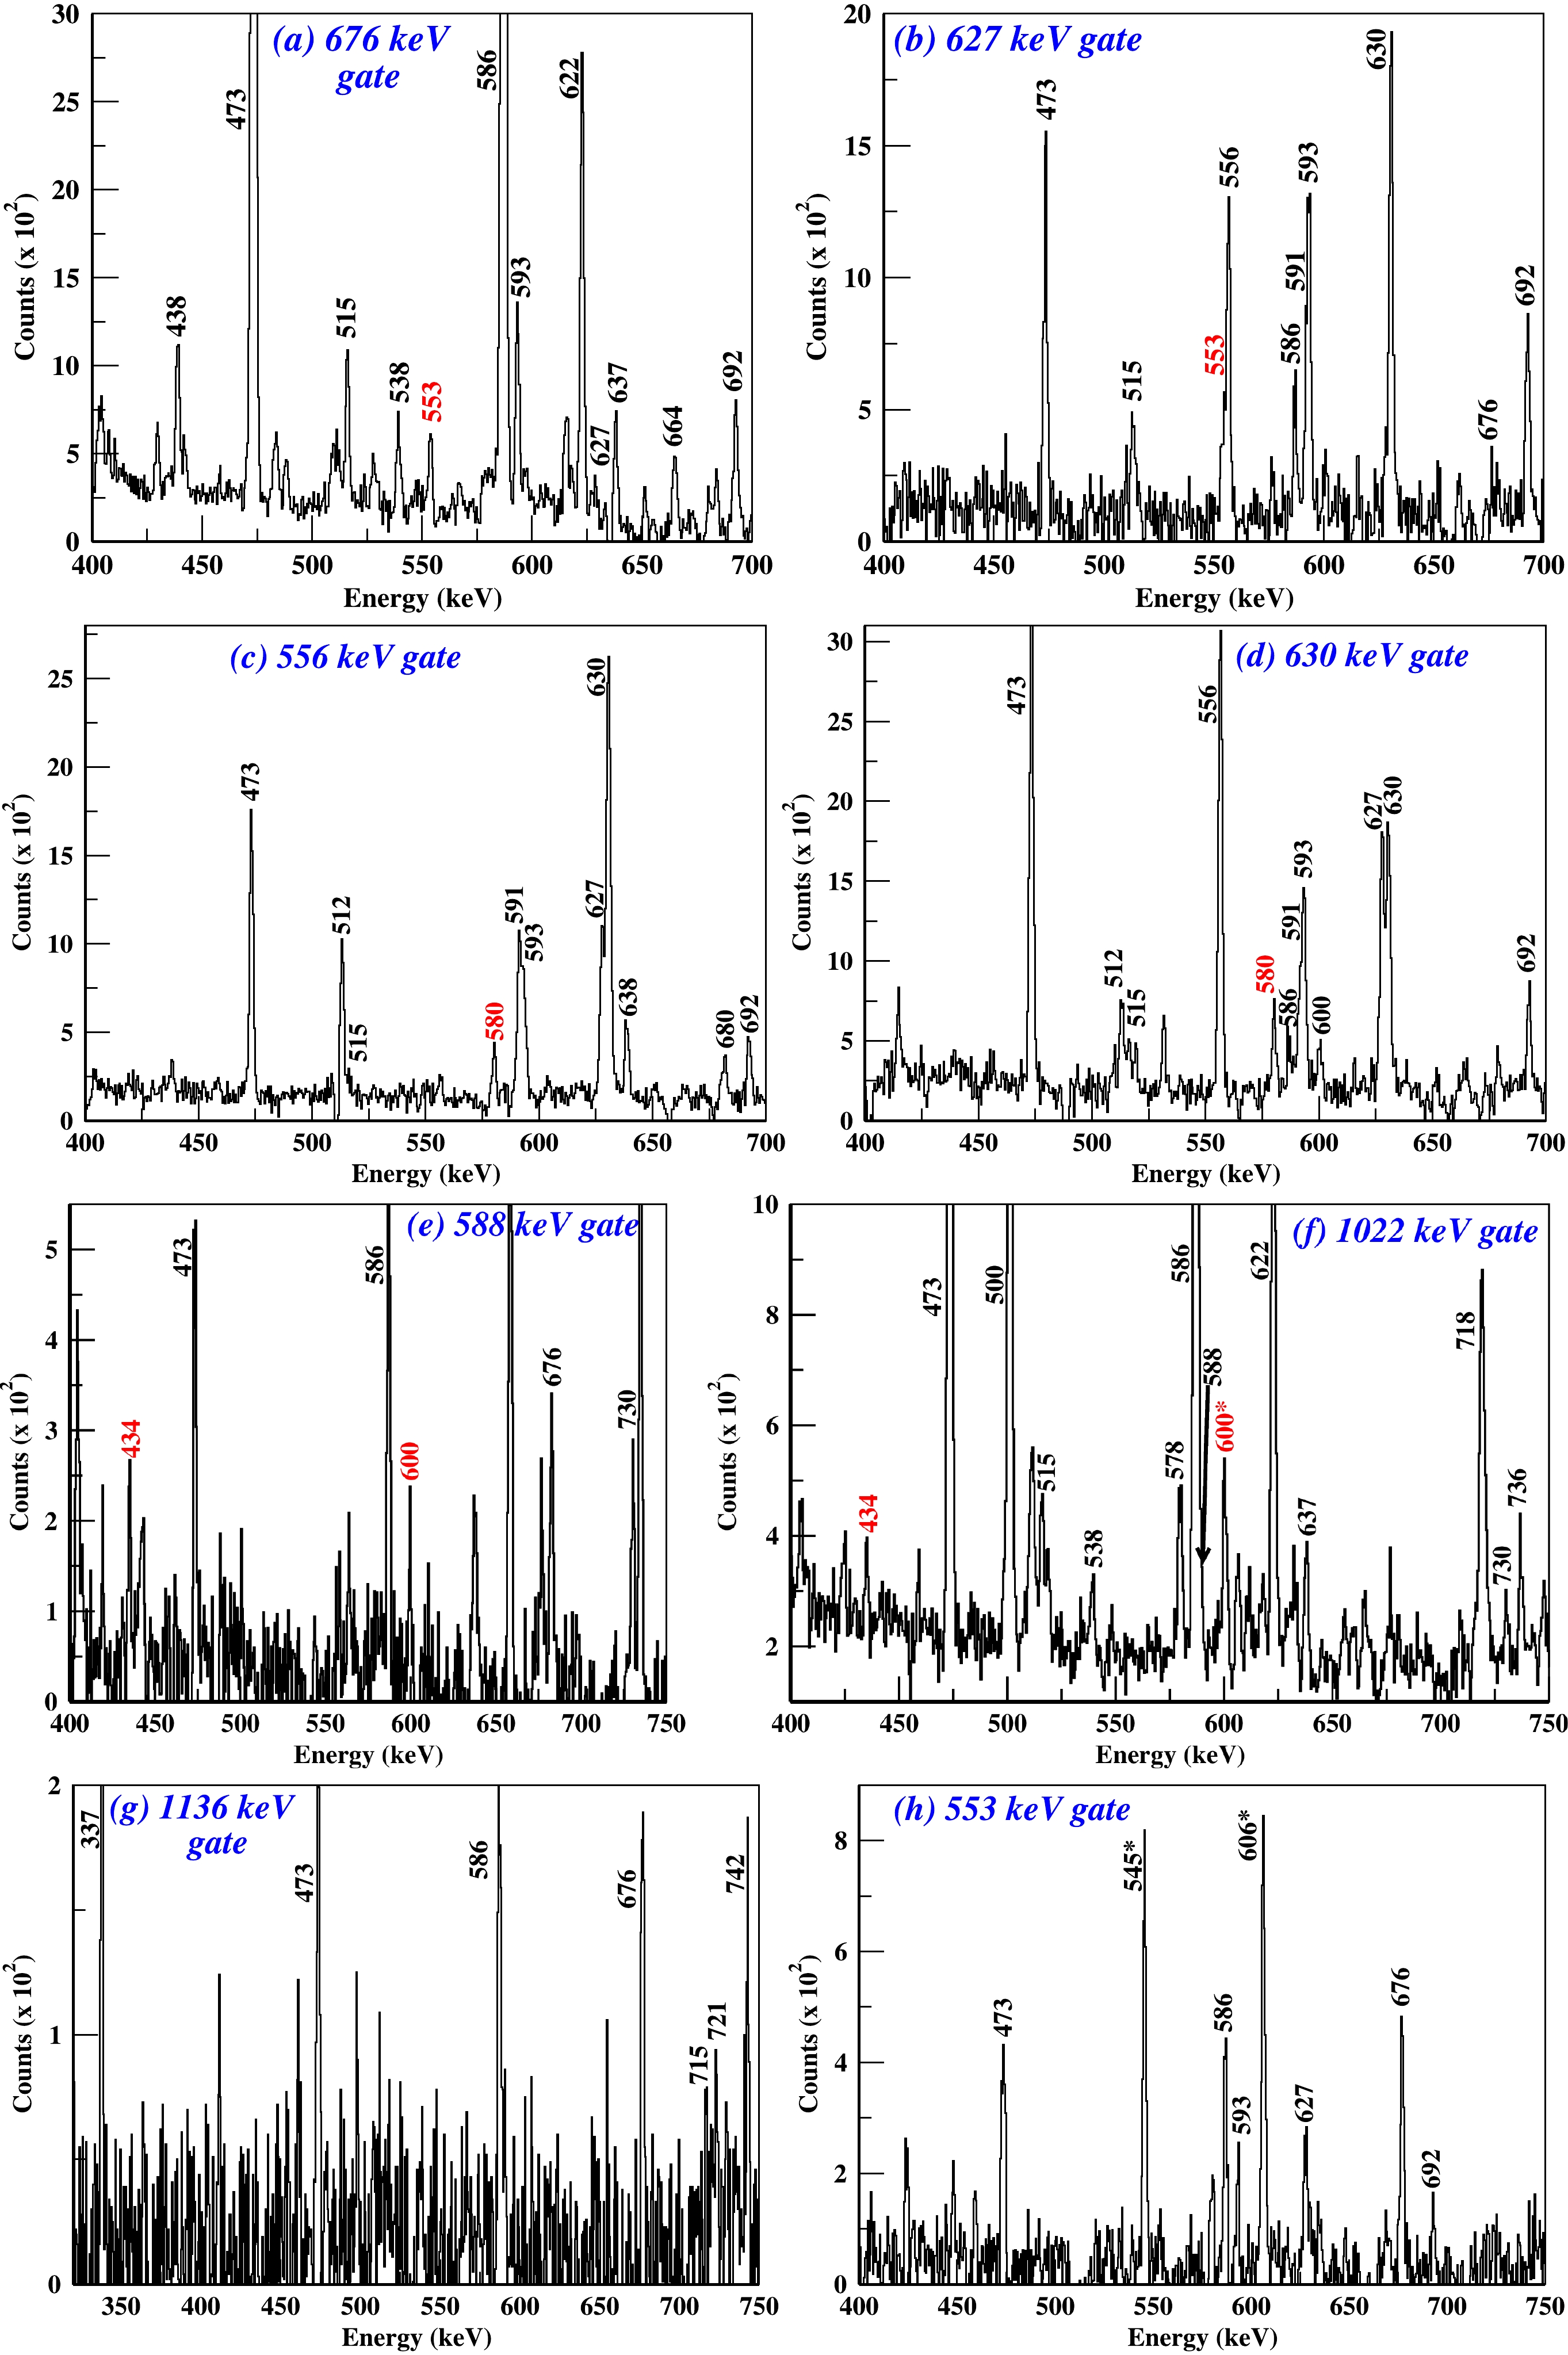
Figure 5. (color online) Prompt
$ {\gamma}-{\gamma} $ coincidence spectra, with gates at (top left to bottom) (a) 676 keV, (b) 627 keV, (c) 556 keV, (d) 630 keV, (e) 588 keV, (f) 1022 keV, (g) 1136 keV, and (h) 553 keV, in support of the placement of all the newly found transitions. The γ-ray transition peaks marked with an asterisk in Fig. 5(h) are the contaminant peaks from the other channel. The 600 keV transition in Fig. 5(f) is marked with an asterisk to denote the contribution of the contaminant peak (601 keV, 4$ ^{+} \rightarrow 2^{+} $ ) from the other populated channel ($ ^{118} $ Te) [21], which accounts for the unexpected high statistics under the peak. One channel at the x-axis corresponds to 0.5 keV.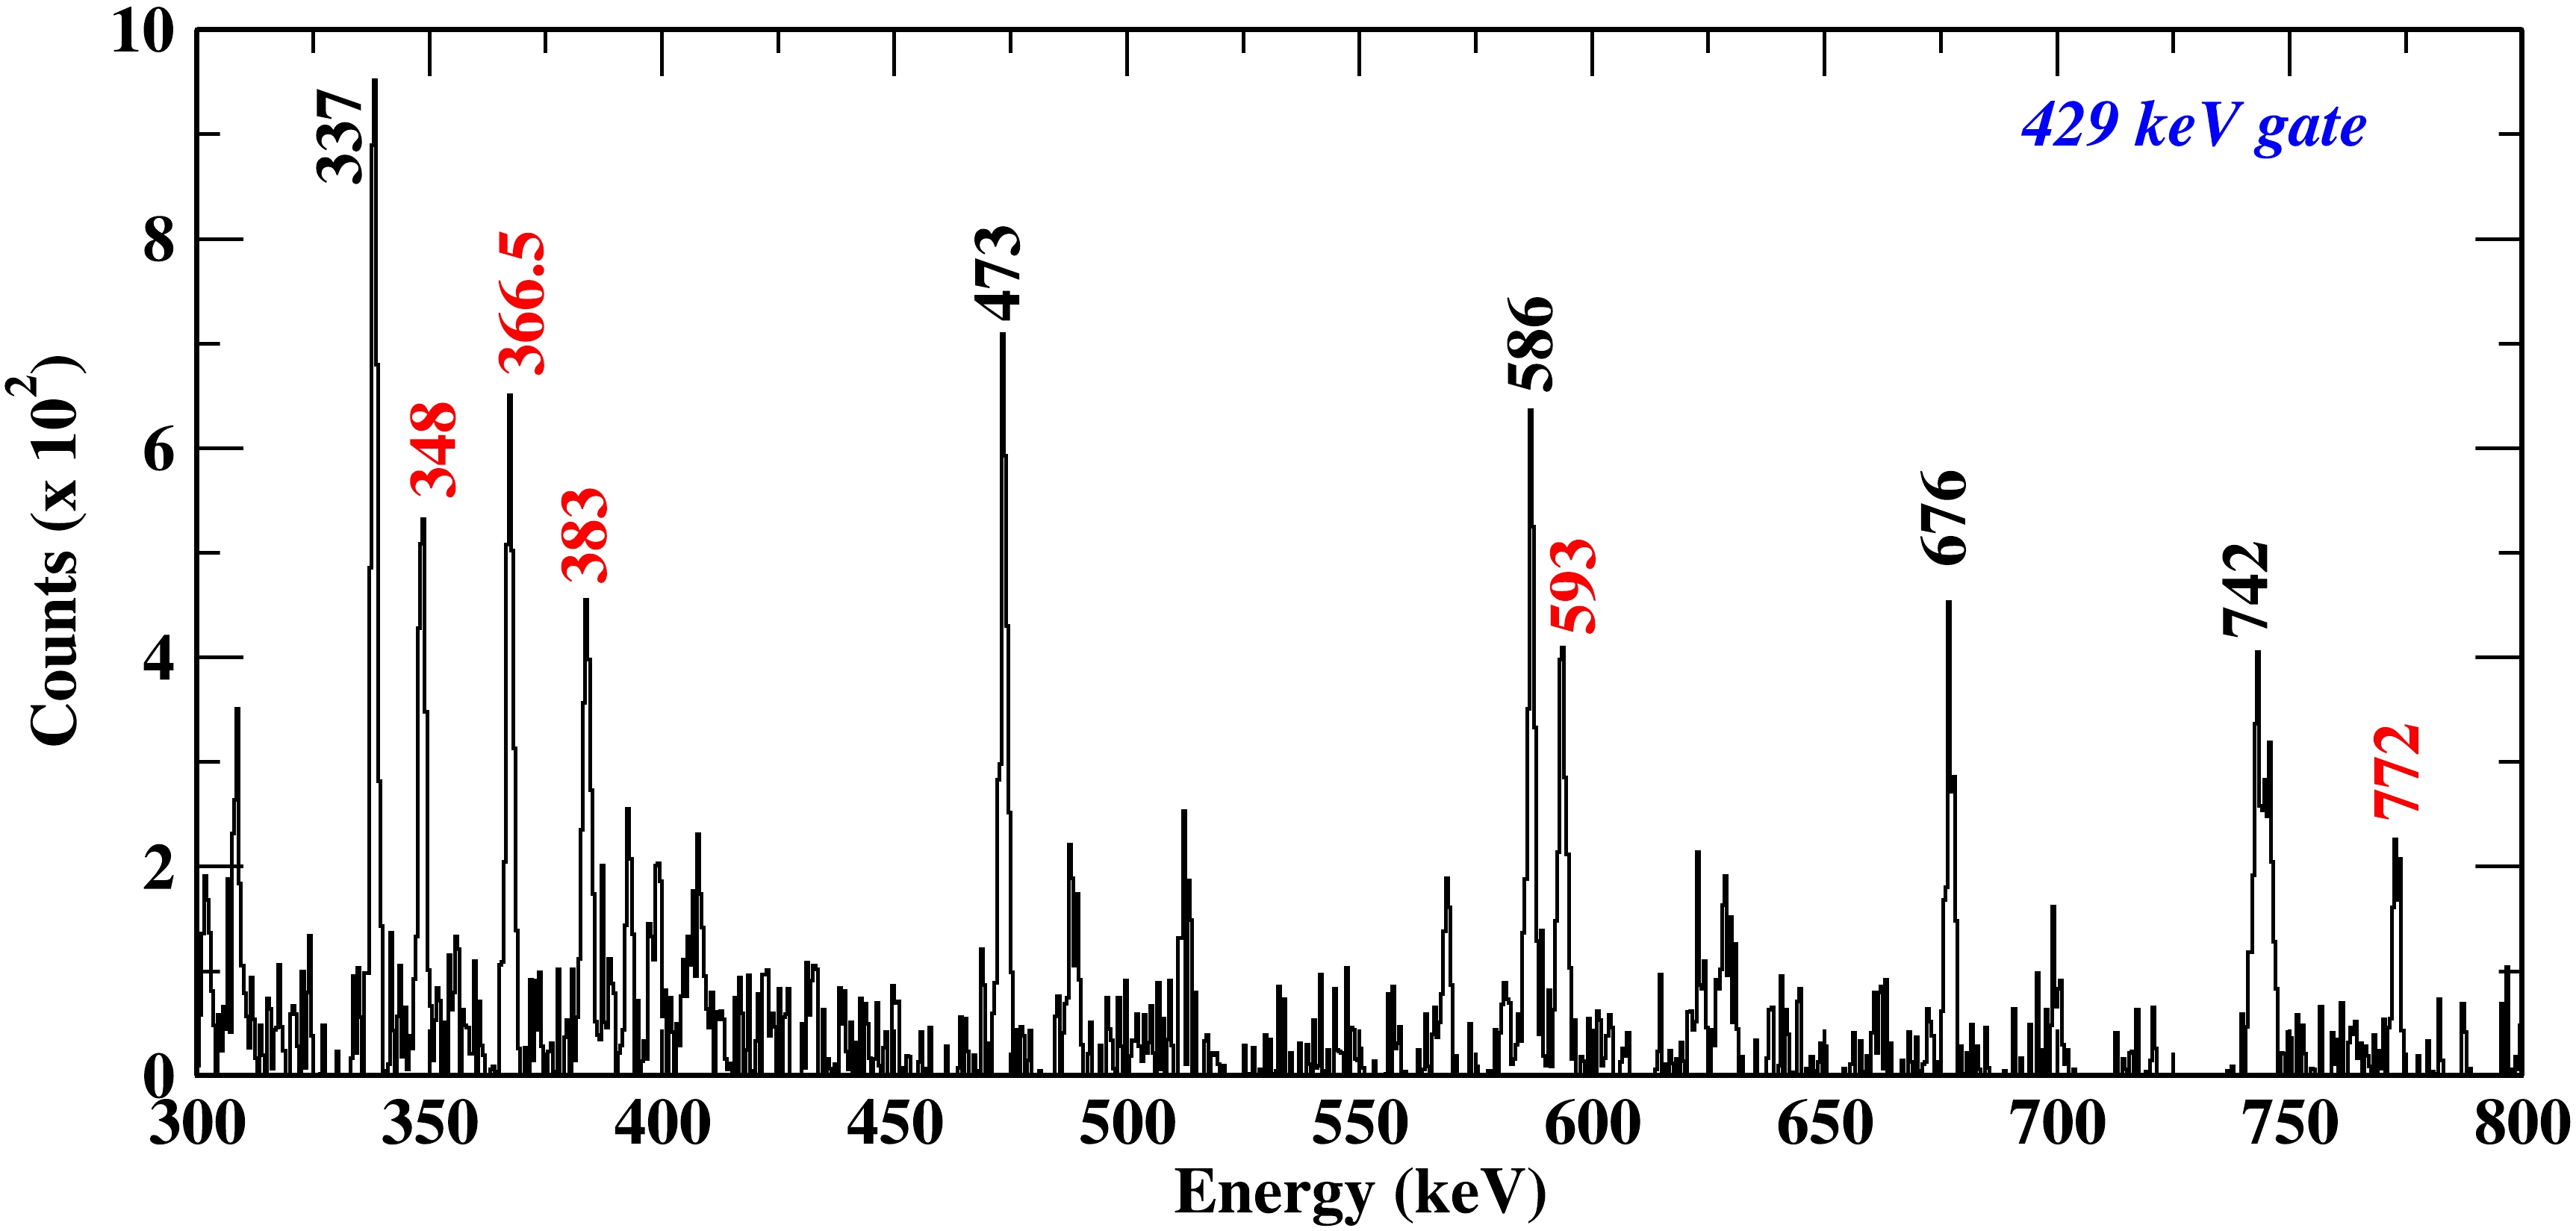
Figure 6. (color online) Prompt
$ {\gamma}-{\gamma} $ coincidence spectra, gated by the 429 keV ((12$ ^{+} $ )$ \rightarrow $ 10$ ^{+} $ )$ {\gamma} $ -ray transition (decaying into yrast band) to justify the tentative placement of the 429 keV transition. Unknown transitions suggested to be coming from other populated channels are marked with red color. One channel at the x-axis corresponds to 0.5 keV.In this work, the spin-parity of most of the states has been assigned firmly on the basis of the DCO ratio and (A
$_{\rm as}$ ) values of the transitions. The DCO ratio for some transitions (those absent from Table 1 could not be evaluated, owing to the low statistics observed for those transitions in the present work. The observed level sequences have been numbered in accordance with the previous study [10], to avoid confusion while comparing the previous work and the present review. This work revisits all the γ-transitions reported in the previous work [10], adding some important information based on spectroscopic measurements, as summarized in Table 1. While some new transitions and decay paths have been found in the present work, our level scheme is consistent with that proposed earlier [9, 10].1) In the previous work [10], the yrast band transition, i.e., 12
$ ^{+} \rightarrow $ 10$ ^{+} $ , was assigned E$ _{\gamma} $ = 775.9 keV, but in the present work, the 12$ ^{+} \rightarrow $ 10$ ^{+} $ transition was observed to have E$ _{\gamma} $ = 775.1 keV, which was confirmed using the 256 keV gated spectra, as shown in Fig. 7(b). The close-lying 14$ ^{+} \rightarrow $ 12$ ^{+} $ transition could not be resolved in the present work. Therefore, we adopted E$ _{\gamma} $ = 775 keV for the 14$ ^{+} \rightarrow $ 12$ ^{+} $ transition. The relative intensities, DCO, and A$_{\rm as}$ measurements are reported for the composite peak because individual peaks cannot be resolved unambiguously. The presence of two close-lying transitions has been confirmed using the 787 keV gated spectra, as shown in Fig. 7(a).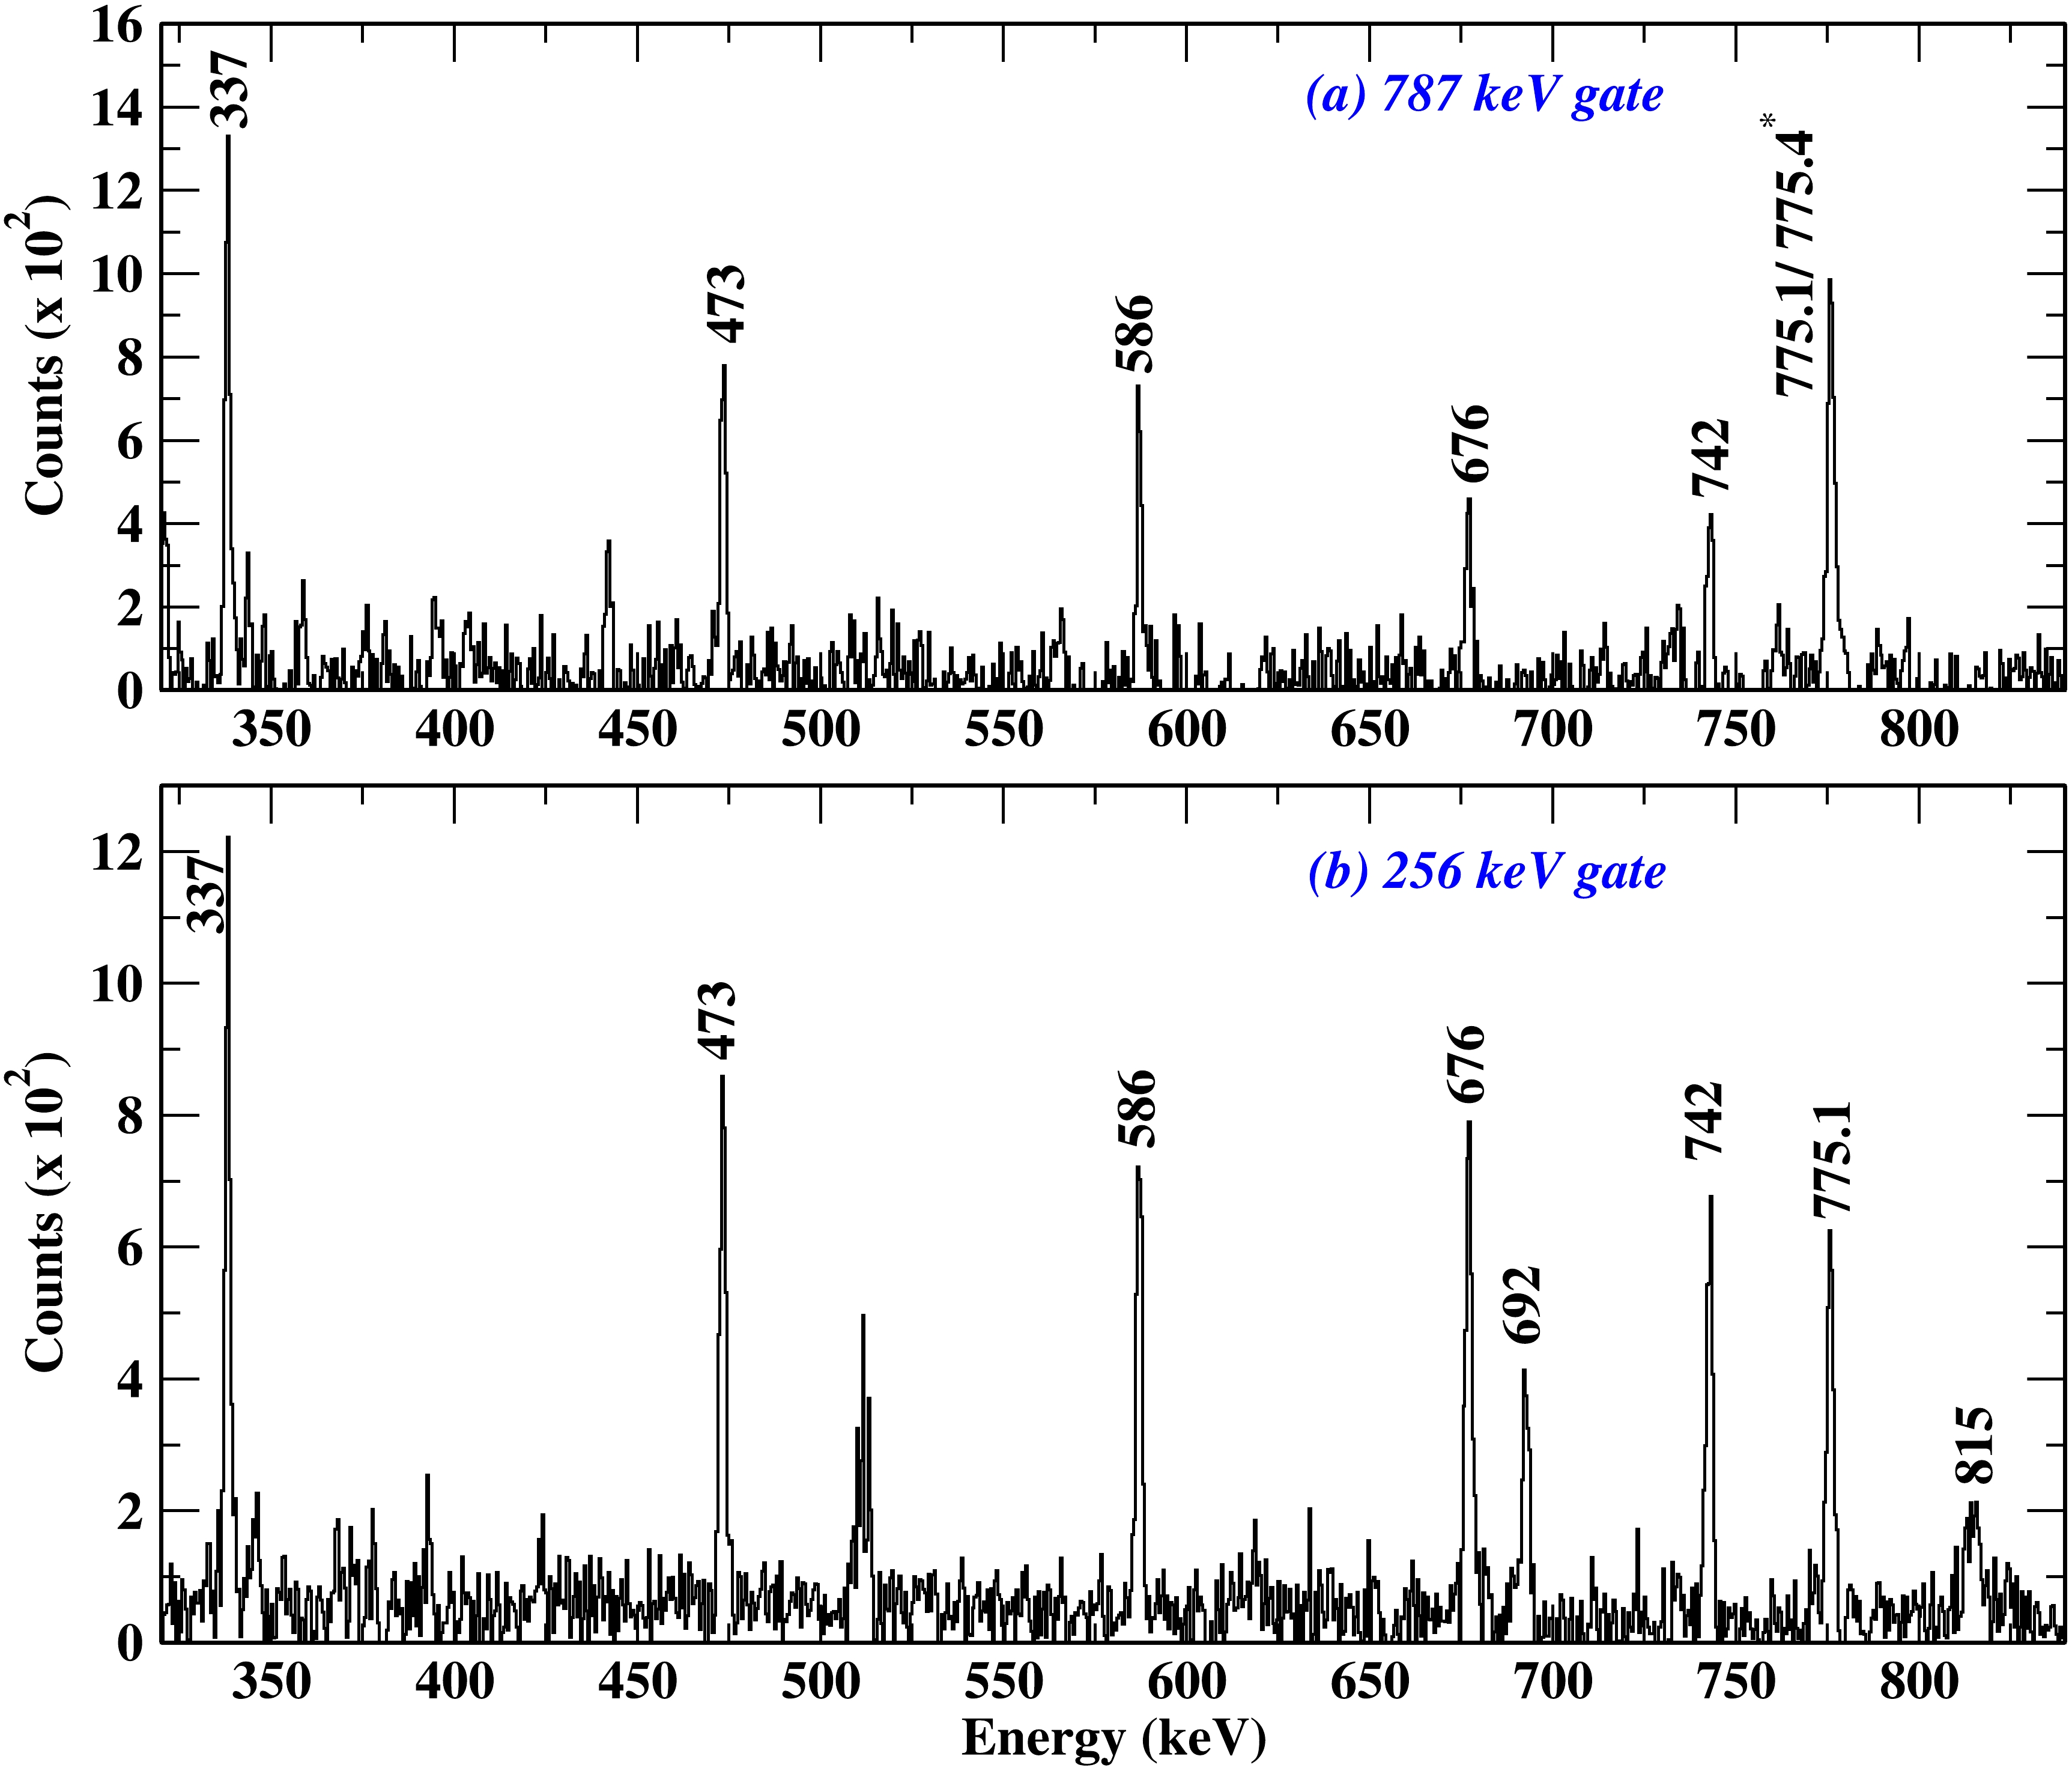
Figure 7. (color online) Prompt
$ {\gamma}-{\gamma} $ coincidence spectra: (a) gated by the 787 keV (16$ ^{+} \rightarrow $ 14$ ^{+} $ )$ {\gamma} $ -transition of the yrast band in$ ^{118} $ Xe confirming the presence of two close-lying peaks at 775 keV; (b) gated by the 256 keV (12$ ^{+} \rightarrow $ 12$ ^{+} $ ) interlinking$ {\gamma} $ -transition between bands 9 and 6 to support the placement of the 775.1 keV transition. The tentative value of the 775.4 keV transition is denoted by an asterisk. One channel at the x-axis corresponds to 0.5 keV.2) In the present study, spin and parity assignments in the yrast band/band 6 are updated to the 20
$ ^{+} $ state supported by angular correlation analysis.3) Band 4 has been tentatively suggested to have negative parity according to systematic behavior observed in heavier even Xe nuclei [10]. The parity of band 4 depends on the electric/magnetic nature of the decaying 924/1144 keV transition. In the present work, the A
$ _{\rm as} $ of the 924 keV transition, i.e., 8$ ^{-} \rightarrow $ 8$ ^{+} $ , has been found to be positive, confirming the electric nature of the transition. This confirms the parity of band 4 to be negative. Spin and parity assignments in this band are supported up to the 14$ ^{-} $ state by angular correlation analysis.4) In the present study, the spin and parity assignments in the band 11 are updated to the 11
$ ^{+} $ state supported by angular correlation analysis. Two newly found interlinking transitions, i.e., 1136 (11$ ^{+} {\rightarrow } $ 10$ ^{+} $ ) and 1084 ((13$ ^{+} $ )$ {\rightarrow } $ 12$ ^{+} $ ) keV have been placed in the level scheme. -
In this section, the experimental results are discussed first by comparison with the neighboring isotopes and from general considerations and then by using the theoretical framework of the TPSM approach.
-
All the bands (level structure) observed in the present work will be briefly discussed in this section. In Refs. [9, 10], the alignment plot of the yrast band is compared with the neighboring even Ba-nuclei (see Fig. 10 (a) [9] and Fig. 10 (c) [10]). Two conflicting interpretations of the first alignment in the yrast band have been proposed in Refs. [8, 9]. The first alignment in the yrast band in
$ ^{118} $ Xe at$ \omega_{1} $ = 0.39 MeV/$ {\hbar} $ was attributed to h$ _{11/2} $ protons [10], while in heavier Xe nuclei, the first alignment is attributed to h$ _{11/2} $ neutrons. In order to resolve this ambiguity, triaxial projected shell model (TPSM) calculations have been carried out (discussed in the next section). On the basis of TPSM calculations, the ground state band in$ ^{118} $ Xe is understood to be crossed at$ \omega_{1} $ by the aligned two quasiparticle (νh$ _{11/2} $ )$ ^{2} $ configuration. Band 10 originating at lower excitation energies is interpreted as an even-spin quasirotational γ-band [22]. Band 10 is crossed at a frequency of ω = 0.31 MeV/$ {\hbar} $ by band 9, which also crosses the extrapolated yrast band at a frequency near 0.41 MeV/$ {\hbar} $ . Band 9 in$ ^{118} $ Xe was identified as an aligned two quasi-particle (qp) (νh$ _{11/2} $ )$ ^{2} $ band on the basis of the observed alignment pattern and extracted crossing frequencies (see Fig. 11 (b) [10]). Band 11 has been extended up to 11$ ^{+} $ on the basis of angular correlation analysis in the present work. In Ref. [10], the alignment (i$ _{x} $ ) plot as a function of the rotational frequency ($ \hbar $ ω) for band 11 (Fig. 12 [10]) exhibits an increase at the frequency ω$ _{1} $ , which is attributed to h$ _{11/2} $ neutrons. The experimental energy staggering plot, i.e., S(J) vs. J, in the quasirotational γ-band for the range of even isotopes in Xe nuclei, i.e.,$ ^{116-128} $ Xe, is shown in Fig. 2 (a) of Ref. [23]. The energy staggering parameter S(J) is considered as a key signature of the γ-dependence of the potential. The comparison of$ ^{118} $ Xe with other even isotopes reveals strong staggering with negative S(J) values at even J and positive S(J) values at odd J, which is associated with a γ-independent potential having a deformed γ-soft/γ-unstable structure. Additionally, the magnitude of staggering (see Fig. 2 (a) [23]) is observed to increase with the decreasing neutron number in the Xe nuclei. In Ref. [9], the alignment i$ _{x} $ calculated for the strongly coupled negative-parity band (band 1) in$ ^{118} $ Xe is shown (see Fig. 13 (a) [9]). According to a comparison of the B(M1)/B(E2) ratios with theoretical predictions (see Fig. 18 (a) [10]) and the observed alignment behavior, band 1 in$ ^{118} $ Xe was assigned to the π[(g$ _{9/2} $ )$ ^{-1} $ h$ _{11/2} $ ] configuration. In Ref. [10], a similar alignment pattern extracted for the observed low-lying decoupled negative-parity bands (see Fig. 14 [10]) and the interconnection of these two decoupled bands due to weak interlinking transitions of mixed ΔI = 1, M1/E2 character suggest that bands 3 and 4 are the signature partner bands based on the two-quasiproton π[h$ _{11/2} $ g$ _{7/2} $ ] configuration. Bands 3 and 4 decay to the positive parity yrast band via several interlinking transitions. The observation of the interlinking E1 transition between opposite parity bands is assumed to be indicative of octupole correlations. Keeping this in mind, observed interlinking transitions with ΔI = 1, i.e., Eγ = 1184, 1022, 846, 726 keV have been confirmed to have an electric nature in the present study, which is in agreement with the previous studies [9, 10]. One such interlinking transition (924 keV) was confirmed to have E1 multipolarity for the first time on the basis of angular correlation and A$ _{\rm as} $ measurements. Enhanced E1 strength is one of the spectroscopic measures of octupole correlation in the nuclei. The enhancement of the E1 strength can be deduced from the ratio of the reduced transition probabilities of the electric dipole B(E1; I$ \rightarrow $ I-1) and electric quadrupole B(E2; I$ \rightarrow $ I-2) transitions using the following relation:$ \begin{array}{*{20}{l}} \begin{split} \frac{B(E1)}{B(E2)} & = \frac{E_{\gamma}^{5}(E2)*I_{\gamma}(E1) }{ 1.3*10^{6}*E_{\gamma}^{3}(E1)*I_{\gamma}(E2) } {\rm fm}^{-2} \\ \end{split} \end{array} $

(4) where E
$ _{\gamma} $ is in MeV and B(E1)/B(E2) is in fm$ ^{-2} $ . The B(E1)/B(E2) ratios estimated using this relation are presented in Table 2. To give a more clearer view of the present data, a comparison of the B(E1) values with those obtained in the previous work [10] is shown in Fig. 8. Except for I = 7$ \hbar $ , the observed B(E1) values are found to be lower than the B(E1) values reported by Sears et al. [10]. The reduction in the B(E1) values in the present work is found to be due to the observed low intensity of the interband transition relative to the corresponding intraband transition, as a different reaction is chosen to populate high spin states. The present B(E1) values are clearly more precise than the earlier work, except for I = 7$ \hbar $ , which has a large fitting error solely due to the low statistics of the 424 keV (7$ ^{-} $ $ \rightarrow $ 5$ ^{-} $ ) transition. The observed transition rates are comparable to those found in$ ^{114} $ Xe [24] and$ ^{118} $ Ba [6] and are understood as evidence for octupole correlations related to the νh$ _{11/2} $ and νd$ _{5/2} $ orbitals. The intrinsic electric dipole moment D$ _{0} $ has been estimated using the following relation:Band Q $ _0 $ 

$ ^a $ 

I $ ^{\pi}_{i} $ 

$ \rightarrow $ I

$ ^{\pi}_{f} $ 

B(E1)/B(E2) B(E1) B(E1)(10 $ ^{-4} $ e

$ ^2 $ fm

$ ^2 $ )

D $ _0 $ 

(e b) (10 $ ^{-7} $ fm

$ ^{-2} $ )

(10 $ ^{-4} $ e

$ ^2 $ fm

$ ^2 $ )

Sears et al. (e fm) 3 3.55 7 $ ^{-} $ 

$ \rightarrow $ 6

$ ^{+} $ , 7

$ ^{-} $ 

$ \rightarrow $ 5

$ ^{-} $ 

1.48(23) 5.93(95) 3.50(14) 0.076(6) 9 $ ^{-} $ 

$ \rightarrow $ 8

$ ^{+} $ , 9

$ ^{-} $ 

$ \rightarrow $ 7

$ ^{-} $ 

0.61(1) 2.53(6) 3.42(16) 0.048(1) 11 $ ^{-} $ 

$ \rightarrow $ 10

$ ^{+} $ , 11

$ ^{-} $ 

$ \rightarrow $ 9

$ ^{-} $ 

0.13(1) 0.57(3) 1.79(51) 0.023(1) 4 8 $ ^{-} $ 

$ \rightarrow $ 8

$ ^{+} $ , 8

$ ^{-} $ 

$ \rightarrow $ 6

$ ^{-} $ 

0.23(2) 0.88(7) 1.69(27) 0.029(3) $^a$ Q

$_{0}$ is taken from the previous study [10].

Table 2. B(E1)/B(E2) ratios and a comparison of the reduced transition probabilities, i.e., B(E1), from the present work and those reported in Ref. [10] in
$ ^{118} $ Xe.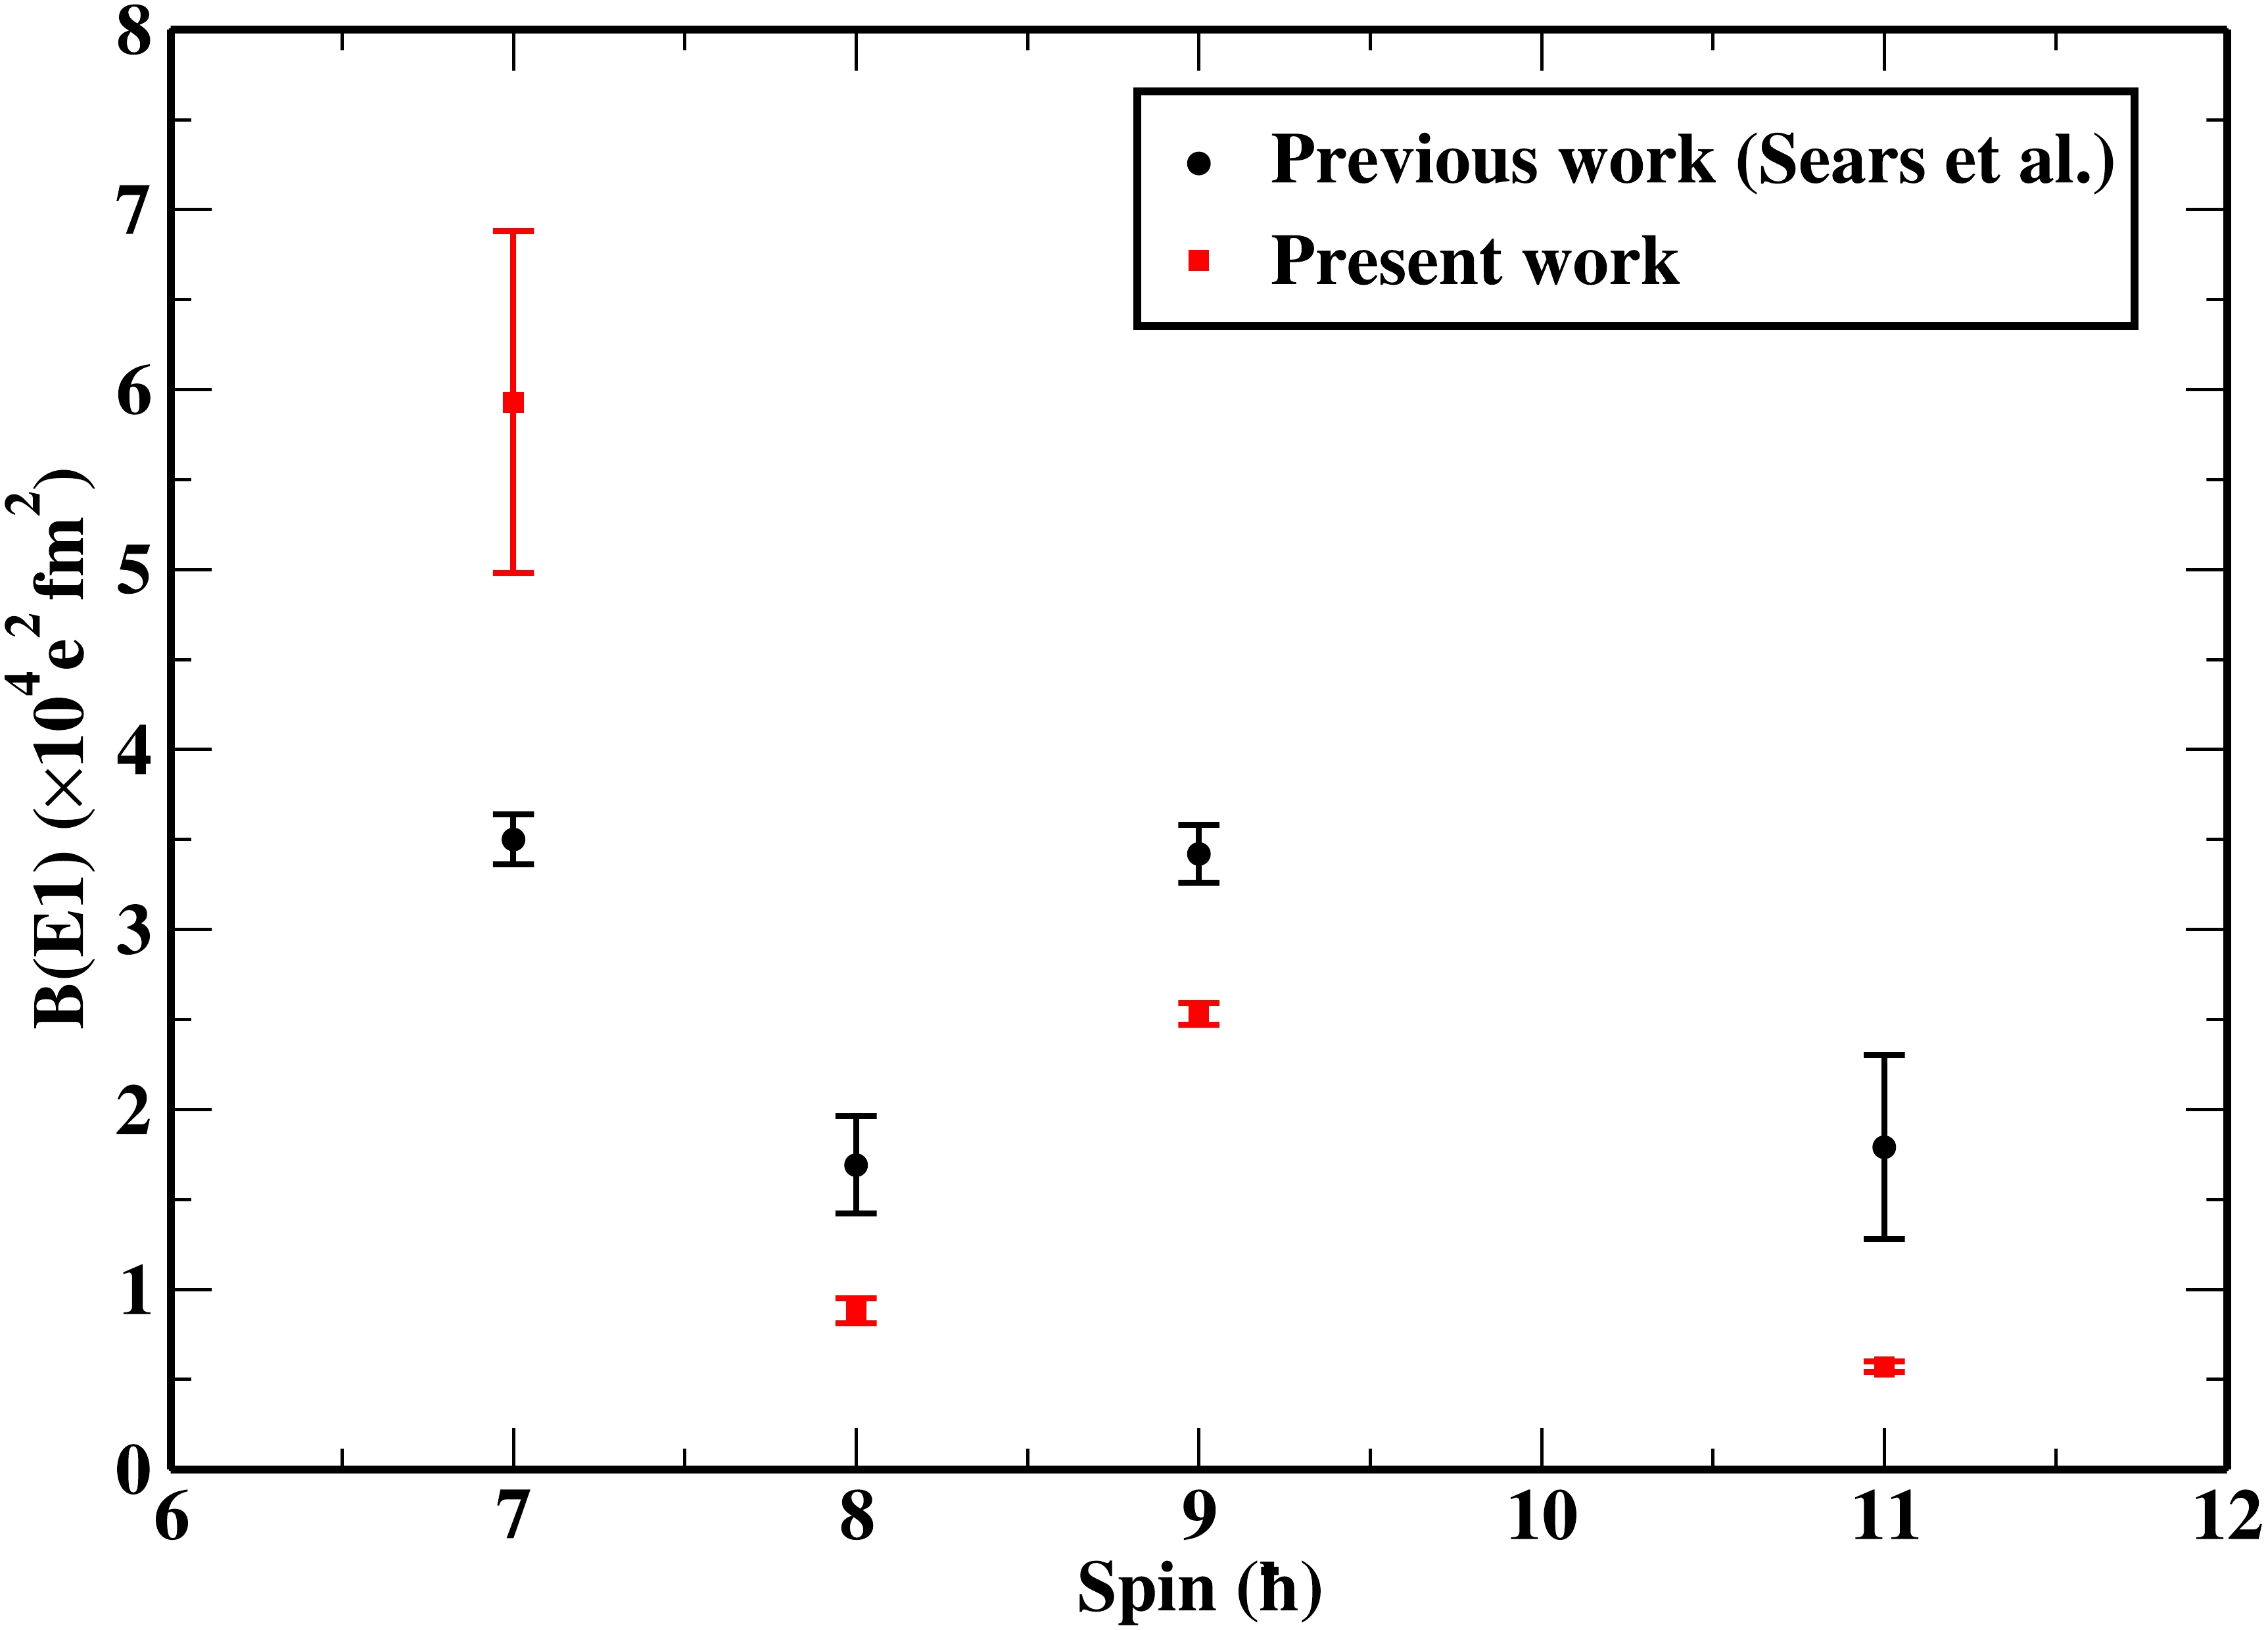
Figure 8. (color online) B(E1) transition strengths obtained in the present work compared with those reported in the previous work [10]. More precise data on B(E1) values are presented in the present work barring the B(E1) value at I = 7
$ \hbar $ .$ \begin{array}{*{20}{l}} \begin{split} D_{0} & = Q_{0}* \left [\frac{5}{16}*\frac{B(E1)}{B(E2)}\right]^{1/2} {\rm e fm} \\ \end{split} \end{array} $

(5) where Q
$ _{0} $ represents the intrinsic quadrupole moment. -
In order to provide a microscopic description of the observed band structures, we performed a TPSM [25] study of
$ ^{118} $ Xe. TPSM works in several stages, and in the first stage, the triaxial basis is generated by solving the deformed Nilsson potential with the deformation parameters of$ \epsilon $ =0.225 and$ \epsilon' = 0.13 $ . The axial deformation parameter$ \epsilon $ has been chosen by slightly adjusting the tabulated value given in Ref. [26]. This re-ajustment of the tabulated values is required as the nuclear model employed in the present analysis differs from that used in Ref. [26]. The nonaxial deformation$ \epsilon' $ is fixed in such a way that the bandhead of the γ-bands is reproduced; this procedure was adopted in most of the previous studies [27−29]. The non-axial deformation value is consistent with the value obtained from the minimum of the potential energy surface shown in Fig. 9. In this figure, the projected ground-state energy is drawn as a function of the triaxial parameter with the axial deformation parameter fixed. It needs to be emphasised that these deformation parameters are used to solve the triaxial potential from which the deformed basis space of the TPSM is constructed. In principle, the final results should be independent of the deformation used in constructing the basis space. However, in practice, a limited basis space is employed, and the final results are dependent on the basis deformation. It is, therefore, important to choose optimum deformation values. The pairing interaction parameters employed in the present work are those used in Refs. [30, 31].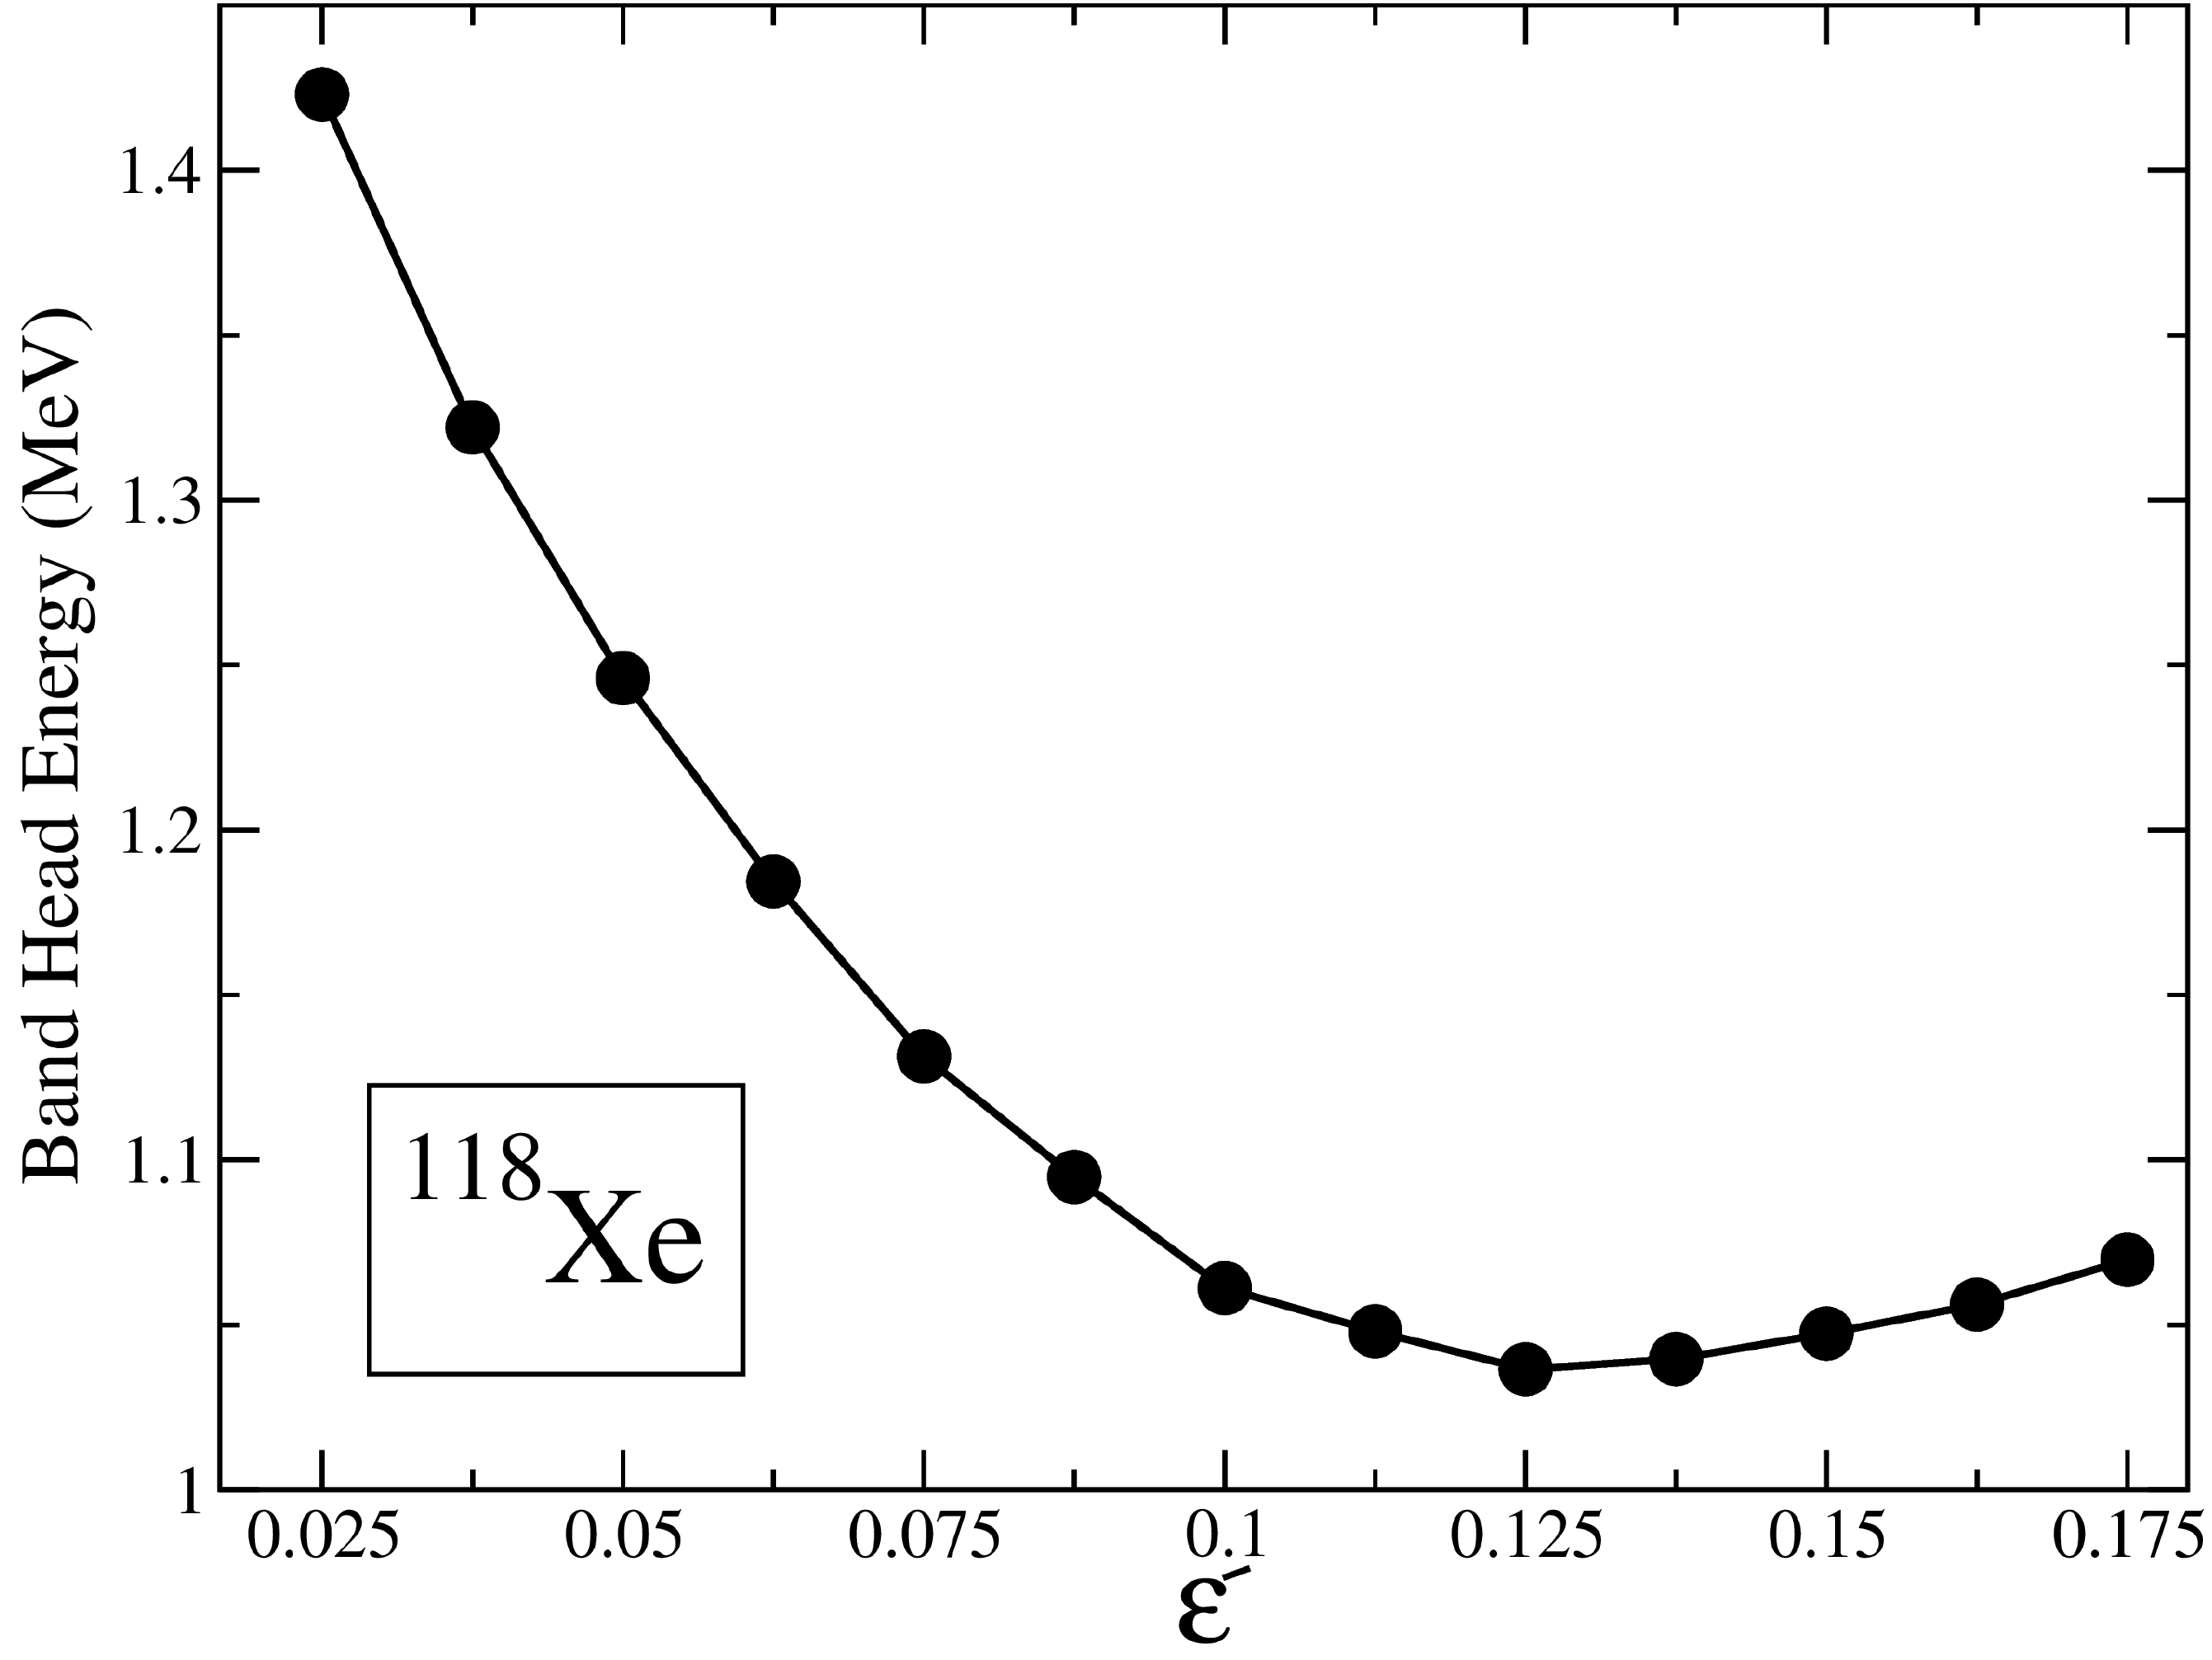
Figure 9. Variation of the ground-state projected energy surfaces as a function of triaxiality
$ \epsilon' $ for the$ ^{118} $ Xe nucleus.In the second stage of the TPSM study, the projected states are generated by using the three-dimensional angular-momentum projection technique. In the third and final stage, the projected basis is used to diagonalise the shell model Hamiltonian consisting of pairing plus quadrupole-quadrupole interaction terms. Details on the technical aspects of the model can be found in our previous publications [32−35]
For this system, high-spin states have been observed up to I=36, and in order to interpret such high-spin states, it is essential to include 4-neutron and 4-proton quasiparticle (qp) configurations in addition to 2-neutron and 2-proton excitations. In the present work, the TPSM basis is composed of 0-qp (qp vacuum), two-proton, two-neutron, 4-qp, 4 neutron, and 4 proton configurations, i.e.,
$ \begin{array}{*{20}{l}} \begin{array}{r} \hat P^I_{MK}{\,|\,}\Phi{ >\,};\\ \; \; \hat P^I_{MK}\; a^\dagger_{p_1} a^\dagger_{p_2} {\,|\,}\Phi{ >\,};\\ \; \; \hat P^I_{MK}\; a^\dagger_{n_1} a^\dagger_{n_2} {\,|\,}\Phi{ >\,};\\ \; \; \hat P^I_{MK}\; a^\dagger_{p_1} a^\dagger_{p_2} a^\dagger_{n_1} a^\dagger_{n_2} {\,|\,}\Phi{ >\,} ;\\ \; \; \hat P^I_{MK}\; a^\dagger_{n_1} a^\dagger_{n_2} a^\dagger_{n_3} a^\dagger_{n_4} {\,|\,}\Phi{ >\,} ;\\ \; \; \hat P^I_{MK}\; a^\dagger_{p_1} a^\dagger_{p_2} a^\dagger_{p_3} a^\dagger_{p_4} {\,|\,}\Phi{ >\,} , \end{array} \end{array} $

(6) where
$ {\,|\,} \Phi{ >\,} $ represents the vacuum state, and the three-dimensional angular-momentum projection operator [36] is given by$ \hat P^I_{MK} = \frac{2I+1}{8\pi^2} \int {\rm d}\Omega\, D^{I}_{MK}(\Omega)\, \hat R(\Omega), $

(7) with
$ \hat R(\Omega) $ being the rotation operator in terms of Euler angles. The$ {\,|\,} \Phi{ >\,} $ in the TPSM approach is the triaxial quasiparticle vacuum state, and the angular-momentum projection operator in Eq. (7) projects not only the good angular-momentum but also states having good K-values.TPSM calculations for positive parity states have been performed by considering both neutrons and protons occupying the three major oscillator shells of
$ N=3,~4 $ , and$ 5 $ . The projected bands from the intrinsic Nilsson + Bardeen–Cooper–Schrieffer (BCS) states in the vicinity of the Fermi surface are depicted in Fig. 10. It is noted from Fig. 10 that the ground state band having$ {K}=0 $ is crossed by the two-neutron aligned configuration with$ K=1 $ at I=12. More interestingly, the K=3 two-quasiparticle band, having the same intrinsic wave function as the K=1 band, also crosses the ground state band at spin I = 16$ \hbar $ . It is therefore expected that apart from the K=1 s-band that becomes yrast after the crossing at I=12, a parallel s-band, which is a γ-band built on the two-quasiparticle band, will track the yrast band. The normal γ-band based on the ground-state band with K=2 is located at an excitation energy of approximately 0.9 MeV from the ground-state. The two-proton configurations are noted to be quite high in energy and do not appear to become yrast up to quite a high-spin.
Figure 10. (color online) Band diagram for the
$ ^{118} $ Xe nucleus. The labels (0,0,Vacuu.), (2,0,Vacuu.), (4,0,Vacuu.), (1,2n), (3,2n), (1,2p), (3,2p), (0,2n2p), (2,2n2p), and (4,2n2p) correspond to the ground state band and the following bands: γ, 2γ, two neutron-aligned, γ-band on this two neutron-aligned state, two proton-aligned, γ-band on this two proton-aligned state, two-neutron plus two-proton aligned, and$ \gamma- $ and$ \gamma\gamma- $ bands built on this four-quasiparticle state. The excited K=0 bands resulting from the projection of two-quasineutrons and two-quasiprotons are denoted by (0,2n) and (0,2p), respectively. Some bands having large signature splitting are separated into even-spin (labeled as$ \alpha=0 $ ) and odd-spin states (labeled as$ \alpha=1 $ ). The first crossing at I=12 is due to the 2n K=1 aligned configuration that forms the S-band configuration. The second and third crossings at approximately I=22 and 36 are due to the aligning 2n2p and 4n configurations.The projected bands from four-neutron and four-proton quasiparticle configurations are also plotted in Fig. 10, and the band structures obtained from these states lie at a higher excitation energy than the two-neutron+ two-proton quasiparticle bands. It is noted that the
$ \alpha=0 $ component of the four-neutron quasiparticle state, having K=2, crosses the yrast-state band at I=34. The projected band from the K=4 component of the four-neutron state also crosses the ground-state at a higher spin value. In contrast, the$ \alpha=1 $ branch of this configuration and the four-proton quasiparticle band structures lie at higher excitation energies.The obtained band structures after diagonalization of the shell model Hamiltonian are compared with the experimental data in Fig. 11. It is evident from Fig. 11 that the TPSM approach reproduces the experimental data reasonably well. The calculated band structures have been plotted using the wavefunction analysis shown in Fig. 12, as was done for
$ ^{156} $ Dy [34].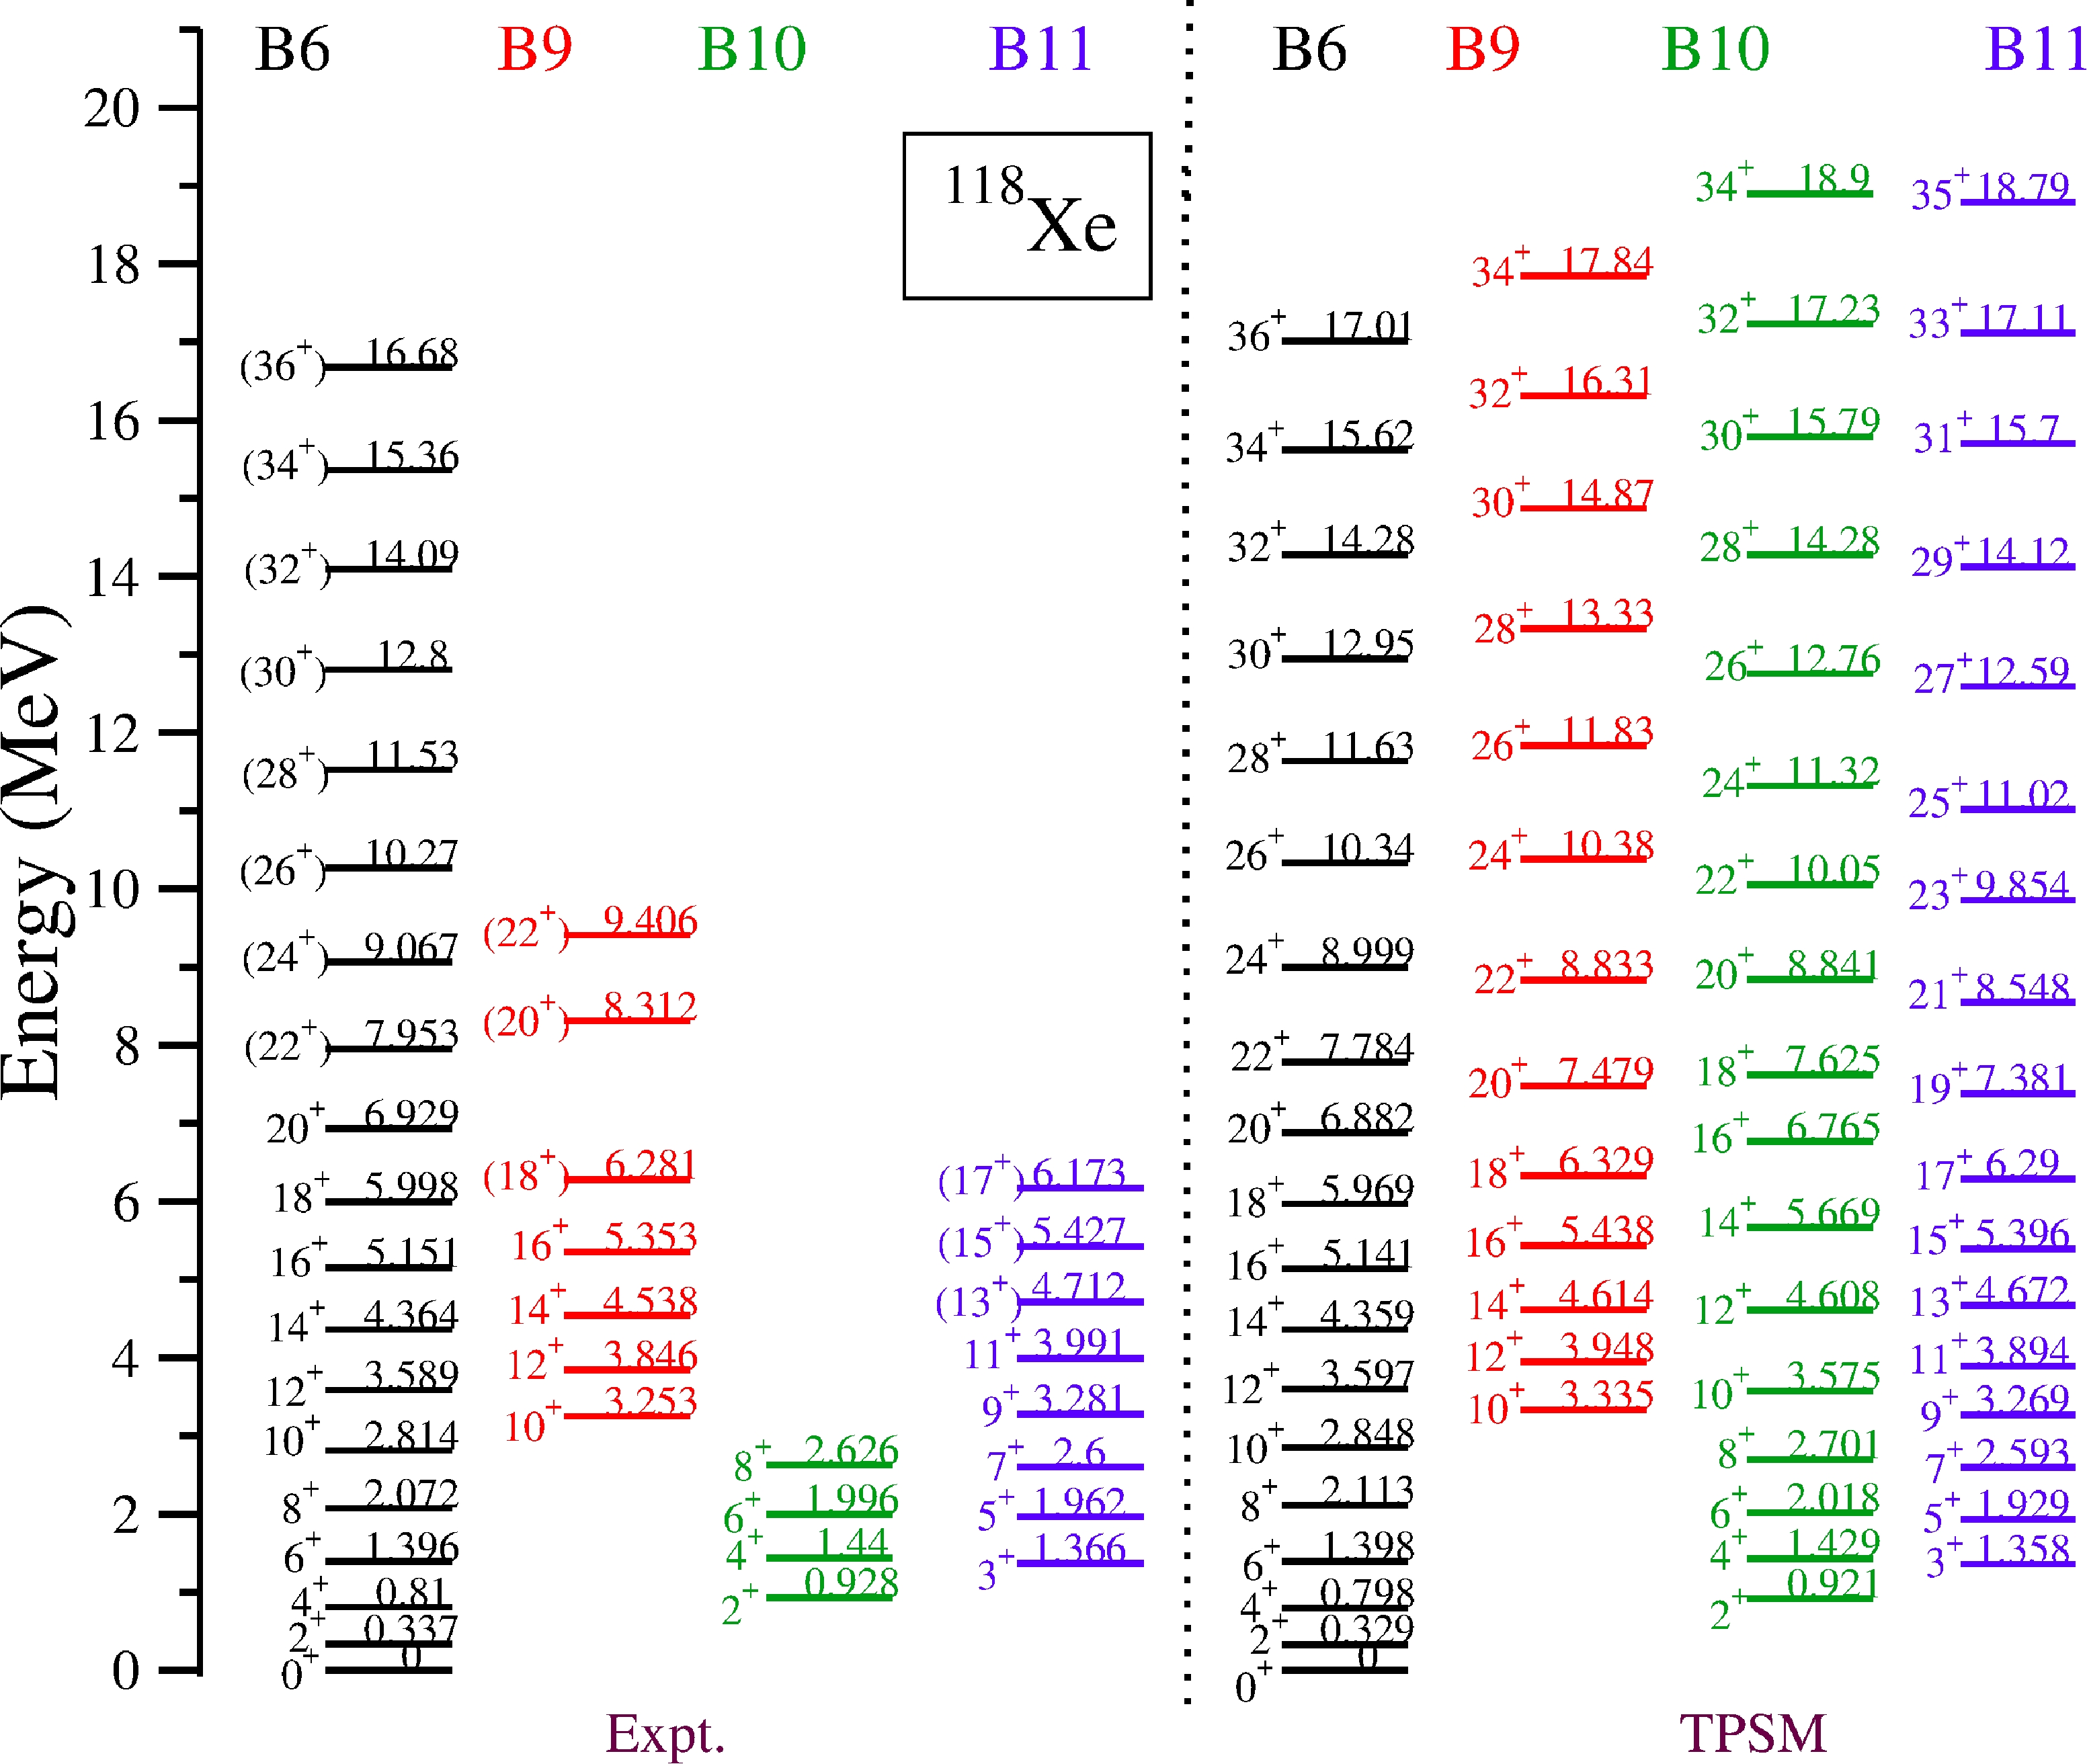
Figure 11. (color online) Comparison of the calculated positive parity band energies with present experimental data (bands B6, B9, B10, and B11) for
$ ^{118} $ Xe.
Figure 12. (color online) Probabilities of various projected K-configurations in the wavefunctions of the observed postive parity bands for
$ ^{118} $ Xe. For clarity, only the lowest projected K-configurations in the wavefunctions of bands are shown. In the numerical calculations, projection has been performed from 44 intrinsic states. The probabilities |a$ ^{I}_{\kappa} $ $ _K $ |$ ^2 $ of various bands are labeled as in Fig. 10.We would like to add that there has been some controversy regarding the nature of the bandcrossings in
$ ^{118,120} $ Xe isotopes [9, 10]. It has been argued based on the systematics of the bandcrossings in the neighboring isotopes, in particular, to those of$ ^{120,122} $ Ba, that the first bandcrossing should be due to the alignment of two-protons [10]. However, the cranked shell model analysis predicts the first crossing to be due to neutrons, as for heavier isotopes [10]. It is evident from the present TPSM study that the first bandcrossing is also due to the alignment of two neutrons, as can be seen from Fig. 10. In order to further investigate the bandcrossing properties of the yrast band, we have extracted the aligned angular-momentum from the calculated quantities and the results are plotted in Fig. 13 as a function of the rotational frequency. It can be noted from Fig. 13 that the bandcrossing frequency as well as the gain in the alignment is well reproduced by the TPSM calculations. We would like to add that in the earlier study [8], the bandcrossing due to neutrons was disregarded, as the experimentally deduced gain in the alignment was smaller than that predicted by the cranked shell model approach. In the present analysis using the TPSM approach, three band crossing frequencies and the gain in the alignment are reproduced. The first crossing is inferred to be due to the alignment of two neutrons, the second results from a four-quasiparticle configuration, and the third results from a four-neutron configuration.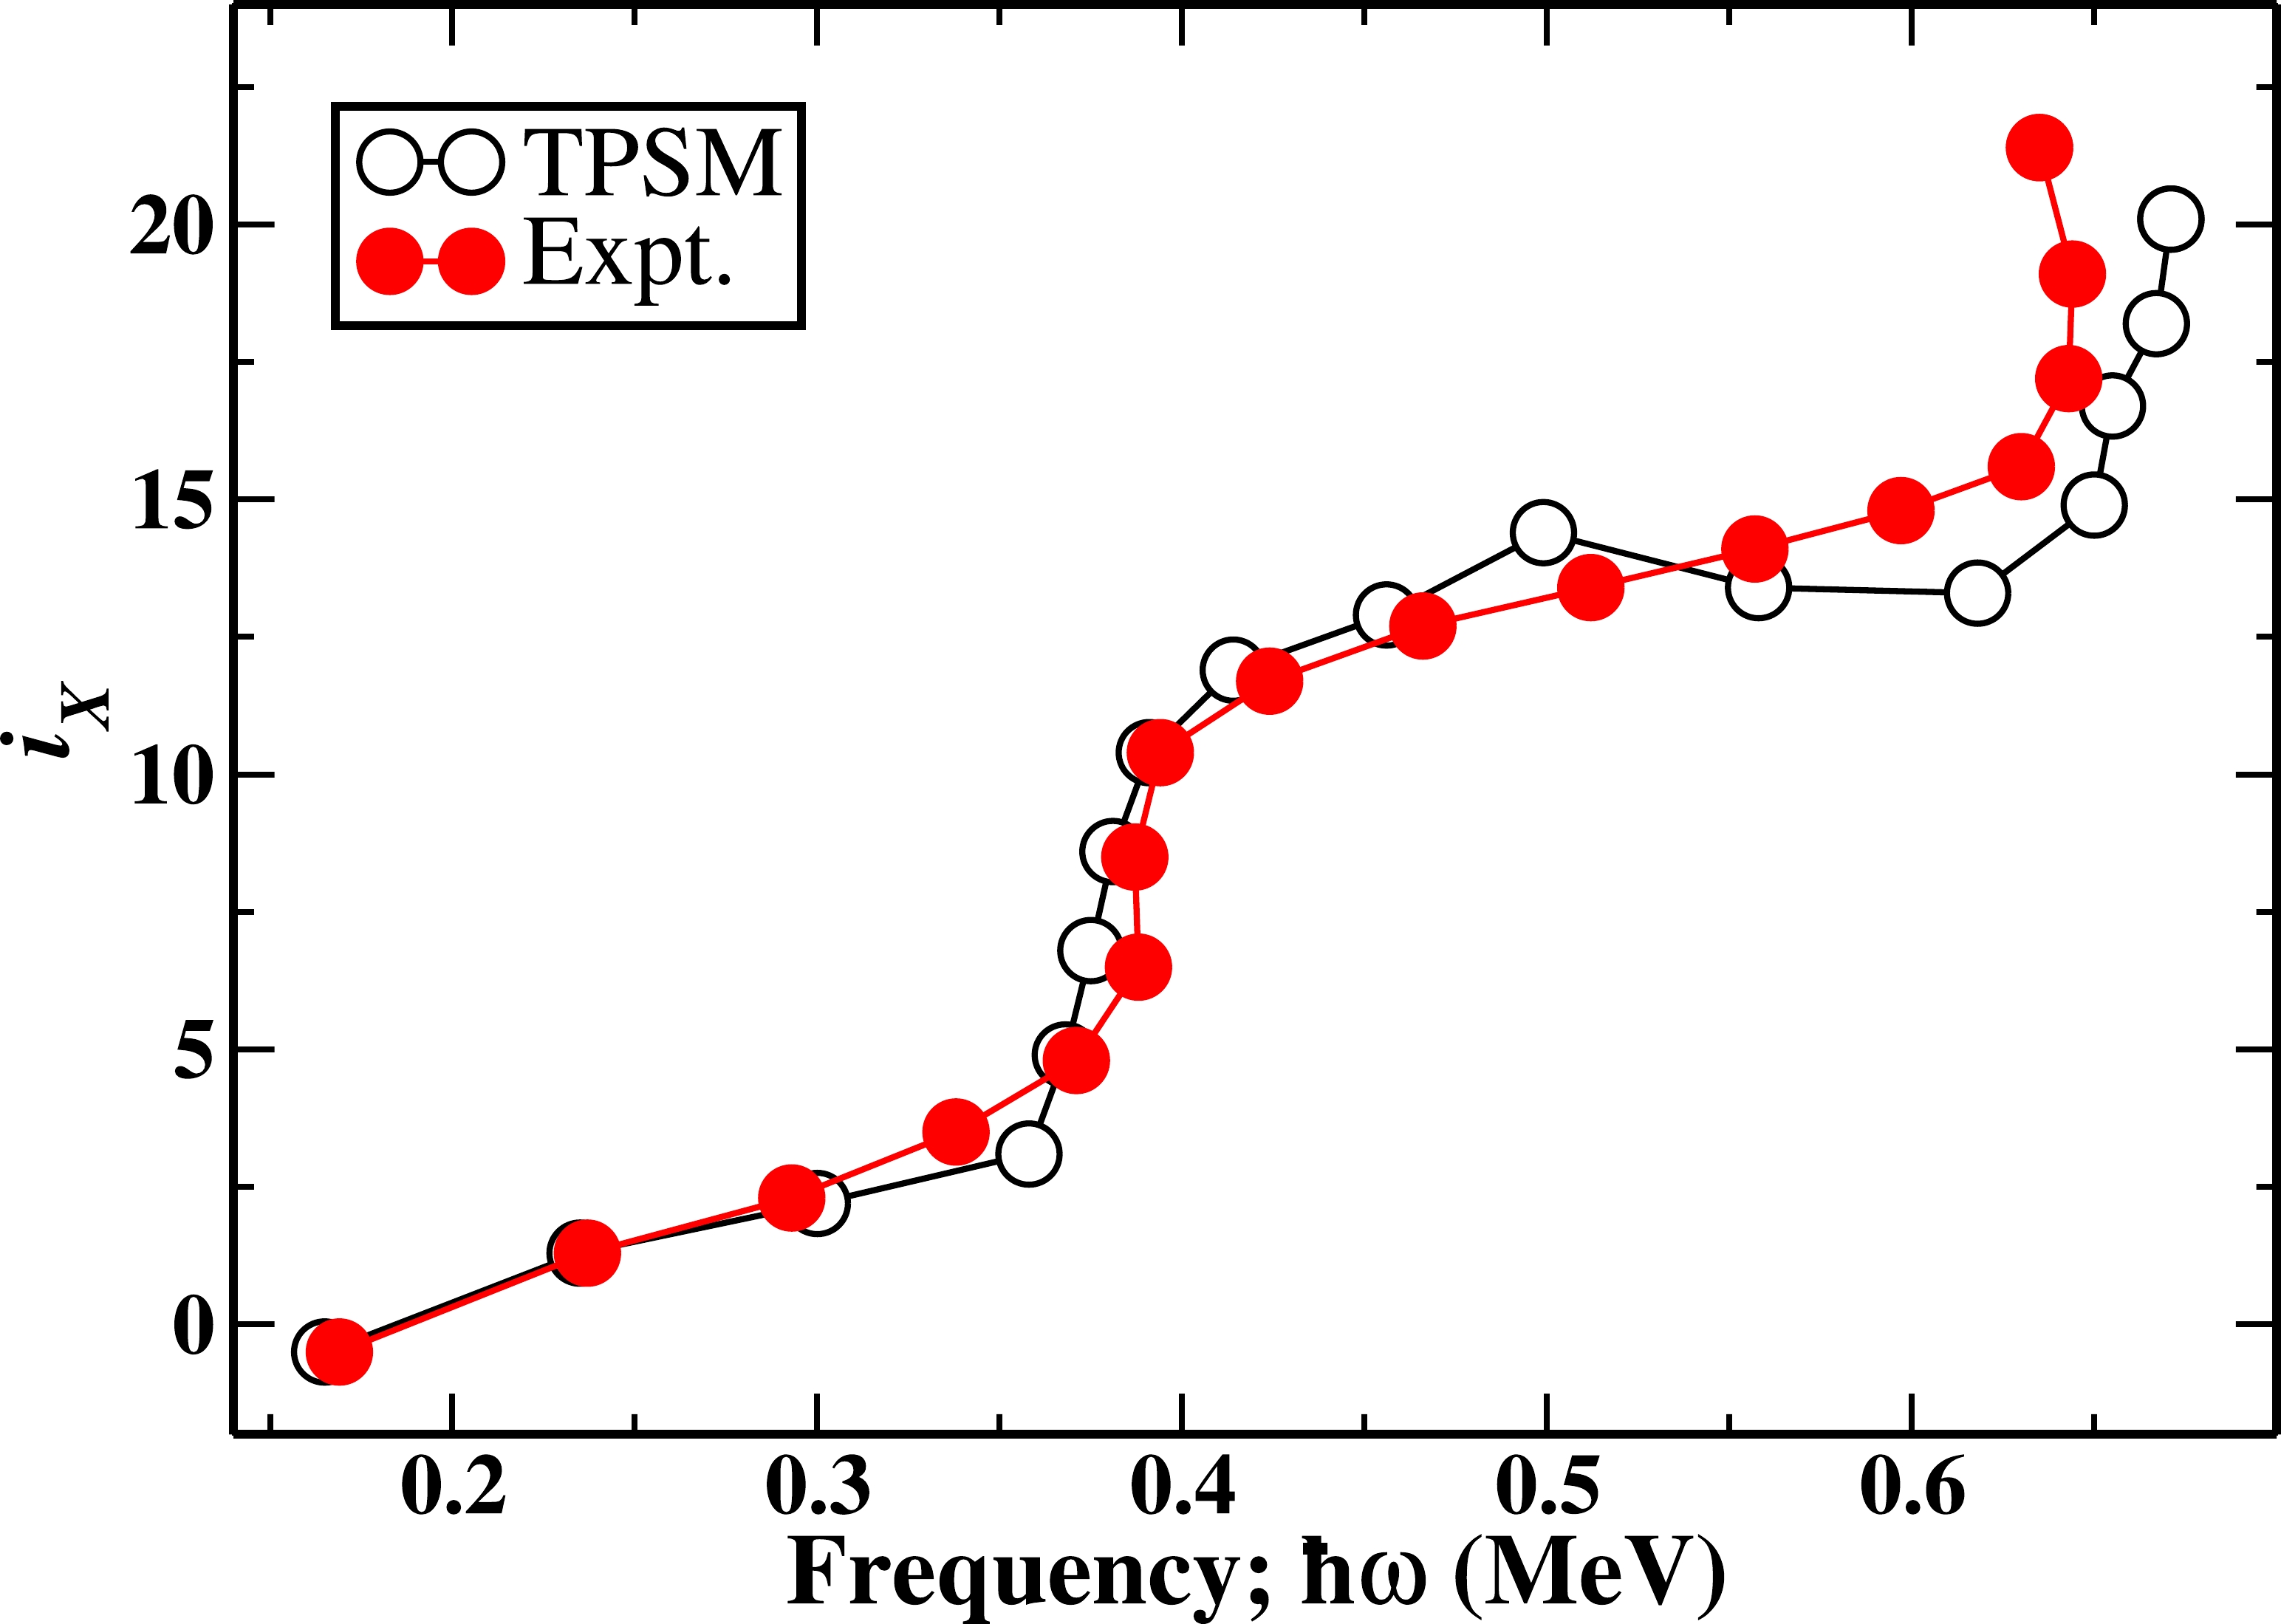
Figure 13. (color online) Comparison of the aligned angular momentum,
$i_x=I_x(\omega)-I_{x,{\rm ref}}(\omega)$ , where$ \hbar\omega=\frac{E_{\gamma}}{I_x^i(\omega)-I_x^f(\omega)} $ ,$ I_x(\omega)= \sqrt{I(I+1)-K^2} $ , and$I_{x,{\rm ref}}(\omega)=\omega(J_0+\omega^{2}J_1)$ . The reference band Harris parameters used are$ J_0 $ =23 and$ J_1 $ =90, which are obtained from the measured positive parity energy levels, as well as those calculated from the TPSM results, for the$ ^{118} $ Xe nucleus.We also performed the TPSM investigation of the negative parity bands observed in
$ ^{118} $ Xe with the same parameters used to describe the positive parity states. In order to generate the negative parity yrast states in an even-even system, which are basically two-quasiparticle states, where one neutron is in the N=4 shell and the second neutron of the two-quasiparticle state in the N=5 shell. Normal two-neutron and two-proton configurations are also constructed based on the basic two-quasiparticle configuration, and the details shall be provided in a separate study [37]. The TPSM results for the negative parity bands are compared with the experimental data in Fig. 14, and the results are noted to be in good agreement with the data. As is evident from Fig. 15, which provides the probabilities of various configurations in the wavefunctions, band B1 is dominated by a two-neutron state having quasiparticle energy of 0.907 MeV and projected to K=3 and 7 configurations.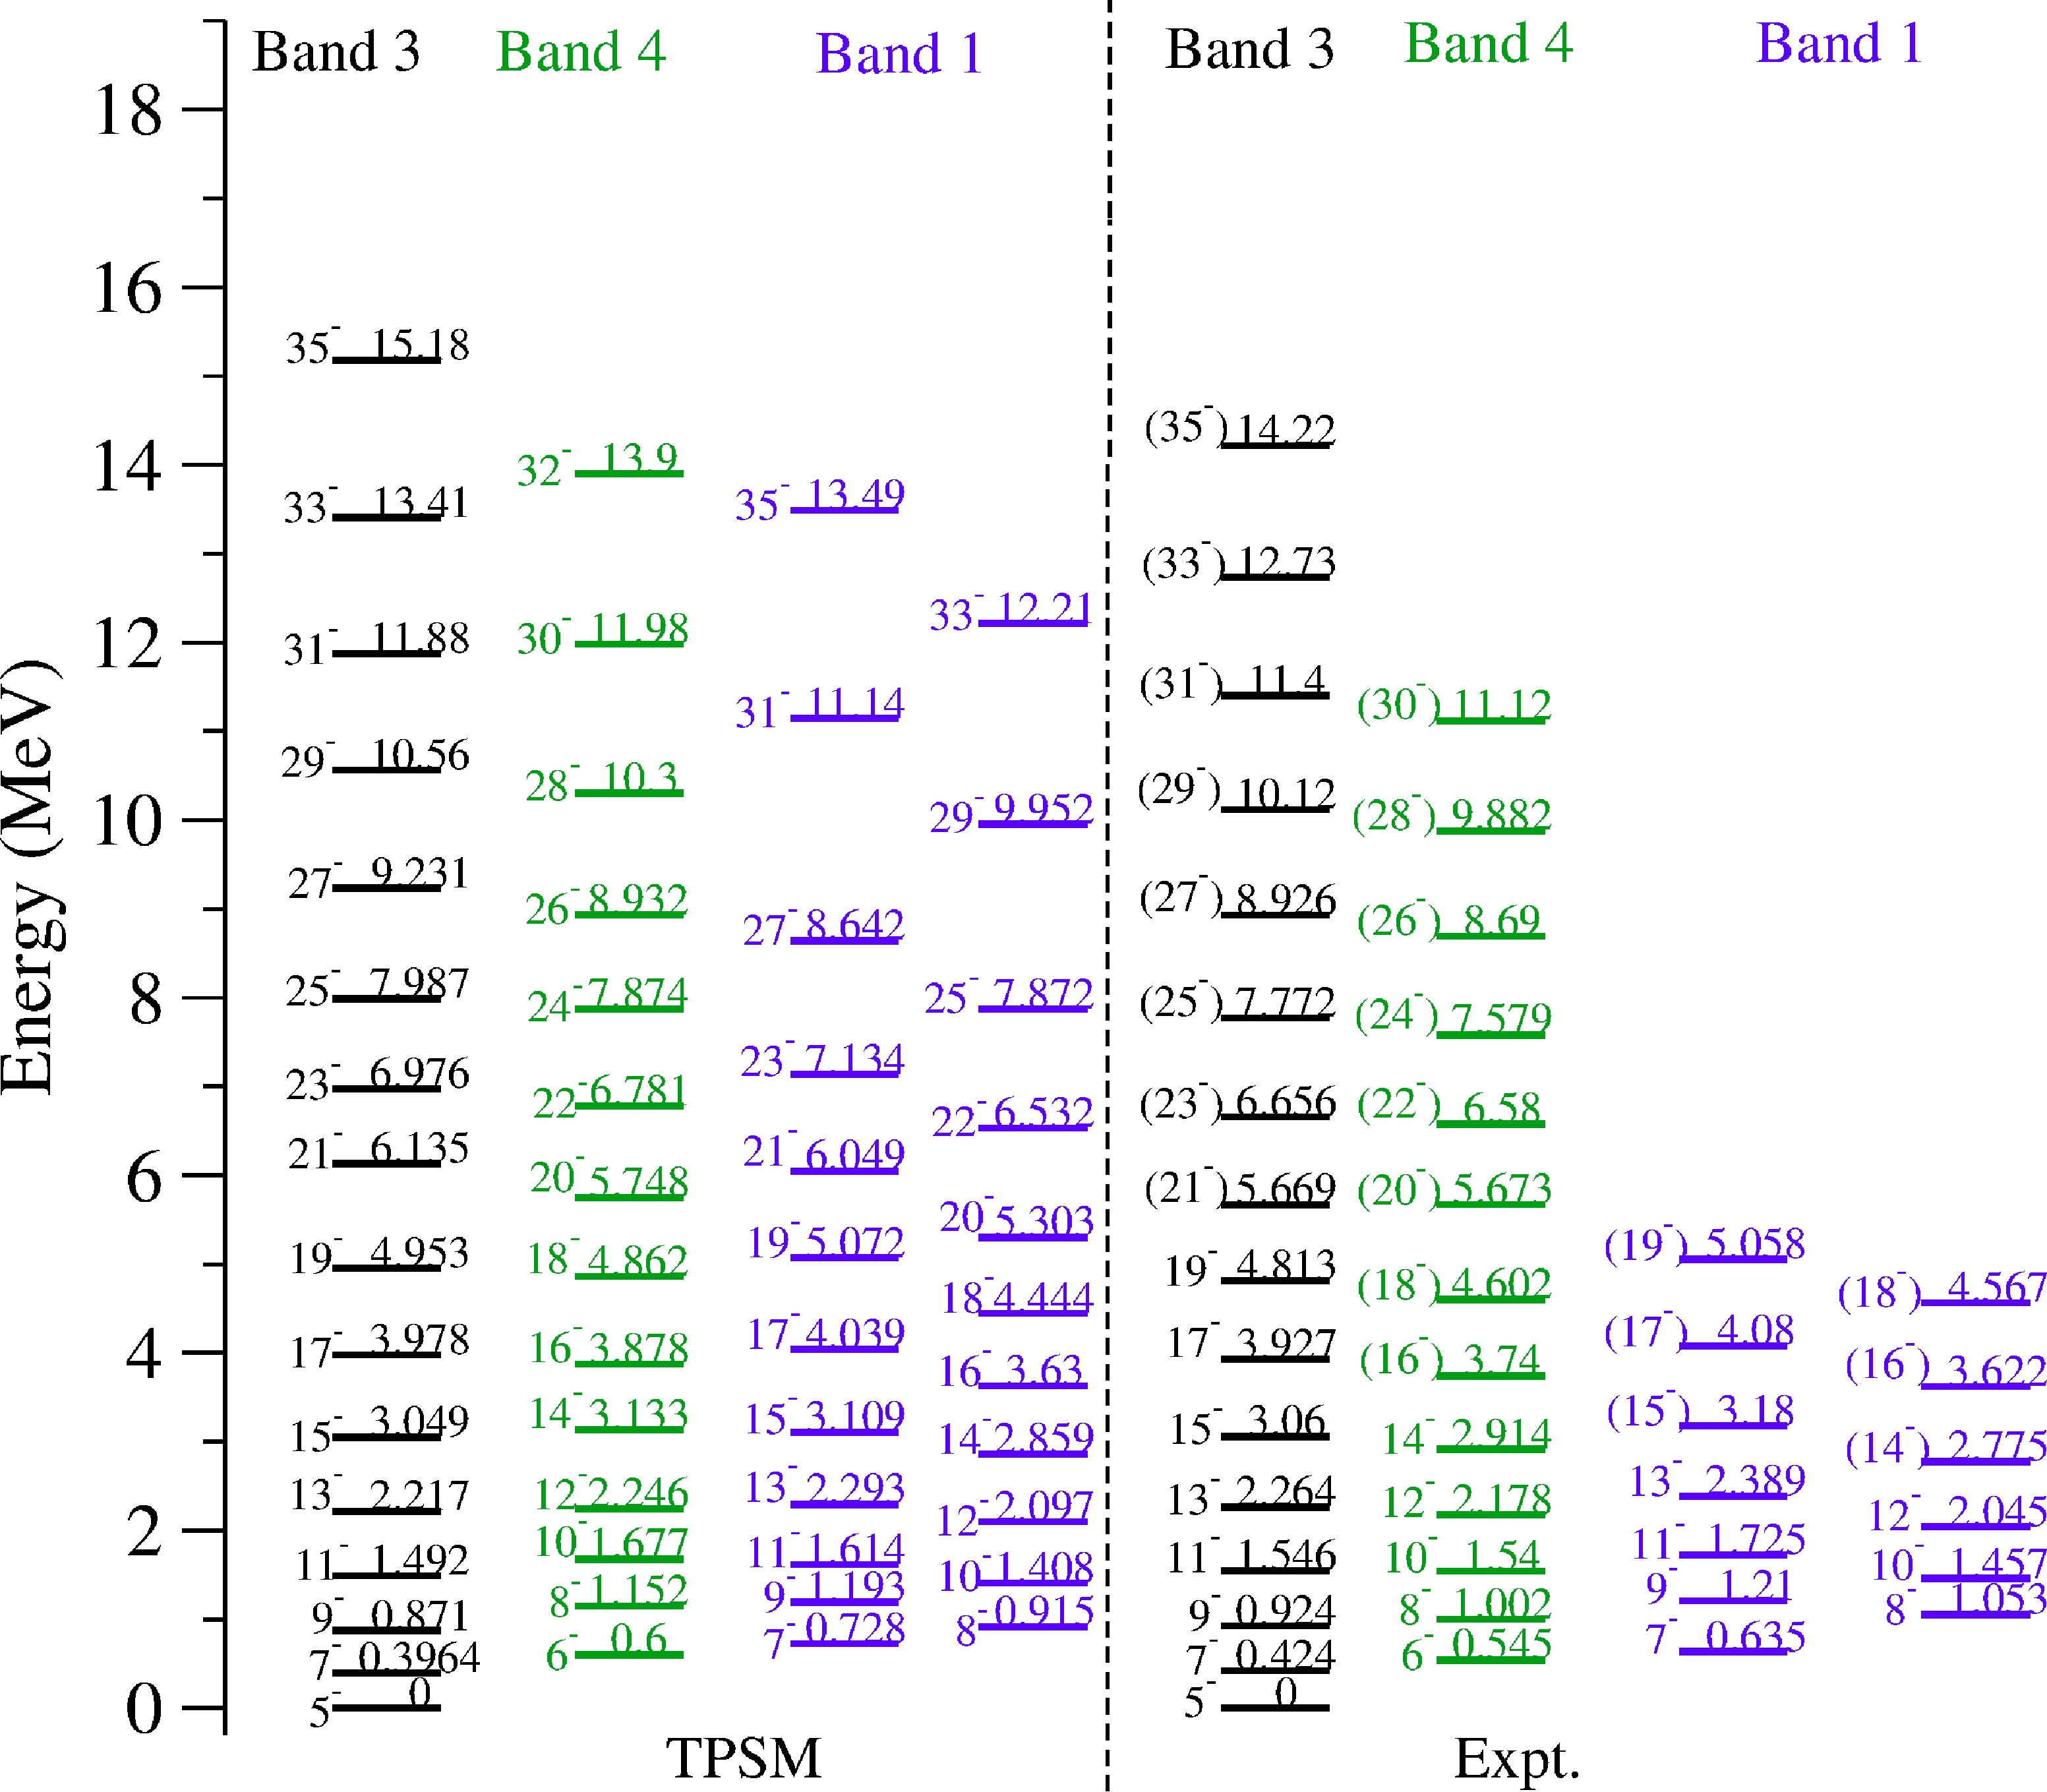
Figure 14. (color online) Comparison of the calculated negative parity band energies with present experimental data (bands B3, B4, and B1) for
$ ^{118} $ Xe.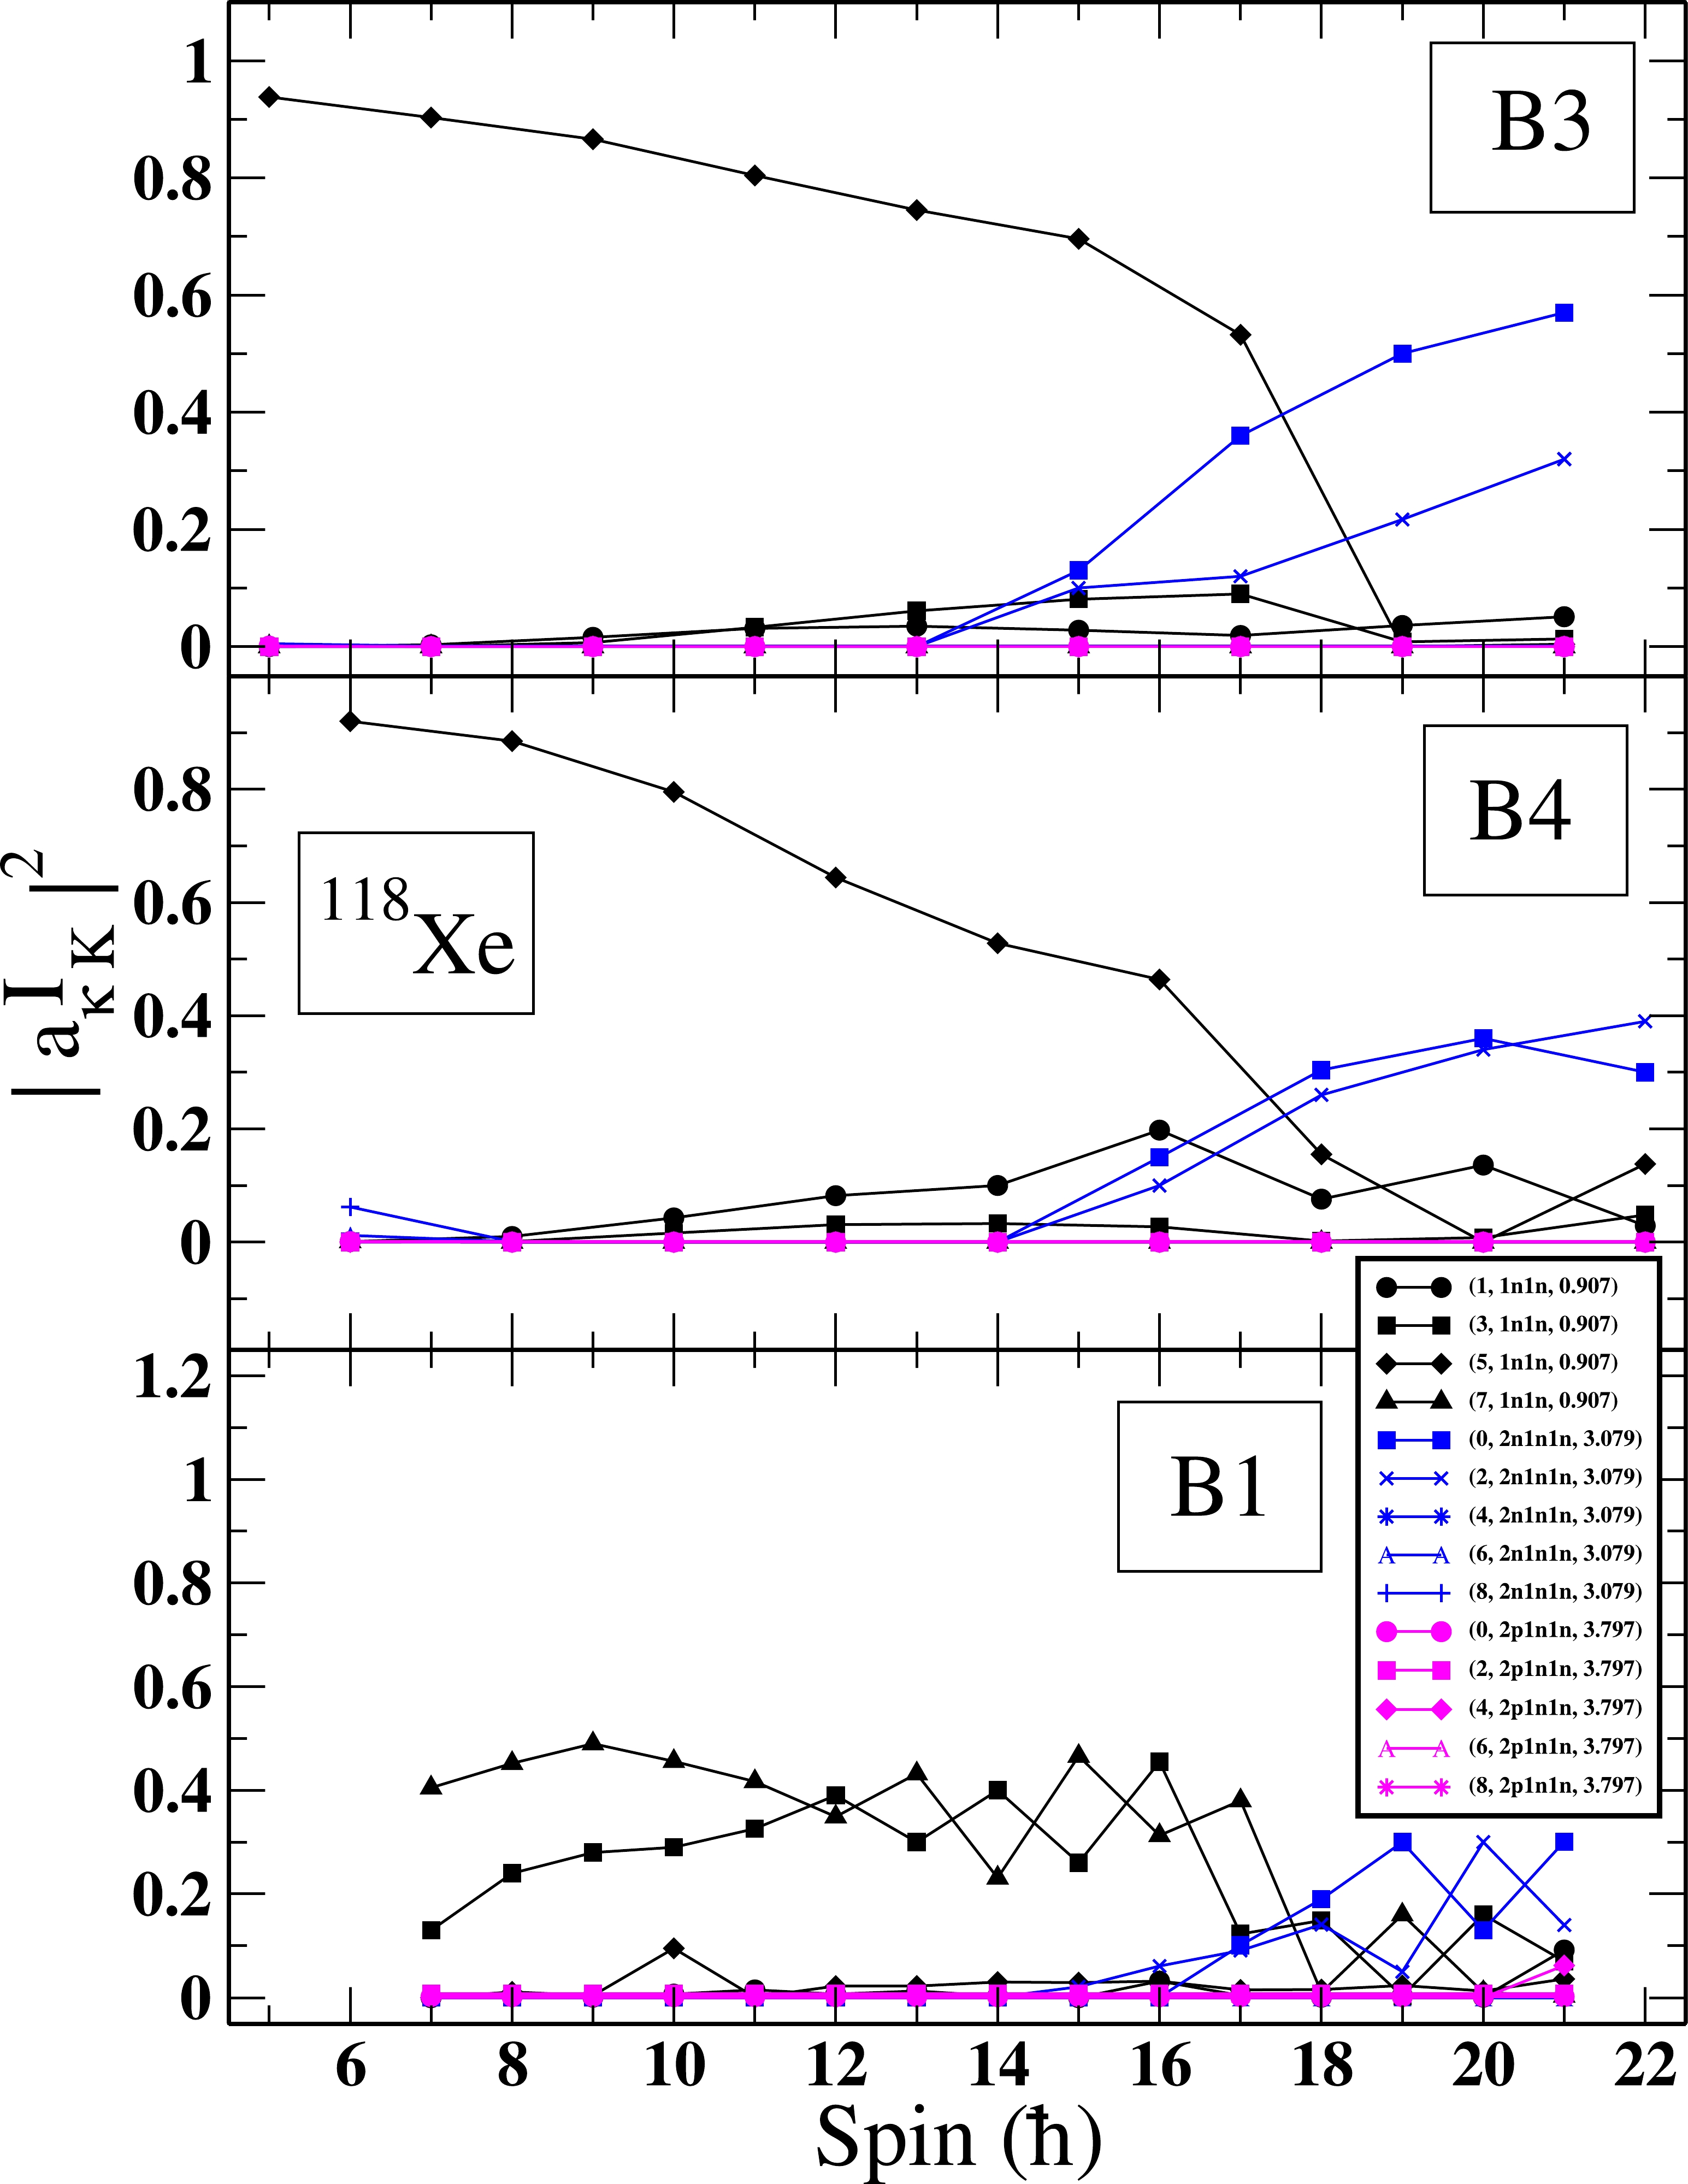
Figure 15. (color online) Probabilities of various projected K-configurations in the wavefunctions of the observed negative parity bands for
$ ^{118} $ Xe. For clarity, only the lowest projected K-configurations in the wavefunctions of bands are shown, and in the numerical calculations, the projection has been performed from 44 intrinsic states.We would like to add that the TPSM approach conserves the parity quantum number at the mean-field level, as octupole correlations are not considered. The enhanced
$ E1 $ transitions observed in the experimental study, which indicate the possible presence of the octupole correlations, cannot be studied using the present version of the TPSM approach. We are in the process of generalizing the model to incorporate the octupole-octupole interaction, and the$ E1 $ transitions observed shall be investigated in future.Furthermore, inspired by the recent experimental data [38], we extend the TPSM calculations to study the low spin yrast and γ-band transitional probabilities. Electric quadrupole transition probabilities are calculated using the eigenfunctions obtained from the diagonalization of the Hamiltonian [34] within the chosen set of the TPSM basis. The reduced electric quadrupole transition probability
$ B(E2) $ from an initial state$ (\sigma_i, I_i) $ to a final state$ (\sigma_f, I_f) $ is given by$ B(E2,I_i \rightarrow I_f) = {\frac {{\rm e}^2} {2 I_i + 1}} | {\,< } \sigma_f , I_f || \hat Q_2 || \sigma_i , I_i{ >\,} |^2 . $

(8) where
$ \hat{Q_2} $ is related to the quadrupole operator [34]. As in our earlier publications [35, 37], we have used the effective charges of 1.5e for protons and 0.5e for neutrons. The effective charges are employed instead of the bare charges, as the core is used in the TPSM, and valence particles occupy only three major oscillator shells. The major emphasis here is to introduce transitional probabilities to elucidate the recent measurement of the lifetimes of$ ^{118} $ Xe along the yrast line [38]. The data depict a rapid variation of the B(E2) transition probabilities along the yrast band with probabilities showing an increasing trend for low-spin states and dropping for high-spin states. In Fig. 16, the TPSM calculated B(E2) transition probabilities are compared with the available theoretical and experimental results [38]. It is noted from the figure that the TPSM results reproduce the experimental trend for the known values reasonably well and are also in good agreement with those predicted by IBM calculations with fitted parameters [38].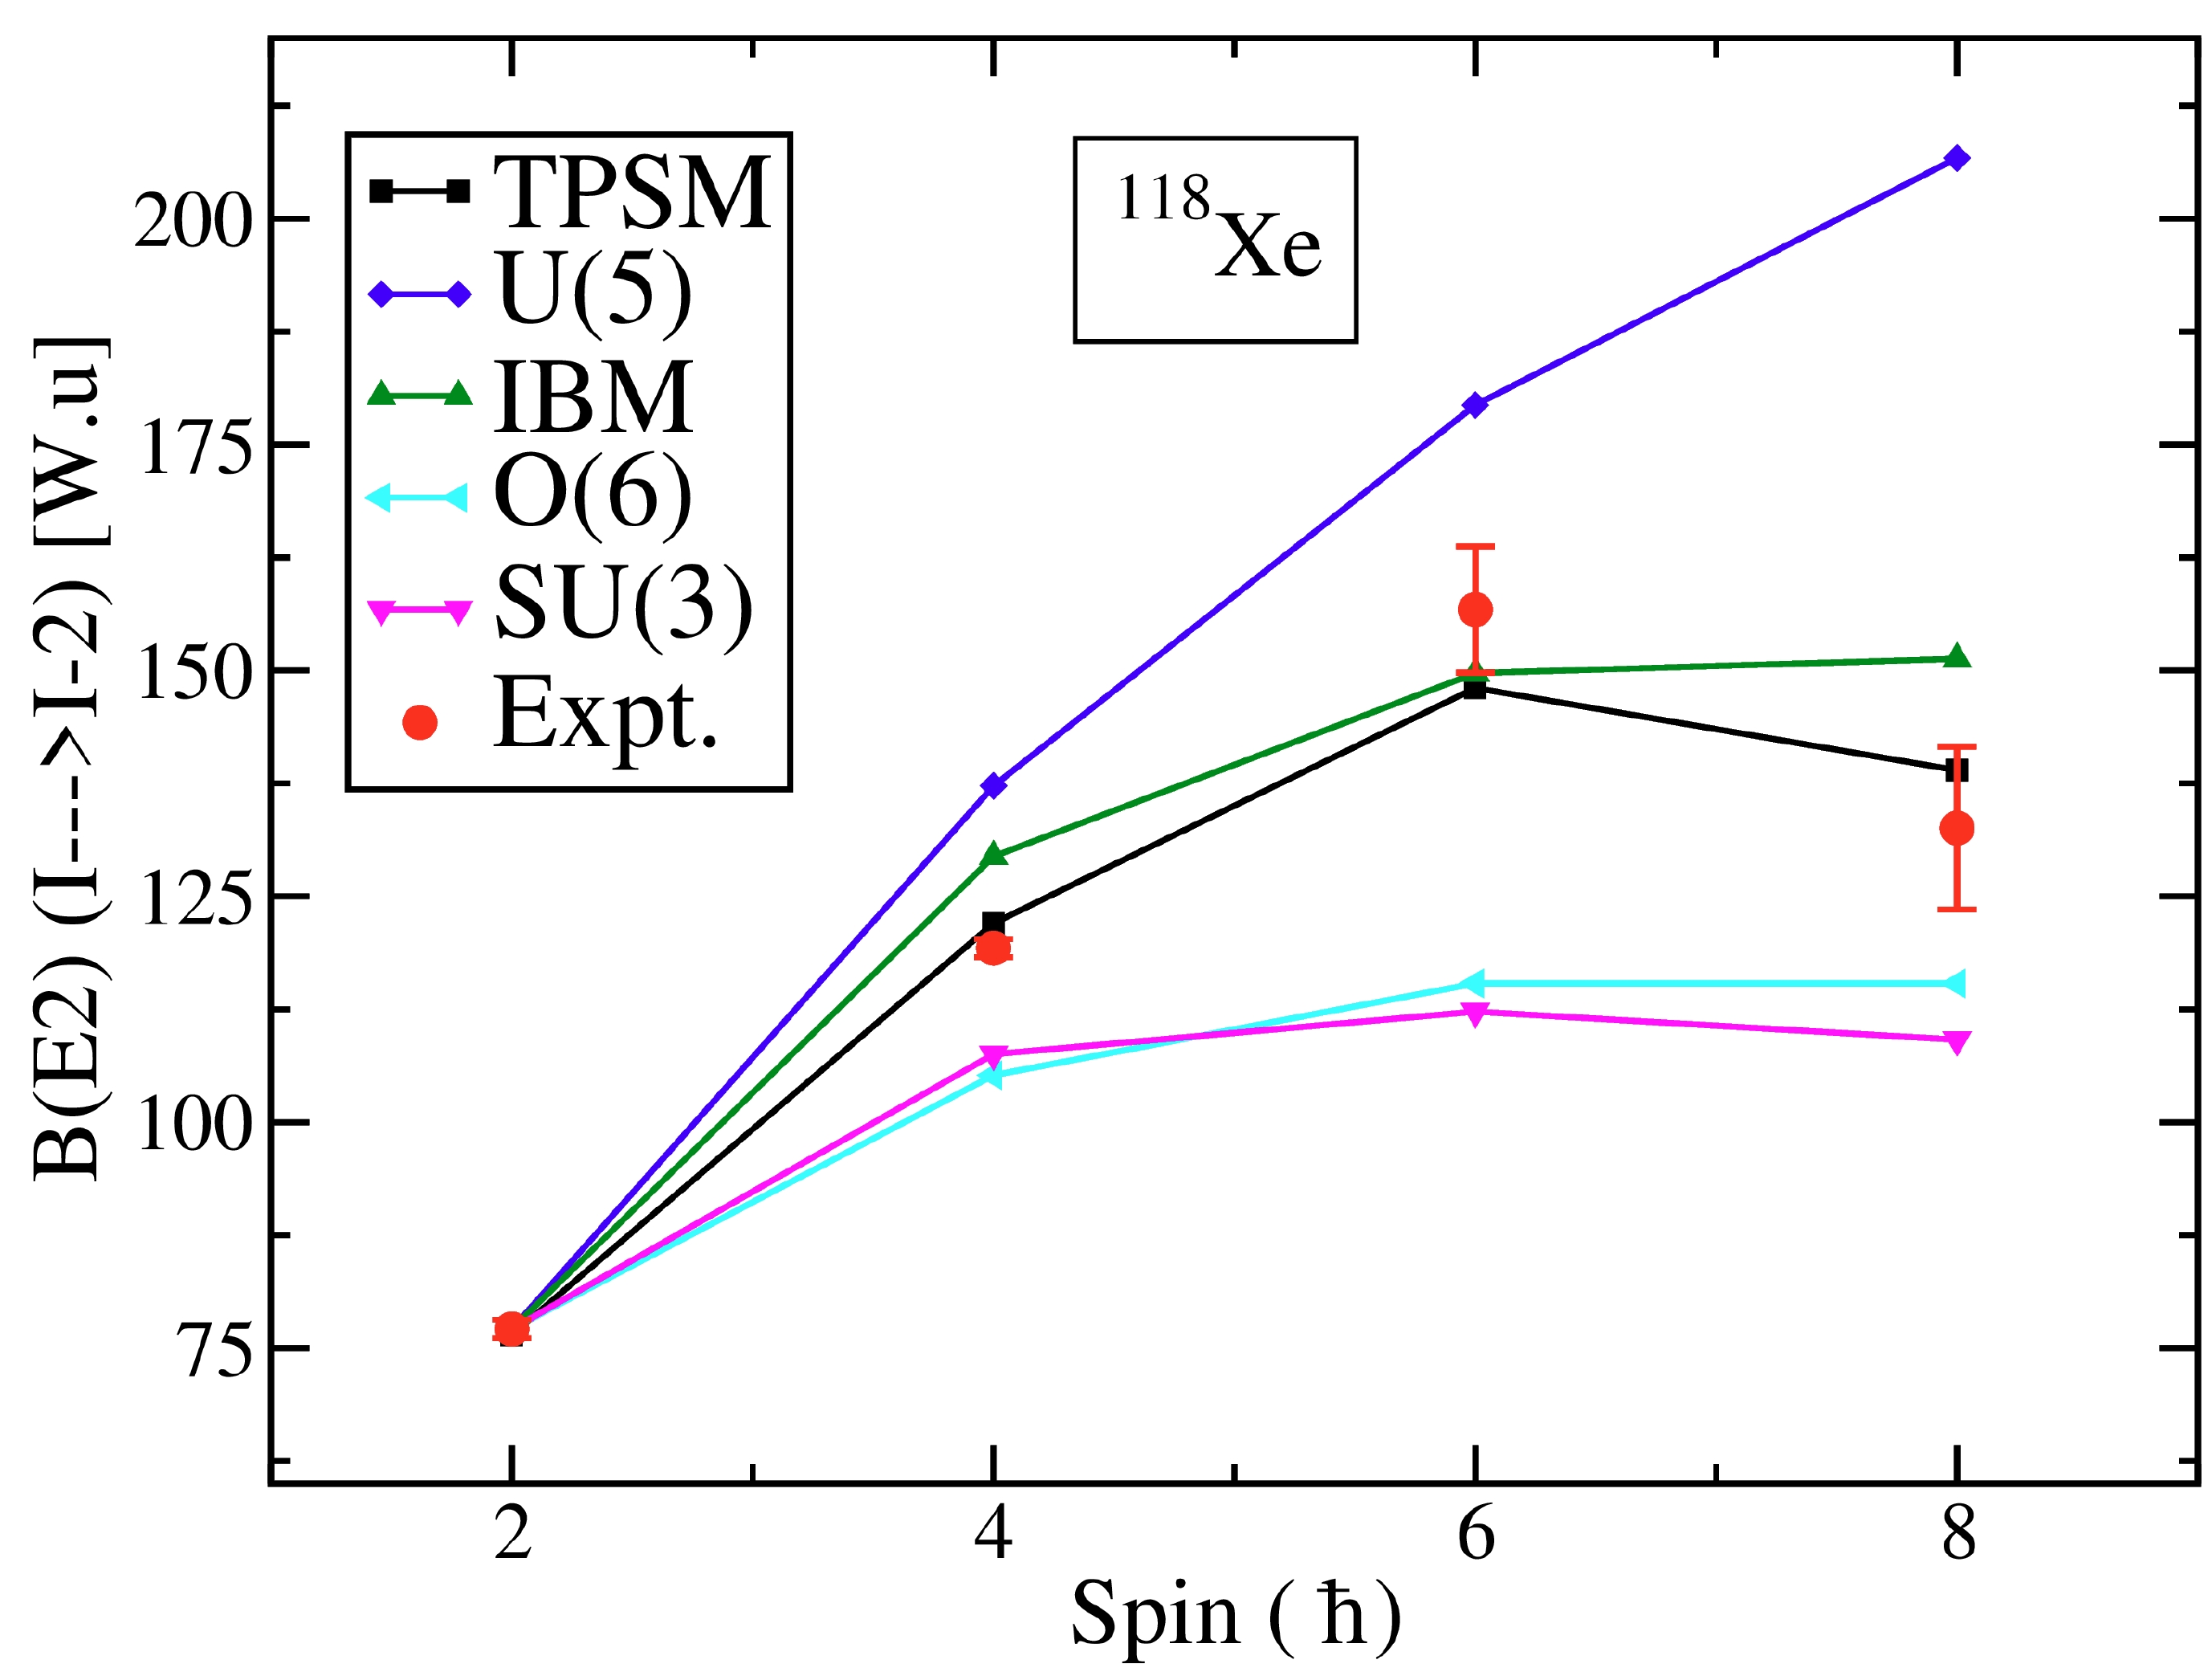
Figure 16. (color online) Comparison of E2 transition probabilities (in W.u) for the yrast band in
$^{118}{\rm Xe}$ with TPSM and IBM calculations. The experimental data for the transition strengths and the results of the IBM calculations are from Ref. [38].In particular, the increasing trend of B(E2) values for low-spin states up to
$ 6^+ $ and the drop for the$ 8^+ \rightarrow 6^+ $ transition are well described by the TPSM calculations. This decreasing trend can be traced to the crossing of the 2-qp neutron configuration with the ground-state band. The transition probabilities in the band-crossing region are reduced as the states are mixed in the this region.Table 3 compares the experimental reduced E2 transitional probabilities for the γ-band (in-band, inter-band) with the ones calculated using the TPSM wavefunctions. The experimental data on transition strengths and the results of the IBM calculations in \tablename 2 are from Ref. [38]. It is evident that TPSM calculations reproduce these transitions quite well compared with the corresponding IBM results.
$ I_i^\pi $ 

$ I_f^\pi $ 

$ B(E2) $ 

$ B(E2) $ 

$ B(E2) $ 

Expt. TPSM IBM $ 2_\gamma^+\rightarrow $ 

$ 2_g^+ $ 

36(12) 40.700 4 $ 0_g^+ $ 

1 1.142 1 $ 3_\gamma^+\rightarrow $ 

$ 2_\gamma^+ $ 

49(13) 59.19 11 $ 2_g^+ $ 

1 2.574 1 $ 4_\gamma^+\rightarrow $ 

$ 2_\gamma^+ $ 

2.4(5) 3.808 3.8 $ 4_g^+ $ 

1 3.275 1 $ 5_\gamma^+\rightarrow $ 

$ 3_\gamma^+ $ 

27(9) 33.981 10 $ 4_g^+ $ 

1 2.918 1 $ 6_\gamma^+\rightarrow $ 

$ 4_\gamma^+ $ 

4.6(10) 7.685 12.5 $ 6_g^+ $ 

1 2.129 1 Table 3. Comparison of E2 transition probabilities (in W.u) for the quasi-γ band in
$^{118}{\rm Xe}$ with TPSM and IBM calculations. The experimental data for the transition strengths and results of the IBM calculations are taken from Ref. [38]. -
High spin states in
$ ^{118} $ Xe have been investigated via the$ ^{93} $ Nb($ ^{28} $ Si, p2n)$ ^{118} $ Xe reaction deploying an INGA detector set-up at IUAC, New Delhi. In the present study, we were successful in 1) adding seven new γ-transitions to the previously existing level structure, 2) fixing the negative parity of band 4 through polarisation measurement of its γ-ray transition and hence confirming the electric nature of the 924 keV (8$ ^{-} \rightarrow $ 8$ ^{+} $ ) transition for the first time, and 3) providing more precise data (errors in the range of 4% − 18%) for the B(E1) values except for I = 7$ \hbar $ . Enhanced B(E1)/B(E2) ratios for the transitions from I$ ^{\pi} $ = 7$ ^{-} $ , 9$ ^{-} $ , 11$ ^{-} $ , and 8$ ^{-} $ support the existence of octupole correlation between νh$ _{11/2} $ and νd$ _{5/2} $ bands having Δj = Δl = 3 in$ ^{118} $ Xe. However, there is a need to examine low lying interlinking transitions of E1 character with lifetime measurement techniques in neutron deficient (Xe-Cs-Ba) nuclei having A$ \leq $ 120 (Z$ \leq $ 56) to establish the octupole correlation in this mass region.
Revisiting band structures in 118Xe nucleus via in-beam γ-ray spectroscopy
- Received Date: 2022-12-18
- Available Online: 2023-08-15
Abstract: The neutron deficient Xe nuclei with A


 DownLoad: