


 Abstract
 HTML
HTML Reference
 Related
 PDF
PDF


-
In recent years, the development of lead-based fast reactors (LFRs) and the accelerator-driven sub-critical system (ADS) as novel nuclear power technologies has been accelerated. Liquid lead-bismuth eutectic (LBE) is chosen as the primary coolant for these advanced nuclear systems because of its superior thermo-hydraulic and safety characteristics [1]. Therefore, the accuracy of nuclear data for lead and bismuth has a direct impact on the reliability of the physical design. Consequently, the demand for precise neutron-induced reaction data for 209Bi has been elevated to the high-priority request list (HPRL) by the OECD-NEA [2]. The neutron total cross-section forms the foundation for evaluating neutron-induced nuclear reaction data, holding substantial importance in fundamental nuclear physics and nuclear technology. In the energy region ranging from thermal to 20 MeV, relevant to LFRs, current measurements of bismuth's neutron total cross-sections derive from various spectrometers spanning different energy domains. Discrepancies remain notable across many energy sectors, posing challenges for assessing pertinent nuclear reaction data in nuclear power applications.
When comparing the neutron-induced total cross-section data for bismuth across major nuclear data libraries, significant discrepancies emerge, particularly in the neutron resonance energy range (1 keV−1 MeV). This can be largely attributed to the limited number of measurements available for bismuth's neutron-induced total cross-section within the resonance region. [3], and the measurement uncertainties in some energy regions are relatively large (e.g., approximately 10%−30% in 260 keV to 860 keV energy reigon) [4, 5]. There has not been a single reported measurement that covers the energy range of interest for LFRs using one detector. This makes the extraction of resonance parameters and covariance analysis particularly challenging for applications. Hence, there is a need for new, high-quality measurements of the 209Bi neutron total cross-sections across an extensive energy range, using a sophisticated neutron source and spectrometer.
This paper reports a new measurement of the neutron total cross-sections of 209Bi in the energy range from 0.3 eV to 20 MeV on the back-streaming neutron beamline (Back-n [6]) at the China Spallation Neutron Source (CSNS). Neutron energy was determined by the neutron total cross-section spectrometer (NTOX) using the time-of-flight (TOF) technique. Measured neutron total cross-sections of 209Bi were compared with data extracted from EXFOR and evaluated libraries. Neutron resonance parameters in the energy region of 0.5 keV to 20 keV were extracted and discussed.
-
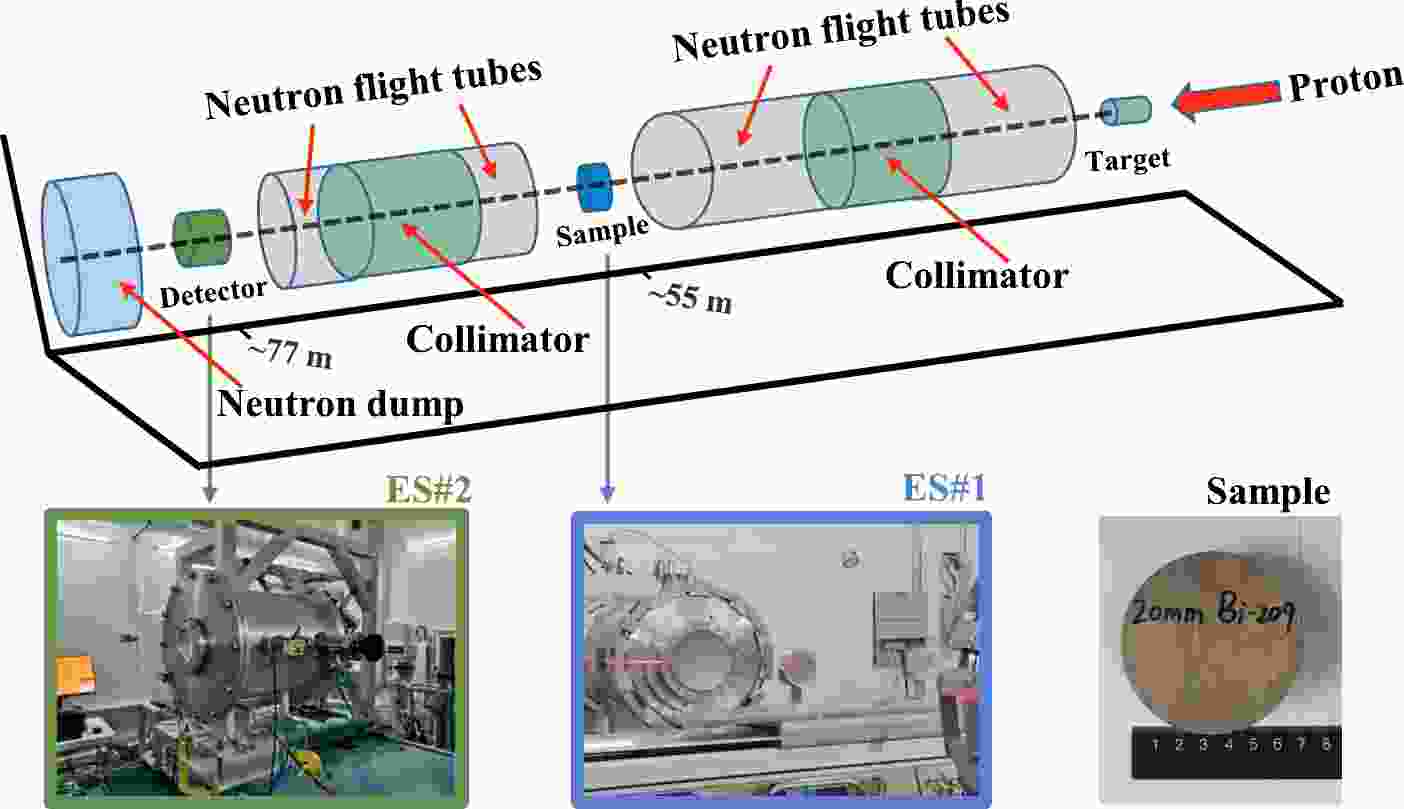
With respect to the Back-n white neutron source, neutrons are produced via 1.6 GeV proton-induced spallation reactions on a Tungsten target. Two endstations (ES), which are approximately 55 m (ES#1) and 76 m (ES#2) away from the spallation target, have been built on the Back-n neutron source for neutron-induced nuclear data measurements, irradiation tests, neutron imaging, and detector calibrations [7].
The accelerator was operated with a proton beam power of approximately 100 kW in this experiment. The incident proton pulse was in two bunches, about 60 ns (FWHM) wide and 410 ns apart, and was accelerated via a Linac and synchrotron with a pulse repetition rate of 25 Hz. To obtain a relatively high neutron flux for measurements, a beamline mode of
$ \Phi50-\Phi50-\Phi40 $ mm was selected. The three numbers in that beamline mode indicate the apertures of the neutron shutter, first collimator, and second collimator, respectively, as shown in Fig. 1.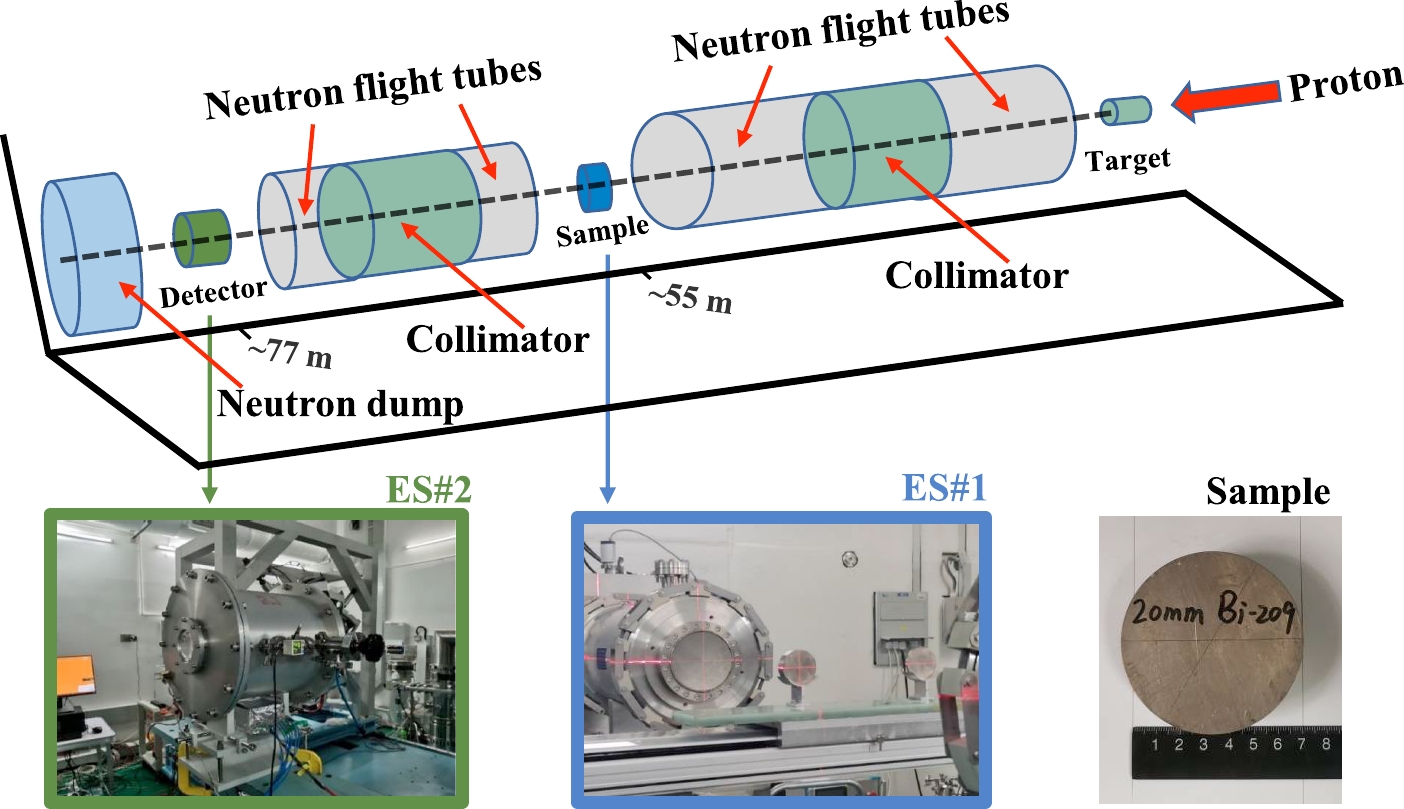
Figure 1. (color online) Schematic diagram of the experimental setup.
High-purity bismuth samples were placed at (ES#1) and the NTOX spectrometer was placed at (ES#2) for scattering neutrons reduction [8]. The NTOX spectrometer comprises a multi-cell fission chamber in which four 235U fission cells (235U-1, 235U-2, 235U-4, 235U-5) are used for low energy neutron detection and four 238U fission cells (238U-1, 238U-2, 238U-4, 238U-7) are used for fast neutron detection [9]. Each cell corresponds to a readout channel. The full waveform of each signal generated by each cell was fed into the data acquisition system (DAQ) [10] for offline data analysis. The signal was produced by a neutron-induced fission fragment, which ionizes the working gas in the ionization chamber.
-
As thin samples generate large uncertainties and thick samples allow too many scattering/reaction processes, samples for neutron transmission measurements should not be too thick or too thin. Two high purity (>99.99%) bismuth (209Bi) samples, with a thickness of 6 mm and 20 mm, respectively, were selected for measurement. The uncertainty of the sample thickness determination is within 0.07%. The diameter of the 209Bi samples was 70 mm to cover the neutron beam. Table 1 shows the physical parameters of the samples. The samples were aligned horizontally and vertically to make the samples perpendicular to the neutron beam to the maximum possible extent to reduce the experimental uncertainty. The sample changer can hold two samples at the same time and move them in and out of the beam remotely. The irradiation time for a 6 mm thick sample was approximately 36.5 h, and it was approximately 45 h for the 20 mm thick sample. The measurement time with the empty target was approximately 22.5 h.
Sample ID Purity
(%)Diameter/
mmThickness/
mmMass/
gDensity/
g/cm3I 99.99 70 6 230.5 9.98 II 99.99 70 20 758.6 9.86 Table 1. Physical parameters of 209Bi samples.
-
The energy-dependent neutron total cross-section can be determined by the transmission measurement [11]. The relationship between the total cross-section and transmission rate can be expressed as Eq. (1).
$ \sigma \left( {{E_i}} \right) = - \frac{1}{{nd}}\ln T\left( {{E_i}} \right), $

(1) where n denotes the number of atoms per unit volume of the sample, d denotes the thickness of the sample, and T denotes the transmission rate. The transmission rate was calculated using the neutron counting rate of the sample-in divided by that of the sample-out using Eq. (2). Transmission measurement exhibits high accuracy because the ratio method eliminates the need to know the specific detection efficiency of the detector and neutron flux.
$ T\left( {{E_i}} \right) = \frac{{C\left( {{E_i}} \right)}}{{{C_0}\left( {{E_i}} \right)}}, $

(2) where
$ C(E_{i}) $ denotes the neutron counting rate by the detector of sample-in and$ C_{0}(E_{i}) $ denotes the neutron counting rate by the detector of open-beam.To obtain the neutron energy, the TOF technique is usually used [11, 12]. It determines the neutron energy by measuring the time when the neutron flies over a fixed distance. The neutron energy can be calculated by Eq. (3) as follows:
$ {E_i} = {m_n}{c^2}\left( { \frac{1}{{\sqrt {1 - {{\left( { \dfrac{L}{{c \cdot {\rm TOF}{_n}}}} \right)}^2}} }} - 1} \right), $

(3) where
$ m_{n} $ denotes the mass of the neutron, c denotes the speed of light, L denotes the neutron flight path, and${\rm TOF}_{n}$ denotes the neutron flight time. The relativistic effect was considered as the neutron energy was relatively high.The timing and amplitude of each signal were analyzed based on the ROOT framework [13]. Data analysis was processed by analyzing the neutron flight time determination, flight path calibration, and background deduction.
-
When the powerful 1.6 GeV proton beam strikes the spallation target, it concurrently generates high-intensity γ-rays (γ-flash) at the moment neutrons are produced. Given that the γ-flash travels at the speed of light and reaches the detector before the neutrons, the time difference between the detected γ-flash and the neutron signal is utilized to ascertain the neutron's time-of-flight [8], as shown in Eq. (4).
$ {\rm TOF}_{n} = {T_{n}} - {T_{n0}} = {T_{n}} - (T_{\gamma} - {\rm TOF}_{\gamma}), $

(4) where
$ T_{n} $ denotes the neutron arrival time determined by the fission signal,$ T_{n0} $ denotes the generation time of neutron,$ T_{\gamma} $ denotes the time when γ-flash is detected,${\rm TOF}_{\gamma}$ denotes the flight time of γ-flash from the target to the fission chamber.The γ-flash signal exhibited a much smaller amplitude when compared with the fission signal and was seriously affected by noise. Multiple γ-flash signals were counted in data analysis. Recorded signals were superimposed and then normalized to determine Tγ for each fission cell. The results are listed in Table 2.
Fission cells Tγ /ns Fission cells Tγ /ns 235U-1 −1150 238U-1 −1148 235U-2 −1153 238U-2 −1150 235U-4 −1151 238U-4 −1154 235U-5 −1154 238U-7 −1155 Table 2. Detected time of γ-flash in each fission cell.
-
Three resonance peaks with lower energy (8.774 eV, 12.385 eV, and 19.288 eV) were chosen to calibrate the neutron flight path between the neutron source and fission cells with fewer effects resulting from the time resolution. Figure 2 shows the fission time distribution of the signal obtained from the 235U-1 fission cell, and the three resonance peaks are clearly visible. The resonance peaks were fitted using the Gaussian function to find the neutron fission time. The neutron flight path is then calibrated based on the relationship between the resonant peak energy and fission time, as shown in Eq. (5).
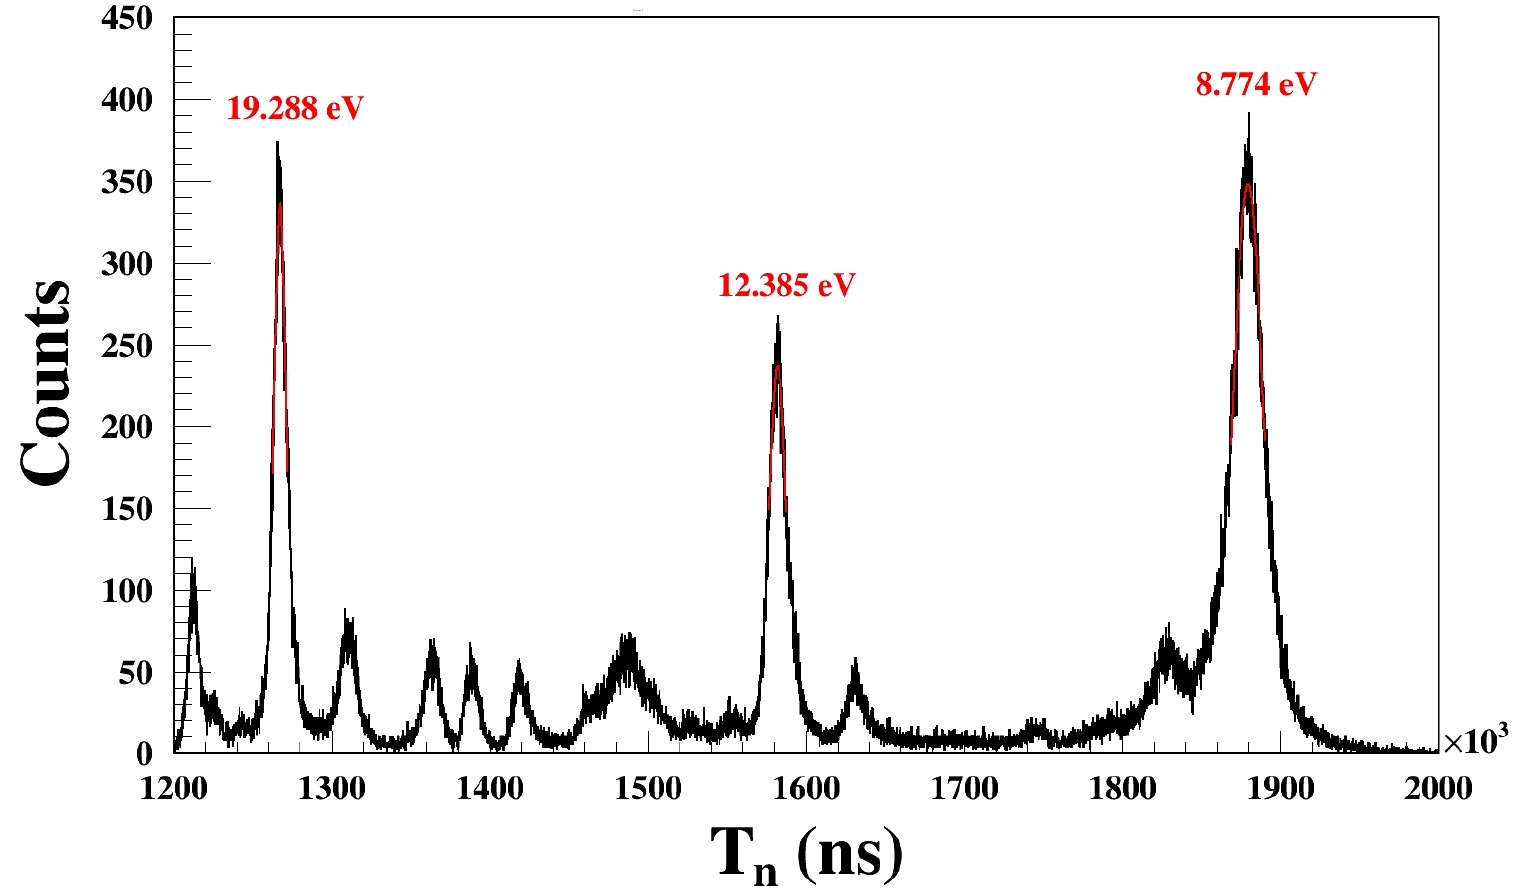
Figure 2. (color online) Diagram of the fission time distribution of the signal obtained from 235U-1 fission cell.
$ {T_{n}} - {T_\gamma } = \frac{L}{{\rm{c}}}\left[ {\frac{1}{{\sqrt {1 - {{\left( { \dfrac{{{E_n}}}{{{m_n}c}} + 1} \right)}^{-2}}} }} - 1} \right]. $

(5) The fitting process for the flight path of 235U-1 fission cell is shown in Fig. 3. The calibration results of the flight path for the four 235U fission cells are shown in Table 3. The flight path of the four 238U cells was not calibrated due to the small response of the reaction in low-energy regions. The distance between every two adjacent cells was approximately 19 mm, and the result was verified for 235U cells. Hence, the flight path of the 238U fission cells was adjusted to increase by 19 mm.

Figure 3. (color online) Neutron flight path fitting of 235U-1 fission cell.
Fission cells L/m 235U-1 77.0589 235U-2 77.0787 235U-4 77.0980 235U-5 77.1181 Table 3. Neutron flight path calibration of 235U fission cells.
-
The primary experimental background stems from two sources, which can significantly influence the experimental outcomes if not subtracted. Firstly, there is the ambient room background, time-independent and inclusive of the alpha decay from the fission cells. This can be effectively measured by collecting data when the neutron beam is off. A ten-hour beam-off measurement revealed a very low signal amplitude suitable for pulse height analysis and background subtraction. Subsequent analysis indicated a negligible influence of alpha particles at the threshold, with alpha particles contributing only 0.0007% to the neutron signal. The second source is associated with the neutron beam's generation and transmission and is time-variant. This can be assessed during operations and is often concealed by the neutron spectrum [12]. Based on the measurement performed by Liu [14], the ratio of the scattered neutrons to neutrons in the beamline is known and corresponds to approximately 10-6, and the in-beam background can be neglected.
The time and amplitude statistics of the signals from each fission cell are performed, resulting in the sample-out TOF-amplitude 2D distribution and amplitude distribution of 235U-1 cell and 238U-1 cell as shown in Fig 4. An obvious demarcation region between the background signal of small amplitude and fission signal is shown. In this study, the lowest value of the valley region was selected from the amplitude distribution map as the signal screening threshold, and the background signal smaller than the threshold was estimated in the subsequent analysis.

Figure 4. (color online) Sample-out TOF-amplitude 2D distribution, and the amplitude distribution of 235U-1 cell and 238U-1 cell.
-
The fission events as a function of neutron energy can be derived from the TOF spectrum using Eq. (3). The proton beam intensity, which was simultaneously monitored by a Current Transformer (CT), was used for neutron yield normalization using a normalization parameter (P). The neutron transmission (
$ T(E_i) $ ) was then obtained after considering the background counts ($ B(E_i) $ ) subtraction and proton beam normalization in Eq. (6).$ T\left( {{E_i}} \right) = \frac{{\left( {M\left( {{E_i}} \right) - B\left( {{E_i}} \right)} \right)/P}}{{\left( {{M_0}\left( {{E_i}} \right) - {B_0}\left( {{E_i}} \right)} \right)/{P_0}}}, $

(6) where M(Ei) denotes the signal count of the beam-on measurement with sample-in, and subscript 0 represents the beam-on measurement without placing a sample.
To increase the neutron counts and reduce the statistical error, the neutron-induced fission events counted by each fission cell were added [14]. The normalized fission events as a function of neutron energy and corresponding transmission with and without samples of 235U fission cells and 238U fission cells are shown in Fig. 5.
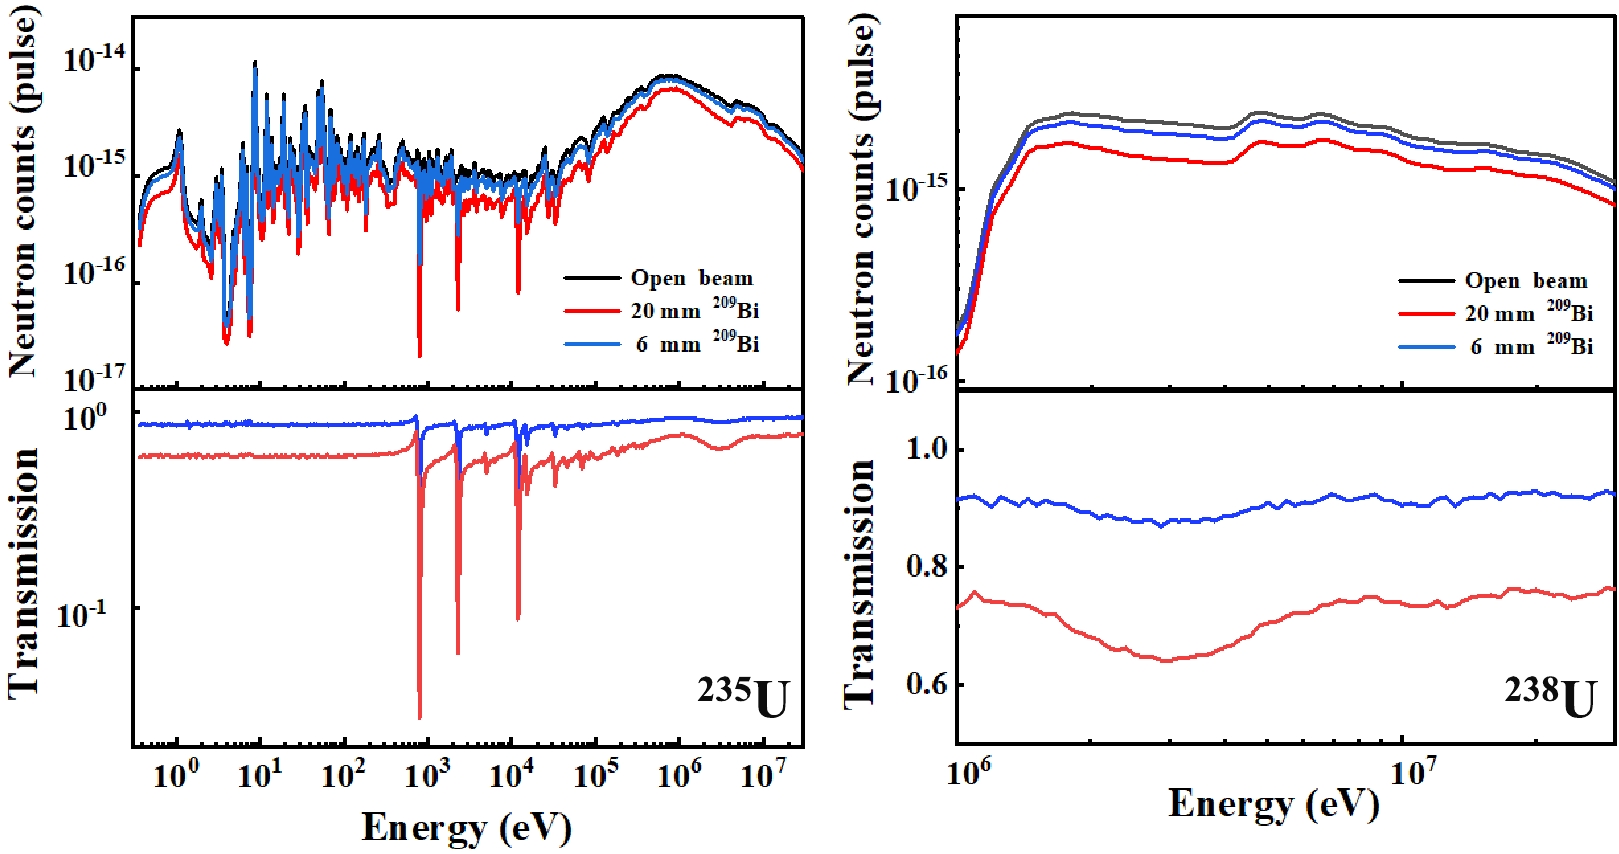
Figure 5. (color online) Normalized fission events as a function of neutron energy and the corresponding transmission measured by 235U fission cells and 238U fission cells with and without 209Bi samples.
The neutron transmissions measured using samples of two different thicknesses show broadly consistent trends. For a 6 mm thick 209Bi sample, transmissions range from 0.8 to 0.95, while for a 20 mm thick sample, they range from 0.6−0.8 in most energy areas. However, in the energy range of 1 eV to 1 keV, neutron counts differ significantly due to the resonance effect of 235U, leading to considerable uncertainty in this energy region. A comparison is made between neutron transmissions obtained by 235U fission cells and 238U fission cells, as depicted in Fig. 6. A good agreement was observed between the data analysis and experiment.

Figure 6. (color online) Comparison of the neutron transmission obtained from 235U fission cells and 238U fission cells.
-
The proton beam operated in a double-bunch mode to enhance beam power and neutron intensity, with a time interval of approximately 410 ns between the two bunches. Given the neutron flight path from the spallation target to the endstations (55 m and 76 m, respectively), fast neutrons from the second bunch would overlap with the slower ones from the first bunch. This overlap complicates the neutron TOF spectrum, introducing significant uncertainties in counting high-energy neutrons and subsequently affecting the accuracy of the total cross-section measurement. To mitigate this, it is essential to unfold the experimentally obtained TOF spectrum to retrieve the original spectrum associated with a single-bunch mode. This step ensures a more precise comparison between experimental and evaluation data, affirming the credibility of the experimental results. The TOF spectrum linked to the fission events, based on neutron energy from the 235U and 238U fission cells in the experiment, was processed using the DemoUnfolding_v3.3 code [15] in the energy range from 10 keV to 20 MeV and 1 MeV to 20 MeV, respectively. In the double-bunch mode, the TOF spectrum was configured with a linear uniform distribution of 20.5 ns per channel. Fission events, based on neutron energy, were divided into 100 bins per decade, undergoing five iterations. This unfolding procedure, rooted in the iterative Bayesian method, can deconvolve the neutron energy spectrum, TOF spectrum, and the amplitude-energy 2D distribution. Detailed principles and algorithm derivations are available in the referenced literature. Following the unfolding process, the neutron count in each channel is adjusted.
-
With the neutron transmission spectrum of sample-in and sample-out, the neutron total cross-sections were obtained according to Eq. (1). Figure 7 shows the neutron total cross-sections measured by 235U fission cells and the 238U fission cells. From Eq. (2), it can be observed that the uncertainty of the total cross-section mainly comes from the uncertainty of the atomic density of the sample and uncertainty of the transmission, and the latter is related to the statistical uncertainty of the neutron counts. The uncertainty of the neutron total cross-section can be obtained via Eq. (7).
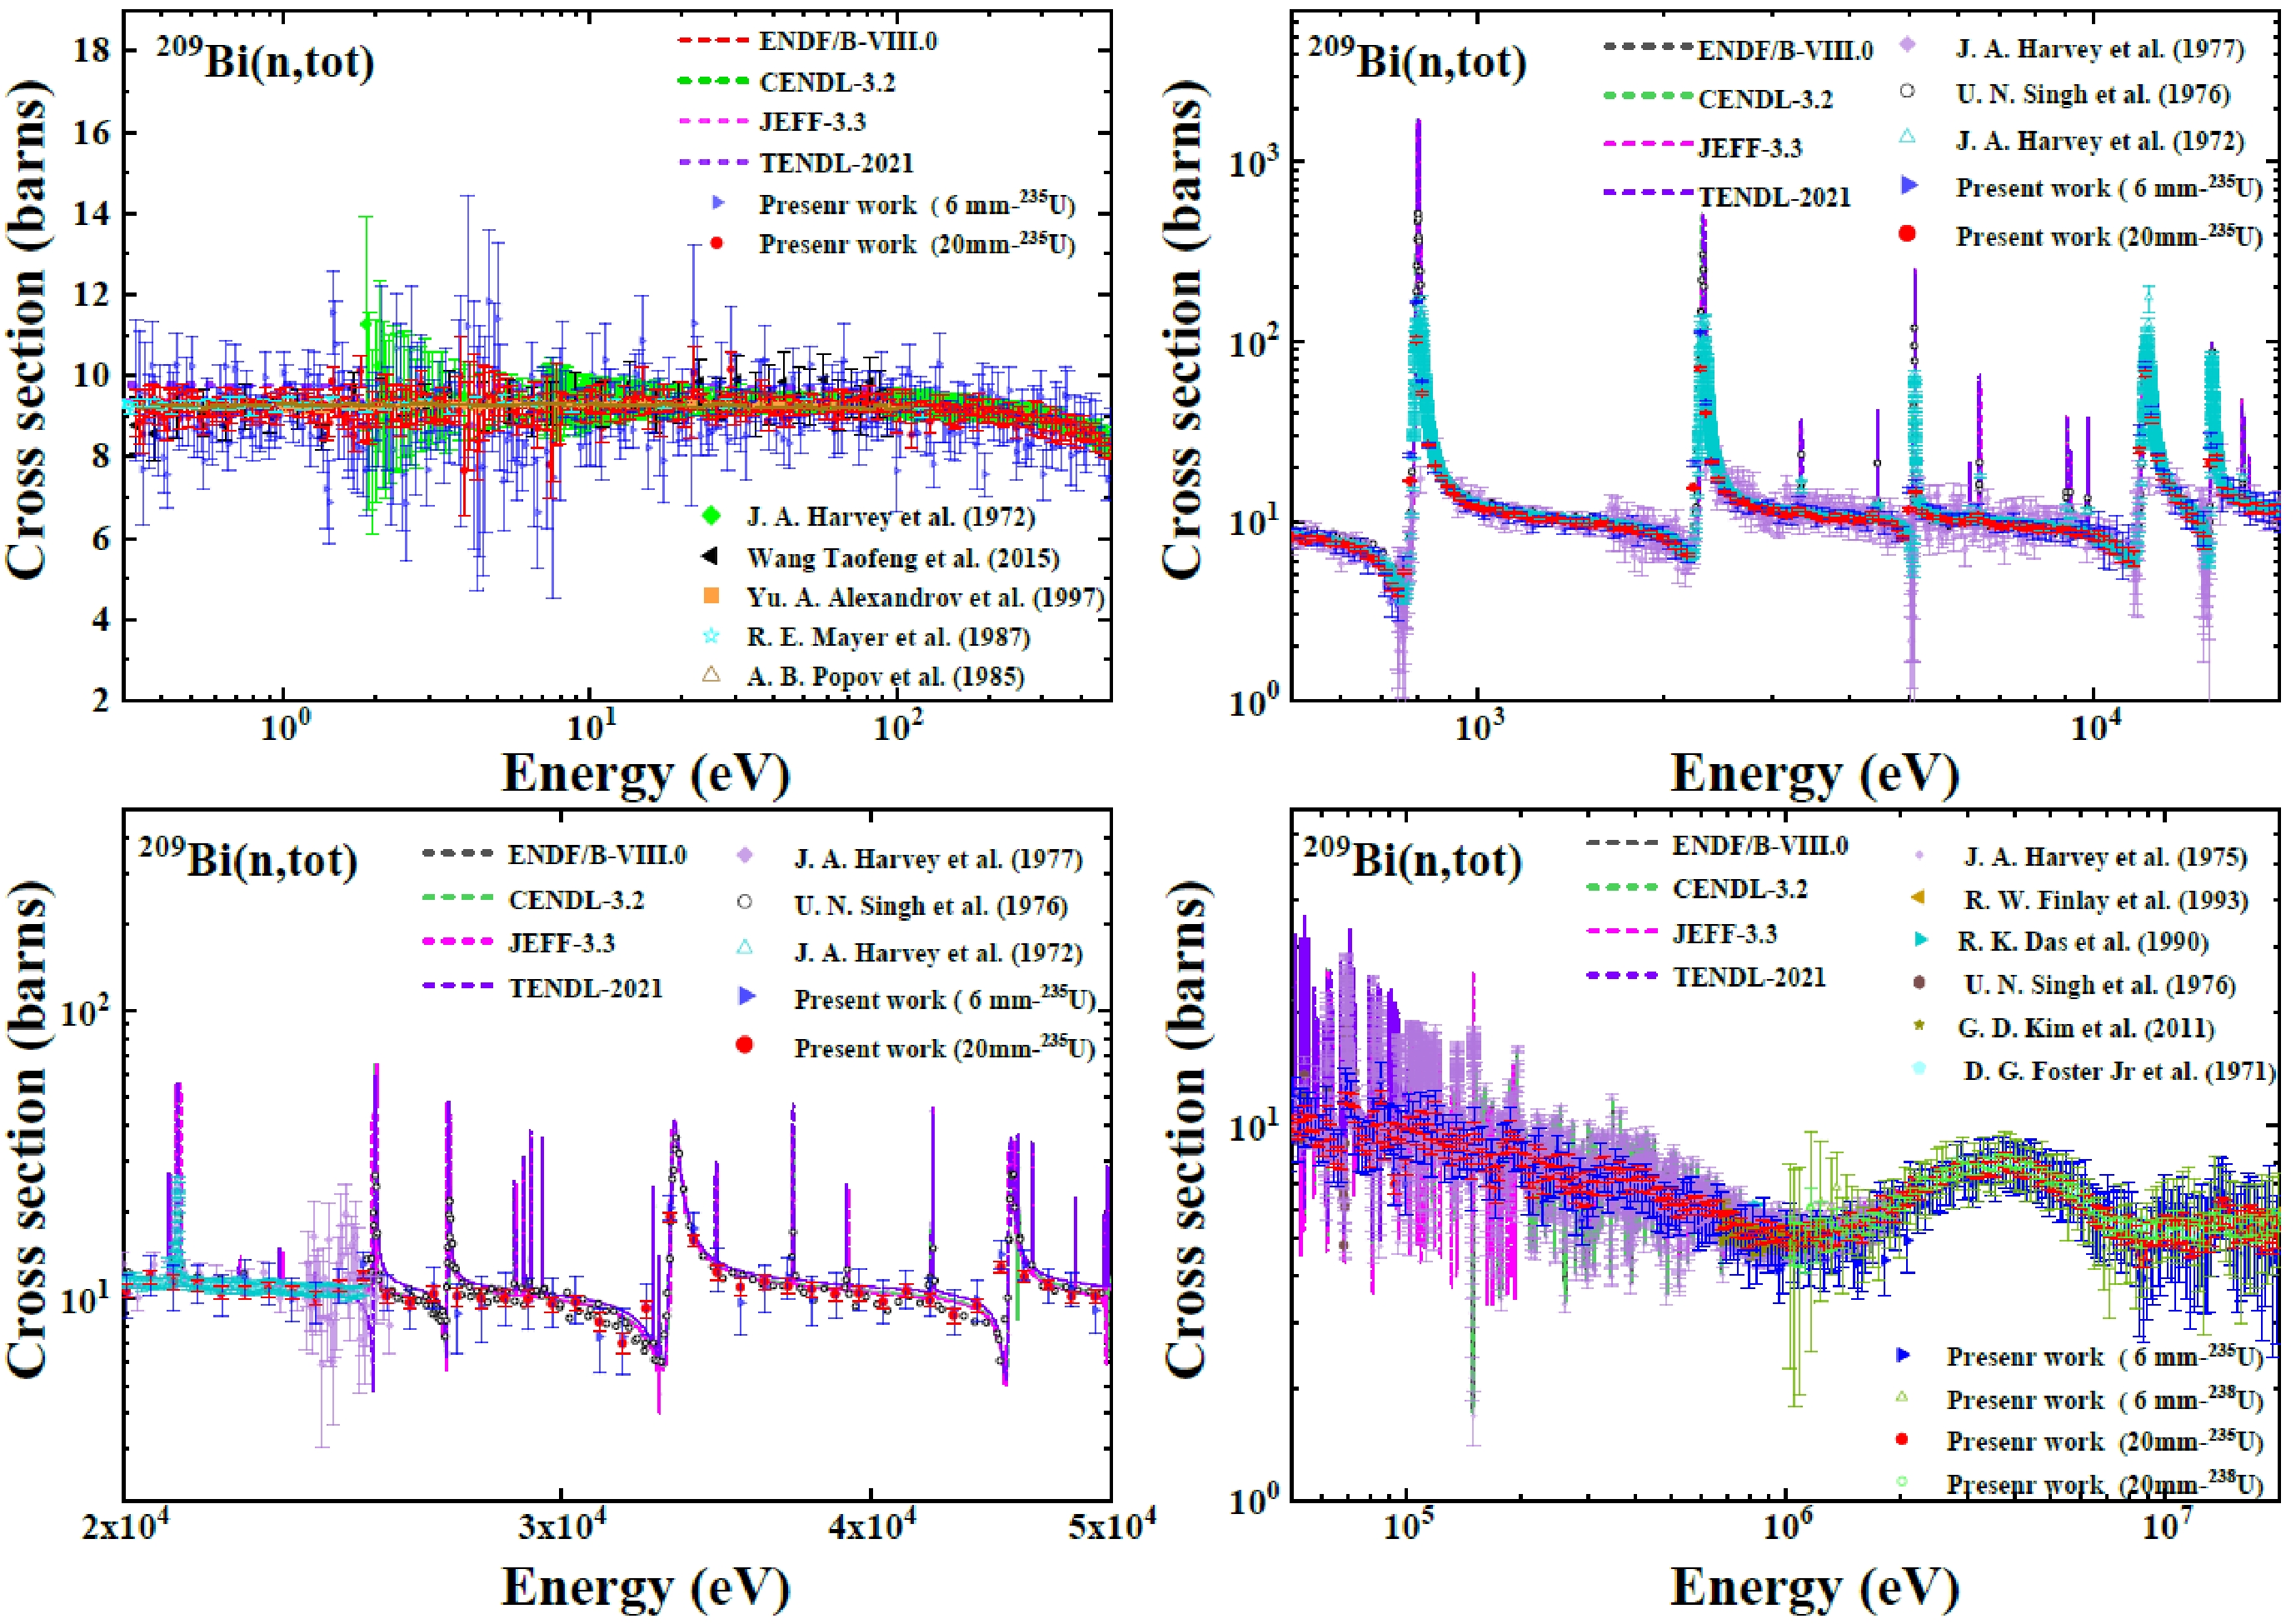
Figure 7. (color online) Neutron total cross-sections of 209Bi compared with previous experimental data and ENDF/B-VIII.0 library in the energy range from 0.3 eV to 20 MeV.
$ \frac{\Delta \sigma}{{\rm{\sigma}}} = \frac{-1}{{{{\rm ln}T}}} \sqrt {{\left(\frac{\Delta T}{{T}}\right)}^2+{({\rm ln}T)}^2\left[{\left(\frac{\Delta d}{{d}}\right)}^2+{\left(\frac{\Delta n}{{n}}\right)}^2\right]}. $

(7) Measurements performed with two samples of different thicknesses are in general consistent and show good agreement with previous measurements and ENDF/B-VIII.0 data. A relatively large fluctuation of approximately 4 eV was found due to the low statistical counts in that energy region. Measured neutron total cross-sections were found lower than the evaluated data at resonance peak energies. This is because the proton beam operated in a mode resembling a Gaussian distribution with a width of approximately 60 ns. The time broadening was not factored into the neutron energy determination, making it challenging to accurately measure the resonance peaks within the energy range of 30 keV to 1 MeV.
When measuring the neutron total cross-section, the 20 mm thick sample yielded a smaller statistical uncertainty when compared to the 6 mm thick sample. Uncertainty can also be introduced during the double-bunch unfolding process. The unfolding code employs an iterative method to compute the error for each channel, encompassing both the TOF and energy spectrum errors. For the 6 mm thick sample, there were 785 energy bins with the 235U fission cells and 91 with the 238U fission cells. The total uncertainties in the measured total cross-sections using the 235U fission cells were below 20% for 90% of the energy points (bins) and under 10% for 45% energy points. For the 20 mm thick sample, there were 790 energy bins with the 235U fission cells and 94 with the 238U fission cells. At 98% of these energy bins, uncertainties were less than 10%, with 80% of them being below 5%. Furthermore, 12% of the energy bins had uncertainties of less than 2%.
-
To extract the resonance parameters for practical applications, the measured neutron total cross-sections were analyzed using the R-matrix theory. The SAMMY code, which is a program for multi-level R-matrix fitting of neutron reaction data based on the Bayesian technique, is applied for fitting the resonance peaks in the energy range from 0.5 keV to 20 keV, as shown in Fig. 8.
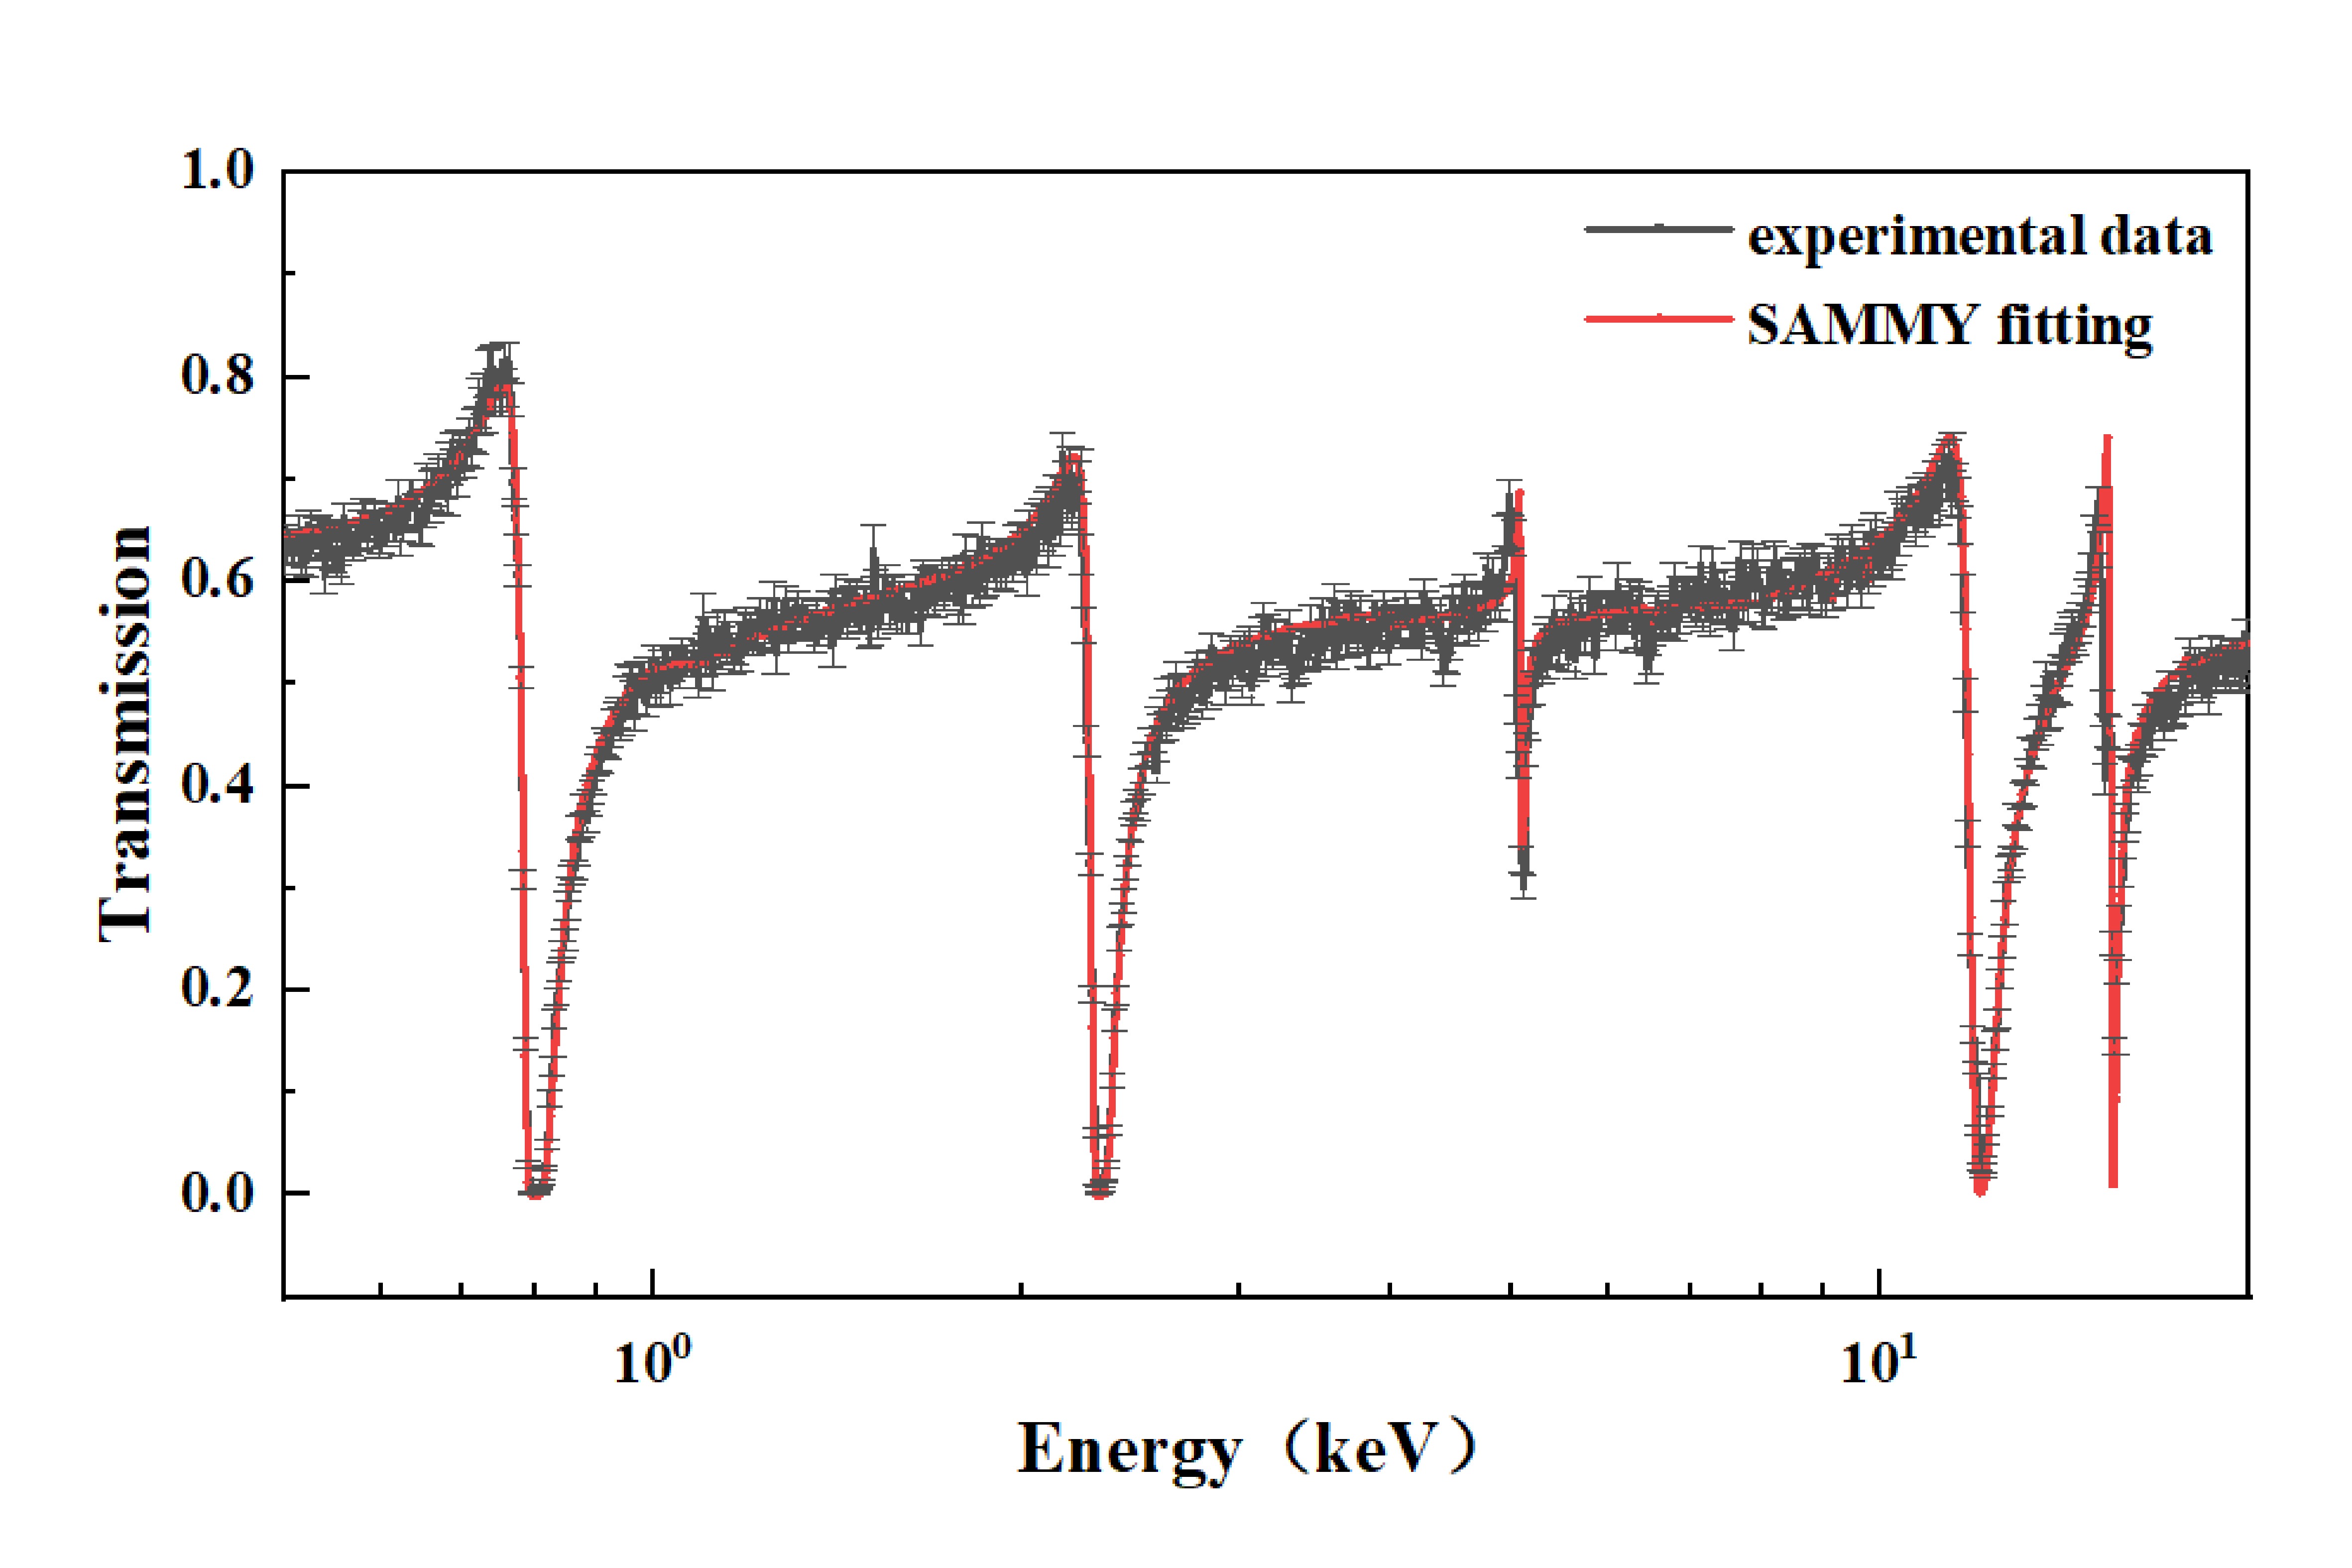
Figure 8. (color online) Comparison of experimental data measured with 20 mm thick sample and SAMMY fitting.
To improve the fitting process, abnormal data removal and input document editing, including the experimental conditions (sample thickness, laboratory temperature, etc.) for the SAMMY code, were applied for analyzing the experimental data. To ensure that the fitting results were more in line with the experimental data, we increased the number of experimental data points. The neutron energy points were set to 500 per decade. The initial parameters were from the JEFF-3.3 library, and the correction of experimental conditions (Doppler broadening, resolution broadening, etc.) was considered. The free gas model was used to widen the Doppler effect. Finally, the resonance parameters in the 0.5−20 keV resonance energy region were obtained by fitting the transmission data of the 20 mm thick sample.
Extracted resonance parameters in the energy range of 0.5–20 keV are compared with the reported results and evaluated data in ENDF/B-VIII.0 library, as listed in Table 4. The uncertainty of the obtained resonance parameter Eres is less than 0.02%, uncertainty of parameter
$ \Gamma_{\gamma} $ is less than 8%, and uncertainty of parameter$ \Gamma_{n} $ is less than 3%. The difference between the obtained resonance parameter Eres and parameters in ENDF/B-VIII.0 library is less than 1.3%. The obtained resonance parameters$ \Gamma_{\gamma} $ and$ \Gamma_{n} $ differ from the parameters in ENDF/B-VIII.0 library by 1.8% to 24% and 7.6% to 53%, respectively. Some parameters exhibit significant differences. This can be due to the fact that the proton beam broadening of approximately 60 ns is not considered. The experimental results show similar differences for certain parameters.Reference Eres/eV $ \Gamma_{\gamma} /{\rm{eV}}$ 

$ \Gamma_{n} /{\rm{eV}}$ 

Present 800.5 0.0342 4.9883 ENDF/B-VIII.0 800.0 0.0387 4.6364 C. Domingo-Pardo [16] 801.6 0.0333(0.012) 4.309(0.145) A. R. De [5] 800.0 − 4.655(0.05) U. N. Singh [17] 800.0 − 4.6(0.4) Present 2340.5 0.0349 27.325 ENDF/B-VIII.0 2310.0 0.046 17.889 C. Domingo-Pardo 2323.8 0.0268(0.017) 17.888(0.333) A. R. De 2312.0 − 18.1(0.3) U. N. Singh 2312.0 − 19.5(1.0) Present 5110.5 0.0666 3.6903 ENDF/B-VIII.0 5114.0 0.065 5.64 C. Domingo-Pardo 5114.0 0.065(0.002) 5.64(0.27) A. R. De 5108.0 − 5.74(0.14) U. N. Singh 5112.0 − 5.4(0.6) R. Macklin [18] 5113.0 − 6.49(0.14) J. Morgenstern [19] 5084.0 − 6.05 Present 12042 0.1191 280.98 ENDF/B-VIII.0 12098 0.117 258.889 A. R. De 12123 − 259.0(6.0) U. N. Singh 12150 − 270.0(45.0) R. Macklin 12100 − 292.0(26.0) J. Morgenstern 12100 − 267.0 Present 15476 0.1142 87.601 ENDF/B-VIII.0 15510 0.11 114.444 A. R. De 15548 − 129.0(2.0) U. N. Singh 15540 − 118.0(20.0) R. Macklin 15510 − 126.0(11.0) J. Morgenstern 15470 − 118.0 Table 4. Extracted neutron resonance parameters of 209Bi.
-
A new measurement of the neutron total cross-sections of 209Bi with two samples of different thicknesses was performed using the time-of-flight technique on the Back-n beamline at CSNS. Neutron energy was determined by the NTOX spectrometer, and the neutron total cross-sections were derived from the transmission in the energy range from 0.3 eV to 20 MeV. As the double-bunch proton beam was used, the neutron energy spectrum unfolding was applied.
There was a notable agreement when comparing our measured data with prior measurements and evaluation data from the ENDF/B-VIII.0 library. The experimental uncertainty for neutron total cross-sections using the 20 mm thick sample was less than that of the 6 mm thick sample. Most energy points exhibited uncertainties under 5%, underscoring the high quality of our measurements. Based on this, the data were further analyzed using the R-matrix theory. This yielded neutron resonance parameters for the energy range of 0.5–20 keV, which were then compared with published data and the ENDF/B-VIII.0 library.
This measurement result represents the first measurement of the neutron total cross-section of bismuth in such a wide energy range (spanning eight orders of magnitude), which is in favor of evaluating the related nuclear reaction data. This is especially important when different experimental data exhibit certain differences in the overlapping energy regions. For example, the measurement energy range of Wang Taofeng et al. [20] is 0.1−100 eV, while that of J. A. Harvey et al. (data from the EXFOR library) is 1.8 eV−25 keV. Furthermore, the data difference in the overlapping energy region is as high as 15%, even exceeding the data uncertainty.
In the future, a 6Li-containing scintillator-based detector will be developed and applied for neutron total cross-sections measurement as an update to the NTOX spectrometer. A fast scintillator-based neutron total cross-section (FAST) spectrometer is under construction, and the physical design has been completed [21, 22]. With the FAST spectrometer, the experimental uncertainty of the neutron-induced total cross-sections in the energy region of eV to keV will be improved due to the smooth reaction cross-section of 6Li(n, α)T, and the statistical uncertainty will also be improved for the high detection efficiency of the FAST spectrometer.
-
The authors are grateful to the operating crew of the CSNS for providing a very stable neutron beam for measurements.
Measurement and analysis of the neutron-induced total cross-sections of 209Bi from 0.3 eV to 20 MeV on the Back-n at CSNS
- Received Date: 2023-05-18
- Available Online: 2023-12-15
Abstract: The neutron-induced total cross-section of 209Bi is crucial for the physical design and safety assessment of lead-based fast reactors, and the quality of experimental data should be improved for evaluation and application. A recent experiment was conducted on the back-streaming white neutron beamline (Back-n) at the China Spallation Neutron Source (CSNS) using the neutron total cross-section spectrometer (NTOX). The neutron energy was determined using a fast multi-cell fission chamber and the time-of-flight technique. Two high-purity bismuth samples, 6 mm and 20 mm in thickness, were chosen for neutron transmission measurements and comparisons. The neutron total cross-sections of 209Bi, ranging from 0.3 eV to 20 MeV, were derived considering neutron flight time determination, flight path calibration, and background subtraction. A comparison of the experimental results with the data in the ENDF/B-VIII.0 library showed fair agreement, and the point-wise cross-sections were found to be consistent with existing experimental data. Special attention was given to the determination of resonance parameters, which were analyzed using the R-matrix code SAMMY and Bayesian method in the 0.5 keV to 20 keV energy range. The extracted resonance parameters were compared to previously reported results and evaluated data. This study is recognized as the first one where the neutron total cross-section of bismuth across such a broad energy spectrum is measured in a single measurement or experiment, and it provides valuable data for the assessment of related reaction information for evaluated libraries and the advancement of lead-bismuth-based nuclear systems.


 DownLoad: