


 Abstract
 HTML
HTML Reference
 Related
 PDF
PDF


-
The deuteron (d) is a bound state of protons and neutrons and has long been a prominent subject of physics. In the field of nuclear physics, the coalescence model was initially proposed to explain the emission of d in reactions induced by protons with energies of
$ 25 $ −$ 30 $ GeV [1, 2]. Over the years, the coalescence model has become an effective tool for describing the production of particles and anti-particles [3]. The study of d production is crucial to verifying theoretical models [4] and provides a basis for understanding the particle production mechanism [5]. In the fields of astrophysics and cosmology, the study of processes involving cosmic anti-nuclei, such as anti-deuterons ($ \bar{d} $ ), serves as a sensitive probe for dark matter annihilation and allows for indirect studies of dark matter [6, 7]. This type of study is also important for understanding the properties of dense astrophysical objects, such as neutron stars [8,9]. In the field of particle physics, experimental studies of processes involving d are critical to validating the Lund string fragmentation model and predicting d production in Z boson decays. [10]. Many results have been reported by various experiments, including those on heavy ion collisions [11], proton-proton collisions [12], proton-nucleus collisions [13], and photoproduction reactions [14]. In contrast, relevant studies on positron-electron collisions are relatively limited owing to their low production cross-sections [15].In recent years, an increasing number of hadrons, such as
$ q\bar{q} $ for mesons,$ qqq $ for baryons,$ q\bar{q}q\bar{q} $ for “tetraquark” states [16], and$ qqqq\bar{q} $ for “pentaquark” states [17], have been observed in experiments. In particular, the exotic state d*($ 2380 $ ), with a mass around$ 2380 $ MeV/$ c^{2} $ and a width of approximately$ 70 $ MeV, was observed in the isoscalar double-pionic fusion process$ pn \rightarrow d \pi^{0} \pi^{0} $ [18] and was subsequently confirmed in many other processes [19−22]. This state has been proposed as an excited d, a molecule with a large$ \Delta\Delta $ component [23], or a hexaquark state dominated by a hidden-color component [24]. Because one-third of d*($ 2380 $ ) decays into final states involving d, processes involving d offer potential test-beds to investigate the properties of d*($ 2380 $ ). The BESIII experiment, operated in the tau-charm energy region, has collected a large positron-electron collision data sample in the$ 4.009 $ −$ 4.946 $ GeV energy range. This provides a good opportunity to study d and$ \bar{d} $ production, the d*($ 2380 $ ) resonance, dibaryon states, and hexaquark states.Good performance in particle identification (PID) is essential for precision measurements in quark flavor physics, τ physics, top physics, Higgs physics, and other fields [25]. The BES and BESIII Collaborations reported systematic studies of the PID efficiencies of electrons, muons, pions, kaons, and protons [26−29]. The LHCb and BaBar Collaborations have also reported extensive PID studies [30, 31]. However, little knowledge on d PID is currently available owing to the low production rate. An effective d identification method is helpful for reducing backgrounds from other particles. Previously, the ARGUS [32], BaBar [33], CLEO [34], and ALEPH [35] Collaborations reported
$ \bar d $ production, whereas only the ALEPH Collaboration reported a d PID study. Usually, the specific ionization energy loss (${\rm d}E/{\rm d}x$ ) and time-of-flight (TOF) measurements are used for d or$ \bar d $ identification. Details of methods and momentum ranges in d or$ \bar d $ PID studies from different experiments are shown in Table 1.Experiment Method Object p/(GeV/c) ARGUS ${\rm d}E/{\rm d}x$ +TOF

$\bar{d}$ 

0.45−1.70 BaBar ${\rm d}E/{\rm d}x$ 

$\bar{d}$ 

0.50−1.50 CLEO ${\rm d}E/{\rm d}x$ 

$\bar{d}$ 

0.45−1.45 ALEPH ${\rm d}E/{\rm d}x$ 

$d/\bar{d}$ 

0.62−1.03 Table 1. Methods and momentum ranges of d or
$\bar{d}$ PID studies from different experiments.In this study, we investigate d PID efficiencies using the
${\rm d}E/{\rm d}x $ method with a data sample collected by the BESIII detector at center-of-mass (c.m.) energies between 4.009 and 4.946 GeV.$ \bar d $ is not considered owing to limited statistics. In addition, due to the challenges of detecting low-momentum particles using the TOF detector and the limited statistics of high-momentum d, we only aim for the PID efficiencies of d with momenta ranging from 0.52 to 0.72 GeV/c. -
The Beijing Spectrometer III (BESIII) [36] is a general-purpose detector operated at the Beijing Electron-Positron Collider II [37]. The BESIII detector consists of four sub-detectors: the mult-layer drift chamber (MDC), TOF counter, electric-magnetic calorimeter, and muon chamber. The MDC sub-detector determines the momentum and vertex position for charged particles [38]. It also provides
$ {\rm d}E/{\rm d}x $ information for PID of charged particles. It is a type of gas detector that contains multiple layers of field wires and signal wires, and its operating gas consists of a mixture of helium (He) and C3H8 in a ratio of 60:40. The energy loss of charged particles through ionization in the working gas,$ {\rm d}E/{\rm d}x $ , is obtained by measuring the charge deposited on the signal wires. After${\rm d}E/{\rm d}x $ calibration, a resolution of approximately 6% is obtained for minimum ionization particles. The TOF counter measures the flight time of charged particles, which is widely used for PID. The time resolution in the TOF barrel [36] region is 68 ps, whereas that in the end-cap [36] region is 110 ps. In 2015, the end-cap TOF system underwent an upgrade using multi-gap resistive plate chamber technology, resulting in an improved time resolution of 65 ps [39].The BESIII detector is simulated by the GEANT4-based simulation software BOOST [40, 41], which includes the geometric and material description of the BESIII detector, the detector response, and digitization models.
-
The data samples taken at c.m. energies between 4.009 and 4.946 GeV with a total integrated luminosity of approximately
$ 18 \;{\rm{fb}}^{-1} $ are used in this analysis. For the data sample at each energy point, the c.m. energy is measured using the$ e^+e^-\rightarrow \mu^+\mu^- $ process, with an uncertainty less than 1.0 MeV [42, 43], and the integrated luminosity is measured using the Bhabha process, with an uncertainty of 1.0% [43]. The data samples are divided into seven subsamples according to different data taking periods to consider slightly different detector performances.The
$ e^+e^-\rightarrow {\bar p}{\bar n}d $ process is simulated in the phase-space model with ConExc [44, 45] at each c.m. energy. The potential backgrounds are studied using the inclusive Monte Carlo (MC) sample, corresponding to an integrated luminosity of 32 fb$ ^{-1} $ at$ \sqrt s=4.178 $ GeV with KKMC [46, 47]. The MC samples used in this study are based on Geant4 version 9.3.p01, with the$\mathtt{QGSP\_BERT\_CHIPS}$ physics list [48]. -
The BESIII experiment usually combines both
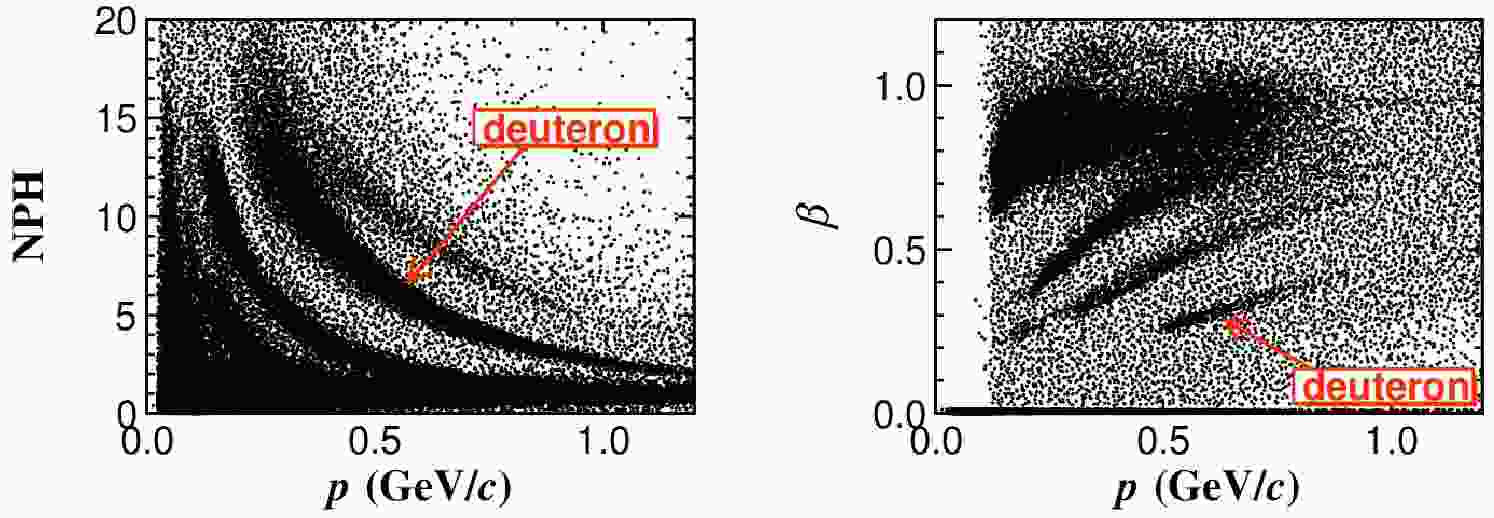
$ {\rm d}E/{\rm d}x $ and TOF information to identify charged particles. As shown in Fig. 1 and Fig. 2, both${\rm d}E/{\rm d}x $ and TOF information can effectively separate d from other particles in a certain momentum range. Because the c.m. energies are all below 5 GeV and d is heavy (approximately 1.87 GeV/$ c^{2} $ ), the momentum of d is relatively low (mostly below 0.75 GeV/c) when produced. The low momentum d is easy to circulate within the MDC, which makes it unable to hit the TOF detector. Because only a small fraction of deuterons can reach the TOF detector, identifying d with the TOF information will cause significant efficiency loss. Therefore, we use the$ {\rm d}E/{\rm d}x $ information to study d PID, with the help of the TOF information. See Section IV.D for more information.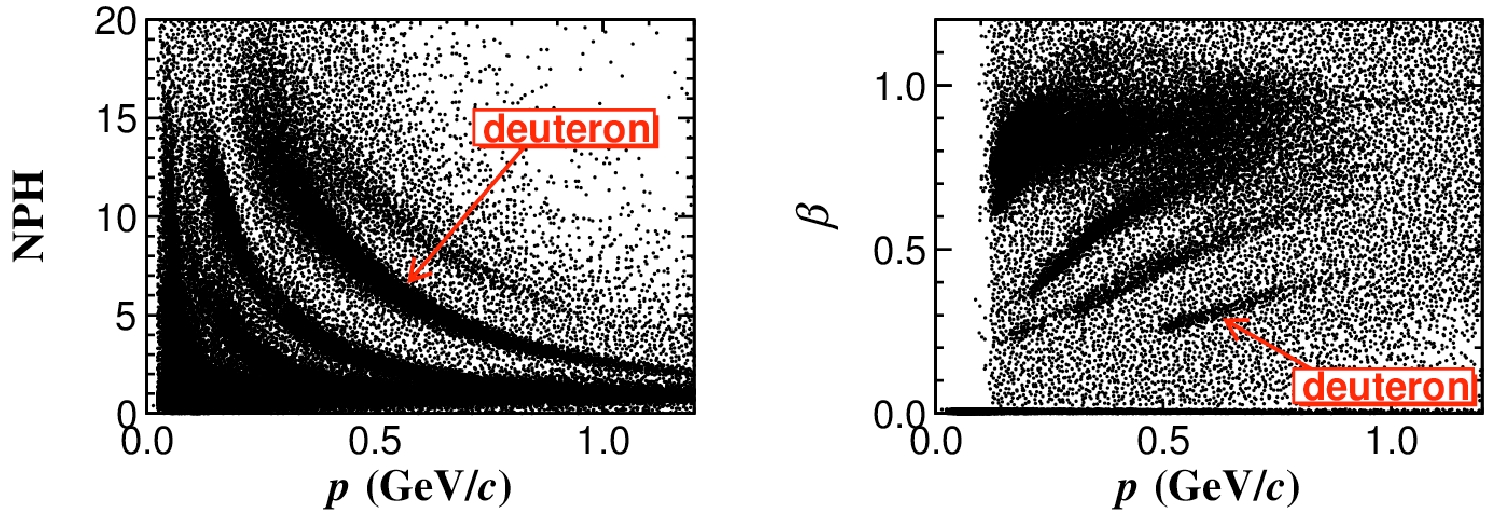
Figure 1. (color online) Distributions of normalized pulse height of
${\rm d}E/{\rm d}x$ (NPH) versus momentum (left) and β versus momentum (right). All plots are based on the 2016 data sample, which was collected in 2016 at a center-of-mass energy of 4.178 GeV.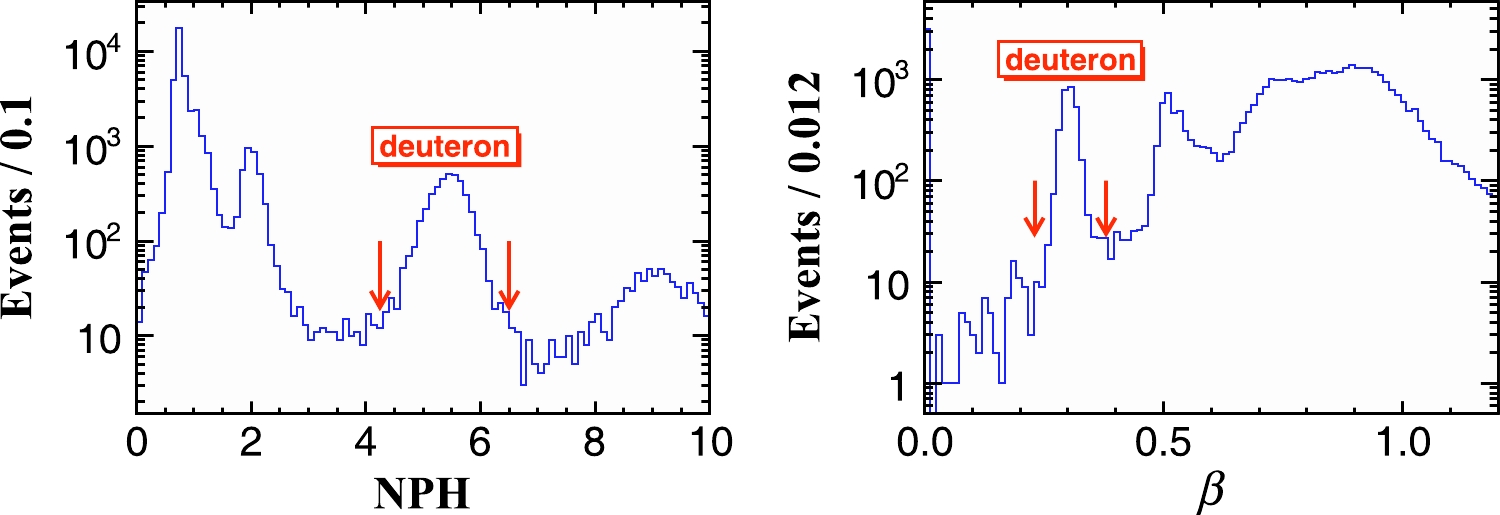
Figure 2. (color online) Distributions of NPH (left) and β (right) for candidates in the momentum range 0.595−0.605 GeV/c. All plots are based on the 2016 data sample.
The
${\rm d}E/{\rm d}x $ method uses the normalized residual of${\rm d}E/{\rm d}x $ , denoted as$ \begin{array}{*{20}{l}} \chi^{}_{{\rm d}E/{\rm d}x} = \dfrac{{\rm d}E/{\rm d}x_{\rm meas} -{\rm d}E/{\rm d}x_{\rm exp}}{\sigma_{{\rm d}E/{\rm d}x}}, \end{array} $

(1) where
$ {\rm d}E/{\rm d}x_{\rm meas} $ ,$\sigma_{{\rm d}E/{\rm d}x}^{}$ , and$ {\rm d}E/{\rm d}x_{\rm exp} $ represent the measured value, the uncertainty of${\rm d}E/{\rm d}x_{\rm meas} $ , and the expected value, respectively. The$\chi_{{\rm d}E/{\rm d}x}^{}$ distribution is expected to follow a normal distribution, as shown in Fig. 3.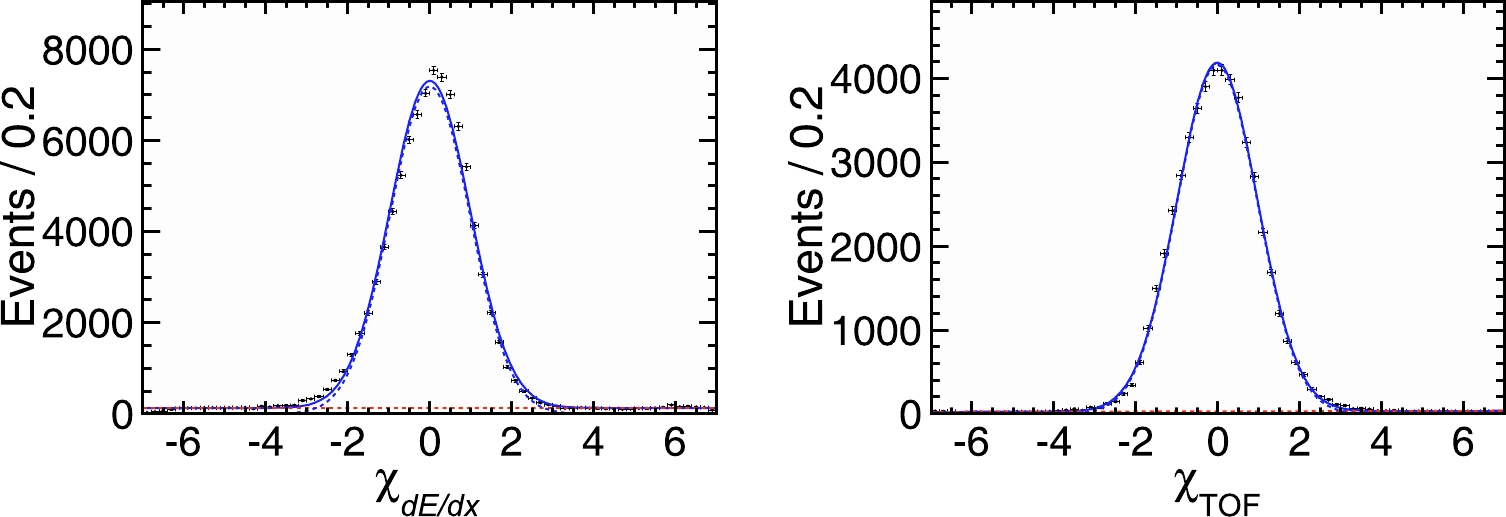
Figure 3. (color online) Fits to
$\chi_{{\rm d}E/{\rm d}x}^{}$ (left) and$\chi_{\rm TOF}^{}$ (right) of the 2016 data sample (dots with error bars). A Gaussian function is marked with a blue dashed line, and a first-order Chebychev polynomial is marked with a red dashed line.Once the
$\chi_{{\rm d}E/{\rm d}x}^{}$ distribution is obtained, the probability density function of a given particle hypothesis is constructed as$ \begin{array}{*{20}{l}} {\rm prob}(\chi_{{\rm d}E/{\rm d}x}^{2}, 1) = 1 - f(\dfrac{1}{2}, x), \end{array} $

(2) with
$ x=\chi_{{\rm d}E/{\rm d}x}^{2}/2 $ and$f(\dfrac{1}{2},x) = \dfrac{1}{\sqrt{\pi}}\times\int_{0}^{x}t^{-\frac{1}{2}}\times{{\rm e}^{-t}{\rm d}t}$ . Here, 'prob' represents the probability of a value greater than the observed$ \chi_{{\rm d}E/{\rm d}x}^{2} $ . It must satisfy a certain value to achieve the desired identification ability. In d identification,$ {\rm prob}(\chi_{{\rm d}E/{\rm d}x}^{2}, 1) $ is usually required to be greater than a certain value in the range of$ (0, 1) $ , and a larger value represents a more stringent PID requirement.Deuterons are expected to be primarily produced through the reaction of charged particles with beam pipe materials. As a result, the flight time is divided into two segments. However, because the flight distance in the beam pipe is extremely short, the impact on the time resolution is negligible. Therefore, this effect is disregarded in this study. As shown in Fig. 1, β represents the ratio of the speed of charged particles to the speed of light, defined as
$ \begin{array}{*{20}{l}} \beta = \dfrac{L_{\rm path}}{c \times t_{\rm TOF}^{}}, \end{array} $

(3) where
$ L_{\rm path} $ , c, and$t_{\rm TOF}^{}$ represent the flight distance of the particle, the speed of light, and the flight time of the charged particle, respectively. The$\chi_{\rm TOF}^{}$ value is given by$ \begin{array}{*{20}{l}} \chi_{\rm TOF}^{} = \dfrac{\beta_{\rm meas} - \beta_{\rm exp}}{\sigma_{\rm TOF}}, \end{array} $

(4) where
$ \beta_{\rm meas} $ ,$\sigma_{\rm TOF}^{}$ , and$ \beta_{\rm exp} $ represent the measured value, the uncertainty of$ \beta_{\rm meas} $ , and the expected value, respectively. Similarly, the$\chi_{\rm TOF}^{}$ distribution is expected to follow a normal distribution, as shown in Fig. 3. -
When charged particles pass through a detector, they interact with detector materials, thereby causing momentum loss. To account for this effect, BESIII has developed a track fitting algorithm based on the Kalman filter method [38]. This algorithm carefully handles the effects of multiple scattering, energy loss, non-uniformity of the magnetic field, and wire sag. To improve the momentum resolution and reduce the mean value of the difference between truth and reconstructed momenta in candidate events, we apply the track fitting algorithm for d reconstruction. The input/output check shows that this algorithm works well in d momentum correction. As shown in Fig. 4, the difference between the corrected and true momenta is significantly improved in the simulated sample.
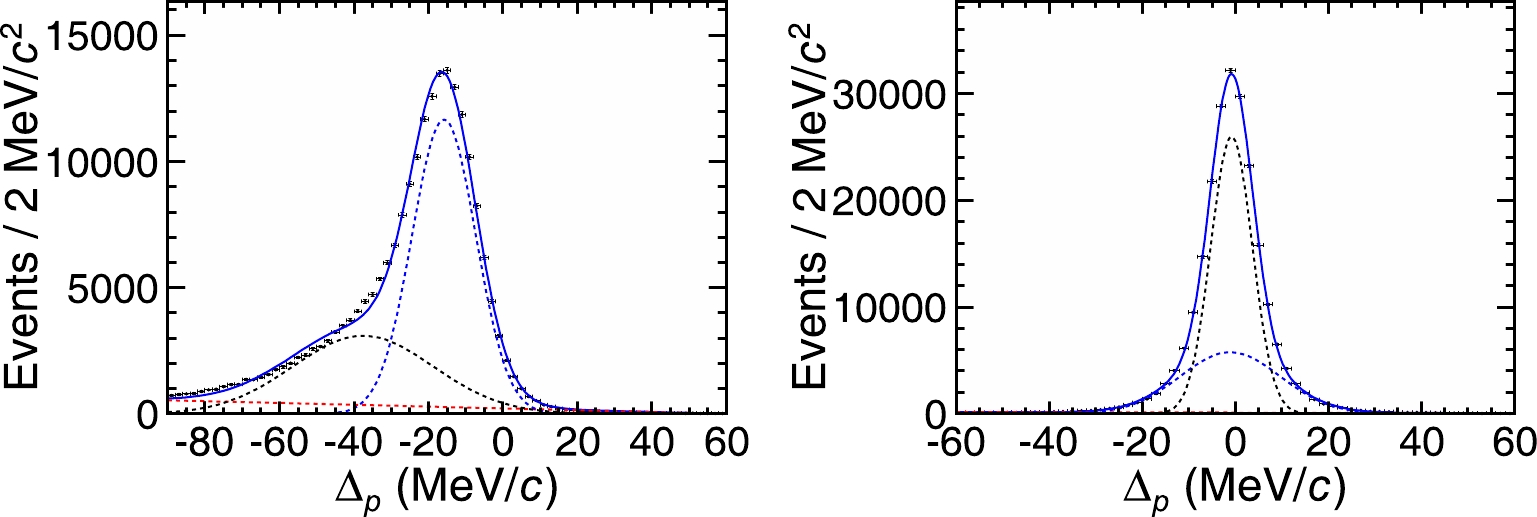
Figure 4. (color online) Momentum difference between reconstruction and truth before (left) and after (right) correction. Two Gaussian functions are marked by blue and black dashed lines, and a first-order Chebychev polynomial is marked by a red dashed line.
After momentum correction using the track fitting algorithm, we study the PID efficiencies of d in the momentum range
$ 0.52 $ −$ 0.72 $ GeV/c. -
To select d candidates, the number of charged tracks must be larger than two for data, whereas it must be two and the net charge must be zero for MC simulation. Charged tracks are reconstructed with the MDC hits within the range
$ |\cos\theta| $ <$ 0.93 $ , where θ is the polar angle with respect to the z-axis. They are required to originate from the interaction region, defined as$ R_{xy} $ <$ 1.0 $ cm and$ \vert V_z \vert $ <$ 10.0 $ cm, where$ R_{xy} $ and$ \vert V_z \vert $ are the projections of the distances from the closest approach of the tracks to the interaction point in the x-y plane and the z direction, respectively. The combined${\rm d}E/{\rm d}x $ and TOF information is used to identify the observed particles to improve the purity of the sample. The probabilities of identifying the track as electrons, pions, kaons, and protons must be less than$ 0.001 $ , which ensures high purity of the selected d samples.After applying all the above selection criteria, the remaining backgrounds are studied with the large inclusive MC sample generated at
$ \sqrt s=4.178 $ GeV. In the d signal region, the distribution of NPH versus momentum of the inclusive MC sample is a distinct banded distribution. With the topology and event visualization tool [49], we find that these tracks predominantly originate in the beam pipe. This is further supported by the two-dimensional distribution of$ V_{y} $ versus$ V_{x} $ in the data sample, and the d sample is significantly larger than the$ \bar d $ sample. Therefore, the deuterons used are mainly produced by the reaction of secondary charged particles with the beam pipe materials.To improve the purity of the d sample, some further selection criteria of
$ p_d\in (0.52,0.72) $ GeV/c,$\chi_{{\rm d}E/{\rm d}x}^{} \in (-3,3)$ , and$\chi_{\rm TOF}^{}\in (-3,3)$ are imposed on the selected candidates. The transverse momentum and cosθ distributions of the accepted candidates in data and MC simulation are shown in Fig. 5. The data-MC consistency in the$ \cos\theta $ distribution is good, while the transverse momentum is distributed in the same interval with a small difference in shape. The difference in the transverse momentum is mainly caused by the different sources of d production in data and MC simulation. In data, d is not subject to channel restrictions and is mostly produced through secondary particle reactions with the beam pipe. In MC simulation, d is produced through an exclusive process at the collision point. This discrepancy leads to a small difference in the transverse momentum distributions between data and MC simulation.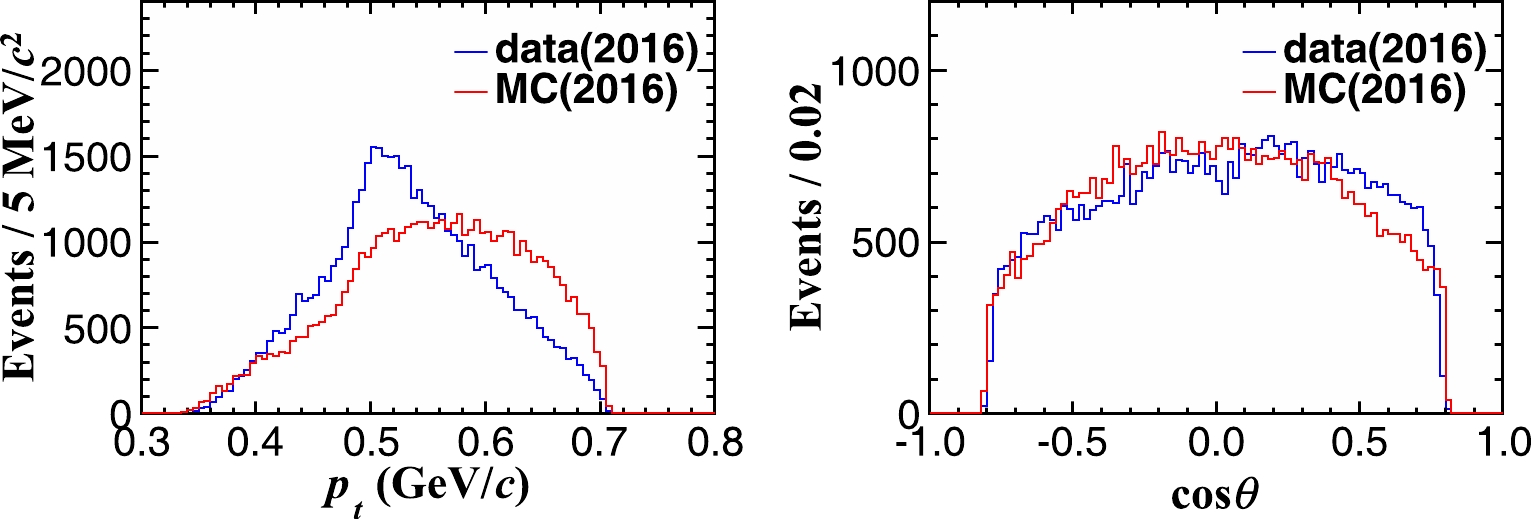
Figure 5. (color online) Transverse momentum (left) and cosθ (right) distributions of candidates in the 2016 data sample and signal MC sample.
The purity of d samples, as shown in Table 2, is obtained by integrating the corresponding χ distribution within the
$ \pm $ $ 3\sigma $ range. The purity of the obtained d samples is higher than 97%.Year Purity (%) ${\rm d}E/{\rm d}x$ 

TOF $2011$ 

$99.2$ 

$98.5$ 

$2013$ 

$98.6$ 

$98.6$ 

$2014$ 

$99.3$ 

$98.6$ 

$2016$ 

$99.4$ 

$98.4$ 

$2017$ 

$98.7$ 

$98.4$ 

$2020$ 

$97.7$ 

$98.4$ 

$2021$ 

$97.9$ 

$98.2$ 

Table 2. Purity of d samples in different
$\chi_{{\rm d}E/{\rm d}x}$ and$\chi_{\rm TOF}$ signal intervals. -
To calculate the d PID efficiency using the
${\rm d}E/{\rm d}x $ information, we must first obtain the total number of deuterons. Because no exclusive control sample is available, the total number of deuterons can only be obtained from data. Considering that the d PID method with only TOF information has been well established, the d sample selected by the TOF information is used as the control sample. The d PID efficiency is determined via$ \begin{array}{*{20}{l}} \varepsilon = \dfrac{N_{\rm obs}}{N_{\rm tot}}, \end{array} $

(5) where
$ N_{\rm tot} $ is the number of signals obtained from the fit to the$\chi_{\rm TOF}^{}$ distribution, and$ N_{\rm obs} $ is the number of signals obtained from the fit to the$\chi_{{\rm d}E/{\rm d}x}^{}$ distribution of the accepted candidates.$ N_{\rm tot} $ is obtained by integrating the fitted signal shape within$ ({\rm mean}-3\sigma, {\rm mean}+3\sigma) $ , whereas$ N_{\rm obs} $ is obtained from the fit to the obtained$\chi_{{\rm d}E/{\rm d}x}^{}$ distribution. The "mean" value corresponds to the expected value obtained from the Gaussian fit. As an example, Fig. 6 shows the fits to the$\chi_{{\rm d}E/{\rm d}x}^{}$ and$\chi_{\rm TOF}^{}$ distributions of the 2016 data sample.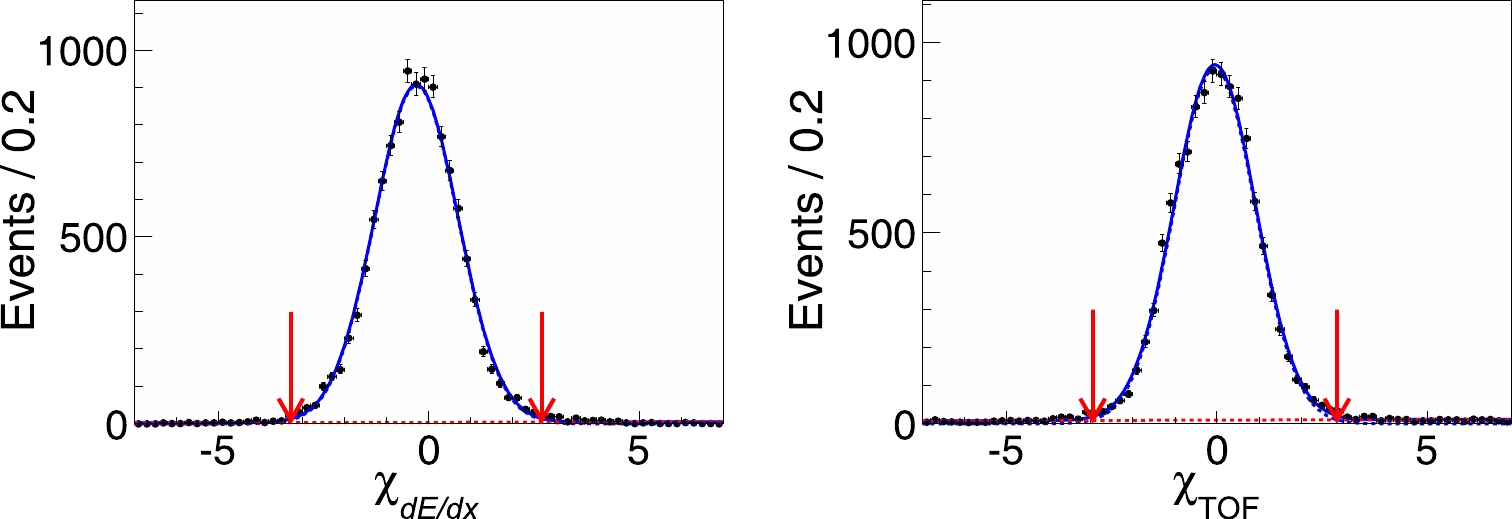
Figure 6. (color online) Fits to
$\chi_{{\rm d}E/{\rm d}x}^{}$ (left) and$\chi_{\rm TOF}^{}$ (right) of candidates in the momentum interval 0.52−0.57 GeV/c in the 2016 data sample. A Gaussian function is marked with a blue dashed line, and a first-order Chebychev polynomial is marked with a red dashed line.The d PID efficiencies of data and MC simulation as well as their differences in different momentum ranges and data taking periods are shown in Table 3. Figure 7 shows the variation in the d PID efficiency of data with a momentum interval. We find that the d PID efficiencies of the data samples from 2011 to 2017 are higher than 97%, whereas those of the data samples from 2020 to 2021 are slightly lower but not less than 95%. This indicates that the
$ {\rm d}E/{\rm d}x $ method is an effective approach for d identification.Year p/(GeV/c) $\varepsilon_{\rm data}$ (%)

$\varepsilon_{\rm MC}$ (%)

$\Delta_{\rm diff}\pm\Delta_{\rm fit}$ (%)

2011 0.52−0.57 99.6±1.8 100.0±0.0 0.4±0.0 0.57−0.62 99.3±1.5 100.0±0.0 0.7±0.3 0.62−0.67 99.2±1.6 100.0±0.0 0.8±0.5 0.67−0.72 98.6±1.8 100.0±0.0 1.4±0.6 2013 0.52−0.57 97.6±1.1 100.0±0.0 2.4±0.4 0.57−0.62 97.3±0.9 100.0±0.0 2.7±0.4 0.62−0.67 98.3±1.0 100.0±0.0 1.7±0.4 0.67−0.72 98.7±1.1 100.0±0.0 1.3±0.3 2014 0.52−0.57 100.0±1.3 100.0±0.0 0.0±0.0 0.57−0.62 99.4±1.0 100.0±0.0 0.6±0.2 0.62−0.67 99.0±1.1 100.0±0.0 1.0±0.1 0.67−0.72 100.0±1.3 100.0±0.0 0.0±0.0 2016 0.52−0.57 99.9±0.9 100.0±0.0 0.1±0.4 0.57−0.62 100.0±0.8 100.0±0.0 0.0±0.7 0.62−0.67 99.8±0.9 100.0±0.0 0.2±0.7 0.67−0.72 99.9±1.0 99.9±0.0 0.0±0.8 2017 0.52−0.57 98.4±1.0 100.0±0.0 1.6±0.2 0.57−0.62 98.1±0.8 99.5±0.0 1.4±0.4 0.62−0.67 98.6±0.9 99.7±0.0 1.1±0.4 0.67−0.72 99.2±1.0 98.9±0.0 0.4±0.3 2020 0.52−0.57 95.1±1.0 100.0±0.0 4.9±1.0 0.57−0.62 95.9±0.9 100.0±0.0 4.1±0.2 0.62−0.67 96.5±0.9 100.0±0.0 3.5±0.3 0.67−0.72 97.1±1.1 100.0±0.0 2.9±0.2 2021 0.52−0.57 95.6±1.4 100.0±0.0 4.5±0.8 0.57−0.62 96.1±1.2 100.0±0.0 3.9±0.7 0.62−0.67 95.9±1.3 100.0±0.0 4.1±0.6 0.67−0.72 97.5±1.4 100.0±0.0 2.5±0.5 Table 3. PID efficiencies and the differences in PID efficiencies between data and MC simulation of d in different momentum ranges and data taking periods.
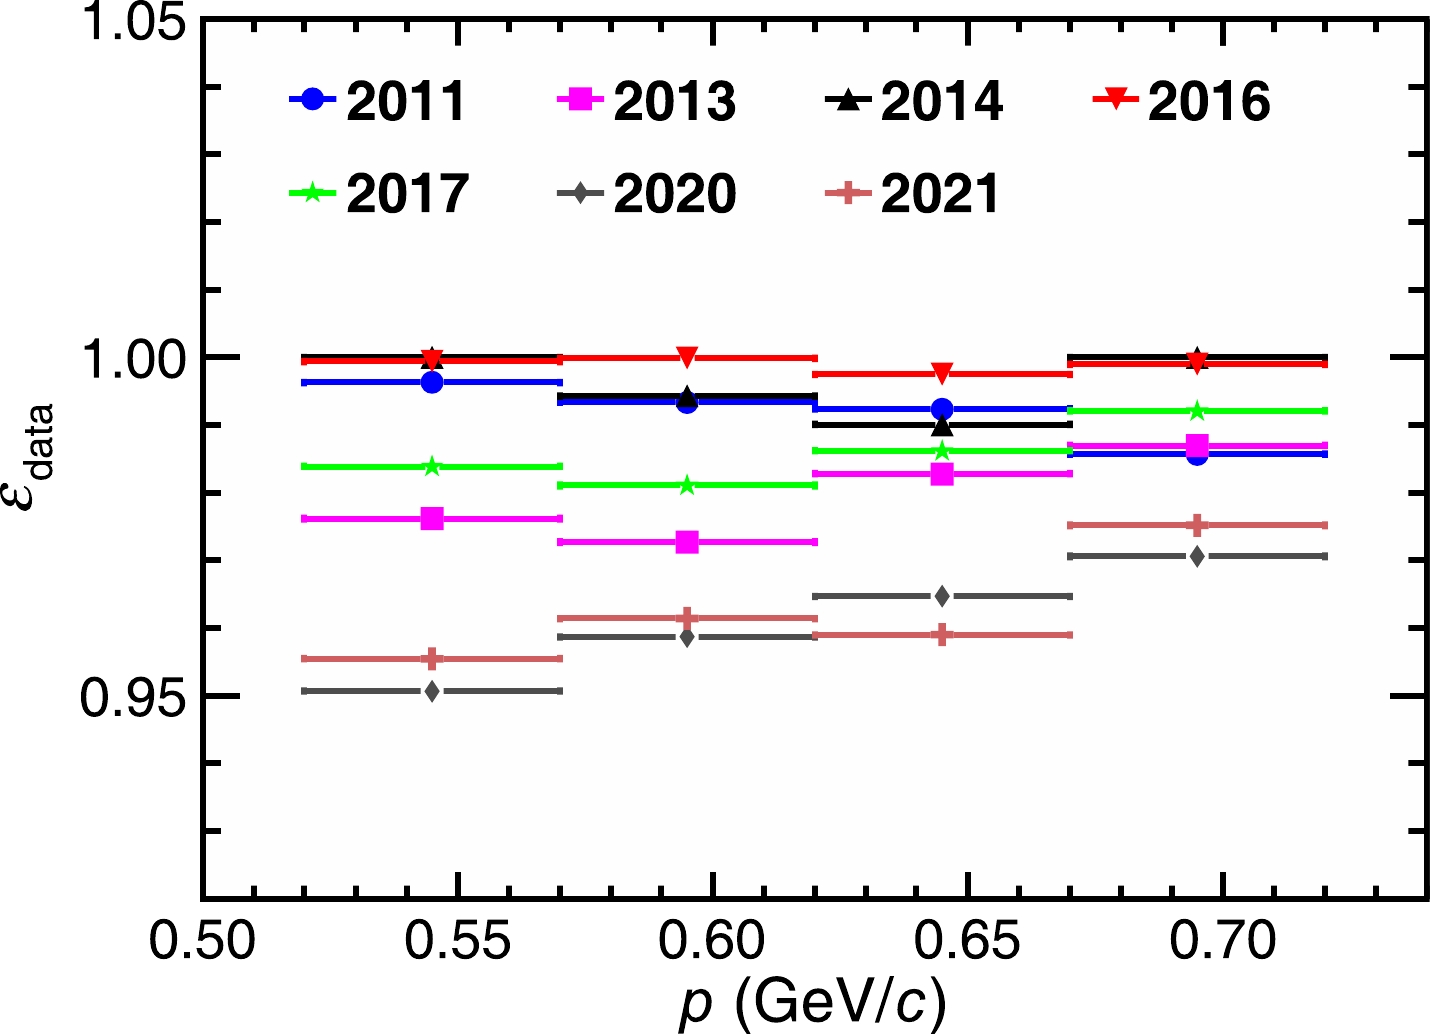
Figure 7. (color online) Variation in the d PID efficiency of data with a momentum interval.
-
The difference in the d PID efficiencies between data and MC simulation is determined via
$ \begin{array}{*{20}{l}} \Delta_{\rm diff} = \Big\lvert\dfrac{\varepsilon_{\rm data} - \varepsilon_{\rm MC}}{\varepsilon_{\rm MC}}\Big\rvert, \end{array} $

(6) where
$ \varepsilon_{\rm data} $ and$ \varepsilon_{\rm MC} $ represent the efficiencies of data and MC simulation, respectively. The uncertainty of$ \Delta_{\rm diff} $ is assigned as the difference between the fit and sideband methods and is calculated using$ \Delta_{\rm fit} = \sqrt{\left(\frac{\Delta \varepsilon_{\rm data}}{\varepsilon_{\rm MC}}\right)^2 + \left(\frac{\varepsilon_{\rm data}\Delta \varepsilon_{\rm MC}}{\varepsilon_{\rm MC}^2}\right)^2}, $

(7) $ \begin{array}{*{20}{l}} \Delta {\varepsilon_{\rm data}} = \Big\lvert \dfrac{\varepsilon_{\rm data}^{\rm fit} - \varepsilon_{\rm data}^{\rm side}}{\varepsilon_{\rm data}^{\rm fit}} \Big\rvert, \end{array} $

(8) $ \begin{array}{*{20}{l}} \Delta {\varepsilon_{\rm MC}} = \Big\lvert \dfrac{\varepsilon_{\rm MC}^{\rm fit} - \varepsilon_{\rm MC}^{\rm side}}{\varepsilon_{\rm MC}^{\rm fit}} \Big\rvert, \end{array} $

(9) where
$ \varepsilon_{\rm data}^{\rm fit} $ ,$ \varepsilon_{\rm data}^{\rm side} $ ,$ \varepsilon_{\rm MC}^{\rm fit} $ , and$ \varepsilon_{\rm MC}^{\rm side} $ represent the efficiencies of data and MC simulation with the fit and sideband methods, respectively.The obtained results are summarized in Table 3. For the majority of the samples, there is good consistency between the data and MC simulation in the d PID efficiencies.
-
In this study, we identify d in the momentum range
$ 0.52 $ −$ 0.72 $ GeV/c using$ e^+e^- $ collision data taken in the c.m. energy range$ 4.009 $ −$ 4.946 $ GeV at BESIII. Based on the$ {\rm d}E/{\rm d}x $ method, the d PID efficiencies of data are higher than 95%, with a maximum difference of$ (4.9\pm1.0) $ % between data and MC simulation. For the data samples collected from 2011 to 2017, the d PID efficiencies are higher than 97%. This indicates good performance of d identification. Additional methods are expected for investigating d identification in higher or lower momentum ranges. In addition, the data samples taken at higher c.m. energies by BESIII in the near future will offer new opportunities to further explore d identification [50, 51]. -
The authors are grateful to the BESIII software group for useful discussions. We express our gratitude to the BESIII Collaboration and BEPCII team for their strong support.
Identification of deuterons at BESIII
- Received Date: 2023-08-29
- Available Online: 2024-01-15
Abstract: The identification of deuterons with momenta in the range of 0.52−0.72 GeV/c is studied with specific ionization energy loss information using a data sample collected by the BESIII detector at center-of-mass energies between 4.009 and 4.946 GeV. Clean deuteron samples are selected using time of flight information. For all data samples, the deuteron identification efficiencies are higher than 95%, with a maximum difference of


 DownLoad: