


 Abstract
 HTML
HTML Reference
 Related
 PDF
PDF


-
With the development of modern accelerator facilities and theoretical models over the last few decades, research on superheavy nuclei (SHN) has made remarkable progress [1]. To date, SHN have been experimentally produced up to
$ ^{294}_{118} $ Og [2]. It is known that SHN have been generated mainly relying on fusion and transfer reactions [3−5] and are identified through α decay chains [6]. The synthesis of new elements with$ Z>118 $ has become an urgent and challenging goal, and several attempts for elements with$ Z=119,120 $ have failed [7−10]. However, it has been theoretically predicted that there may be an “island of stability” near$ Z = $ 114 and$ N= $ 184, which is of great significance to the limit of the existence of nuclei [11]. Therefore, explorations in the superheavy region have garnered considerable attention in nuclear physics.Moreover, exploring the decay channels of SHN is essential to gain nuclear information. Notably, cluster radioactivity (CR) is a rare decay channel, between α decay and spontaneous fission, characterized by the emitted particle that is heavier than an α particle but lighter than fission fragments. It is remarkable that CR was predicted in 1980 by
$ \text{S}\check{a}\text{ndulescu} $ , etc. [12], and was experimentally confirmed for the first time by the existence of$ ^{14} $ C emission from$ ^{223} $ Ra in 1984 [13]. Subsequently$ ^{20} $ O,$ ^ {23} $ F,$ ^{24} $ Ne,$ ^{28} $ Mg, and$ ^ {32,34} $ Si have also been observed, followed by$ ^{14} $ C as heavy cluster emissions, leading to transitions to the doubly magic nucleus$ ^{208} $ Pb or its neighbors [14−17]. CR has gradually attracted attention and played a role in understanding the properties of nuclear structure, including the spin, parity, half-life, shell effect, and structural deformation of unstable SHN [18−27].Given the above experimental and theoretical requirements, theoretical predictions are preferred, and effective approaches have emerged to provide inspiration for the research gap. A large number of remarkable methods can theoretically describe the CR of heavy nuclei and SHN, serving as a comprehensive framework for the synthesis and identification of new nuclides. Generally, these theories are mainly divided into two categories: the decay-type and fission-type. The decay-type theory claims that the cluster is preformed initially in the parent nucleus via a complex mechanism and then emitted through quantum-tunneling effects with a certain probability, which is similar to the process of α decay. The specific models include the density-dependent cluster model (DDCM) [28−31] and generalized density-dependent cluster model (GDDCM) [32, 33]. On the other hand, in the fission-type theory, clusters are believed to gradually form as a result of shape evolution during the barrier penetration process of the parent nucleus [34]. Various models have been developed, such as the generalized liquid-drop model (GLDM) [35], Coulomb and proximity potential model (CPPM) [36], and effective liquid drop model (ELDM) [37]. In addition, several empirical formulas are considered excellent in describing CR in some aspects, such as the unified decay formula (UDF) [38], unviersal decay law (UDL) [39], modified Brown formula [40], and Santhosh's formula [41].
CR is important for research on the decay properties of unstable SHN [42, 43]. We generalize the DDCM and UDF to predict the cluster radioactivity of SHN. In this study, we implement the theoretical DDCM and UDF approaches to study CR over the current experimental data, yielding some interesting results worthy of discussion. The DDCM has been successfully applied to study various decay modes of SHN, including α decay, proton emission, and CR [44−47], where the famous double-folding model is used for the potential of the nucleus-nucleus, and the microscopic nucleon-nucleon interactions are also considered. The preformation probability adopted in the DDCM takes the form of the phenomenological exponential expression. In contrast, the UDF with a simple form and many general features is also adjusted and applied in this study. We extend the calculations to systematically predict the properties of the CR of the isotopic chains of
$ Z=119,120 $ .This article is structured as follows. In Sec. II, the theoretical framework of the DDCM, considering the Pauli blocking effect, and the UDF with two sets of refitted parameters are presented. In Sec. III, we systematically reproduce the half-lives of CR and compare them with experimental data. Then, the calculations from the DDCM and UDF are extended to predict the CR of superheavy elements with
$ Z= $ 119 and 120, and several probable cluster emissions are shown and discussed. In addition, we validate a linear relationship between the number of α particles within the clusters and the decay energy in the range of SHN. Finally, a concise and insightful summary is given in Sec. IV. -
Whether we are considering α-decay or complex CR, the processes involve quantum tunneling. The DDCM can be applied to successfully study the properties of α-decay, CR, proton emission, and other decay modes. Unlike in α decay, the daughter nucleus in CR is often a doubly magic nucleus or one in its neighborhood, which is spherical or weakly deformed. Thus, we preliminarily apply the spherical assumption in present calculations for simplicity. Further detailed discussions on the effects of nuclear deformation can be found in Refs. [47−52].
In the framework of the DDCM, the total interaction
$ V(r) $ is taken as the sum of the Coulomb potential$ V_C(r) $ , nuclear potential$ V_N(r) $ , and centrifugal potential as follows:$ V(r)=V_{N}(r)+V_{C}(r)+\frac{(L+\frac{1}{2})^2{\hbar}^{2}}{2{\mu}r^{2}}, $

(1) where r represents the distance between the cluster and core nucleus. We choose to replace
$ L(L+1) $ with the Langer modified centrifugal potential in Eq. (1) [53]. Here, L is the angular momentum carried by the emitted cluster, which is determined by the angular momentum and parity conservation laws during the entire decay process.$ \mu=\dfrac{m_{d}m_{c}}{m_{d}+m_{c}} $ is the reduced mass of the cluster and core nuclei, and$ m_c $ and$ m_d $ are the masses of the cluster and core nucleus, respectively.The Coulomb potential
$ V_{C}(r) $ is defined as$ V_C(r)= \left\{ \begin{array}{l} \dfrac{{Z_{c}Z_{d}{\rm e}^{2}}}{r}\ \ \ \ \ \text{for}\ \ r> R_{d}, \\\\ \dfrac{Z_{c}Z_{d}{\rm e}^{2}}{2R_{d}}\left[3-\left(\dfrac{r}{R_d}\right)^2\right]\ \ \ \text{for}\ \ r\leq R_{d} , \end{array} \right. $

(2) in which
$ Z_{c} $ and$ Z_{d} $ denote the proton numbers of the cluster and core nucleus, respectively, and$ R_{d} $ denotes the radius of the daughter nucleus with$ R_{d}=1.2A_{d}^{1/3} $ , where$ A_{d} $ is the mass number of the daughter nucleus.Within the DDCM, the nuclear part
$ V_N(r) $ of the cluster-core potential is obtained through a double-folding integral approach using the Reid-M3Y nucleon-nucleon interaction, the expression of which reads as$ V_{N}(r)={\lambda} \int {\rm d}\mathbf{r}_{1}{\rm d}\mathbf{r}_{2}\rho _c(\mathbf{r}_1)\rho_d(\mathbf{r}_2)v_{NN}(\mathbf{s}). $

(3) Here,
$ s=|\boldsymbol{r}_1-\boldsymbol{r}_2+\boldsymbol{r}| $ represents the distance between the two interacting nucleons, and$ \rho_c(\mathbf{r}_1) $ and$ \rho_d(\mathbf{r}_2) $ respectively denote the nucleon density distribution of the cluster and daughter nucleus in a frozen density approximation (FDA) [54]. The FDA works reasonably well when the density overlap of the interacting nuclei does not exceed 1/3 of the saturation density [54−57]. At smaller distances, the nuclear potential$ V_N(r) $ tends to exhibit an excessive attraction owing to the significant density overlap of the interacting nuclei. Fortunately, similar to α decay, the cluster is formed in the surface region, and the penetration process is mainly sensitive to the potential near the Coulomb barrier, where both regions maintain low density overlaps. Thus, the FDA seems to still be justified here. To gain a more realistic strength of the nuclear potential, we incorporate a renormalization factor λ into Eq. (3), whose value is determined by the Bohr-Sommerfeld condition in Eq. (7). Several authors have also incorporated medium effects [58, 59] and the incompressibility of nuclear matter [60] to describe the nuclear potential more accurately, and we refer to these references for further information.The Reid-M3Y effective nucleon-nucleon interaction
$ v_{NN} $ is expressed as$ \begin{aligned}[b] v_{NN}(\boldsymbol{s})=&7999 \frac{\exp \left(-4 {s}\right)}{4 {s}} - 2134 \frac{\exp \left(-2.5 s\right)}{2.5 {s}}\\&+J_{00} \delta\left(\boldsymbol{s}\right), \end{aligned} $

(4) which represents an average of the interaction for densities ranging from zero to normal nuclear matter and offers a precise depiction of nucleon dynamics near the surface region [54, 55]. The last term takes the form of the zero-range exchange potential with
$J_{00}(E_c) = -276[1- (0.005E_c/A_c)]$ . Here,$ A_c $ denotes the mass number of the cluster, and$ E_c $ is the kinetic energy of the cluster.The density distribution of the cluster
$ \rho_c $ and core nuclei$ \rho_d $ are taken with the standard Fermi form [61],$ \rho _{c, d}(r)=\frac{\rho_{1, 2 }}{1+\exp[(r-c_{1, 2})/a ]} , $

(5) where
$ c_{1,2}=1.07A^{1/3}_{c,d} $ , and a is the diffuseness factor, which takes a value of$ 0.54 $ fm, simulated from experimental data on electron scattering. For an α-cluster, the density distribution has a standard Gaussian form [62]:$ \begin{array}{*{20}{l}} \rho_{ \alpha }(r)=\rho_{0} \exp(-0.7024 r^2) , \end{array} $

(6) where
$ \rho_{0} $ ,$ \rho_{1} $ , and$ \rho_{2} $ are determined by the mass numbers$ A_{\alpha} $ ,$ A_{c} $ , and$ A_{d} $ , respectively. In other words, we have$\int{\rho_{\alpha,c, d}( {r}){\rm d} {r}}= A_{\alpha,c,d}$ , where$ A_{\alpha} $ is the mass number of an α particle.After defining the form of the total potential, we can obtain the classical turning points and renormalization factor λ by solving the equations
$ V(R_i)=Q_{c}(i=1, 2, 3) $ ($ Q_{c} $ denotes decay energy) together with the Bohr-Sommerfeld quantization condition:$ \begin{aligned}[b] &\int_{R_1}^{R_2} {\rm d} r \sqrt{\frac{2 \mu}{\hbar^2}\left[Q_c-V_N(r)-V_C(r)\right]-\frac{(L+1 / 2)^2}{r^2}}\\ =&(2n+1) \frac{\pi}{2} = (G-L+1) \frac{\pi}{2}. \end{aligned} $

(7) In the above, n denotes the number of nodes of the radial wave function, and G is the global quantum number [32], which is obtained via the Wildermuth quantization condition [63]:
$ G=2n+L=\sum\limits_{i=1}^{A_c} (g_i^{(A_d+A_c)}-g_i^{A_c}). $

(8) It is necessary to specify
$ g_i^{(A_d+A_c)} $ and$ g_i^{A_c} $ in the above expression.$ g_i^{(A_d+A_c)} $ is the oscillator quantum number of the nucleons that compose the emitted cluster, which must ensure that the cluster is outside the shell occupied by the core nucleus.$ g_i^{A_c} $ is the internal quantum number of the nucleons composing the cluster in the shell model;$ g_{i}=4 $ for nucleons in the$ 50 \le Z $ ,$ N\le 82 $ shell,$ g_{i}=5 $ for nucleons in the$ 82 < Z $ ,$ N\le 126 $ shell, and$ g_{i}=6 $ for nucleons outside the$ N=126 $ shell [32]. N and Z are the neutron and proton numbers of the daughter nucleus, respectively. The method of selection for G considers the Pauli blocking effect on the cluster model.The decay width is obtained using the expression
$ \Gamma= \frac{F_{c}\hbar^2}{4\mu} \exp \left(-2 \int_{R_{2}}^{R_{3}} {\rm d} r K(r)\right), $

(9) where
$ K(r)=\sqrt{\left(2 \mu / \hbar^2\right)|Q_c-V(r)|} $ is the wave number. The normalization factor$ F_c $ [64, 65] is expressed as$ F_{c}= \left[\int_{R_1}^{R_2}\dfrac{1}{K(r)}{\cos^2\left(\int_{R_1}^{r} K(r'){\rm d}r'- \dfrac{\pi}{4}\right) {\rm d}r}\right]^{-1}, $

(10) where
$ R_{1,2,3} $ are the classical turning points, and the squared cosine term can be substituted by$ \dfrac{1}{2} $ without significant loss of accuracy [65].During the cluster decay process, it is well known that the preformation probability
$ P_c $ has large impact on CR. The theoretical half-life of CR is sensitive to the selection of the preformation probability$ P_c $ . Therefore, it is crucial to choose a suitable$ P_c $ . Combined with the known experimental facts, the value of the preformation probability is closely related to the size and charge of the nucleus and daughter nucleus. Throughout this study, we adopt two sets of phenomenological exponential preformation probabilities for CR, denoted as$ P_c^{(1)} $ and$ P_c^{(2)} $ [28], to check the sensitivity of the results. Specifically, for even-even nuclei, we have$ \begin{aligned}[b] &P_c^{(1)}=10^{-0.2777A_c+0.2447},\ \\&P_c^{(2)}=10^{-0.0081Z_cZ_d+0.2740}, \end{aligned} $

(11) and for odd-A nuclei, we have
$ \begin{aligned}[b]& P_c^{(1)}=10^{-0.3054A_c-0.6207},\\& P_c^{(2)}=10^{-0.0097Z_cZ_d-0.1396}. \end{aligned} $

(12) As for α decay, we define the experimental values of preformation probability as
$ P_\alpha=\dfrac{\Gamma_{\text{expt}}}{\Gamma_{\text{cal}}} $ . We extract the preformation factor$ P_\alpha $ as constant for different types of nuclei by fitting the experimental half-lives of α decay in the region of SHN, which are 0.691 and 0.275 for even-even and odd-A, respectively.Finally, the half-life T of CR and α decay can be derived from the decay width via
$ \begin{array}{*{20}{l}} T=\dfrac{\hbar \ln 2} {P \Gamma}. \end{array} $

(13) -
A unified decay formula of half-life for CR and α decay, which has a simple form and clear physical meaning, is deduced from the WKB barrier penetration with several approximations. It assumes that only the Coulomb interaction is approximately considered between the core nucleus and the cluster, and the hindrance of transitions between the ground states of parent and daughter nuclei is related to cluster preformation probability [66]. For a detailed derivation of the UDF, see Ref. [38]. To validate this empirical formula, new parameters are adjusted for different types of nuclei, which are modified in good agreement with the current experimental accumulations of data on CR. The expression of the UDF is
$ \begin{array}{*{20}{l}} \log_{10}{T_c}=aZ_{c}Z_{d}\sqrt{\dfrac{\mu}{Q_c}}+b(\mu Z_{c}Z_{d})^{1/2}+c, \end{array} $

(14) where
$ Z_c $ and$ Z_d $ are the proton numbers of the emitted cluster and daughter nucleus, respectively, and the coefficients a, b, and c are free parameters to be determined. In the UDF, the preformation probability$ P_c $ is simplified and associated with the parameter c, and different types of nuclei correspond to different values of c. Through least-squares fitting to the experimental data, we obtain two sets of parameters for CR, whose values are$ \begin{array}{*{20}{l}} \begin{aligned} \begin{cases} a_{e-e}=0.0125, \\ b_{e-e}=-0.0352, \\ c_{e-e}=-20.8618, \nonumber \end{cases} \end{aligned} \qquad \begin{aligned} \begin{cases} a_{o-A}=0.0150, \\ b_{o-A}=-0.0434, \\ c_{o-A}=-23.425, \nonumber \end{cases} \end{aligned} \end{array} $

where the subscripts e-e and o-A refer to even-even and odd-A nuclei, respectively. For α decay, we also fit the experimental data of SHN with
$ Z\geq 110 $ to obtain different sets of parameters as$ \begin{array}{*{20}{l}} \begin{aligned} \begin{cases} a_{e-e}=0.0134, \\ b_{e-e}=-0.0499, \\ c_{e-e}=-11.8919. \nonumber \end{cases} \end{aligned} \qquad \begin{aligned} \begin{cases} a_{o-A}=0.011, \\ b_{o-A}=-0.0487, \\ c_{o-A}=-2.8275. \nonumber \end{cases} \end{aligned} \end{array} $

-
Next, we first apply the DDCM and UDF to study the half-lives of 19 cluster emissions in the trans-lead region. These cluster emissions involve seven cluster emissions from odd-A nuclei (
$ ^{221} $ Ra-$ ^{14} $ C,$ ^{221} $ Fr-$ ^{14} $ C,$ ^{223} $ Ra-$ ^{14} $ C,$ ^{225} $ Ac-$ ^{14} $ C,$ ^{231} $ Pa-$ ^{23} $ F,$ ^{24} $ Ne,$ ^{233} $ U-$ ^{24} $ Ne) and 12 cluster emissions from even-even nuclei ($ ^{222} $ Ra-$ ^{14} $ C,$ ^{224} $ Ra-$ ^{14} $ C,$ ^{226} $ R a-$ ^{14} $ C,$ ^{228} $ Th-$ ^{20} $ O,$ ^{230} $ Th-$ ^{24} $ Ne$ ^{232} $ U-$ ^{24} $ Ne,$ ^{234} $ U-$ ^{24} $ Ne,$ ^{28} $ Mg,$ ^{236,238} $ Pu-$ ^{28} $ Mg,$ ^{238} $ Pu-$ ^{32} $ Si,$ ^{242} $ Cm-$ ^{34} $ Si), which are listed in the first column of Table 1 as parent nuclei, and the corresponding emitted clusters are listed in the second column. The third and fourth columns give the experimental decay energies and the logarithm of the experimental half-lives, respectively. For comparison, the last seven columns display the numerical results obtained using the DDCM with two sets of preformation probabilities, the UDF, GLDM, UDL, Santhosh's formula, and CPPM. The angular momenta carried by the emitted clusters are determined by the angular momentum and parity conservation laws.Parent nuclei Emitted cluster $ Q_c $ /MeV

$ \log_{10}[T_c (s)] $ 

Expt DDCM1 DDCM2 UDF GLDM [67] UDL [68] Santhosh [68] CPPM [41] 222Ra 14C 33.05 11.05 11.10 11.17 11.08 10.38 10.07 12.38 11.07 224Ra 14C 30.54 15.90 15.91 15.98 15.86 16.85 15.38 14.94 16.74 226Ra 14C 28.2 21.29 21.03 21.10 20.87 23.08 20.95 17.62 22.55 221Ra 14C 32.4 13.37 13.85 13.87 13.48 12.00 11.46 12.98 12.58 223Ra 14C 31.83 15.05 14.86 14.87 14.76 13.40 12.57 13.59 13.69 221Fr 14C 31.29 14.51 15.00 14.96 14.87 13.61 12.70 13.30 13.90 225Ac 14C 30.48 19.28 18.54 18.61 19.10 18.15 25.39 23.36 18.03 228Th 20O 44.72 20.73 21.38 21.11 21.46 22.36 21.97 19.49 21.66 230Th 24Ne 57.76 24.61 24.81 24.60 24.45 26.92 25.39 23.36 26.00 231Pa 23F 51.86 26.02 25.60 25.25 26.33 25.28 24.90 21.71 26.02 231Pa 24Ne 60.41 22.89 23.49 23.54 23.01 23.15 22.27 22.64 22.56 234U 28Mg 74.11 25.74 25.54 25.51 25.10 27.82 25.77 26.67 27.55 232U 24Ne 62.31 20.39 20.36 20.31 20.27 21.04 20.59 22.43 20.72 234U 24Ne 58.83 25.93 25.62 25.57 25.65 28.26 26.52 24.71 27.39 233U 24Ne 60.49 24.84 24.62 24.76 24.54 24.80 23.63 23.60 24.15 236Pu 28Mg 79.67 21.65 20.87 21.03 20.66 21.41 20.64 25.83 21.73 238Pu 28Mg 75.91 25.66 25.81 25.97 25.80 28.46 26.26 27.87 28.31 238Pu 32Si 91.19 25.3 25.84 26.00 25.41 28.28 25.48 29.68 − 242Cm 34Si 96.51 23.11 23.08 22.90 23.37 − 22.35 28.86 23.20 Table 1. Comparison of the logarithm of the half-lives (in second)
$ \log_{10} T_c $ between experimental data and the calculated values for CR in different theoretical methods. The first and second columns list the parent and emitted nuclei for 19 groups of experimental clusters emissions, respectively. The experimental data of decay energies and the logarithm values of half-lives are cited from literature and shown in the third and fourth column, respectively. The last seven columns contain the logarithm values of half-lives obtained using the DDCM with two sets of preformation probabilities$ P_c $ (denoted by DDCM$ ^1 $ and DDCM$ ^2 $ ), the UDF, GLDM [67], UDL [68], Santhosh's formula [68], and CPPM [41].To show the good reliability of our theoretical approaches, we then compute and analyze the root mean square (rms) deviations and hindrance factor values. The standard rms, denoted by ε, is computed to quantify the deviation between theoretical cluster-decay half-lives and the experimental values as follows:
$ \varepsilon =\left [ \dfrac{1}{n}\sum\limits_{i=1}^{n}(\log_{10}T^{\text{expt}}(i)-\log_{10}T^{\text{theo}}(i))^2\right ]^{1/2}. $

(15) Table 2 shows the detailed values of the rms deviations, denoted as ε, of the calculated half-lives using the DDCM and UDF. The values of the rms deviation obtained from our DDCM and UDF methods are clearly within the range 0.254−0.528 for a total of 19 cluster emissions, including seven odd-A and 12 even-even nuclei. For comparison, the values of ε obtained using the GLDM, UDL, Santhosh's formula, and CPPM are also displayed in the last four columns. These results demonstrate the reliability of our results compared to the other theoretical deviations listed in Table 2. Moreover, we find the minimal deviation ε = 0.342 for even-even nuclei and the maximal deviation ε = 0.528 for odd-A nuclei in the framework of the DDCM. The ε values from the DDCM for even-even nuclei are lower than those from odd-A nuclei, which may be due to the blocking effect of unpaired nucleons in odd-A nuclei.
Nuclei type $ \varepsilon^{1} $ 

$ \varepsilon^{2} $ 

$ \varepsilon^{\text{UDF}} $ 

$ \varepsilon^{\text{GLDM}} $ 

$ \varepsilon^{\text{UDL}} $ 

$ \varepsilon^{\text{Santhosh}} $ 

$ \varepsilon^{\text{CPPM}} $ 

even-even 0.365 0.342 0.439 2.156 0.704 2.892 1.163 odd-A 0.487 0.528 0.254 1.061 1.559 1.915 1.004 Table 2. Root-mean-square deviations ε for the theoretical half-lives given by the DDCM, UDF, GLDM [67], UDL [68], Santhosh's formula [68], and CPPM [41]. The cluster emitters are divided into two types: even-even and odd-A nuclei. The superscripts 1 and 2 still represent the two sets of preformation probabilities used in the DDCM.
Moreover, the theoretical devitions may also result from various factors. For example, the current calculations are performed on a preliminary spherical assumption, whereas the rare existing experimental data suggest the emitted cluster to be well deformed [69]. According to the research in Refs. [47−52], the dynamic deformations in both the emitted cluster and daughter nucleus would have a non-negligible effect in determining the half-lives. It is thus worth including deformation effects to make further improvements in the accuracy of the DDCM in future studies. In addition, there are also large uncertainties in the experimental half-lives and branching ratios of CR, which may result in large deviations between the theoretical results and experimental data. Consequently, the results may be further improved with more accurate experimental data and the inclusion of more structural information, such as nuclear deformation, in future studies.
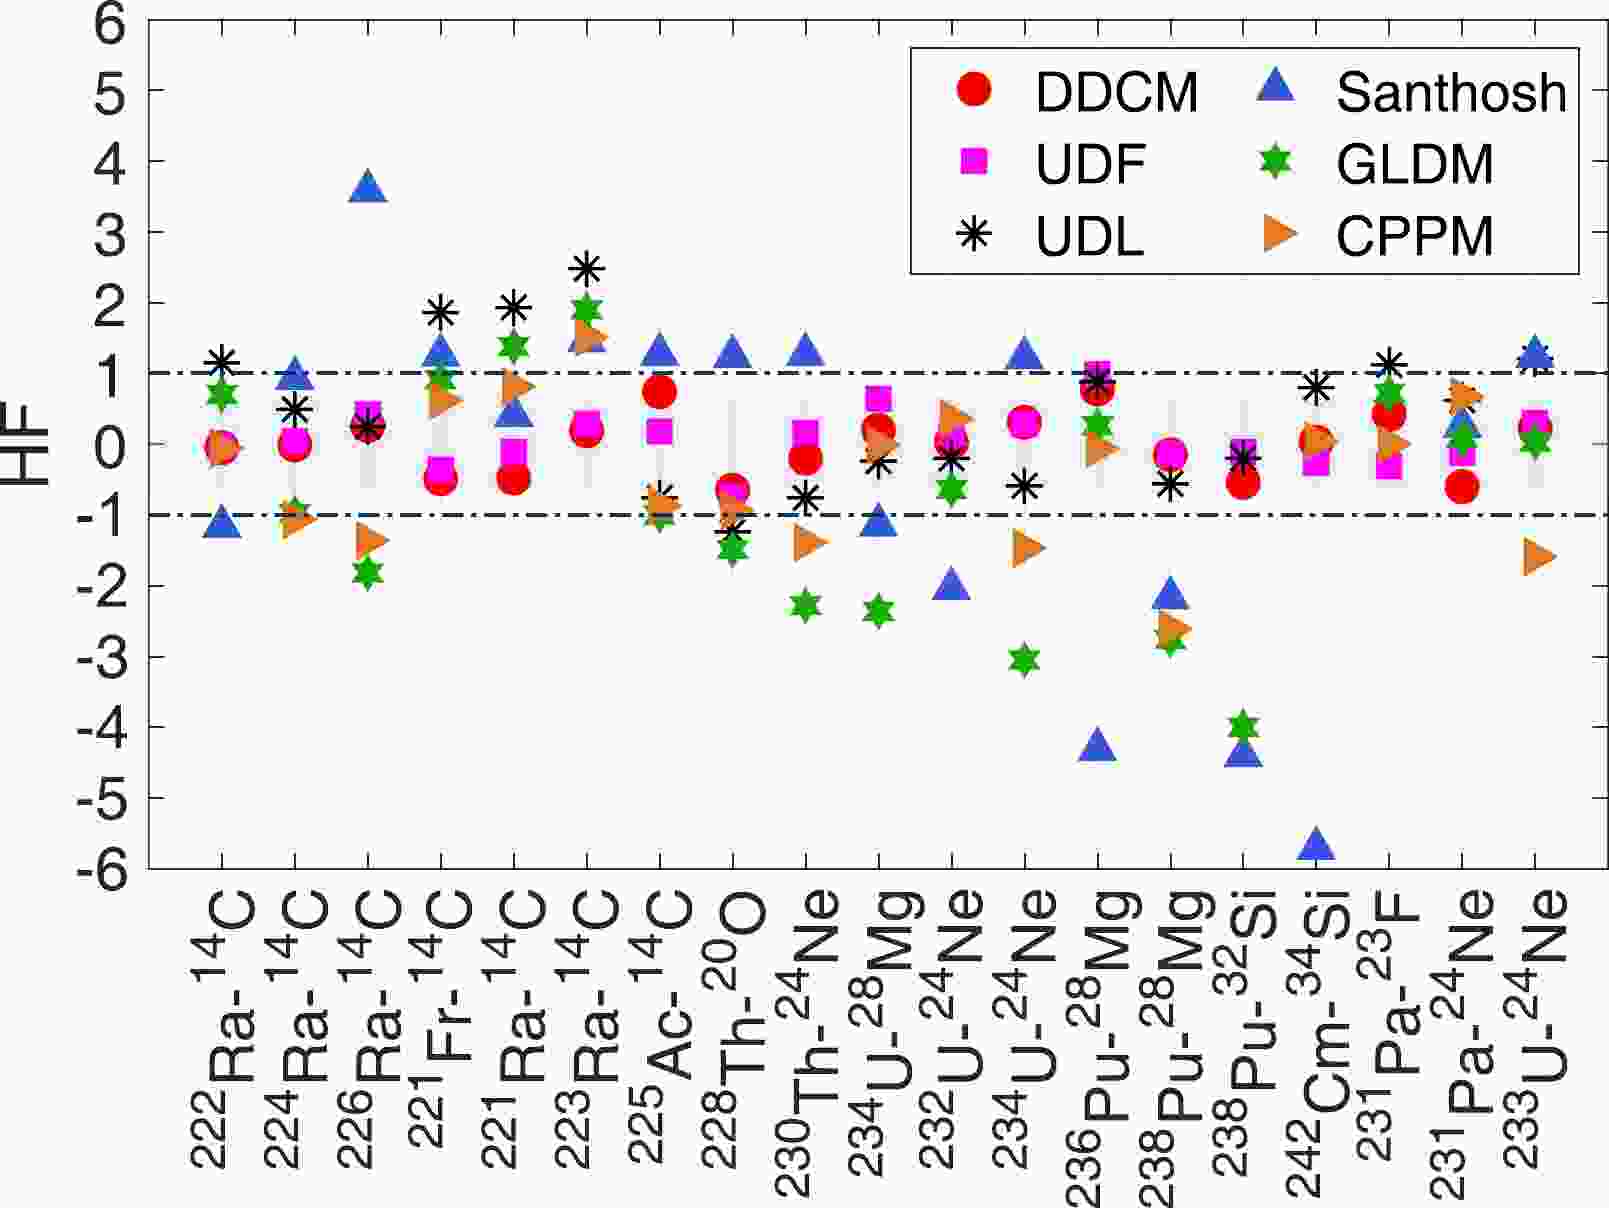
To further verify the reliability of our theoretical methods, Fig. 1 depicts the hindrance factor, denoted by HF
$ =\log_{10}T_c^{\text{expt}}-\log_{10}T_c^{\text{theo}} $ , for various methods.$ \log_{10}T^{\text{expt}} $ represents the logarithm of the experimental half-life of CR, and$ \log_{10}T_c^{\text{theo}} $ refers to the logarithm of the theoretical half-life of CR. Each corresponding cluster emission is shown in the abscissa. Here, in the DDCM, we use the second set of$ P_c $ (denoted as DDCM$ ^{2} $ ). The red circles denote the HF values given by the DDCM, the purple squares are those given by the UDF, and the black asterisks, upward blue triangles, green hexagons, and brown right-facing triangles denote the HF given by the UDL, Santhosh's formula, GLDM, and CPPM, respectively. The rectangular shadow ranges from −0.7 to 0.7, which means that the calculated half-lives agree with the experimental data within a factor of five. Most of the red circles and purple squares are inside the shadow; some are located around zero, and only three emissions ($ ^{236} $ Pu-$ ^{28} $ Mg,$ ^{225} $ Ac-$ ^{14} $ C,$ ^{228} $ Th-$ ^{20} $ O) are outside the shadow but still within$ \pm 1 $ . These results again provide sufficient evidence for the reliability of our theoretical results.
Figure 1. (color online) Comparisons of HF
$ =\log_{10}T^{\text{expt}}- $ $ \log_{10}T^{\text{theo}} $ between the theoretical half-lives of CR and the experimental data for 19 groups of cluster emissions. The theoretical half-lives are obtained with our DDCM using$ P_c^{(2)} $ (DDCM2) and UDF, as well as other theoretical methods: GLDM [67], UDL [68], Santhosh's formula [68], and CPPM [41].Figure 2 verifies the rationality of the results from the UDF. In this figure, the vertical coordinate is
$ \log_{10}T_c-b(\mu Z_{c}Z_{d})^{1/2}-c $ , and the horizontal coordinate is$ Z_{c}Z_{d}\sqrt{\dfrac{\mu}{Q_c}} $ . Here, the circles and diamonds signify the half-lives calculated using the UDF, the crosses are from the experimental half-lives, and the straight lines are obtained via a linear fit to the calculated values corresponding to the even-even and odd-A nuclei, respectively. It can be clearly seen that the symbols for the experimental data and theoretical results approximately overlap and are located near the fitted straight line, which implies a very high correlation. The diagram confirms the accuracy of the UDF in reproducing the half-life of cluster emissions.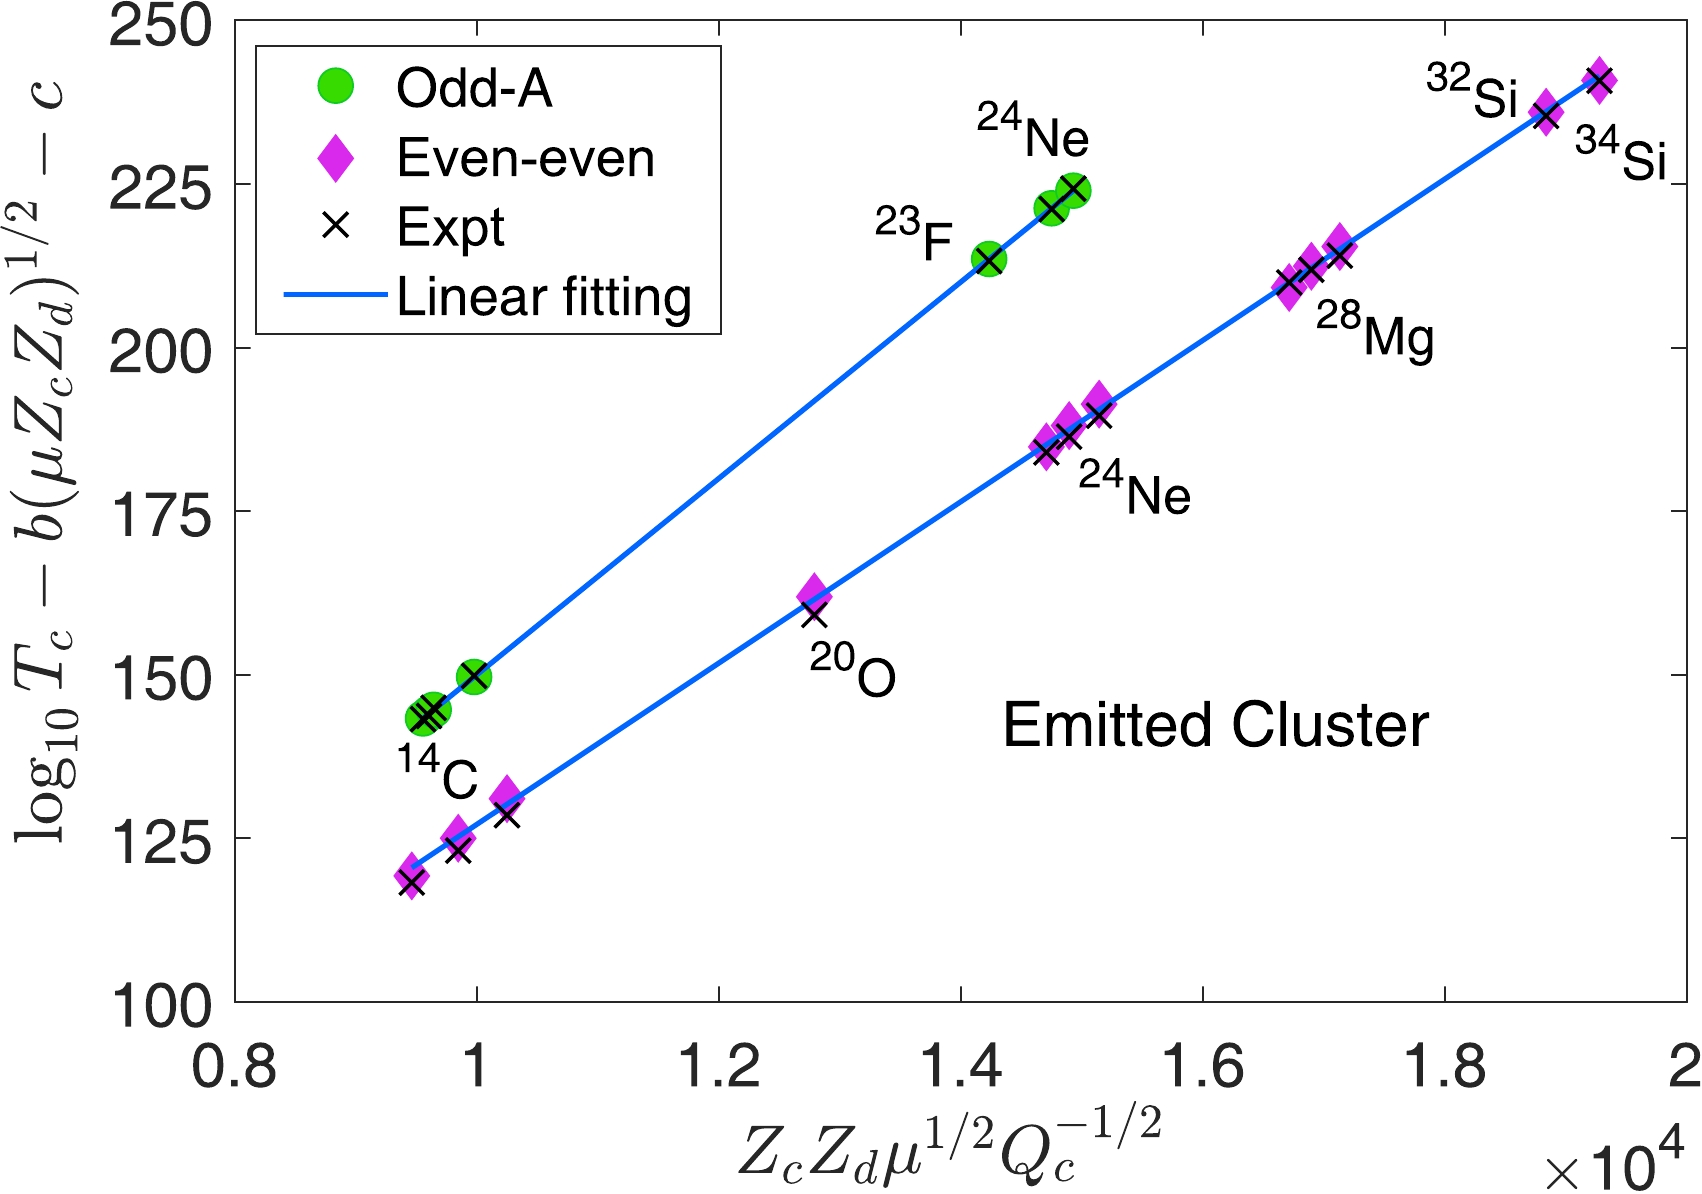
Figure 2. (color online) Comparison of the experimental half-lives and calculated values using the UDF for CR. The green circles, purple diamonds, and black crosses denote the calculated half-lives for odd-A nuclei, even-even nuclei, and the experimental half-lives of the corresponding cluster emissions, respectively, and the straight line is obtained from the theoretical values of the UDF.
After confirming that our theoretical results agree well with the experimental values for heavy nuclei in the region of trans-lead, we extend our calculations to predict the half-lives of α decay and CR for superheavy isotopes with
$ Z = $ 119 and 120 using the DDCM and UDF. The decay energy$ Q_\alpha $ of α decay and$ Q_c $ of CR are deduced from Dong's binding energy formula [70], which has the following expression:$ \begin{aligned}[b] B(Z,A)=&a_{\upsilon } A-a_s A^{2/3}-a_c Z^2A^{-1/3}-a_a\left(\dfrac{A}{2}-Z\right)^2 A^{-1} \\ &+a_p A^{-1/2} +a_6 |A-252|/A -a_7 |N-152|/N \\& +a_8|N-Z-50|/A, \end{aligned} $

(16) which can give good descriptions of the binding energy of nuclei with
$ Z\ge $ 90 and$ N \ge $ 140. Here,$ B(Z,A) $ represents the binding energy of nuclei with proton number Z and mass number A, and N is the neutron number. The following parameters are used:$ \begin{array}{*{20}{l}} \begin{aligned} & \begin{cases} a_{\upsilon}=15.8032 \ \text{MeV}, \\ a_{s}=17.8147 \ \text{MeV}, \\ a_{c}=0.71478 \ \text{MeV},\\ a_{a}=97.6619 \ \text{MeV},\\ a_{6}=5.33 \ \text{MeV},\\ a_{7}=21.0 \ \text{MeV},\\ a_{8}=-15.25 \ \text{MeV}. \nonumber \end{cases} \\ a_{p}=& \begin{cases} 12.66 \ \text{MeV},\ \text{for even-even nuclei}\\ 3.0 \ \text{MeV}, \ \text{for even-odd nuclei}\\ 0 \ \text{MeV}, \ \text{for odd-even nuclei}\\ -8.0 \ \text{MeV}, \ \text{for odd-odd nuclei}. \nonumber \end{cases} \end{aligned} \end{array} $

Tables 3 and 4 display the predicted half-lives of cluster emission and their decay products for superheavy isotopes with
$ Z = 119,120 $ in detail, respectively. The first column presents the parent nuclei. The decay energy$ Q_\alpha $ and half-lives$ T_\alpha $ of α decay are also listed in Tables 3 and 4, where the decay energy$ Q_\alpha $ of α decay and$ Q_c $ of CR are procured using Dong's binding energy formula. The half-lives$ T_\alpha $ of α decay calculated using the UDF and DDCM with the constant$ P_\alpha $ , as mentioned before, are shown in the tables. The last four columns present the predicted cluster products of decay, the decay energy of the cluster, and the half-lives of CR calculated using the DDCM and UDF, respectively. It is worth mentioning that the preformation factor$ P_c $ decreases significantly with the increase in the size of the emitted cluster and the size of the residual daughter nuclei, and we choose to use the DDCM with$ P_c^{(2)} $ to calculate the half-lives of CR. Here, considering the lack of experimental data for the CR of odd-odd nuclei, to guarantee the reliability and precision of our predictive outcomes, we select ten odd-A isotopes with$ ^{293-311}119 $ , as shown in Table 3. For these predictions, we prefer to predict cluster emissions up to$ ^{34} $ Si, which is the hereto heaviest experimentally observed cluster. Finally, the half-lives of the six most probable emitted clusters,$ ^{8} $ Be,$ ^{12} $ C,$ ^{16} $ O,$ ^{24} $ Ne,$ ^{28} $ Mg, and$ ^{32} $ Si, are presented in the fifth column of Table 3. Interestingly, in Refs. [7, 19], the authors theoretically predicted that SHN may exhibit heavy cluster emission modes (such as$ ^{85} $ Br,$ ^{86} $ Kr,$ ^{89} $ Rb,$ ^{90-94} $ Sr, and$ ^{96} $ Zr, etc.), whose half-lives may be comparable to or even shorter than the α-decay half-lives. These predictions may deepen our understanding of the decay properties of SHN. As shown in Table 3, most of the calculated half-lives cannot not exceed$ 10^{40} $ s both in the DDCM and UDF, which is favorable for measurements. Furthermore, we introduce the branching ratio of CR relative to the α decay$ \varsigma=\log_{10}T_{\alpha}-\log_{10}T_{c} $ [19] to manifest the competition between α decay and CR.Parent nuclei $ Q_{\alpha} $ /MeV

$ T^{\text{DDCM}}_{\alpha} $ /s

$T^{\text{UDF} }_{\alpha}/{\rm s}$ 

Emitted cluster $ Q_{c} $ /MeV

$T^{\text{DDCM}^{2} }_{c}/{\rm s}$ 

$T^{\text{UDF} }_{c}/{\rm s}$ 

293119 12.94 1.32 $ \times 10^{-5} $ 

2.47 $ \times 10^{-5} $ 

8Be 25.20 1.21 $ \times 10^{14} $ 

2.23 $ \times 10^{14} $ 

12C 44.33 1.95 $ \times 10^{18} $ 

5.27 $ \times 10^{17} $ 

16O 62.65 6.68 $ \times 10^{23} $ 

6.49 $ \times 10^{22} $ 

24Ne 81.90 8.16 $ \times 10^{29} $ 

1.34 $ \times 10^{30} $ 

28Mg 103.95 5.77 $ \times 10^{29} $ 

7.11 $ \times 10^{27} $ 

32Si 125.39 9.74 $ \times 10^{27} $ 

2.00 $ \times 10^{26} $ 

295119 12.66 4.69 $ \times 10^{-5} $ 

7.48 $ \times 10^{-5} $ 

8Be 24.63 1.64 $ \times 10^{15} $ 

5.03 $ \times 10^{15} $ 

12C 43.46 3.69 $ \times 10^{19} $ 

2.01 $ \times 10^{19} $ 

16O 61.49 2.14 $ \times 10^{25} $ 

5.10 $ \times 10^{24} $ 

24Ne 81.38 3.09 $ \times 10^{30} $ 

9.29 $ \times 10^{30} $ 

28Mg 103.13 3.91 $ \times 10^{30} $ 

1.08 $ \times 10^{29} $ 

32Si 124.25 1.09 $ \times 10^{29} $ 

6.23 $ \times 10^{27} $ 

297119 12.37 1.77 $ \times 10^{-4} $ 

2.38 $ \times 10^{-4} $ 

8Be 24.05 2.54 $ \times 10^{16} $ 

1.03 $ \times 10^{17} $ 

12C 42.59 7.78 $ \times 10^{20} $ 

8.56 $ \times 10^{20} $ 

16O 60.31 7.97 $ \times 10^{26} $ 

4.74 $ \times 10^{26} $ 

24Ne 80.83 1.32 $ \times 10^{31} $ 

7.46 $ \times 10^{31} $ 

28Mg 102.26 3.02 $ \times 10^{31} $ 

1.91 $ \times 10^{30} $ 

32Si 123.06 1.40 $ \times 10^{30} $ 

2.30 $ \times 10^{29} $ 

Continued on next page Table 3. Predictions of α decay and CR for an isotopic chain with
$ Z = 119 $ . The parent nuclei$ ^{293-311} $ 119 are listed in the first column. The decay energies of α decay$ Q_\alpha $ and CR$ Q_c $ are procured using Dong's binding energy formula [70]. The half-lives of α decay$ T_\alpha $ obtained with the DDCM and UDF are displayed in the third and fourth columns, respectively. The last four columns present the predicted cluster products of decay, the decay energy of CR$ Q_c $ , and the half-lives calculated using the DDCM with the second set of$ P_c $ (denoted as DDCM$ ^{2} $ ) in the DDCM and UDF, respectively.Table 3-continued from previous page Parent nuclei $ Q_{\alpha} $ /MeV

$ T^{\text{DDCM}}_{\alpha} $ /s

$T^{\text{UDF} }_{\alpha}/{\rm s}$ 

Emitted cluster $ Q_{c} $ /MeV

$T^{\text{DDCM}^{2} }_{c}/{\rm s}$ 

$T^{\text{UDF} }_{c}/{\rm s}$ 

299119 12.08 7.11 $ \times 10^{-4} $ 

7.79 $ \times 10^{-4} $ 

$ ^{8} $ Be

23.47 4.50 $ \times 10^{17} $ 

3.92 $ \times 10^{18} $ 

12C 41.71 1.90 $ \times 10^{22} $ 

4.29 $ \times 10^{22} $ 

16O 59.12 3.49 $ \times 10^{28} $ 

5.25 $ \times 10^{28} $ 

24Ne 80.24 6.37 $ \times 10^{31} $ 

6.91 $ \times 10^{32} $ 

28Mg 101.36 2.65 $ \times 10^{32} $ 

3.96 $ \times 10^{31} $ 

32Si 121.84 2.07 $ \times 10^{31} $ 

1.01 $ \times 10^{31} $ 

301119 11.79 3.06 $ \times 10^{-3} $ 

2.82 $ \times 10^{-3} $ 

8Be 22.89 9.24 $ \times 10^{18} $ 

1.38 $ \times 10^{20} $ 

12C 40.82 5.45 $ \times 10^{23} $ 

2.56 $ \times 10^{24} $ 

16O 57.93 1.81 $ \times 10^{30} $ 

6.98 $ \times 10^{30} $ 

24Ne 79.62 3.47 $ \times 10^{32} $ 

7.37 $ \times 10^{33} $ 

28Mg 100.43 2.67 $ \times 10^{33} $ 

9.57 $ \times 10^{32} $ 

32Si 120.59 3.55 $ \times 10^{32} $ 

5.26 $ \times 10^{32} $ 

303119 11.50 1.41 $ \times 10^{-2} $ 

1.06 $ \times 10^{-2} $ 

8Be 22.30 2.22 $ \times 10^{20} $ 

5.75 $ \times 10^{21} $ 

12C 39.93 1.78 $ \times 10^{25} $ 

1.75 $ \times 10^{26} $ 

16O 56.72 1.12 $ \times 10^{32} $ 

1.12 $ \times 10^{33} $ 

24Ne 78.98 2.13 $ \times 10^{33} $ 

9.06 $ \times 10^{34} $ 

28Mg 99.46 3.06 $ \times 10^{34} $ 

2.70 $ \times 10^{34} $ 

32Si 119.30 7.06 $ \times 10^{33} $ 

3.26 $ \times 10^{34} $ 

305119 11.21 7.05 $ \times 10^{-2} $ 

4.21 $ \times 10^{-2} $ 

8Be 21.70 6.28 $ \times 10^{21} $ 

2.86 $ \times 10^{23} $ 

12C 39.03 6.91 $ \times 10^{26} $ 

1.45 $ \times 10^{28} $ 

16O 55.51 8.34 $ \times 10^{33} $ 

2.20 $ \times 10^{35} $ 

24Ne 78.30 1.48 $ \times 10^{34} $ 

1.28 $ \times 10^{36} $ 

28Mg 98.47 4.01 $ \times 10^{35} $ 

8.89 $ \times 10^{35} $ 

32Si 117.97 1.63 $ \times 10^{35} $ 

2.40 $ \times 10^{36} $ 

307119 10.91 3.81 $ \times 10^{-1} $ 

1.79 $ \times 10^{-1} $ 

8Be 21.10 2.12 $ \times 10^{23} $ 

1.72 $ \times 10^{25} $ 

12C 38.12 3.26 $ \times 10^{28} $ 

1.48 $ \times 10^{30} $ 

16O 54.29 7.54 $ \times 10^{35} $ 

5.34 $ \times 10^{37} $ 

24Ne 77.60 1.16 $ \times 10^{35} $ 

2.09 $ \times 10^{37} $ 

28Mg 97.44 6.03 $ \times 10^{36} $ 

3.34 $ \times 10^{37} $ 

32Si 116.62 4.38 $ \times 10^{36} $ 

2.11 $ \times 10^{38} $ 

309119 10.61 2.25 $ \times 10^{0} $ 

8.16 $ \times 10^{-1} $ 

8Be 20.50 2.18 $ \times 10^{24} $ 

1.27 $ \times 10^{27} $ 

12>C 37.21 1.80 $ \times 10^{30} $ 

1.79 $ \times 10^{32} $ 

16O 53.06 8.38 $ \times 10^{37} $ 

1.61 $ \times 10^{40} $ 

24Ne 76.88 1.03 $ \times 10^{36} $ 

3.91 $ \times 10^{38} $ 

28Mg 96.39 1.04 $ \times 10^{38} $ 

1.55 $ \times 10^{39} $ 

32Si 115.23 1.38 $ \times 10^{38} $ 

2.21 $ \times 10^{40} $ 

311119 10.31 1.46 $ \times 10^{1} $ 

4.01 $ \times 10^{0} $ 

8Be 19.90 1.08 $ \times 10^{26} $ 

1.16 $ \times 10^{29} $ 

12C 36.29 1.58 $ \times 10^{31} $ 

2.73 $ \times 10^{34} $ 

16O 51.83 1.15 $ \times 10^{40} $ 

6.15 $ \times 10^{42} $ 

24Ne 76.13 1.03 $ \times 10^{37} $ 

8.45 $ \times 10^{39} $ 

28Mg 95.31 2.06 $ \times 10^{39} $ 

8.19 $ \times 10^{40} $ 

32Si 113.82 5.06 $ \times 10^{39} $ 

2.78 $ \times 10^{42} $ 

Parent nuclei $Q_{\alpha}$ /MeV

$T^{\text{DDCM}}_{\alpha}$ /s

$T^{\text{UDF} }_{\alpha}/{\rm s}$ 

Emitted cluster $Q_{c}$ /MeV

$T^{\text{DDCM}^{2} }_{c}/{\rm s}$ 

$T^{\text{UDF} }_{c}/{\rm s}$ 

293120 13.51 2.07 $ \times 10^{-6} $ 

4.36 $ \times 10^{-6} $ 

8Be 26.35 1.34 $ \times 10^{11} $ 

2.67 $ \times 10^{12} $ 

12C 46.06 3.57 $ \times 10^{16} $ 

3.78 $ \times 10^{15} $ 

16O 64.98 3.36 $ \times 10^{21} $ 

1.89 $ \times 10^{20} $ 

24Ne 83.45 1.70 $ \times 10^{29} $ 

1.34 $ \times 10^{29} $ 

28Mg 106.11 6.42 $ \times 10^{28} $ 

2.93 $ \times 10^{26} $ 

32Si 128.15 3.51 $ \times 10^{26} $ 

3.60 $ \times 10^{24} $ 

294120 13.37 1.44 $ \times 10^{-6} $ 

7.14 $ \times 10^{-6} $ 

8Be 26.08 2.92 $ \times 10^{10} $ 

1.94 $ \times 10^{11} $ 

12C 45.65 4.05 $ \times 10^{15} $ 

7.01 $ \times 10^{14} $ 

16O 64.43 2.22 $ \times 10^{20} $ 

5.03 $ \times 10^{19} $ 

24Ne 83.35 1.33 $ \times 10^{27} $ 

4.50 $ \times 10^{27} $ 

28Mg 105.87 3.36 $ \times 10^{26} $ 

2.19 $ \times 10^{26} $ 

32Si 127.77 1.19 $ \times 10^{24} $ 

4.01 $ \times 10^{25} $ 

295120 13.23 6.62 $ \times 10^{-6} $ 

1.22 $ \times 10^{-5} $ 

8Be 25.79 1.44 $ \times 10^{12} $ 

4.74 $ \times 10^{13} $ 

12C 45.21 5.33 $ \times 10^{17} $ 

1.11 $ \times 10^{17} $ 

16O 63.84 8.29 $ \times 10^{22} $ 

1.12 $ \times 10^{22} $ 

24Ne 83.09 3.85 $ \times 10^{29} $ 

5.04 $ \times 10^{29} $ 

28Mg 105.45 2.66 $ \times 10^{29} $ 

2.46 $ \times 10^{27} $ 

32Si 127.19 2.40 $ \times 10^{27} $ 

6.19 $ \times 10^{25} $ 

296120 13.09 4.73 $ \times 10^{-6} $ 

2.04 $ \times 10^{-5} $ 

8Be 25.51 3.30 $ \times 10^{11} $ 

2.24 $ \times 10^{12} $ 

12C 44.80 6.43 $ \times 10^{16} $ 

1.24 $ \times 10^{16} $ 

16O 63.28 5.87 $ \times 10^{21} $ 

1.61 $ \times 10^{21} $ 

24Ne 82.86 4.47 $ \times 10^{27} $ 

2.02 $ \times 10^{28} $ 

28Mg 105.07 1.99 $ \times 10^{27} $ 

1.86 $ \times 10^{27} $ 

32Si 126.66 1.14 $ \times 10^{25} $ 

6.11 $ \times 10^{26} $ 

297120 12.95 2.24 $ \times 10^{-5} $ 

3.55 $ \times 10^{-5} $ 

8Be 25.22 1.73 $ \times 10^{13} $ 

9.55 $ \times 10^{14} $ 

12C 44.36 9.00 $ \times 10^{18} $ 

3.71 $ \times 10^{18} $ 

16O 62.68 2.35 $ \times 10^{24} $ 

7.74 $ \times 10^{23} $ 

24Ne 82.58 1.37 $ \times 10^{30} $ 

3.27 $ \times 10^{30} $ 

28Mg 104.63 1.68 $ \times 10^{30} $ 

3.43 $ \times 10^{28} $ 

32Si 126.06 2.46 $ \times 10^{28} $ 

1.75 $ \times 10^{27} $ 

298120 12.81 1.65 $ \times 10^{-5} $ 

6.07 $ \times 10^{-5} $ 

8Be 24.94 4.21 $ \times 10^{12} $ 

2.89 $ \times 10^{13} $ 

12C 43.94 1.15 $ \times 10^{18} $ 

2.44 $ \times 10^{17} $ 

16O 62.12 1.79 $ \times 10^{23} $ 

5.88 $ \times 10^{22} $ 

24Ne 82.34 1.69 $ \times 10^{28} $ 

1.02 $ \times 10^{29} $ 

28Mg 104.24 1.34 $ \times 10^{28} $ 

1.79 $ \times 10^{28} $ 

32Si 125.52 1.25 $ \times 10^{26} $ 

1.07 $ \times 10^{28} $ 

299120 12.67 8.02 $ \times 10^{-5} $ 

1.08 $ \times 10^{-4} $ 

8Be 24.65 2.34 $ \times 10^{14} $ 

2.20 $ \times 10^{16} $ 

12C 43.49 1.73 $ \times 10^{20} $ 

1.42 $ \times 10^{20} $ 

16O 61.52 7.74 $ \times 10^{25} $ 

6.28 $ \times 10^{25} $ 

24Ne 82.04 5.52 $ \times 10^{30} $ 

2.44 $ \times 10^{31} $ 

28Mg 103.78 1.20 $ \times 10^{31} $ 

5.58 $ \times 10^{29} $ 

32Si 124.90 2.90 $ \times 10^{29} $ 

5.86 $ \times 10^{28} $ 

Continued on next page Table 4. Same as Table 3 but for isotopes with Z=120.
Table 4-continued from previous page Parent nuclei $Q_{\alpha}$ /MeV

$T^{\text{DDCM}}_{\alpha}$ /s

$T^{\text{UDF} }_{\alpha}/{\rm s}$ 

Emitted cluster $Q_{c}$ /MeV

$T^{\text{DDCM}^{2} }_{c}/{\rm s}$ 

$T^{\text{UDF} }_{c}/{\rm s}$ 

300120 12.53 6.06 $ \times 10^{-5} $ 

1.90 $ \times 10^{-4} $ 

8Be 24.37 6.10 $ \times 10^{13} $ 

4.18 $ \times 10^{14} $ 

12C 43.07 2.36 $ \times 10^{19} $ 

5.42 $ \times 10^{18} $ 

16O 60.95 6.34 $ \times 10^{24} $ 

2.46 $ \times 10^{24} $ 

24Ne 81.78 7.22 $ \times 10^{28} $ 

5.81 $ \times 10^{29} $ 

28Mg 103.37 1.02 $ \times 10^{29} $ 

1.95 $ \times 10^{29} $ 

32Si 124.34 1.58 $ \times 10^{27} $ 

2.14 $ \times 10^{29} $ 

301120 12.38 3.05 $ \times 10^{-4} $ 

3.47 $ \times 10^{-4} $ 

8Be 24.08 3.63 $ \times 10^{15} $ 

5.81 $ \times 10^{17} $ 

12C 42.62 3.77 $ \times 10^{21} $ 

6.32 $ \times 10^{21} $ 

16O 60.34 2.96 $ \times 10^{27} $ 

6.02 $ \times 10^{27} $ 

24Ne 81.47 2.50 $ \times 10^{31} $ 

2.10 $ \times 10^{32} $ 

28Mg 102.90 9.81 $ \times 10^{31} $ 

1.05 $ \times 10^{31} $ 

32Si 123.70 3.92 $ \times 10^{30} $ 

2.31 $ \times 10^{30} $ 

302120 12.24 2.38 $ \times 10^{-4} $ 

6.24 $ \times 10^{-4} $ 

8Be 23.79 1.01 $ \times 10^{15} $ 

6.79 $ \times 10^{15} $ 

12C 42.19 5.52 $ \times 10^{20} $ 

1.36 $ \times 10^{20} $ 

16O 59.77 2.63 $ \times 10^{26} $ 

1.18 $ \times 10^{26} $ 

24Ne 81.19 3.46 $ \times 10^{29} $ 

3.70 $ \times 10^{30} $ 

28Mg 102.47 8.87 $ \times 10^{29} $ 

2.41 $ \times 10^{30} $ 

32Si 123.12 2.29 $ \times 10^{28} $ 

4.92 $ \times 10^{30} $ 

Note that ς ranges from
$ -40 $ to$ -20 $ , which is significantly lower than 0 in our predictions. This means that α decay is extremely likely to be the dominant decay mode of$ Z=119 $ isotopes. Table 4 is the same as Table 3 but for ten isotopes with$ ^{293-302}120 $ , including five odd-A nuclei ($ ^{293,295,297,299,301}120 $ ) and five even-even nuclei ($ ^{294,296,298,300,302}120 $ ). Their CR products,$ ^{8} $ Be,$ ^{12} $ C,$ ^{16} $ O,$ ^{24} $ Ne,$ ^{28} $ Mg, and$ ^{32} $ Si, are also presented in the fifth column. Similarly, the values of ς are less than 0, which indicates that α decay may still be the dominant decay mode in$ Z=120 $ isotopes. It is noted that in the$ ^{8} $ Be emission with the minimum$ T_{c} $ , the$ T_{c} $ of emission from$ ^{293}119 $ is$ 1.21\times 10^{14} $ s via the DDCM$ ^{2} $ and that from$ ^{294}120 $ is$ 2.92\times 10^{10} $ s. Therefore, we deduce that$ ^{8} $ Be may be the most probable emitted cluster from$ Z=119,120 $ elements. Note that we assume all cluster decays are favorable transitions, thereby the angular momentum carried by all clusters is 0. Additionally, although the unclear physical mechanism behind the preformation factor and the limited range of experimental data inevitably introduce uncertainty to the theoretical predictions of SHN cluster emissions, the half-life results from the UDF resemble those from the DDCM in general, which demonstrates the credibility of our predictions.To visually analyze the characteristics of our predicted results, we show figures of the data from Tables 3 and 4 in Fig. 3. The figure shows the relationship between the half-lives of CR for
$ Z = 119,120 $ isotopes and the mass number of the parent nuclei. As shown in Fig. 3 (a), the$ Z=119 $ isotopic chain emits α particles and six types of clusters with$ ^{8} $ Be,$ ^{12} $ C,$ ^{16} $ O,$ ^{24} $ Ne,$ ^{28} $ Mg, and$ ^{32} $ Si. The observed trend in the behavior of the six clusters is an approximate linear relationship between the half-life and the mass number of the parent nucleus. As the mass number of the parent nucleus increases, the corresponding half-life also increases. The curves of$ ^{8} $ Be and$ ^{12} $ C emissions are always located above the α emission. The growth rate of the half-life of$ ^{16} $ O with mass number${A}$ is larger than that of other clusters. Moreover, there is a complex competitive relationship among$ ^{16} $ O,$ ^{24} $ Ne,$ ^{28} $ Mg, and$ ^{32} $ Si emissions with the increase in mass number${A} $ of the parent nuclei. The curve of α-decay is always far below the cluster curves, which reveals that α decay is highly probable as the main decay mode against CR. Figure 3 (b) illustrates the decay half-lives of six cluster emissions and the α decay of the$ Z=120 $ isotopic chain as the mass number of the parent nucleus varies. Considering that the parent nuclei alternate between odd-A and even-even nuclei, the seven curves show a clear odd-even effect. Similar to the$ Z=119 $ isotopes, the curve of α decay is at the bottom, followed by the curves of$ ^{8} $ Be,$ ^{12} $ C,$ ^{16} $ O, and$ ^{32} $ Si, which are located below those of$ ^{28} $ Mg and$ ^{24} $ Ne. These phenomena indicate that$ ^{32} $ Si is more likely to be emitted than$ ^{24} $ Ne and$ ^{28} $ Mg in the$ Z= $ 120 element.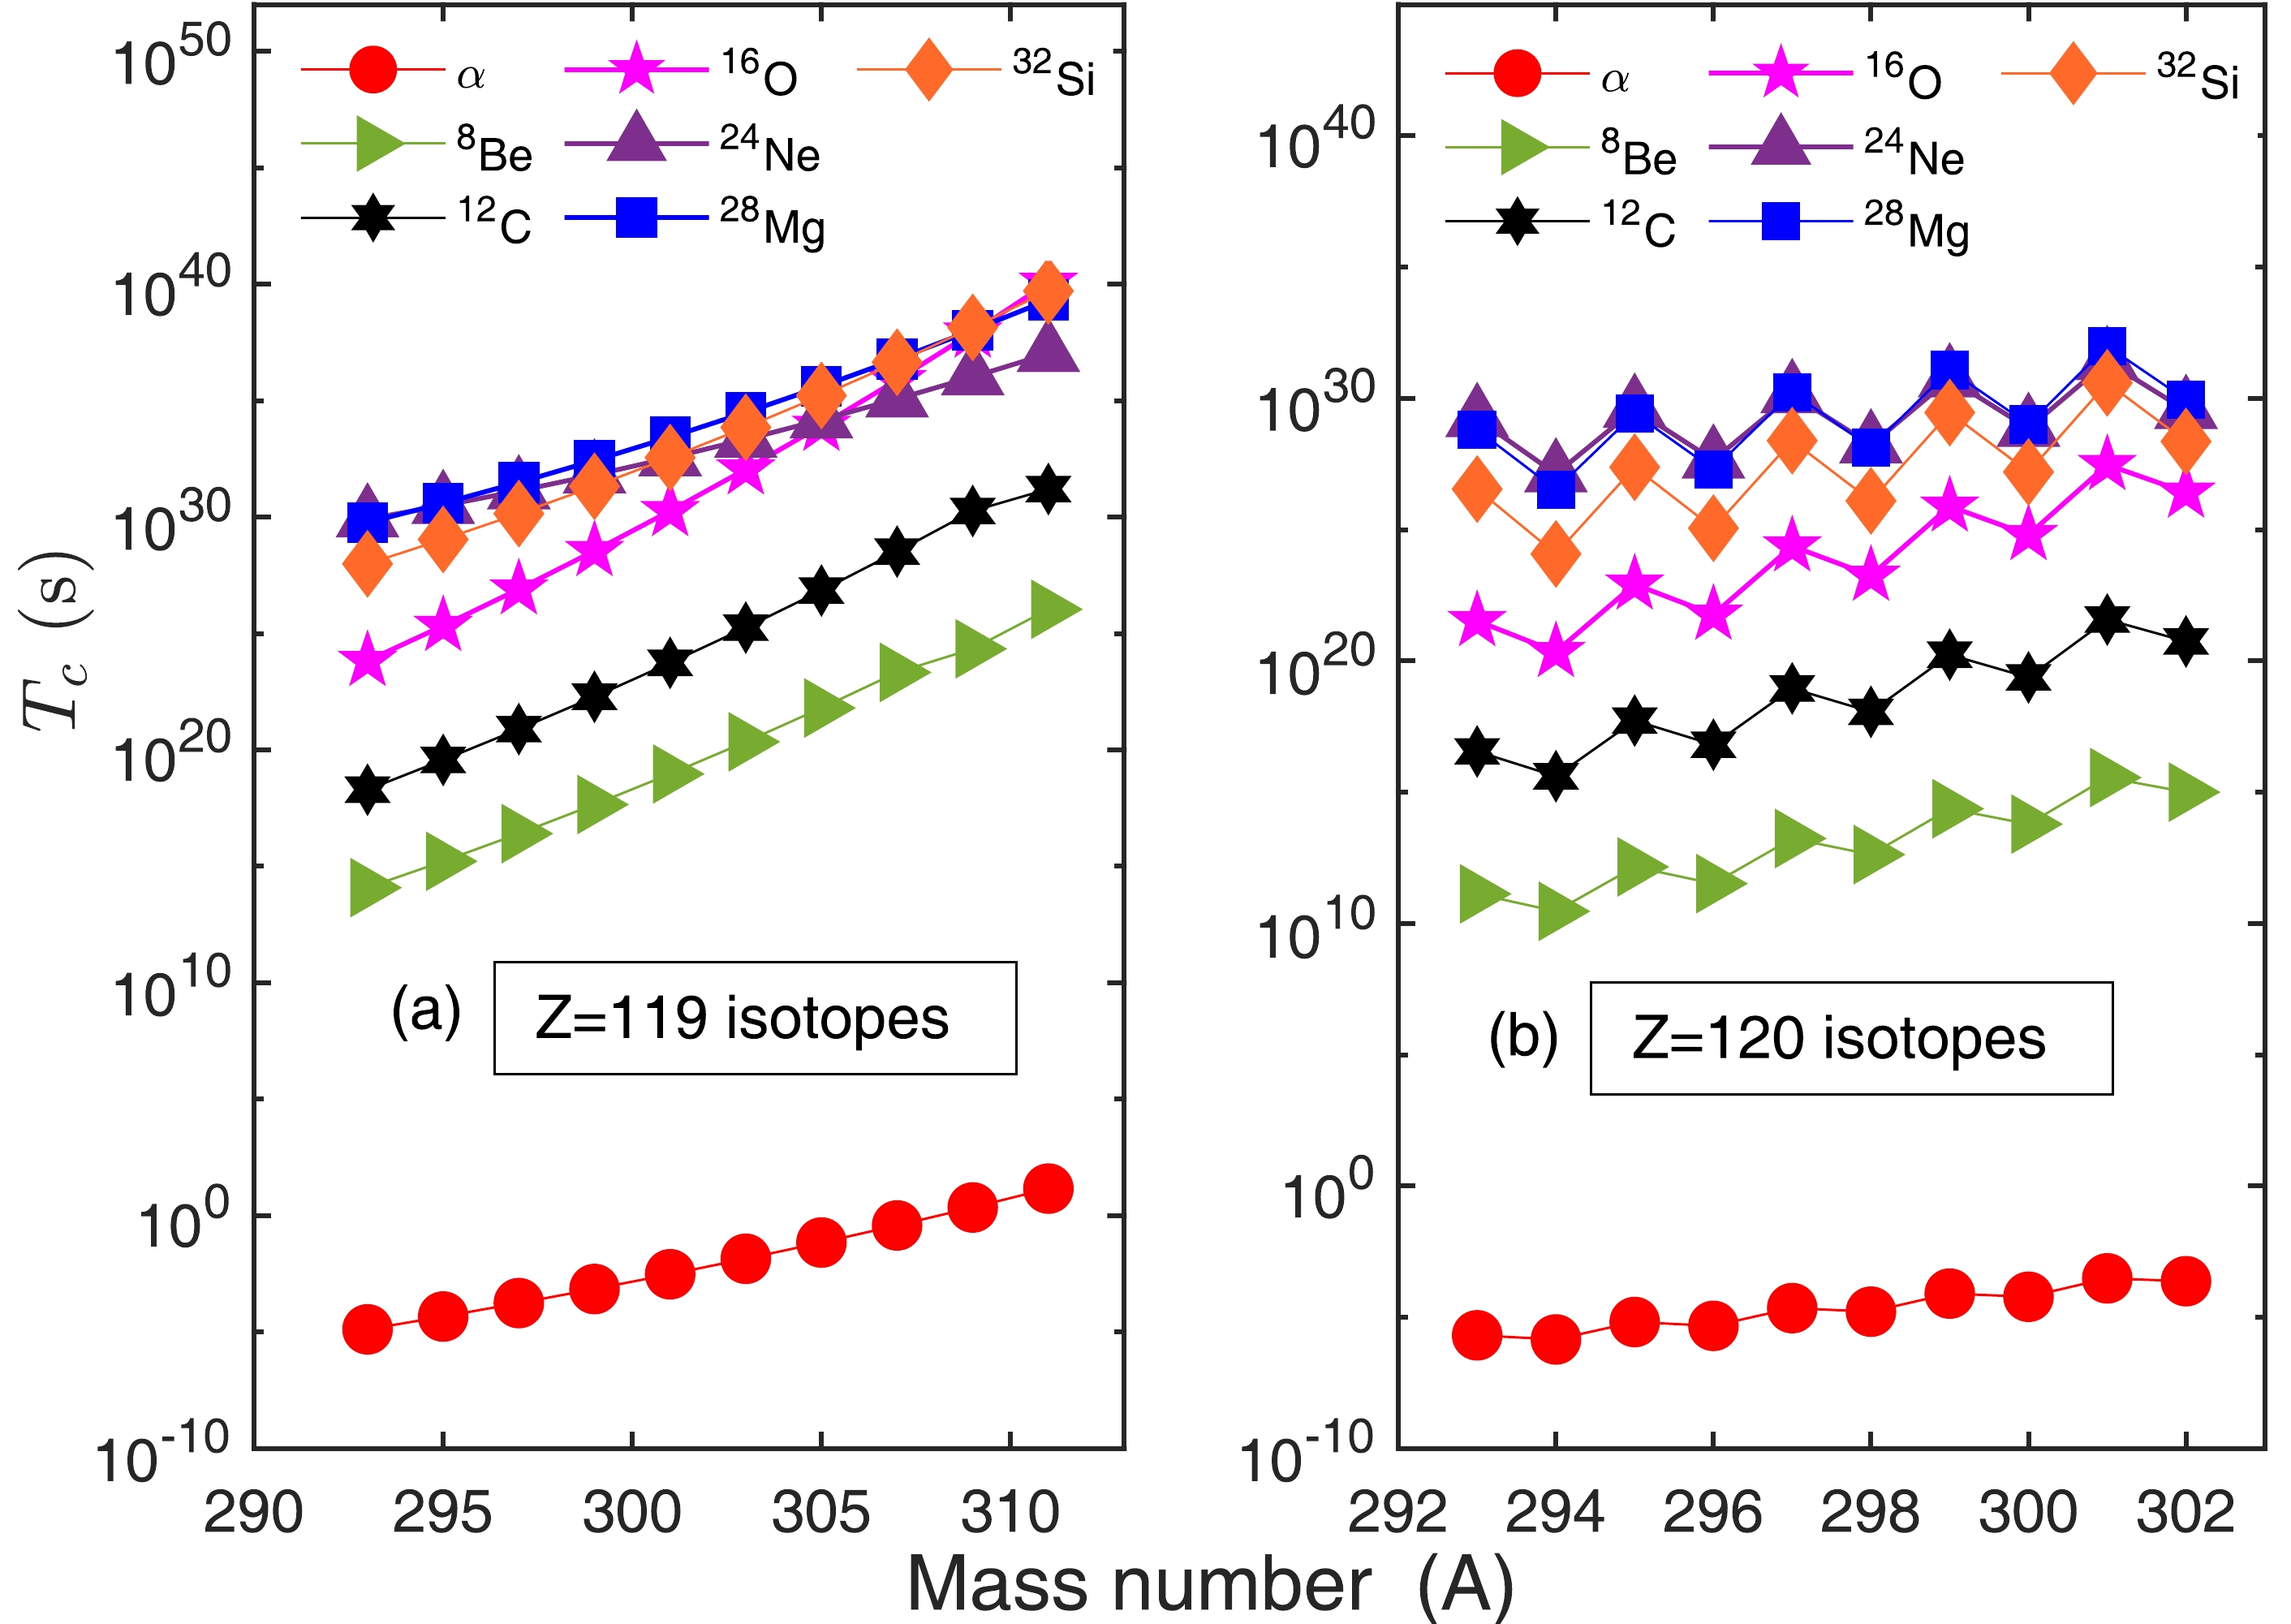
Figure 3. (color online) Plots of the computed half-lives
$ T_{\alpha} $ of α decay and$ T_c $ of CR from the DDCM for the isotopes with$ Z = 119 $ and 120 versus the mass number$A $ of the parent nuclei. The half-lives$ T_c $ of the six probable emitted-clusters 8Be, 12C, 16O, 24Ne, 28Mg, and 32Si are shown, where (a) is for the isotopes 293-311119 and (b) is for the isotopes 293-302120.The linear relationship between the decay energy of CR and the number of α particles within the emitted cluster (presented by
$ N_\alpha=\dfrac{Z_c}{2} $ ) has been investigated in heavy nuclei, as discussed in Ref. [28]. To verify this interesting phenomenon, we further extend the relationship between the decay energy of CR and the number$ N_\alpha $ of α particles within the emitted cluster to the region of SHN. Table 5 gives the prediction results for the CR of superheavy elements with fixed daughter nuclei with$ 108\le Z \le 120 $ . The first column contains the daughter nuclei of the decay, including$ ^{276} $ Hs,$ ^{284} $ Cn,$ ^{292} $ Lv, and$ ^{300} $ 120. The predicted emitted clusters in the second column are still filtered according to the previously mentioned selection method. The last column shows the half-lives calculated via the DDCM$ ^2 $ . A plot of decay energy$ Q_c $ versus$ N_\alpha $ with a fixed daughter nucleus is shown in Fig. 4. We fit the data listed in Table 5 and obtain four linear lines, which suggests that there is indeed a definite physical meaning for$ N_\alpha $ with respect to the decay energy during cluster decay. Note that the coefficients approximately remain constant for the different daughter nuclei. Furthermore, with an increase in the number of protons of daughter nuclei, the slope of the fitted linear line also exhibits an upward trend, indicating a positive correlation between the number of protons and the slope of the line. The expression for the decay energy is approximately$ Q_c=(N_\alpha-1) Q_{0} $ , where the decay energy$ Q_c $ increases constantly for each additional α particle with$ Q_0=20-24 $ MeV, which is less than the binding energy of the α particle (28.3 MeV). This relationship may suggest that the process of SHN cluster emission may involve a few α particles or a few α particles and neutrons pairs correlated into a large cluster near the surface of SHN, before the cluster is emitted out through quantum tunneling. This phenomenon may serve as evidence for the mechanism of CR in the region of SHN.Daughter Nuclei Emitted Cluster $ Q_c $ /MeV

$ T_{c} $ /s

276Hs 12C 37.57 1.06 $ \times 10^{24} $ 

16O 56.06 2.17 $ \times 10^{28} $ 

24Ne 78.09 1.62 $ \times 10^{31} $ 

28Mg 101.54 8.75 $ \times 10^{30} $ 

32Si 125.58 2.65 $ \times 10^{30} $ 

284Cn 12C 41.26 5.84 $ \times 10^{20} $ 

16O 60.95 1.24 $ \times 10^{25} $ 

24Ne 83.03 2.63 $ \times 10^{29} $ 

28Mg 107.67 1.53 $ \times 10^{29} $ 

32Si 132.90 4.66 $ \times 10^{28} $ 

292Lv 8Be 24.37 1.42 $ \times 10^{15} $ 

12C 44.86 1.25 $ \times 10^{18} $ 

16O 65.72 2.58 $ \times 10^{22} $ 

24Ne 87.87 8.55 $ \times 10^{27} $ 

28Mg 113.69 5.09 $ \times 10^{27} $ 

32Si 140.06 1.65 $ \times 10^{27} $ 

300120 8Be 26.73 4.76 $ \times 10^{12} $ 

12C 48.38 7.50 $ \times 10^{15} $ 

16O 70.39 1.41 $ \times 10^{20} $ 

24Ne 92.63 4.74 $ \times 10^{26} $ 

28Mg 119.58 3.09 $ \times 10^{26} $ 

32Si 147.10 9.71 $ \times 10^{25} $ 

Table 5. Theoretical predictions of the half-lives and decay energy of CR with fixed daughter nuclei of elements with
$ 108\le Z \le 120 $ . The first column is the fixed daughter nucleus, the second column shows the predicted emitted clusters, the third column contains the decay energy obtained using Dong's binding energy, and the last column shows the calculated half-lives using the DDCM2.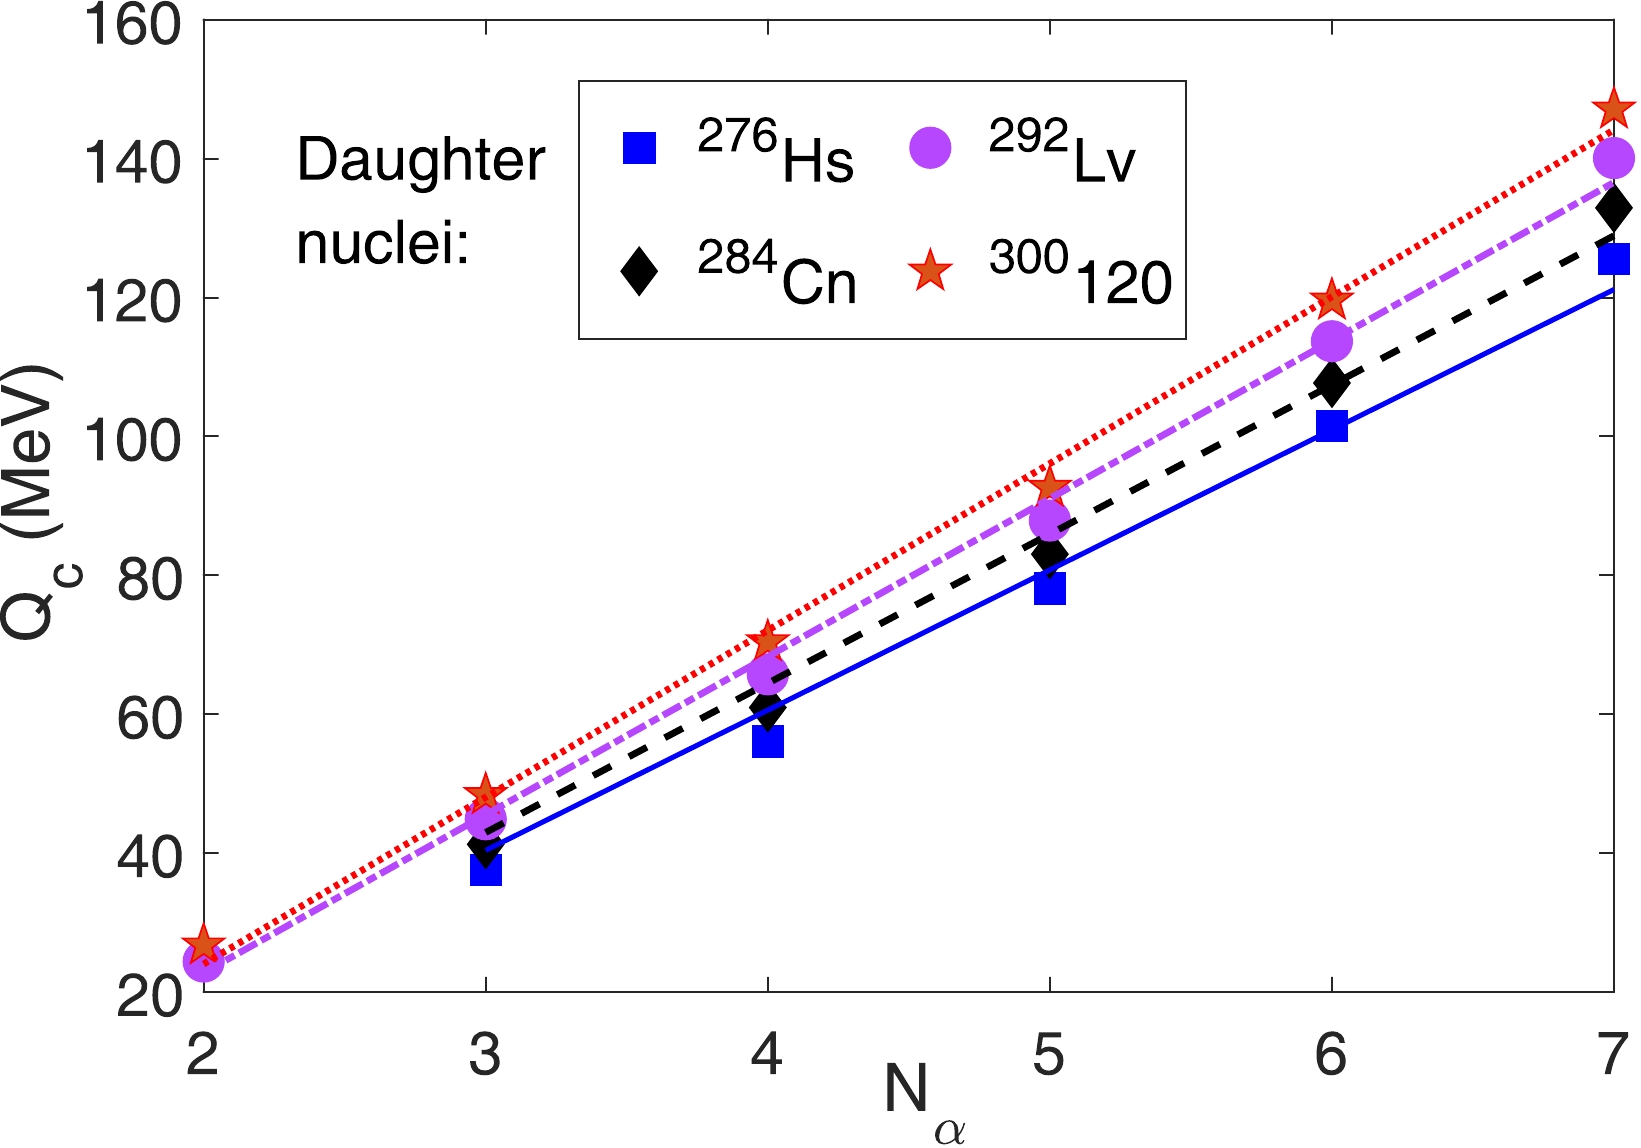
Figure 4. (color online) Linear relationship between the theoretical decay energy
$ Q_c $ of CR from Dong's binding energy and the number$ N_\alpha=\dfrac{Z_c}{2} $ of α particles in the predicted emitted clusters -
Our study systematically investigates the CR of SHN with
$ Z=119,120 $ using successful theoretical DDCM and UDF methods. First, the obtained values of rms deviations are within the range 0.254−0.528, and most of the HF are within$ \pm 0.7 $ , which indicates good agreement between our calculated results and experimental data. Subsequently, based on the theoretical methods with refitted parameters, we predict the emissions of clusters for the isotopic chains of$ {Z = } $ 119 and$ {Z = } $ 120. We gain the credible half-lives of twenty isotopes with$ ^{293-311} $ 119 and$ ^{293-302} $ 120 using the DDCM$ ^2 $ together with the UDF, where the decay energy is obtained using Dong's binding energy formula. Moreover, we find that except for α decay,$ ^{8} $ Be emission has the shortest half-life for each isotope considered in this study and is consequently identified as the most likely cluster to be emitted. The predictions performed with the DDCM and UDF for the half-lives of the cluster decay of$ Z = $ 119,120 elements are in good agreement, which may be of great use for further experimental investigations on cluster decay in the superheavy region. We also explore the competition between the possible decay modes of SHN and the corresponding α decay and find that α decay is likely the main decay mode. Furthermore, the linear relationship between the decay energy and the number of the few α particles within the emitted clusters is predicted in the range of SHN, which gives evidence that the process of SHN cluster emissions may involve a few α particles or a few α particles and neutron pairs correlated into a large cluster near the surface of SHN before cluster decay. In summary, by providing a comprehensive analysis of these isotopic chains, our study may contribute to a deeper understanding for SHN, which is expected to have important implications for future experiments in this field.
Theoretical predictions on cluster radioactivity of superheavy nuclei with Z = 119, 120
- Received Date: 2023-08-31
- Available Online: 2024-01-15
Abstract: In this study, we investigate the cluster radioactivity (CR) of new superheavy elements with


 DownLoad: