


 Abstract
 HTML
HTML Reference
 Related
 PDF
PDF


-
The importance of neutron-induced reaction cross-section data lies in the advancement of the ongoing development of reactor technologies such as the International Thermonuclear Experimental Reactor (ITER) [1] and Accelerated Driven Sub-critical Systems (ADSs) [2]. Accurate reaction cross-section data are crucial for dose estimation as well as the discovery of innovative and economically efficient methods for synthesizing rare medical isotopes. Over the years, several reactor-grade steel alloys have utilized nickel (Ni) isotopes [3]. Ni is also utilized in reactor cladding alloys such as Zircaloy-2 [4]. The composition of Ni and Fe in Zircaloy-4 has been controlled to provide a less hydrogen-producing cladding material [4]. Ni is a good candidate to be employed in the ITER and ADSs because of its physical and chemical properties. The high energy neutron interaction leads to different reactions such as
$(n, \gamma), \ (n, p), \ (n, 2n), \;(n, \alpha), \ (n, np), $ $\ (n, n\alpha), (n, 3n)$ . The cross-section data of a few of these reactions are crucial for estimating the radiation damage to the surrounding structural and reactor cladding materials, as well as for the evaluation of hydrogen production. The (n, p) reaction channel with the$ ^{58} $ Ni isotope leads to the production of the medium-lived radio-isotope$ ^{58} $ Co, which has many medical applications. Its most significant role is as a trace element for the absorption of vitamin B12 in the human body [5].Exploring the uncertainty associated with the activation cross-section is crucial in determining the reasonable margin that ensures both economy and safety in nuclear reactor applications [6]. If multiple data points of the activation cross-sections are involved when evaluating the quantity of interest, the correlation (covariance) among the data points must also be examined to prevent overestimating or underestimating the uncertainty. Therefore, the aim of modern evaluation reports is not only to estimate the most accurate cross-section but also to identify the uncertainty and covariance describing the correlation among the cross-sections. However, in most previous data, details regarding error propagation and correlations among the different attributes are not reported. Considering the above facts, new experimental cross-sections with covariance analysis are needed to enhance the accuracy and reliability of these evaluated nuclear data and theoretical models.
The present work aimed to measure the production cross-section of the
$ ^{58} $ Co isotope with neutrons generated using the$ ^{7} $ Li(p,n) reaction. The cross-section of the aforesaid reaction was measured with respect to the$ {}^{115}{\rm{In}} (n, n'){}^{115{\rm m}}{\rm{In}} $ reference monitor reaction cross-section at incident spectrum average neutron energies of 1.66$ \pm $ 0.14, 2.06$ \pm $ 0.14, and 2.66$ \pm $ 0.16 MeV. As the measurements are relative to the reference monitor cross-section and the detector efficiencies, the uncertainty in the measured data is also influenced by the reference monitor cross-sections. The results are reported with a detailed description of uncertainties as well as the correlation among the measured data using the error propagation method. In the present work, a detailed covariance analysis was carried out to include the errors from each attribute in order to estimate the uncertainty in the measured data. The present results were compared with the existing literature cross-section data available in the EXFOR data library [7] as well as with the results of the theoretical nuclear reaction code TALYS-1.96 [8]. The effects of various level density models available in the code were also evaluated for a better description of the existing experimental data. The obtained results were compared with the Evaluated Nuclear Data Library (ENDF/B-VIII.0) [9], Joint Evaluated Fission and Fusion File (JEFF-3.3) [10], Japanese Evaluated Nuclear Data Library (JENDL-4.0) [11], and Chinese Evaluated Nuclear Data Library (CENDL-3.2) [12].The present study offers a thorough investigation of the significance of error propagation in the neutron-induced nuclear reaction cross-section data and the TALYS-1.96 nuclear reaction code. The use of the
$ ^{58} $ Co isotope in medical applications is another area in which the measured data have considerable importance.This paper consists of six sections. In Section II, the experimental details used in the present measurement are discussed. A detailed covariance analysis is presented in Section III. Section IV provides an insight into the theoretical framework. The results and discussion are included in Section V. Finally, a summary and the conclusions drawn from the present study are presented in Section VI.
-
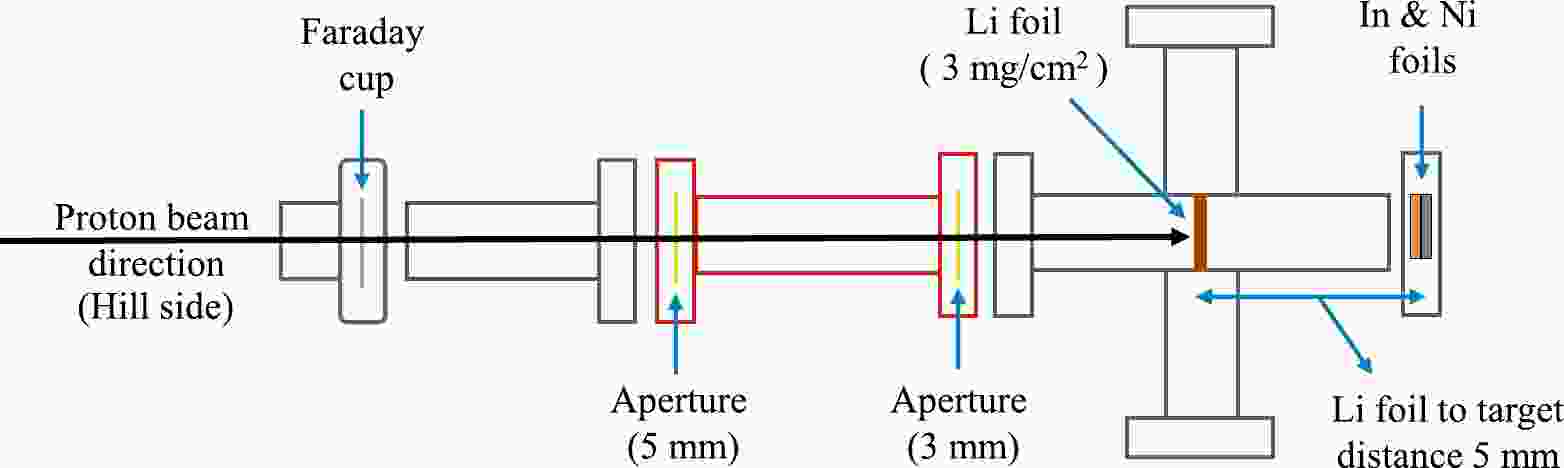
The present experiment was performed at the Folded Tendem Ion Accelerator (FOTIA) facility at the Bhabha Atomic Research Centre (BARC), Mumbai, India. A schematic of the experimental arrangement is shown in Fig. 1. In the present experiment, the proton beam was accelerated to energies of 3.6, 4.0, and 4.6 MeV, and it was bombarded on a 3
$ \rm mg/cm^2 $ (56.18$ \rm \mu m $ ) thick natural lithium target to produce neutrons through the$ ^{7}{\rm{Li}}(p, n)^{7}{\rm{Be}} $ (Q value = −1.644 MeV;$ E_{\rm th} $ = 1.880 MeV) reaction.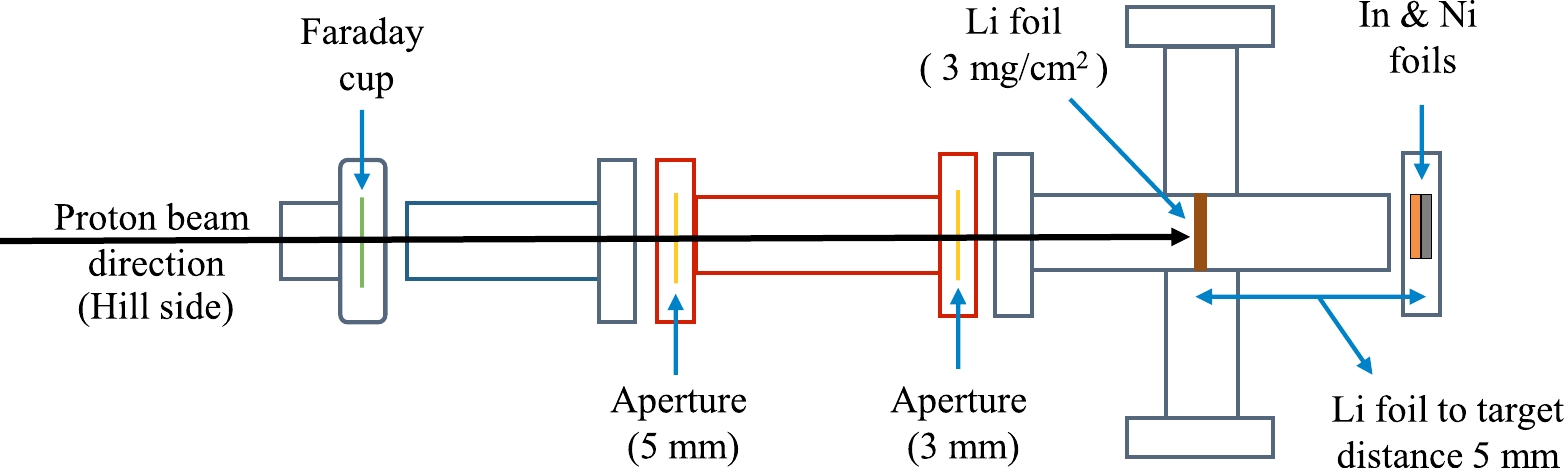
Figure 1. (color online) Schematic representation of the experimental setup for the sample irradiation.
The samples were irradiated with a proton beam current of
$ \sim $ 25 nA at a distance of 5 mm from the lithium target. The time-of-flight method could not be applied to measure the neutron energy profile as the proton beam was continuous. Therefore, we used the Energy of Proton Energy of Neutron (EPEN) [13] simulation code to generate a neutron energy profile. EPEN is a deterministic simulation code developed to evaluate the neutron energy profile using the$ ^{7}{\rm{Li}}(p, n)^{7}{\rm{Be}} $ reaction. The code operates for incident proton energies ranging from a reaction threshold of 1.880 MeV to a maximum energy of 7.0 MeV. Further information on the specific input parameters and theoretical framework employed by the EPEN code to generate neutron energy distribution can be explored in Reference [13]. The production of a primary group of neutrons$ (p, n_{0}) $ from the ground state of 7Be from the$ ^{7}{\rm{Li}}(p, n) $ reaction was contaminated by the presence of lower energy secondary neutrons$ (p, n_{1}) $ generated from the${}^{7}{\rm{Li}}(p, n_{1})^{7}{\rm{Be}}^{*} $ ($ E_{\rm th}=2.37 $ MeV) reaction channel, as well as the neutron yield from the$ ^{7}{\rm{Li}}(p, n+{}^{3}{\rm{He}})^{4}{\rm{He}} $ ($ E_{\rm th}=3.70 $ MeV) reaction channel because the current proton energies are above the corresponding reaction threshold. However, in the current proton energy range, the contribution of the$ ^{7}{\rm{Li}}(p, n+^{3}{\rm{He}})^{4}{\rm{He}} $ reaction channel to the neutron yield was negligible. However, the contribution of the$ (p, n_{0}) $ channel to the neutron yield was maximum and was approximately 90%, followed by that of the$ (p, n_{1}) $ channel, which was less than 10% [14, 15]. With the EPEN code, it is possible to acquire the individual$ (p, n_{0}) $ and$ (p, n_{1}) $ neutron energy distribution as well as the total neutron energy distribution from both groups for a specified incident proton energy.The neutron flux energy spectra for
$ (p, n_{0}) $ and$ (p, n_{1}) $ produced from the EPEN code are shown in Fig. 2 for all the three energies. A spread in the neutron spectrum of$ (p, n_{0}) $ can be observed because of the energy degradation of protons in the${}^{7}{\rm{Li}} $ target. The average neutron energy of the$ ^{7}{\rm{Li}}(p, n_{0})^{7}{\rm{Be}} $ neutron group was obtained by using the following equation [16, 17]:
Figure 2. Neutron flux energy spectra ϕ(E) produced from the EPEN code for (a)
$E_p $ = 3.60 ± 0.02 MeV, (b)$E_p $ = 4.00 ± 0.02 MeV, and (c)$E_p $ = 4.60 ± 0.02 MeV.$ \langle E_{\rm{n}}\rangle= \frac{\displaystyle\int_{E_{\rm{min}}}^{E_{\rm{max}}} \phi_{0}(E)\ E \ {\rm d} E}{\displaystyle\int_{E_{\rm{min}}}^{E_{\rm{max}}} \phi_{0}(E) \ {\rm d} E} , $

(1) where
$\phi_{0}(E)$ is the$ (p, n_{0}) $ neutron flux energy spectrum from EPEN, and the corresponding integration limits are$ E_{\rm min} =$ 1.313, 1.693, 2.255 and$ E_{\rm max} =$ 1.979, 2.384, 2.989 for incident proton energies of 3.6, 4.0, and 4.6 MeV, respectively. The spectrum averaged neutron energy$ (\langle E_{n}\rangle) $ along with its corresponding uncertainties determined from the EPEN code are 1.66$ \pm $ 0.14, 2.06$ \pm $ 0.14, and 2.66$ \pm $ 0.16 MeV for$ E_{p} =$ 3.6, 4.0, and 4.6 MeV, respectively. The uncertainties were determined by utilizing the full width at half maximum (FWHM) of the neutron energy distribution. -
In the present experiment, the samples were prepared in three different sets. Natural nickel (Ni) foils having a purity of 99.5% and thickness of 300 μm were utilized for the experiment. Natural indium (In) foils with 99.97% purity and thickness of 100 μm were used for monitoring the neutron flux. The Ni and In foils were individually wrapped with 14 μm thick aluminium foil to prevent radioactive cross-contamination among the target, monitor foils, and surroundings. The samples were irradiated by placing the stack of "Ni-In" of size 1 cm
$ \rm \times $ 1 cm at zero degrees relative to the direction of the beam. All the foils were accurately weighted using a micro-balance machine to 0.1 mg accuracy. The details regarding the sample's irradiation, cooling, and counting times, as well as weight with the corresponding uncertainty, are listed in Table 1.Sample $\langle E_{ {n} } \rangle$ /MeV

Sample weight/mg Irradiation time/s Cooling time/s Counting time/s Ni 1.66 ± 0.14 246.7 ± 0.1 86460 102990 64800 2.06 ± 0.14 308.3 ± 0.1 24180 402340 72000 2.66 ± 0.16 276.4 ± 0.1 55020 119420 72000 In 1.66 ± 0.14 90.8 ± 0.1 86460 5860 900 2.06 ± 0.14 93.9 ± 0.1 24180 2040 600 2.66 ± 0.16 94.0 ± 0.1 55020 3660 600 Table 1. Sample details along with their irradiation, cooling, and counting times used in the experiment.
Upon completion of the irradiation process, the radioactive samples were carefully taken out from the beam line and subsequently allowed to cool for a sufficient time. After sufficient cooling, the irradiated Ni and In samples were affixed to a distinct perspex plate and then transported to the counting room. The Ni-samples were counted for 16 to 18 h and the In-samples were counted for 10 to 15 min to build up sufficient counting statistics according to the induced activity following their half-life. More details regarding irradiation, cooling, and counting times are given in Table 1. A pre-calibrated high-purity germanium (HPGe) detector with 50% relative efficiency (manufactured by Baltic Scientific Instruments) was employed for data acquisition. The detector was lead shielded to minimize background interference. The data was acquired utilizing a 16K BOSON Multi-Channel Analyzer (MCA) linked with a PC. The dead time of the HPGe detector during the counting was negligible. The characteristic γ-ray energy as well as the associated nuclear spectroscopic data of the reaction under investigation were retrieved from the online database, NuDat 3.0 [18] and are listed in Table 2. Typical γ-ray spectra for the sample and the monitor reaction in the present experiment are shown in Fig. 3.
Reaction Prominent γ-ray energy/keV Branching intensity (%) Decay mode (%) Half-life Spin state $ \rm J^\pi $ 

$ {}^{115}{\rm{In}} (n, n'){}^{115{\rm m}}{\rm{In}} $ 

$ 336.241 \pm 0.025 $ 

$ 45.90 \pm 0.10 $ 

$ \beta^{-1} $ (5)

$ 4.486 \pm 0.004 $ h

$ 1/2^{-1} $ 

IT (95) $ {}^{58}{\rm{Ni}} (n, p){}^{58}{\rm{Co}} $ 

$ 810.759 \pm 0.002 $ 

$ 99.45 \pm 0.01 $ 

$ \rm \varepsilon $ (100)

$ 70.86 \pm 0.06 $ d

$ 2^{+} $ 

Table 2. Spectroscopic data used in the present experiment [18].
-
A standard
${}^{152}{\rm{Eu}} $ ($ t_{1/2} $ = 13.517$ \pm $ 0.009 y [18]) point source of known activity ($ A_{0} $ = 6614.71 Bq on 1 Oct. 1999) was used for the efficiency calibration of a single crystal p-type HPGe detector at various characteristic γ-ray energies. The following formula was used to determine the efficiency of the point source:$ \varepsilon_{p}= K_{\rm{f}} \ \frac{C} {A_{0} \ I_{\gamma} \ {\rm e}^{-\lambda T} \ \Delta t}. $

(2) In this context, the symbol
$A_0$ denotes the activity of the${}^{152}{\rm{Eu}} $ point source at the time of its production. The total number of counts recorded for a specific γ-ray energy, along with its absolute intensity ($I_{\gamma}$ ) over a counting period ($\Delta t$ = 2000 s), is represented by C. The decay constant is denoted by$ \rm \lambda $ , while the elapsed time between the production and counting dates is referred to as T. The coincidence summing correcting factor is abbreviated as$K_{f}$ -
To obtain a high count rate, the samples were placed quite close to the detector (6.0 mm) owing to the relatively low count rate from the
${}^{58}{\rm Ni} (n, p){}^{58}{\rm Co}$ reaction. Therefore, the standard efficiency calibration source was also placed at a distance of 6.0 mm from the detector. This, in turn, produced the coincidence summing effect [16]. The Monte Carlo simulation code EFFTRAN [19] was used to compute the correction factor$K_{f}$ , and corrections to the measured detector efficiency were made. Description of the$ {}^{152}{\rm{Eu}} $ $\gamma $ -ray source (e.g., material, dimension, and characteristic x-rays and γ-rays) and HPGe detector specifications, including its dimension, crystal material, crystal hole cavity, end cap, window, mount cup, and absorber, are required as inputs for the simulation. The simulation calculates the correction factors for the γ-lines at each of their respective energies while accounting for coincidences between γ-ray–γ-ray, γ-ray–x-ray, and x-ray–x-ray.As the activated foil has a finite area (1 cm
$ \rm \times $ 1 cm ) and the HPGe detector's calibration was performed using a point source, the efficiency for the point source geometry$\varepsilon_{p}$ was transferred to the efficiency for the foil geometry$ \rm \varepsilon $ by EFFTRAN, which is provided in Table 3.$E_{\rm{\gamma} }$ /keV

Counts (C) $I_{\gamma}$ 

$K_{f}$ 

$\varepsilon_{p}$ 

$ \rm \varepsilon $ 

$ \rm \Delta \varepsilon $ 

121.78 156887 0.2853 1.181 0.0647 0.0564 0.0083 244.70 22998 0.0755 1.227 0.0372 0.0295 0.0078 443.96 6153 0.0283 1.211 0.0263 0.0203 0.0060 964.06 17259 0.1451 1.084 0.0128 0.0097 0.0031 1112.08 15174 0.1367 1.029 0.0114 0.0086 0.0028 1408.01 18509 0.2087 1.052 0.0093 0.0070 0.0023 Table 3. Comprehensive data set of the various parameters used in the detector calibration and analysis of the HPGe detector's efficiency measurement.
-
The neutron spectra obtained by the EPEN code were utilized to calculate the neutron flux using the
$ {}^{115}{\rm{In}} (n, n'){}^{115{\rm m}}{\rm{In}} $ reference monitor reaction cross-section. The product 115mIn from this reaction has a prominent γ-line of 336.241$ \pm $ 0.025 keV with a half-life ($t_{1/2}$ ) of 4.486$ \pm $ 0.004 h [18]. The flux value was calculated by obtaining the spectral weighted cross-section ($ \rm \langle \sigma_m \rangle $ ) for the monitor reaction, using cross-sections from the IRDFF-II data library and applying Eq. (5), as described in the subsequent section. A comparison of the reference monitor cross-sections from the EXFOR [7] data library and recommended values from the IRDFF-II [20] is shown in Fig. 4. The net neutron flux incident on the target was calculated using spectral weighted cross-sections at various energies using the following equation [21, 22]: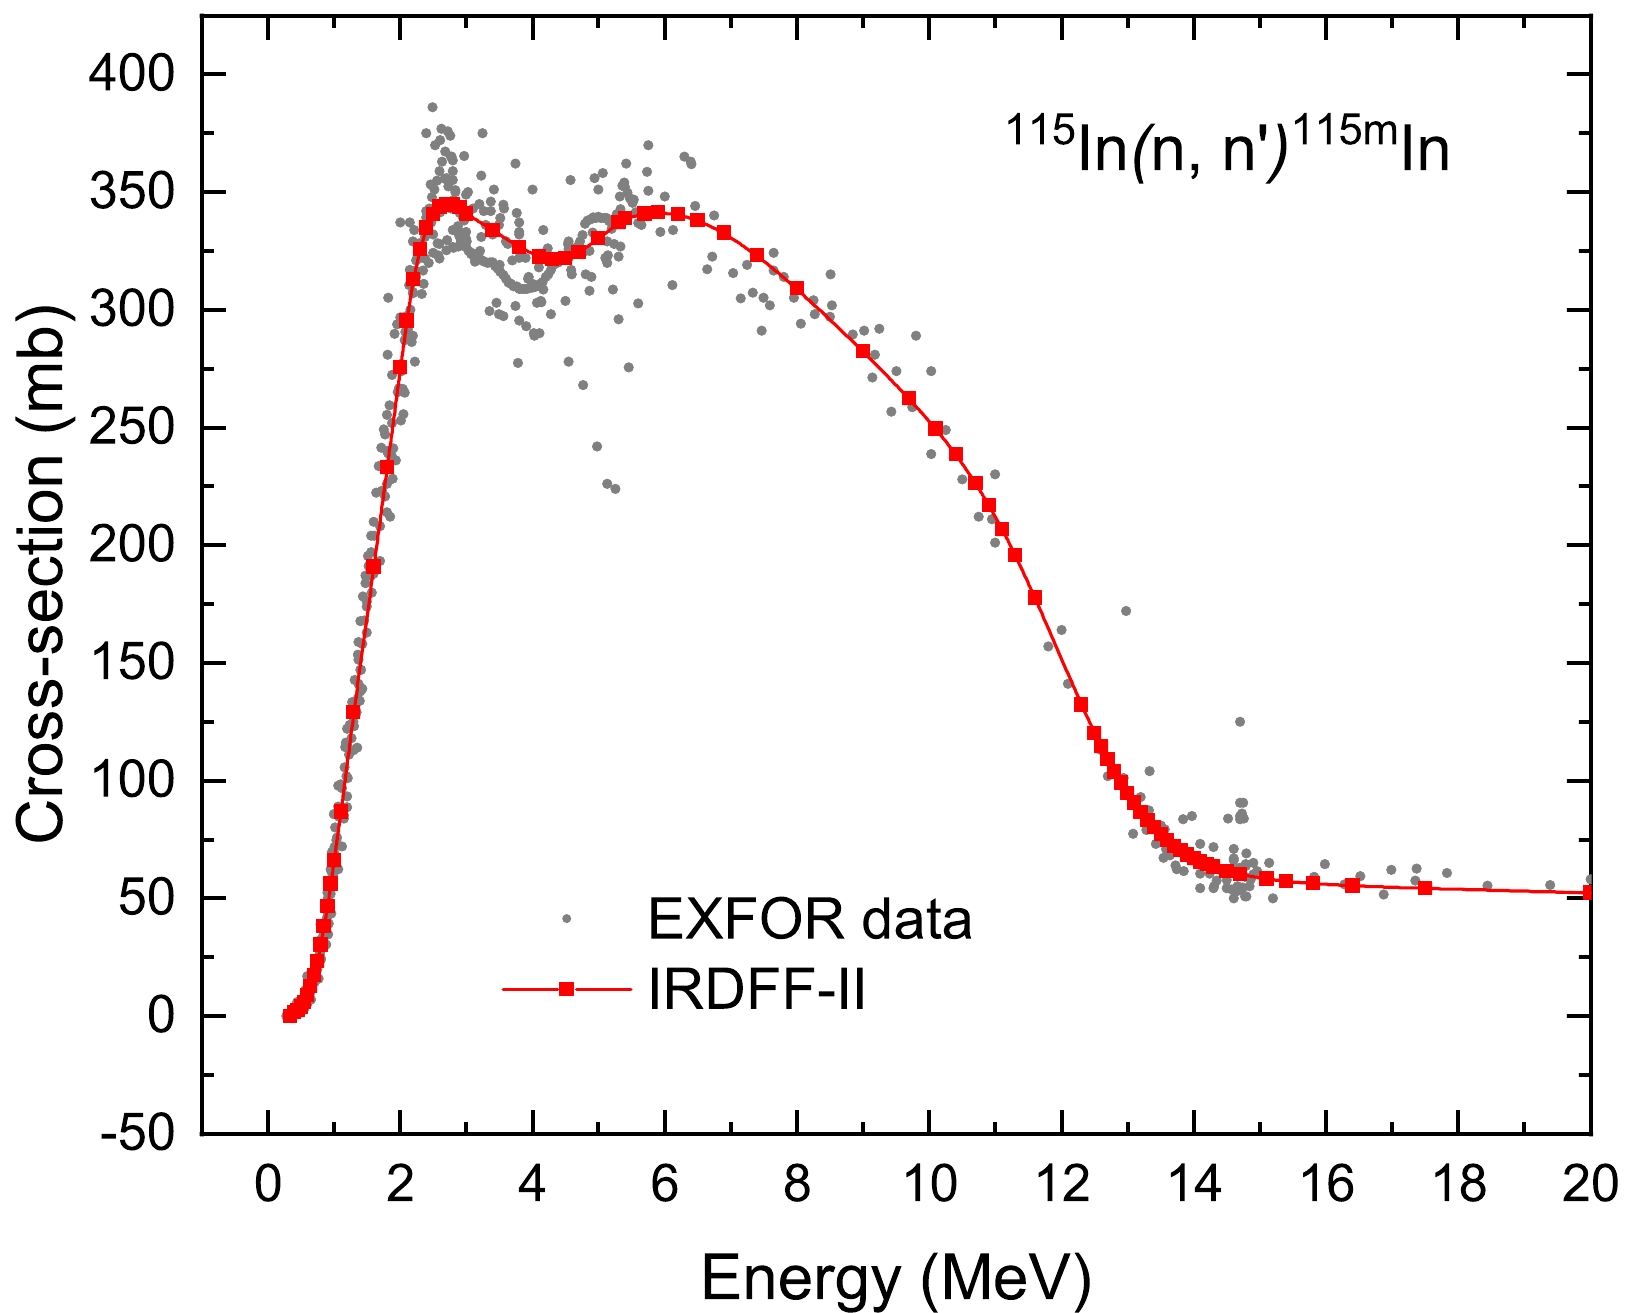
$ \Phi = \frac{ A_{\gamma} \ \lambda \ \left(\dfrac{t_c}{t_r}\right)}{N_0 \ \langle \sigma_m \rangle \ I_{\gamma} \ \varepsilon \ (1-{\rm e}^{-\lambda t_{i}}) \ (1-{\rm e}^{-\lambda t_c})\ {\rm e}^{-\lambda t_w} }, $

(3) where
$ A_{\gamma} $ = characteristic γ-ray photo-peak counts for the product nuclide,$ \lambda $ = decay constant$ \rm{(s^{-1})} $ ,$ t_i $ = irradiation time$ \rm{(s)} $ ,$ t_c $ = counting time$ \rm{(s)} $ ,$ t_w $ = cooling time$ \rm{(s)} $ ,$ t_r $ = real time (clock time)$ \rm{(s)} $ ,$ N_0 $ = total number of target nuclei in the sample,$ I_{\rm{\gamma}} $ = branching intensity of γ-ray [18], and$ \rm \varepsilon $ = detector efficiency.This calculated neutron flux has been used in Eq. (4) for the determination of neutron spectrum averaged cross-section,
$ \langle \sigma \rangle = \frac{ A_{\gamma} \ \lambda \ \left(\dfrac{t_c}{t_r}\right)}{N_0 \ \Phi \ I_{\rm{\gamma}} \ \varepsilon \ (1-{\rm e}^{-\lambda t_{i}}) \ (1-{\rm e}^{-\lambda t_c}) \ {\rm e}^{-\lambda t_w}} ,$

(4) where all the symbols have the same meanings as those in Eq. (3).
Owing to the presence of quasi-monoenergetic neutrons, the contribution of the lower energy tail part can also be observed in the measured cross-sections. As a result, removing the contribution of these neutrons from the measured cross-section is necessary. The correction factor for low-energy background neutrons, along with the self-attenuation factor for γ-ray, is discussed in Section II.VI.
-
The standard data library for neutron monitor reaction cross-section IRDFF-II [20] was used for reference monitor reaction cross-section
$ {}^{115}{\rm {In}} (n, n'){}^{115{\rm m}}{\rm{In}} $ . As the neutrons generated by the$ ^{7}{\rm {Li}}(p, n_{0})^{7}{\rm{Be}} $ reaction are not monoenergetic but rather have an energy spread, the neutron flux energy spectrum$ \phi_{0}(E) $ produced by the EPEN [13] code was used to fold the point-wise monitor cross-section in the IRDFF-II library ($\sigma_{m}(E)$ ) using the following equation [16]:$ \langle \sigma_{m}\rangle= \frac{\displaystyle\int_{E_{\rm{min}}}^{E_{\rm{max}}} \phi_{\rm{0}}(E)\ \sigma_{m}(E) \ {\rm d} E}{\displaystyle\int_{E_{\rm{min}}}^{E_{\rm{max}}} \phi_{\rm{0}}(E) \ {\rm d}E}. $

(5) The energy integrated neutron flux calculated from the γ-ray activity of
${}^{115{\rm{m}}}{\rm{In}} $ after substantiating the contribution of low-energy background neutrons with γ-ray self attenuation correction is$ \rm 1.222 \ \times 10^7 \ n \ cm^{-2} \ s^{-1} $ at 2.66 MeV,$ \rm 1.548 \ \times 10^7 \ n \ cm^{-2} \ s^{-1} $ at 2.06 MeV, and$2.415 \ \times \rm 10^7 \ n \ cm^{-2} \ s^{-1}$ at 1.66 MeV neutron energy. The covariance information of$\sigma_{m}(E)$ is provided by the IRDFF-II for its group-wise cross-section. Similar to this, we have also introduced the group-wise neutron flux energy spectrum${\rm {\phi}}_{i,k}$ , produced using the EPEN code by$ \phi_{i,k} = \int_{E_{k,\rm{low}}}^{E_{k,\rm{high}}} \phi_{i}(E) \ {\rm d}E, $

(6) which fulfills
$\sum\limits_{k}\phi_{i,k} = 1 $ , where i = 1, 2, and 3 are specified for$\langle E_{ {n}} \rangle$ = 1.66, 2.06, and 2.66 MeV, respectively. The energy group boundaries in the IRDFF-II library have k energy groups defined for each neutron energy i. The lower and upper boundaries of the$k^{\rm th}$ energy group are denoted by$E_{k,\rm{low}}$ and$E_{k,\rm{high}}$ respectively. Table 5 lists the group-wise quantities for the spectrum averaged neutron energy flux, IRDFF-II monitor cross-sections, and uncertainty and correlation coefficients, where groups k = 1−3, 4−6, 7−9 are specified for$\langle E_{ {n}} \rangle$ = 1.66, 2.06, and 2.66 MeV neutrons, respectively.i k $E_{k,\rm{low} }$ 

/MeV$E_{k,\rm{high} }$ 

/MeV$\phi_{i,k}/ \sum \phi_{i,k}$ 

$\sigma_k\;{(b)}$ 

$\Delta \sigma_k \;(\%)$ 

Correlation coefficient ${\rm Cor}(\sigma_{k},\sigma_{l})$ 

1.313 1.600 1.800 1.600 2.000 2.200 2.400 2.600 2.800 1 1 1.313 1.600 0.147 0.16130 2.96 1.0000 2 1.600 1.800 0.779 0.21193 2.83 0.8434 1.0000 3 1.800 2.000 0.074 0.25421 2.68 0.5449 0.8680 1.0000 2 4 1.600 2.000 0.146 0.24285 2.72 0.8434 1.0000 0.8680 1.0000 5 2.000 2.200 0.770 0.29540 2.63 0.2681 0.5180 0.8334 0.5180 1.0000 6 2.200 2.400 0.085 0.32591 2.62 0.1734 0.2187 0.4937 0.2187 0.8559 1.0000 3 7 2.400 2.600 0.154 0.33654 2.61 0.2576 0.1747 0.2708 0.1747 0.5690 0.8707 1.0000 8 2.600 2.800 0.720 0.34484 2.57 0.3677 0.2983 0.2361 0.2983 0.3173 0.5712 0.8720 1.0000 9 2.800 2.989 0.126 0.34368 2.46 0.4031 0.4162 0.3149 0.4162 0.2253 0.3222 0.6181 0.9021 1.0000 Table 5. IRDFF-II [20] spectrum averaged neutron monitor cross-sections
$(\sigma_{k})$ along with fractional uncertainties and correlation coefficients and EPEN code computed fractional neutron flux for each neutron energy group.Reference [23] was used for propagating the covariance matrix of the IRDFF-II library to the averaged cross-section with the following equation:
$ {\rm Cov} (\langle \sigma_{m} \rangle _{i} , \langle \sigma_{m} \rangle _{j}) = \sum\limits_{k=1}^{N} \sum\limits_{l=1}^{N} \phi_{i,k} \ {\rm Cov}(\sigma_{k}, \sigma_{l}) \ \phi_{j,l} , $

(7) where N is the number of points in the specified group, and
$ {\rm Cov} (\sigma_{k}, \sigma_{l}) = {\rm Cor} (\sigma_{k}, \sigma_{l}) \ \Delta \sigma_{k} \ \Delta \sigma_{l}. $

(8) The correlation coefficients were propagated between the averaged cross-sections using the generated covariance matrix, as follows:
$ {\rm Cov}(\langle \sigma_{m} \rangle _{i} , \langle \sigma_{m} \rangle _{j}) = \frac{{\rm Cov}(\langle \sigma_{m} \rangle _{i} , \langle \sigma_{m} \rangle _{j})}{\Delta \langle \sigma_{m} \rangle_{i} \ \Delta \langle \sigma_{m} \rangle_{j} }. $

(9) The neutron spectrum averaged monitor cross-section
$\langle \sigma_{m} \rangle$ for each energy is presented in Table 6, along with its uncertainty and correlation coefficients.Reaction $\langle E_{n} \rangle$ /MeV

Cross-section $\langle \sigma_{m} \rangle$ /mb

$\Delta \langle \sigma_{m} \rangle$ (%)

${\rm Cor} (\langle \sigma_{m} \rangle _{i}, \langle \sigma_{m} \rangle _{j})$ 

$ {}^{115}{\rm{In}} (n, n'){}^{115{\rm m}}{\rm{In}} $ 

1.66 ± 0.14 204.62 ± 5.79 2.83 1.0000 2.06 ± 0.14 286.50 ± 7.54 2.63 0.5530 1.0000 2.66 ± 0.16 343.00 ± 8.82 2.57 0.2996 0.2993 1.0000 Table 6. Neutron spectrum averaged monitor cross-section along with its uncertainty and correlation coefficients.
-
As the present proton energies are above the reaction threshold of the first excited state of 7Be, the neutrons produced from the
$ ^{7}{\rm{Li}}(p, n) $ reaction were contaminated by secondary group of lower energy neutrons$ (p, n_{1}) $ produced from the reaction$ ^{7}{\rm{Li}}(p, n_{1})^{7}{\rm{Be}}^{*} $ ($E_{\rm{th}}= 2.37$ MeV). The precise measurement of neutron induced reaction cross-section requires the subtraction of this$ (p, n_{1}) $ low-energy background neutron contribution. This has been considered and calculated using Eq. (13) of Reference [16]:$ N_{\rm{corr}}=1-\frac{\displaystyle\int_{E_{\rm{low}}}^{E_{\rm{high}}} \phi_{1}(E) \ (\sigma_{x}(E))\ {\rm d}E}{\displaystyle\int_{E_{\rm{low}}}^{E_{\rm{high}}} \phi (E) \ (\sigma_{x}(E))\ {\rm d} E} ,$

(10) where
$\phi_{1}(E)$ is the$ (p, n_{1}) $ neutron flux energy spectrum, and$\phi (E)=\phi_{\rm{0}}(E)+\phi_{1}(E)$ is the total neutron flux obtained from the EPEN code. The integration limit for incident proton energies of 3.6, 4.0, and 4.6 MeV corresponding to$ (p, n_{1}) $ neutron spectra are$E_{\rm{low}}$ = 0.884, 1.27, 1.836 and$E_{\rm{high}}$ = 1.521, 1.931, 2.542, respectively. For the total neutron flux, these limits are$E_{\rm{low}}$ = 0.884, 1.27, 1.836 and$E_{\rm{high}}$ = 1.979, 2.384, 2.989.$\sigma_{x}(E)$ is the$ {}^{58}{\rm{Ni}} (n, p){}^{58}{\rm{Co}} $ reaction cross-section taken from the ENDF/B-VIII.0 [9] and the$ {}^{115}{\rm{In}} (n, n'){}^{115{\rm m}}{\rm{In}} $ reaction cross-section taken from the IRDFF-II library [20]. The obtained correction factors for all the three neutron energies are listed in Table 4.Reaction $\langle E_{ {n} } \rangle$ /MeV

$N_{\rm{corr} }$ 

Sample $E_{\rm{\gamma} }$ /keV

$G_{\rm{self} }$ 

$ {}^{58}{\rm{Ni}} (n, p){}^{58}{\rm{Co}} $ 

1.66 ± 0.14 0.9708 Ni $ 810.759 \pm 0.002 $ 

1.0092 2.06 ± 0.14 0.9590 2.66 ± 0.16 0.9600 $ {}^{115}{\rm{In}} (n, n'){}^{115{\rm m}}{\rm{In}} $ 

1.66 ± 0.14 0.9339 In $ 336.241 \pm 0.025 $ 

1.0051 2.06 ± 0.14 0.9236 2.66 ± 0.16 0.9250 Table 4. Correction factors (
$N_{\rm{corr}}$ and$G_{\rm{self}}$ ) applied to the measured cross-sections. -
The current study considered the correction factor for the self-attenuation of γ-rays that arises from their interaction with the samples. To determine the correction factor, Eq. (11) was utilized, which takes into account the γ-ray flux passing through a sample with thickness t and density
$ \rm \rho $ , along with the mass attenuation coefficient$\mu_{m}$ .$ G_{\rm{self}} = \frac{\mu_{m} \ \rho \ t}{1-\exp(-\mu_{m} \ \rho \ t)}, $

(11) where
$\mu_{m}$ is determined using data from XMuDat 1.0.1 [24]. The calculated correction factor for γ-ray self-attenuation for nickel and indium samples is provided in Table 4. -
In the present work, the
$ {}^{58}{\rm{Ni}} (n, p){}^{58}{\rm{Co}} $ reaction cross-sections were measured at three different neutron energies: 1.66, 2.06, and 2.66 MeV. The correlation between the detector efficiency and reaction cross-sections for all these three energies was identified using a typical detector setup during the counting process of the irradiated samples. Moreover, the averaged monitor cross-sections for different neutron energies were correlated. The correlation coefficients for averaged monitor cross-sections are listed in Table 6, which were then employed in generating the correlation coefficients between the reaction cross-sections. Besides the counts from the produced spectra, the quantities used to calculate the cross-sections originated from various sources and hence contain considerable definite uncertainty in their values. Consequently, by employing this method, we can effectively incorporate the errors from all sources into the final measured values of the cross-sections. -
The efficiency calibration of the HPGe detector was performed with a
$ {}^{152} {\rm{Eu}} $ standard multi-gamma point source using Eq. (2). Various sources of uncertainty exist in the calibration process, from$C, \ I_{\rm{\gamma}}, \ A_{0}$ , and$ \rm t_{1/2} $ , which propagate as the uncertainty in the detector’s efficiency. Hence, a Taylor series expansion can be used to expand the detetor efficiency as a function of four attributes,$\varepsilon= f(C, \ I_{\rm{\gamma}}, \ A_0, \ t_{1/2})$ :$ \begin{aligned}[b] \left( \frac{\Delta \varepsilon_i}{\varepsilon_i} \right)^2 =& \left( \frac{\Delta C_i}{C_i} \right)^2 + \left( \frac{\Delta I_{\gamma _i}}{I_{\gamma _i}} \right)^2 + \left( \frac{\Delta A_{0 _i}}{A_{0 _i} } \right)^2 \\&+ \left(T \ln 2 \ \frac{\Delta t_{1/2}}{ t_{1/2}^2} \right)^2 ,\end{aligned} $

(12) where the terms are defined as in Reference [25]. The partial uncertainty in the efficiency corresponding to the four different attributes is presented in Table 7. The covariance matrix for detector efficiencies can now be constructed using,
Energy/keV Partial uncertainty ×102 due to attributes Total uncertainty $(\times 10^2) (\sigma_{\varepsilon _{ii} })$ 

r = 1 (C) r = 2 ( $I_{\rm{\gamma} }$ )

r = 3 ( $A_0)$ 

r = 4 ( $t_{1/2}$ )

121.78 0.014241 0.031634 0.069355 0.005832 0.077767 244.70 0.019431 0.015612 0.036231 0.003046 0.044082 443.96 0.025831 0.100342 0.024913 0.002095 0.106587 964.06 0.007420 0.004703 0.011985 0.001008 0.014894 1112.08 0.006998 0.005045 0.010599 0.000891 0.013695 1408.01 0.005156 0.003025 0.008624 0.000725 0.010518 Table 7. Partial uncertainties in the detector efficiency measured from the
${}^{152}{\rm{Eu}} $ point source.$ (V_{\varepsilon})_{ij} = \sum\limits_{r} e_{ir} \ S_{ijr} \ e_{jr} ,$

(13) where
$e_{ir}$ and$e_{jr}$ are the diagonal matrices, whereas$S_{ijr}$ denotes the micro-correlation matrices.$S_{ijr}$ may be expressed as an$(n \times n)$ unity matrix for the uncorrelated and as a square matrix of order$(n \times n)$ with each element set to “1” for the fully correlated case. For partially correlated cases,$S_{ijr}$ can also be an$(n \times n)$ matrix with elements$ 0<S_{ijr}<1 $ . The counts (C) from different γ-ray lines are uncorrelated, as they are independently measured. The γ-ray abundances ($ I_{\gamma} $ ) for each line are also uncorrelated because they are specific to each line. However, the initial activity ($ A_0 $ ) is correlated as it is common to all lines. Moreover, since all lines share the same half-life ($ t_{1/2} $ ) and originate from the same radioactive decay process, they are correlated with respect to their decay behavior.As the γ-rays used in the calculations are different from those used for the efficiency calculations, the detector efficiencies for
$ {}^{58}{\rm{Co}} $ ($E_{\rm{\gamma}}$ = 810.759 keV) and$ {}^{115{\rm{m}}}{\rm{In}} $ ($E_{\rm{\gamma}}$ = 336.241 keV) were calculated using the model interpolation [25],$ \ln \varepsilon_i = \sum\limits_{m} p_m \ (\ln E_i)^{m-1} , $

(14) where
$ \rm \varepsilon_i $ represents the efficiencies,$p_m$ is the fitting parameter of order m, and$E_i$ denotes the corresponding γ-ray energies. A linear model, Z = AP, may be used to solve Eq. (14). The column matrix of Z is determined by$z_i = \ln \varepsilon_i$ , A is a design matrix whose elements are deduced from$A_{il}=(\ln E_i)^{l-1}$ , and P is the matrix whose elements are determined as$p_m$ using the method of least squares. The solution parameters were derived using the covariance matrix$ V_p = (A' \ V_{z}^{-1} \ A)^{-1} $ in Eq. (15).$ \hat{P} = V_{\hat{P}} \ (A' \ V_z^{-1} \ Z), $

(15) where matrix
$V_z$ can be calculated by using the following equation:$ (V_{z})_{ij} = \frac{(V_{\varepsilon})_{ij}}{\langle\epsilon_{i}\rangle \langle\epsilon_{j}\rangle}. $

(16) In the final step, the goodness of fit is calculated using Eq. (17),
$ \chi_{m}^{2} = (Z-AP)' \ V_{z}^{-1} \ (Z-AP). $

(17) In these calculations, Eq. (15) was used to obtain the elements P = (−4.6605, −0.9901, 0.1850, 0.4329, 0.1486) and the corresponding
$ \rm \chi^2 = $ 1.51. -
By using Eqs. (3) and (4), we can redefine Eq. (4) for the present reaction parameter (r) and the monitor reaction parameter (m) as the ratio measure technique [23] for the covariance analysis in activation cross-section measurement.
$ \langle\sigma_{r}\rangle \ = \langle\sigma_{m}\rangle \frac{C_{r} \ I_{\gamma m} \ \varepsilon_{m} \ f_{\lambda m}}{C_{m} \ I_{\gamma r} \ \varepsilon_{r} \ f_{\lambda r }}, $

(18) with the time factor f defined as
$ f = \frac{(1-{\rm e}^{-\lambda t_{i}})(1-{\rm e}^{-\lambda t_{c}})({\rm e}^{-\lambda t_{w}})}{\lambda}. $

(19) The quadratic sum formula may be used to determine the uncertainty related to each attribute in Eq. (18). The attribute f contains five sources of uncertainty (
$ t_{i},\ t_{c},\ t_{w}, \lambda_{r} $ , and$ \lambda_{m} $ ) out of all the attributes in Eq. (18). Here, the uncertainty in the decay constants ($ \lambda_{r} $ and$ \lambda_{m} $ ) is related to the cross-section via the exponential function. Consequently, the uncertainty in decay constants (in terms of time factors) is defined as$ \left(\frac{\Delta f}{f}\right)^{2} = s_{f \lambda}^{2} \left(\frac{\Delta \lambda}{\lambda}\right)^{2}, $

(20) where
$\Delta \lambda = (\ln2 \ \Delta T_{1/2} \ / \ T_{1/2}^2)$ . Therefore, the relative sensitivity can be defined as$ s_{f \lambda} = \left(\frac{\lambda \ t_{i} \ {\rm e}^{-\lambda ti}}{1-{\rm e}^{-\lambda ti}}- \lambda \ t_{w} + \frac{\lambda \ t_{c} \ {\rm e}^{-\lambda t_{c}}}{1-{\rm e}^{-\lambda t_{c}}} -1 \right). $

(21) All possible fractional uncertainties associated with various parameters in the measurement of the
$ {}^{58}{\rm{Ni}} (n, p){}^{58}{\rm{Co}} $ reaction cross-section were propagated to calculate the total uncertainty in the cross-section, which is presented in Table 8. The primary source of uncertainty is statistical uncertainty ($C_{m}$ ,$C_{r}$ ), which arises from the inherent statistical variations in the measurements. Additionally, significant contributions originate from uncertainties in efficiency ($ \varepsilon_{m} $ ,$ \varepsilon_{r} $ ) and the reference monitor cross-section ($ \sigma_{m} $ ). However, timing factors ($ f_{\lambda m} $ ,$ f_{\lambda r} $ ), atomic masses ($ A_{m} $ ,$ A_{r} $ ), and isotopic abundances ($ a_{m} $ ,$ a_{r} $ ) have negligible effects on the total uncertainty. The final correlation matrix for the$ {}^{58}{\rm{Ni}} (n, p){}^{58}{\rm{Co}} $ reaction cross-section is presented in Table 9.Parameters $\langle E_{n} \rangle$ = 2.66 MeV

$\langle E_{n} \rangle$ = 2.06 MeV

$\langle E_{n} \rangle$ = 1.66 MeV

$ C_m $ 

2.1762 2.423 1.6914 $ C_r $ 

1.4271 3.0731 2.6481 $ I_{\gamma m} $ 

0.2179 0.2179 0.2179 $ I_{\gamma r} $ 

0.0101 0.0101 0.0101 $ \varepsilon_m $ 

1.5812 1.5812 1.5812 $ \varepsilon_r $ 

1.4907 1.4907 1.4907 $ f_{\lambda m} $ 

0.0813 0.0855 0.077 $ f_{\lambda r} $ 

0.0846 0.0844 0.0846 $ a_{m} $ 

0.0522 0.0522 0.0522 $ a_{r} $ 

0.0734 0.0734 0.0734 $ W_{m} $ 

0.1064 0.1065 0.1101 $ W_{r} $ 

0.0362 0.0324 0.0405 $ \sigma_{m} $ 

2.57 2.63 2.83 Cumulative uncertainty (%) 4.26 5.20 4.76 Table 8. Fractional uncertainty (%) associated with all possible parameters in the measurement of
$ {}^{58}{\rm{Ni}} (n, p){}^{58}{\rm{Co}} $ reaction cross-section.$\langle E_{\rm{n} } \rangle$ /MeV

Cross-section $ \rm \langle \sigma_{r} \rangle $ /mb

Correlation matrix 2.66 ± 0.16 167.38 ± 7.13 1.0000 2.06 ± 0.14 58.36 ± 3.03 0.2161 1.0000 1.66 ± 0.14 19.12 ± 0.91 0.2359 0.1935 1.0000 Table 9. Measured
$ {}^{58}{\rm{Ni}} (n, p){}^{58}{\rm{Co}} $ reaction cross-sections along with total uncertainties and a correlation matrix. -
The standard nuclear reaction model code TALYS-1.96 [8] was used to simulate the reaction cross-section of
$ {}^{58}{\rm{Ni}} (n, p){}^{58}{\rm{Co}} $ . The code can calculate the cross-section as a function of the incident particle energies up to 200 MeV, while taking into account the effects of level density parameters and several reaction processes, including direct reaction, pre-equilibrium emission, and compound nucleus. The present calculations utilized the pre-defined local optical model potential parameters described by Koning and Delaroche [26]. The Hauser-Feshbach model was used to account for the compound reaction mechanism [27]. The exciton model developed by Kalbach was used to incorporate the pre-equilibrium contribution [28].For a given projectile + target system, the TALYS-1.96 code includes all possible outgoing reaction channels. For the reproduction of nuclear reaction cross-sections in present study, six-level density models (LD models) incorporated in the code were utilized. The various level densities in the TALYS code (LD 1–6) account for:
1) The constant temperature Fermi gas model (CTFGM) [29];
2) Back-shifted Fermi gas model (BSFGM) [30];
3) Generalized super-fluid model (GSFM) [31, 32];
4), 5) Microscopic level densities from Goriely’s and Hilaire’s tables [33];
6) Microscopic level densities (temperature dependent HFB, Gogny force)[34].
Each LD model was utilized and evaluated to provide a more accurate representation of the measured results.
-
To calculate the nuclear level densities (NLDs), the spectral distribution method (SDM) [35−40] was employed by utilizing a shell-model Hamiltonian that incorporates a realistic residual interaction. The SDM is widely used in nuclear physics to gain insights into the structure and behaviour of atomic nuclei in various fields, such as nuclear astrophysics, nuclear energy, and nuclear medicine. This involves determining the energy levels of the nucleus, analyzing the resulting energy spectrum, and applying statistical methods to obtain a smooth function that describes the NLDs as a function of energy. The NLD basically gives the total number of nuclear states in a given nucleus at a specific excitation energy. Various methods can be used to calculate the NLDs, from simple phenomenological models based on noninteracting degenerate Fermi gas [29, 30] to more complex mean-field descriptions [33]. However, in the shell model, the configuration mixing through the residual interaction naturally accounts for the collective excitations. In the present work, the realistic NLDs for the
${}^{58}{\rm{Ni}} $ and other nuclei involved in the reaction and population of the radionuclides in different channels were obtained by employing the SDM followed by an appropriate parity equilibration scheme for the pf -model space [41, 42] to calculate the$ ^{58}{\rm{Ni}}(n, p)^{58}{\rm{Co}} $ reaction cross-sections. -
The reaction cross-sections for the
$ {}^{58}{\rm{Ni}} (n, p){}^{58}{\rm{Co}} $ reaction were measured using quasi-monoenergetic neutrons produced from the$ ^{7}{\rm{Li}}(p, n) $ reaction at neutron spectrum average energies of 1.66$ \pm $ 0.14, 2.06$ \pm $ 0.14, and 2.66$ \pm $ 0.16 MeV. The present measurements were performed using the off-line γ-ray spectrometric technique followed by neutron activation analysis. The neutron flux was calculated using the reference monitor reaction cross-section for$ {}^{115}{\rm{In}} (n, n'){}^{115{\rm m}}{\rm{In}} $ from IRDFF-II. The reported cross-sections are important for estimating the radiation damage to surrounding structural and cladding materials as well as for the evaluation of hydrogen production. The uncertainties from various attributes were propagated into the measured cross-sections using the ratio method of covariance technique. The overall uncertainty in the measured cross-section data was found to be less than 6%. The present measured reaction cross-sections with their uncertainties calculated using the covariance analysis are listed in Table 9. The present results were compared with the existing experimental data and with the theoretical results using the nuclear reaction code TALYS, as shown in Fig. 5. The results of the evaluated data libraries, such as ENDF/B-VIII.0, JEFF-3.3, JENDL-4.0, and CENDL-3.2, were also compared with the present measured data along with the literature data, as shown in Fig. 6. In general, the measured data were found in good agreement with the evaluated data, theoretical model predictions, and existing data in literature.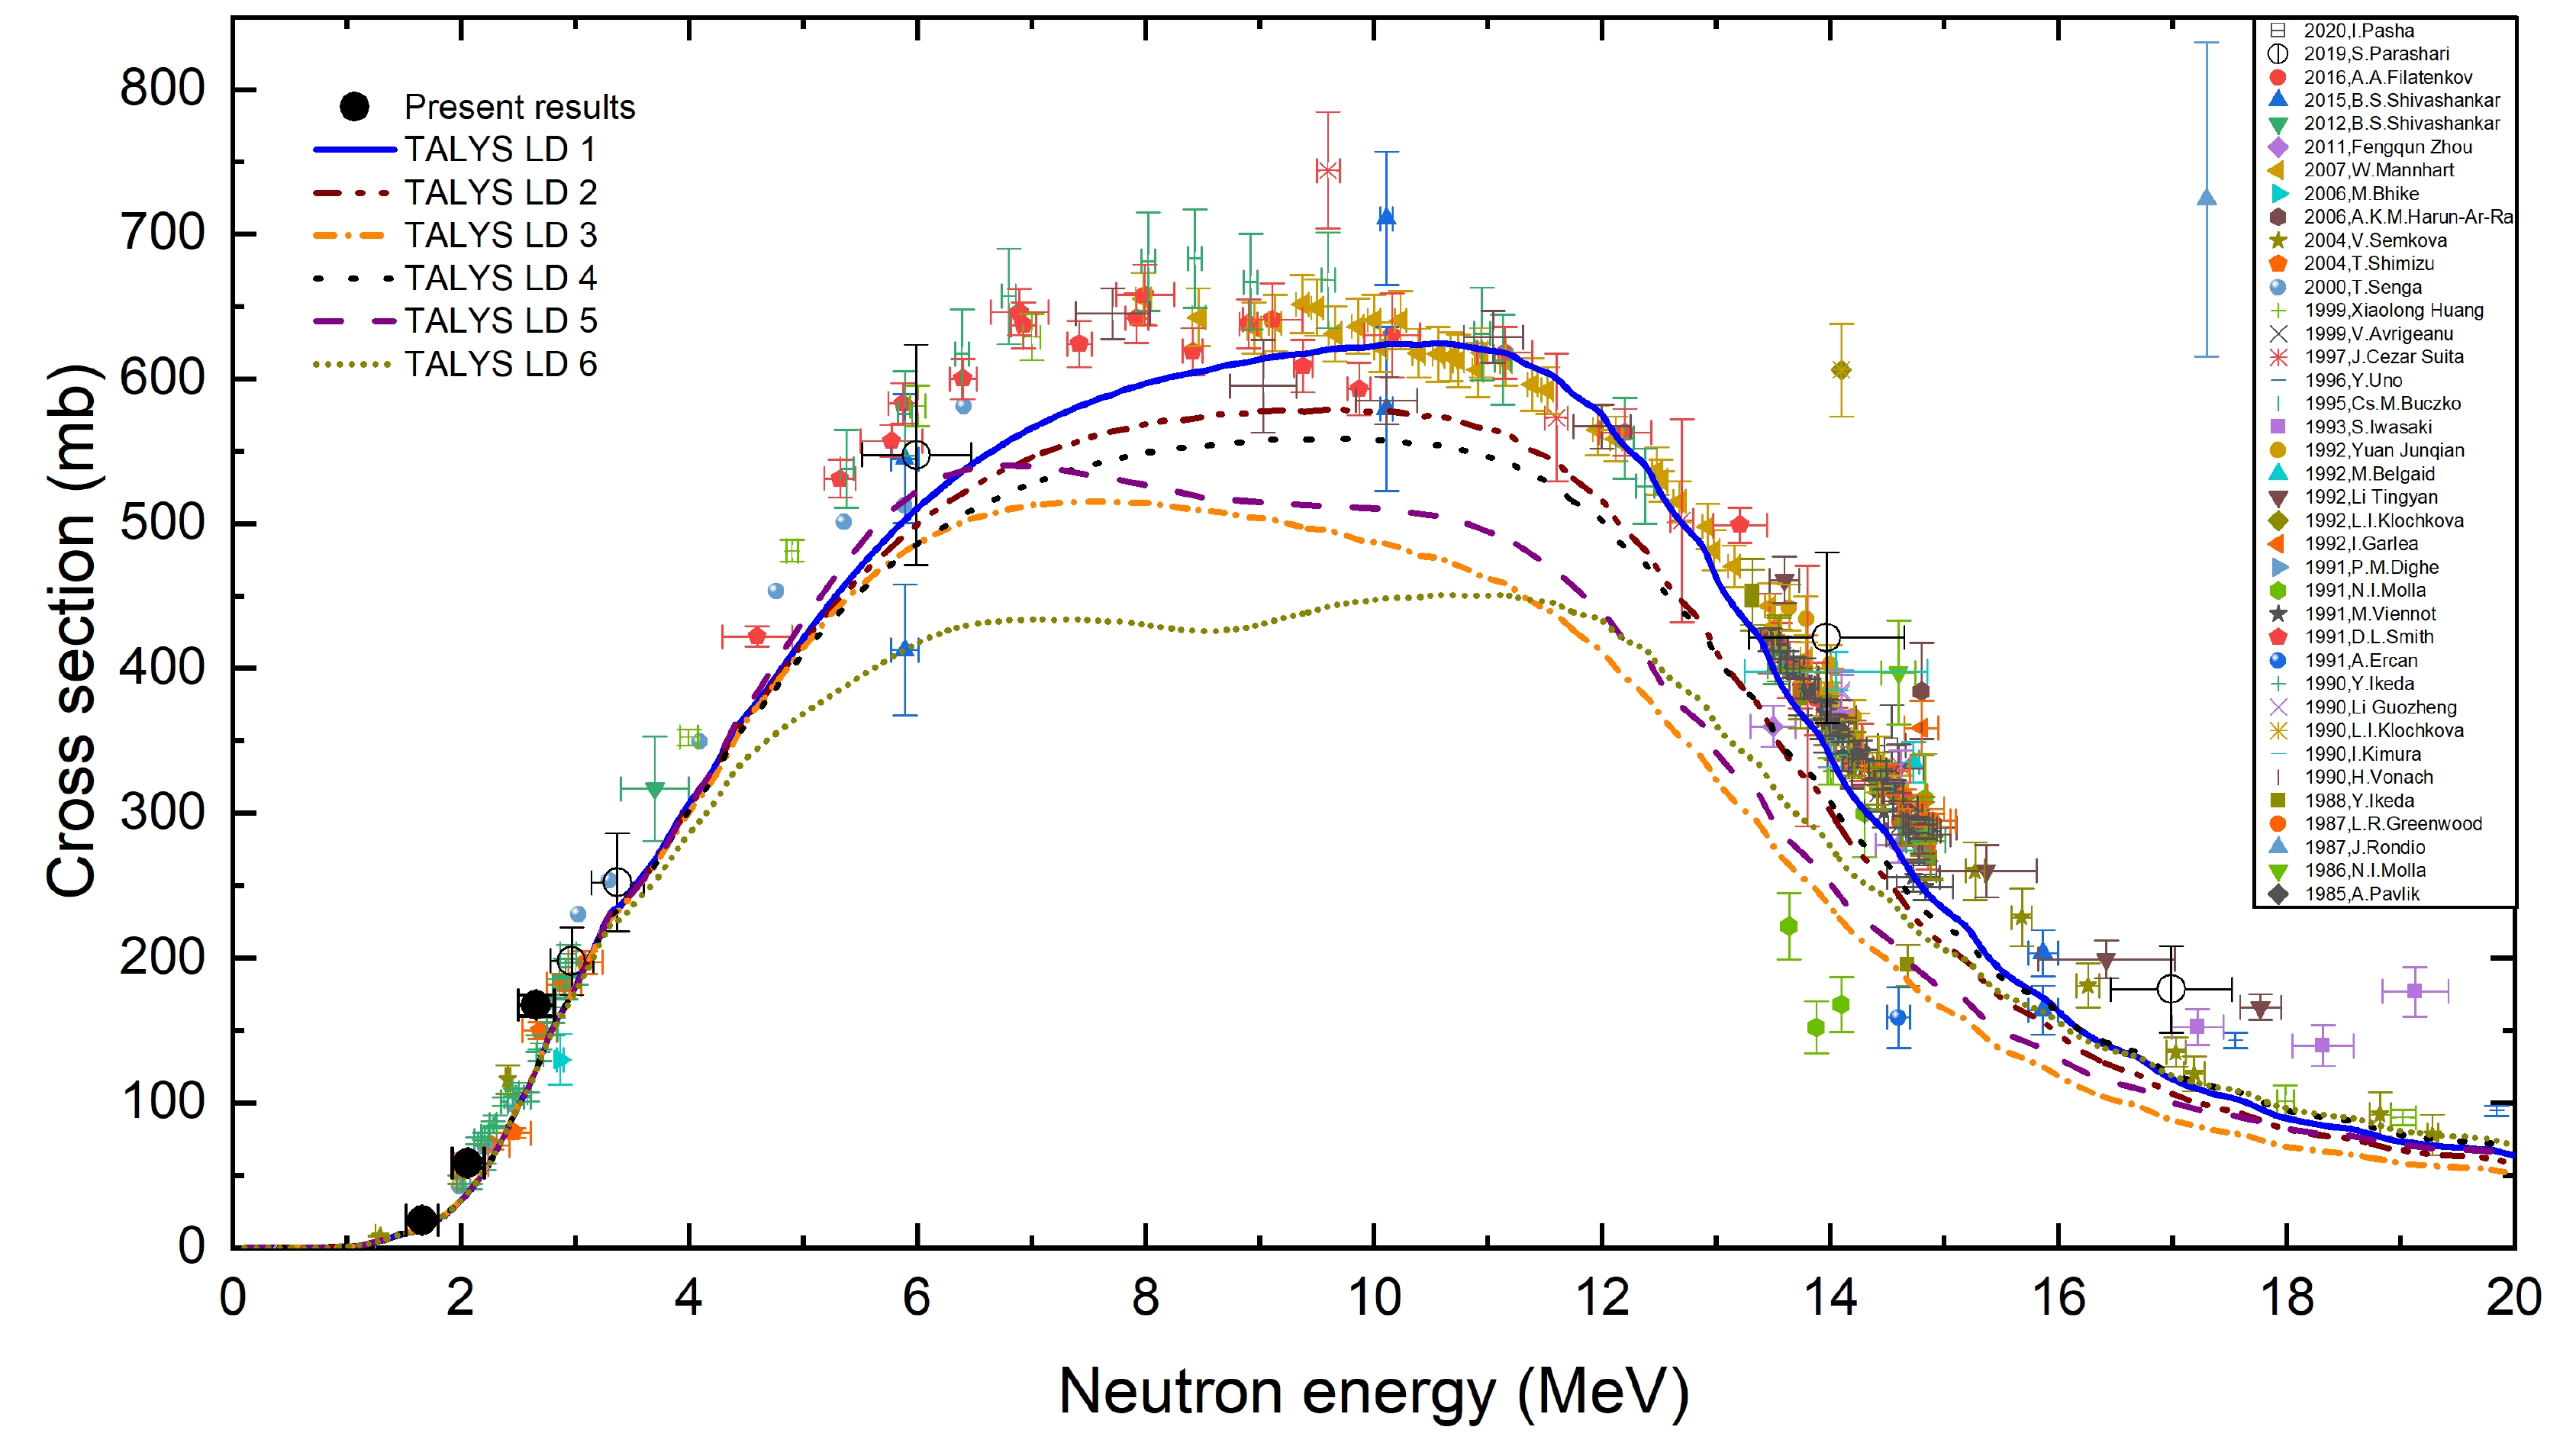
Figure 5. (color online) Experimentally measured
$ {}^{58}{\rm{Ni}} (n, p){}^{58}{\rm{Co}} $ reaction cross-sections compared with the existing literature data and various level density models available in the TALYS code [8].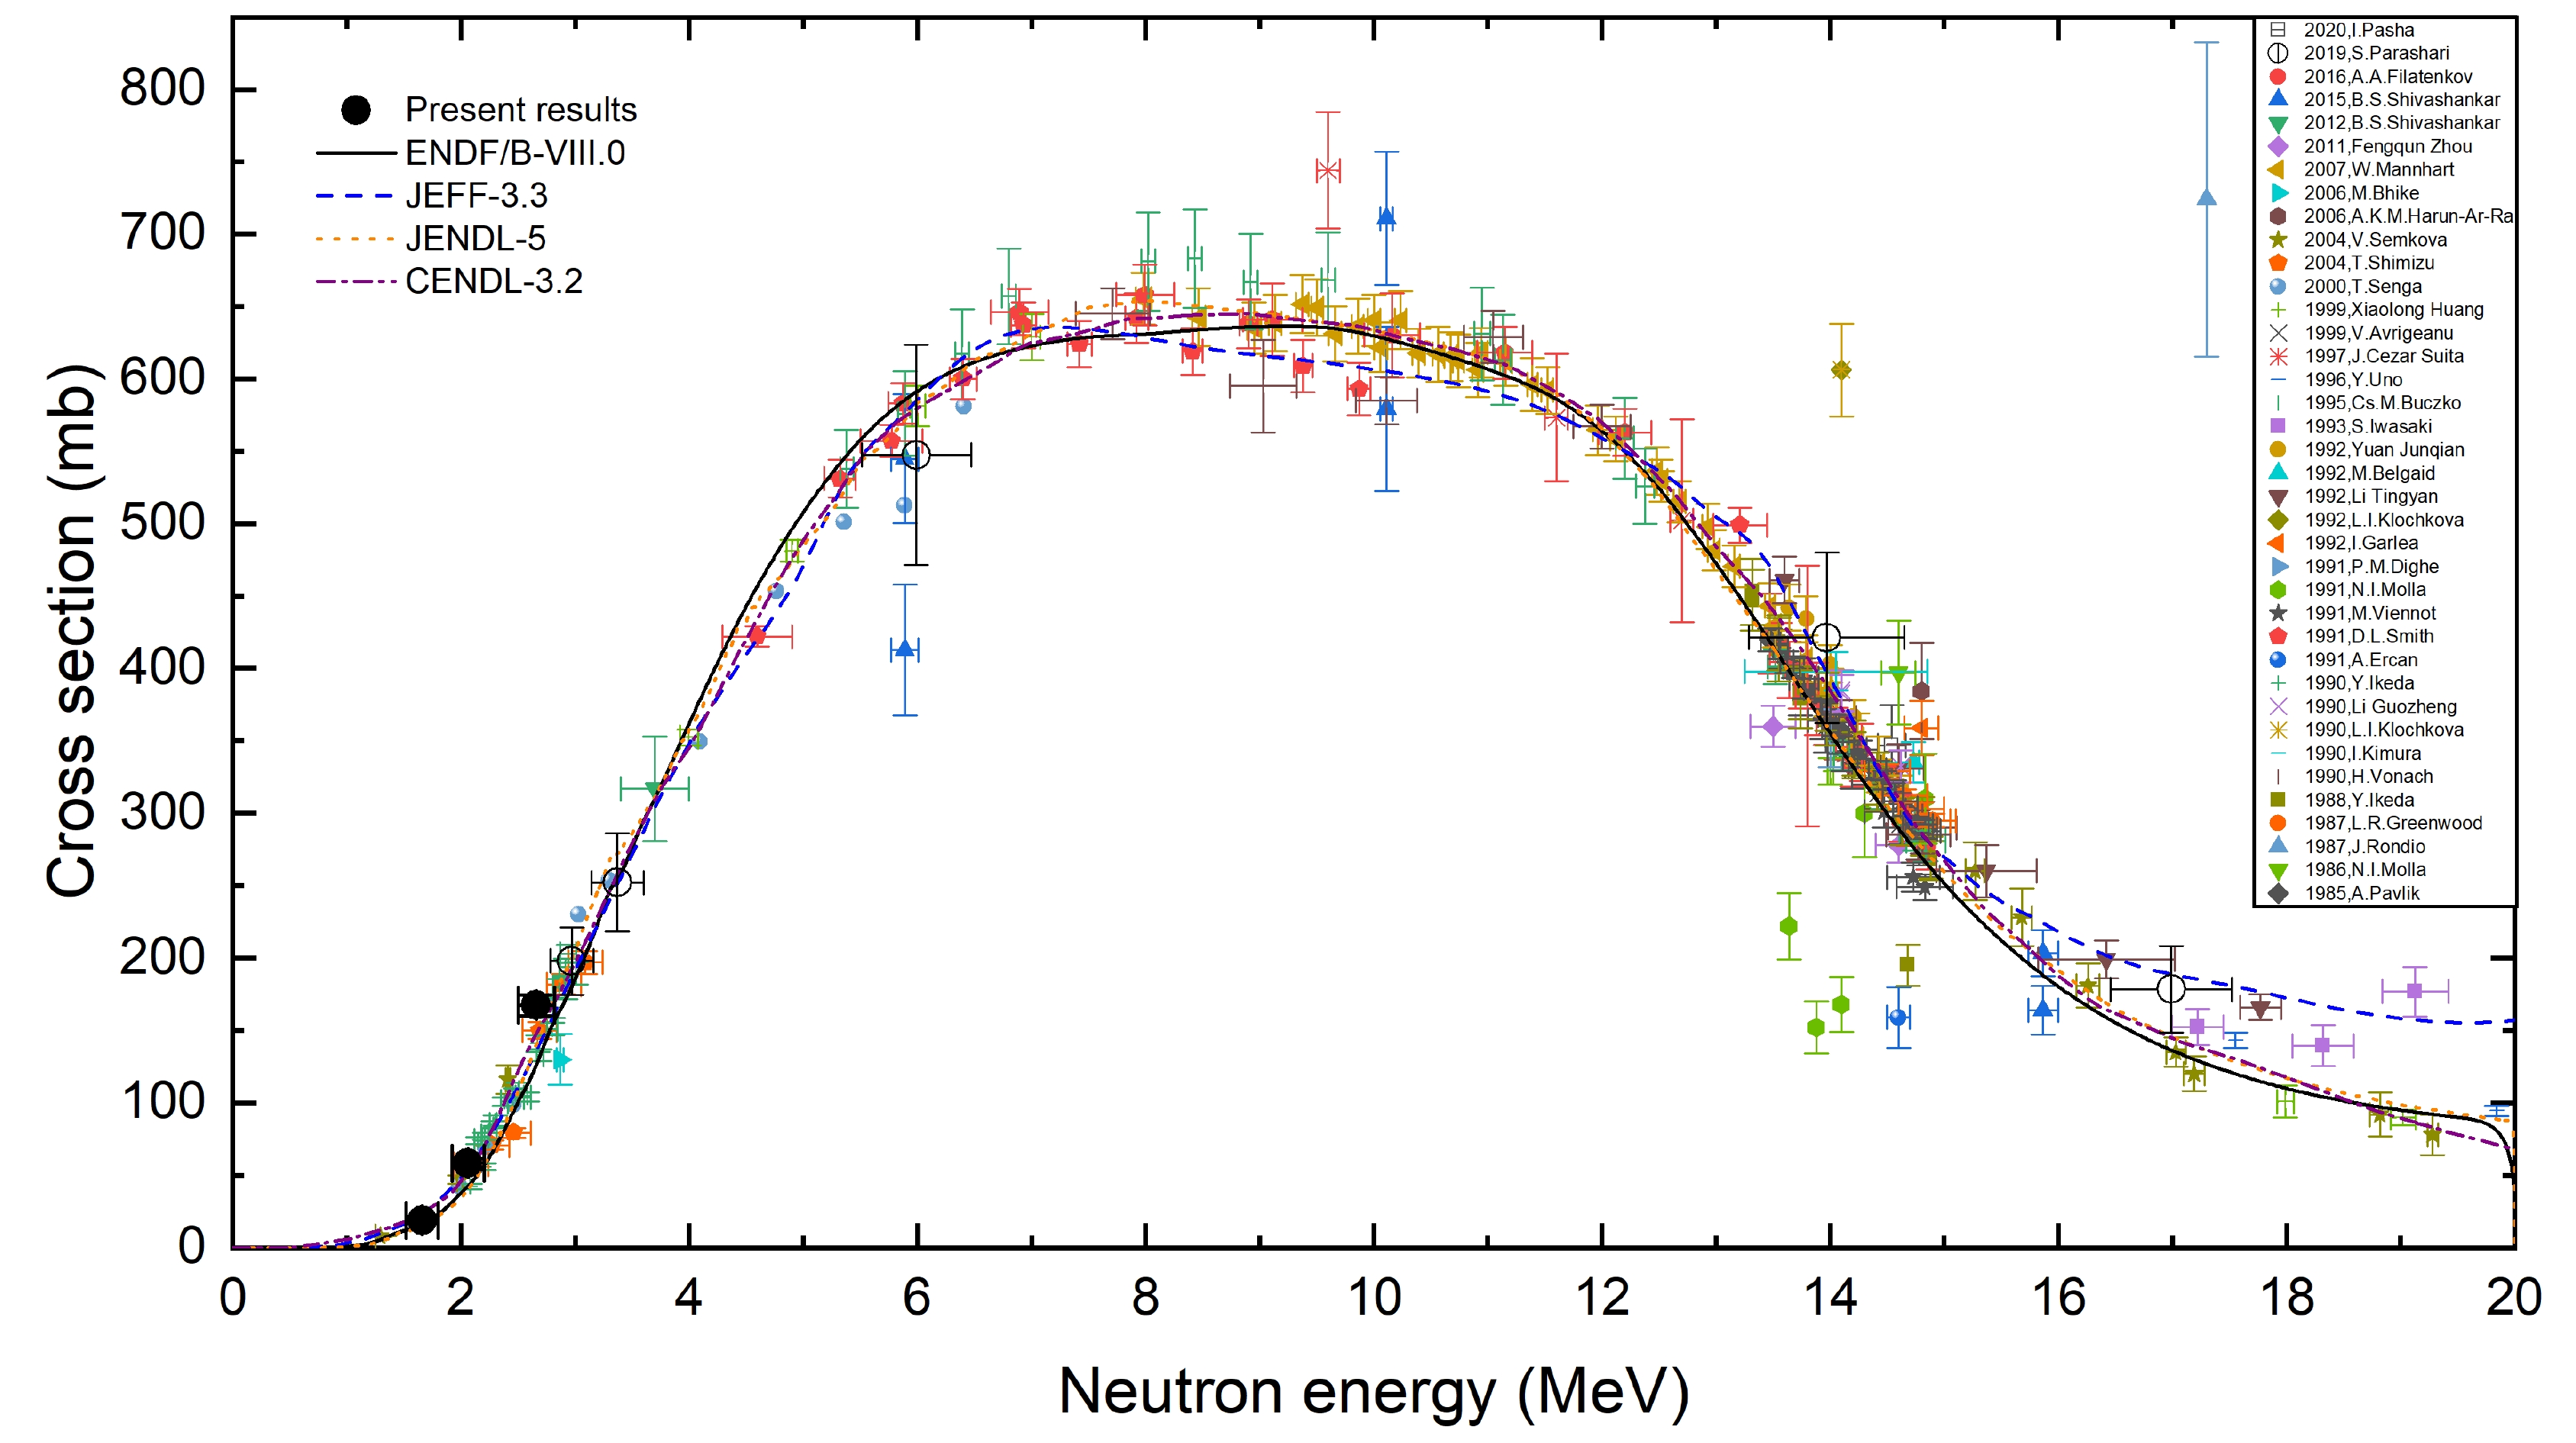
The experimentally measured
$ {}^{58}{\rm{Ni}} (n, p){}^{58}{\rm{Co}} $ reaction cross-sections were also compared with the theoretical values obtained using the SDM, as shown in Fig. 7. The SDM predictions are in consensus with the experimental data except for the low-energy region, where the cross-section is underestimated because the collective excitations are naturally incorporated by the configuration mixing through the residual interaction. For the NLDs from different models as available in the TALYS, the collective effects are included through the vibrational and rotational enhancement factors, and their NLDs are further normalized at low energies with neutron resonance data [41].
Figure 3. (color online) Typical produced γ-ray spectra for (a)
$ {}^{58}{\rm{Ni}} (n, p){}^{58}{\rm{Co}} $ and (b)$ {}^{115}{\rm{In}} (n, n'){}^{115{\rm m}}{\rm{In}} $ . -
The comparison of experimental conditions and different corrections for some recent
$ {}^{58}{\rm {Ni}} (n, p){}^{58}{\rm{Co}} $ reaction cross-section is summarized in Table 10. Most of the recent measurements are reported without a detailed covariance analysis. The need for covariance data generation in the context of calculating uncertainties for nuclear power safety has been emphasized by the nuclear data community. However, many older experiments do not contain the data needed to produce covariance. Therefore, the present measurements are reported with detailed uncertainty analysis using the covariance technique. The measured cross-sections are also corrected for coincidence summing, low energy background neutrons, and self attenuation for γ-rays.Author
(Year)Neutron
sourceFlux monitor
reactionThreshold
energy
/MeVNeutron
energy
/MeVCovariance Corrections Reference Coincidence
summingLow-energy
background
neutronsSelf-attenuation
for γ-raysHingu et al. (2023) $ ^{7}{\rm{Li}}(p, n) $ 

$ {}^{115}{\rm{In}} (n, n'){}^{115{\rm m}}{\rm{In}} $ 

0 1.66, 2.06 and 2.66 yes yes yes yes Present work Pasha et al. (2020) $ ^{3}{\rm H}(d,n)^{4}{\rm{He}} $ 

$ ^{197}{\rm{Au}}(n,2n)^{196}{\rm{Au}} $ 

0 14.54 yes yes yes yes [43] Parashari et al. (2019) $ ^{7}{\rm{Li}}(p, n) $ 

$ {}^{115}{\rm{In}} (n, n'){}^{115{\rm m}}{\rm{In}} $ 

0 5.99, 13.97 and 16.99 yes yes yes no [44] $ ^{197}{\rm{Au}}(n, \gamma)^{198}{\rm{Au}} $ 

0 2.97 and 3.37 yes yes yes no Filatenkov et al. (2016) $ ^{3}{\rm H}(d,n)^{4}{\rm{He}} $ 

$ ^{93}{\rm{Nb}}(n, 2n)^{92{\rm m}}{\rm{Nb}} $ 

8.93 13.47 – 14.86 no yes yes yes [45] Shivashankar et al. (2015) $ ^{7}{\rm{Li}}(p, n) $ 

$^{232}{\rm{Th} }(n,f)^{97}{\rm{Zr} }\; {\rm{and} }$ 

0 5.89, 10.11, and 15.87 yes no yes no [25] $ ^{238}{\rm{U}}(n,f)^{97}{\rm{Zr}} $ 

Shivashankar et al. (2012) $ ^{7}{\rm Li}(p, n) $ 

${}^{115}{\rm In} (n, n^{'}){}^{\rm 115m}{\rm In}$ 

0 3.7 no no no no [46] Zhou et al. (2011) $ ^{3}{\rm H}(d,n)^{4}{\rm He} $ 

$ ^{27}{\rm Al}(n,\alpha)^{24}{\rm Na} $ 

3.25 around 14 no yes no yes [47] Mannhart et al. (2007) D-D fusion $ ^{27}{\rm Al}(n,\alpha)^{24}{\rm Na} $ and

3.25 and 7.98 – 14.42 yes no yes yes [48] $ ^{238}{\rm U}(n,f)^{97}{\rm Zr} $ 

0 Harun-Ar-Rashid et al. (2006) $ ^{3}{\rm H}(d,n)^{4}{\rm He} $ 

$ ^{27}{\rm Al}(n,\alpha)^{24}{\rm Na} $ 

3.25 14.8 no no no no [49] Bhike et al. (2006) $ ^{7}{\rm Li}(p, n) $ 

$ ^{197}{\rm Au} (n, \gamma)^{198}{\rm Au} $ 

0 2.87 no no no no [50] Semkova et al. (2004) $ ^{3}{\rm H}(d,n)^{4}{\rm He} $ 

$ ^{27}{\rm Al}(n,\alpha)^{24}{\rm Na} $ 

3.25 1.29 – 20.34 no yes yes yes [3] Shimizu et al. (2004) D-D fusion ${}^{115}{\rm In} (n, n^{'}){}^{\rm 115m}{\rm In}$ 

0 2.09 – 3.09 no yes yes yes [51] Senga et al. (2000) D-D fusion ${}^{115}{\rm In} (n, n^{'}){}^{\rm 115m}{\rm In}$ 

0 1.99 – 6.41 no no no no [52] Table 10. Comparison of experimental conditions and different corrections for some of the recent
$ {}^{58}{\rm{Ni}} (n, p){}^{58}{\rm{Co}} $ reaction cross-sections [7]. -
The neutron activation analysis followed by an off-line γ-ray spectrometric technique was used for the production cross-section of
$ {}^{58}{\rm{Co}} $ using quasi-monoenergetic neutrons from the$ ^{7}{\rm{Li}}(p, n) $ reaction. The measured cross-sections were normalized with respect to the reference monitor reaction cross-section$ {}^{115}{\rm{In}} (n, n'){}^{115{\rm m}}{\rm{In}} $ from IRDFF-II. The uncertainties and correlations among the measured cross-sections were calculated in detail using covariance analysis. The measured data were generally found to be consistent with the results of previously published experimental data, evaluated data libraries such as ENDF/B-VIII.0, JEFF-3.3, JENDL-4.0, and CENDL-3.2, and theoretical calculations carried out using the nuclear reaction code TALYS. To provide a more accurate representation of the measured results, the effects of different level density models available in the TALYS code were evaluated. It is recommended to use the error propagation method to determine the correlations between the monitor reaction cross-sections because these cross-sections can lead to significant uncertainty in the measured data. The current work is crucial for the development of medical accelerator and nuclear reactor technologies as well as for dose estimation of the medical isotope$ {}^{58}{\rm{Co}} $ . -
We sincerely thank the FOTIA facility staff for their exceptional management and operation of the accelerator.
Investigation of 58Ni (n, p)58Co reaction cross-section with covariance analysis
- Received Date: 2023-07-20
- Available Online: 2024-02-15
Abstract: The excitation function of the


 DownLoad: