-
Photonuclear reactions play an important role in basic and applied nuclear physics research [1−4]. The development of both nuclear physics research and applications based on photonuclear reactions is closely related to the development of attendant photon sources and measuring instruments. Photoneutron reactions on isotopes of a natural mixture of selenium have been well studied using bremsstrahlung γ-radiation [5−14], positron annihilation in flight [15], and Compton backscattering of laser beam photons [16−20]. Cross sections of photonuclear reactions on selenium isotopes in the region of giant dipole resonance (GDR) energy have been measured in several studies. In [5], on bremsstrahlung, the cross section for reactions σ(γ, n) on all isotopes of natural selenium were measured up to an energy of 25 MeV. In [6], the same method was used to measure the cross sections for the reactions 78Se(γ, n)77mSe, 80Se(γ, n)79mSe, and 82Se(γ, n)81mSe. In [16−20], on a beam of quasi-monoenergetic photons obtained as a result of Compton backscattering, the cross sections for reactions σ(γ, n) were measured in the energy range from the threshold to 14.6 MeV on 76,77,78,80Se isotopes. In [15], on a beam of quasi-monoenergetic photons, the reaction cross section σ(γ, 2n) and the sum of the reaction cross sections σ(γ, n) + σ(γ, 1n1p) were measured in the energy range from the threshold to 30 MeV on 76,78,80,82Se isotopes.
Experimental data on the cross sections of photoproton reactions on selenium isotopes are not available in the literature. With the exception of our previous works [13, 14], wherein multiparticle reactions on natural selenium were studied using end-point energies ranging from 20 to 80 MeV, all other previous studies investigated only photoneutron reactions on the stable isotopes of selenium. Thus, to obtain more information regarding reactions with a higher degree of complexity, this study investigated photonucleon emission reactions on natural selenium target nuclei, expressed as natSe(γ, 1n) and natSe(γ, 1p), using bremsstrahlung end-point energies of 10 to 23 MeV.
Photonuclear reactions are the main mechanism behind the formation of bypassed nuclei in the process of nucleosynthesis. The abundance of the lightest p-nucleus 74Se can be described satisfactorily [21]. One of the aims of this work was to measure the relative yields of reactions on mixtures of natural isotopes of selenium that result in the formation and decay of 74Se. The experimentally obtained results were compared with the results of calculations based on TALYS-1.96 [22] with the standart parameters and the combined model of photonucleon reactions (CMPR) [23]. In addition, photoproton reaction products are potential medical isotopes, namely, 76As [24] and 77As [25, 26]; this means that studying the reaction cross sections is useful for both research and application purposes.
-
This work was performed with the output electron beam of the MT-25 microtron [27]. The electron energies were in range of 10−23 MeV with an energy step of 1 MeV. To produce gamma radiation, a radiator target made of tungsten, which is a common convertor material, was used. The tungsten target was sufficiently thick (3 mm) to maximize the number of photons in the energy range of the GDR that dominates the photonuclear cross section from the nucleon separation threshold to 20–30 MeV. To remove the remaining electrons from the bremsstrahlung beam, a 30 mm thick aluminum absorber was placed behind the tungsten converter [28]. The target of natural selenium was at a distance of 1 cm from the converter.
In the experiments, natural selenium samples in metallic form were irradiated with a flux of bremsstrahlung, which was formed in the tungsten converter. The changes in beam current were measured using a calibrated ionization chamber in the beam and a Faraday cup and recorded in a web-accessible database for use during the analysis employing an analog-to-digital converter card and LabView software. In addition to the ionization chamber and Faraday cup, the electrical charge collected on the target was digitized and used to measure the beam current. The main parameters of the experiments are listed in Table 1. After irradiation, when the radiation levels in the experimental hall became safe, the targets were transferred to a separate measuring room, where the induced activity in the irradiated target was measured. We used a high purity germanium (HPGe) γ-detector with resolution of 16 keV at 1332 keV in combination with standard measurement electronics and a 16K ADC/MCA (Multiport II Multichannel Analyzer, CANBERRA). The energy and efficiency calibrations of the HPGe detector were carried out using standard gamma-ray sources. The procedure for gamma-activation measurements used in this work is described in detail in [28−30].
Energy of
electrons/MeVMass of selenium
target/mgElectron beam
pulse current/μAIntegral number of electrons incident
on the tungsten converter (×1016)Irradiation
time/min10 722.66 19 42.75 ± 4.28 60 11 693.02 10 45.0 ± 4.5 120 12 707.09 10.5 47.25 ± 4.72 120 13 741.20 10 22.5 ± 2.25 60 14 682.06 10 11.25 ± 1.12 30 15 712.51 10 4.875 ± 0.487 13 16 702.77 10 1.875 ± 0.187 5 17 233.48 5 1.875 ± 0.187 10 18 117.83 5 1.875 ± 0.187 10 19 89.26 5 1.875 ± 0.187 10 20 78.35 3 2.25 ± 0.225 20 21 78.36 3 2.25 ± 0.225 20 22 73.48 5 1.875 ± 0.187 10 23 70.22 5 1.875 ± 0.187 10 Table 1. Main parameters of the experiments.
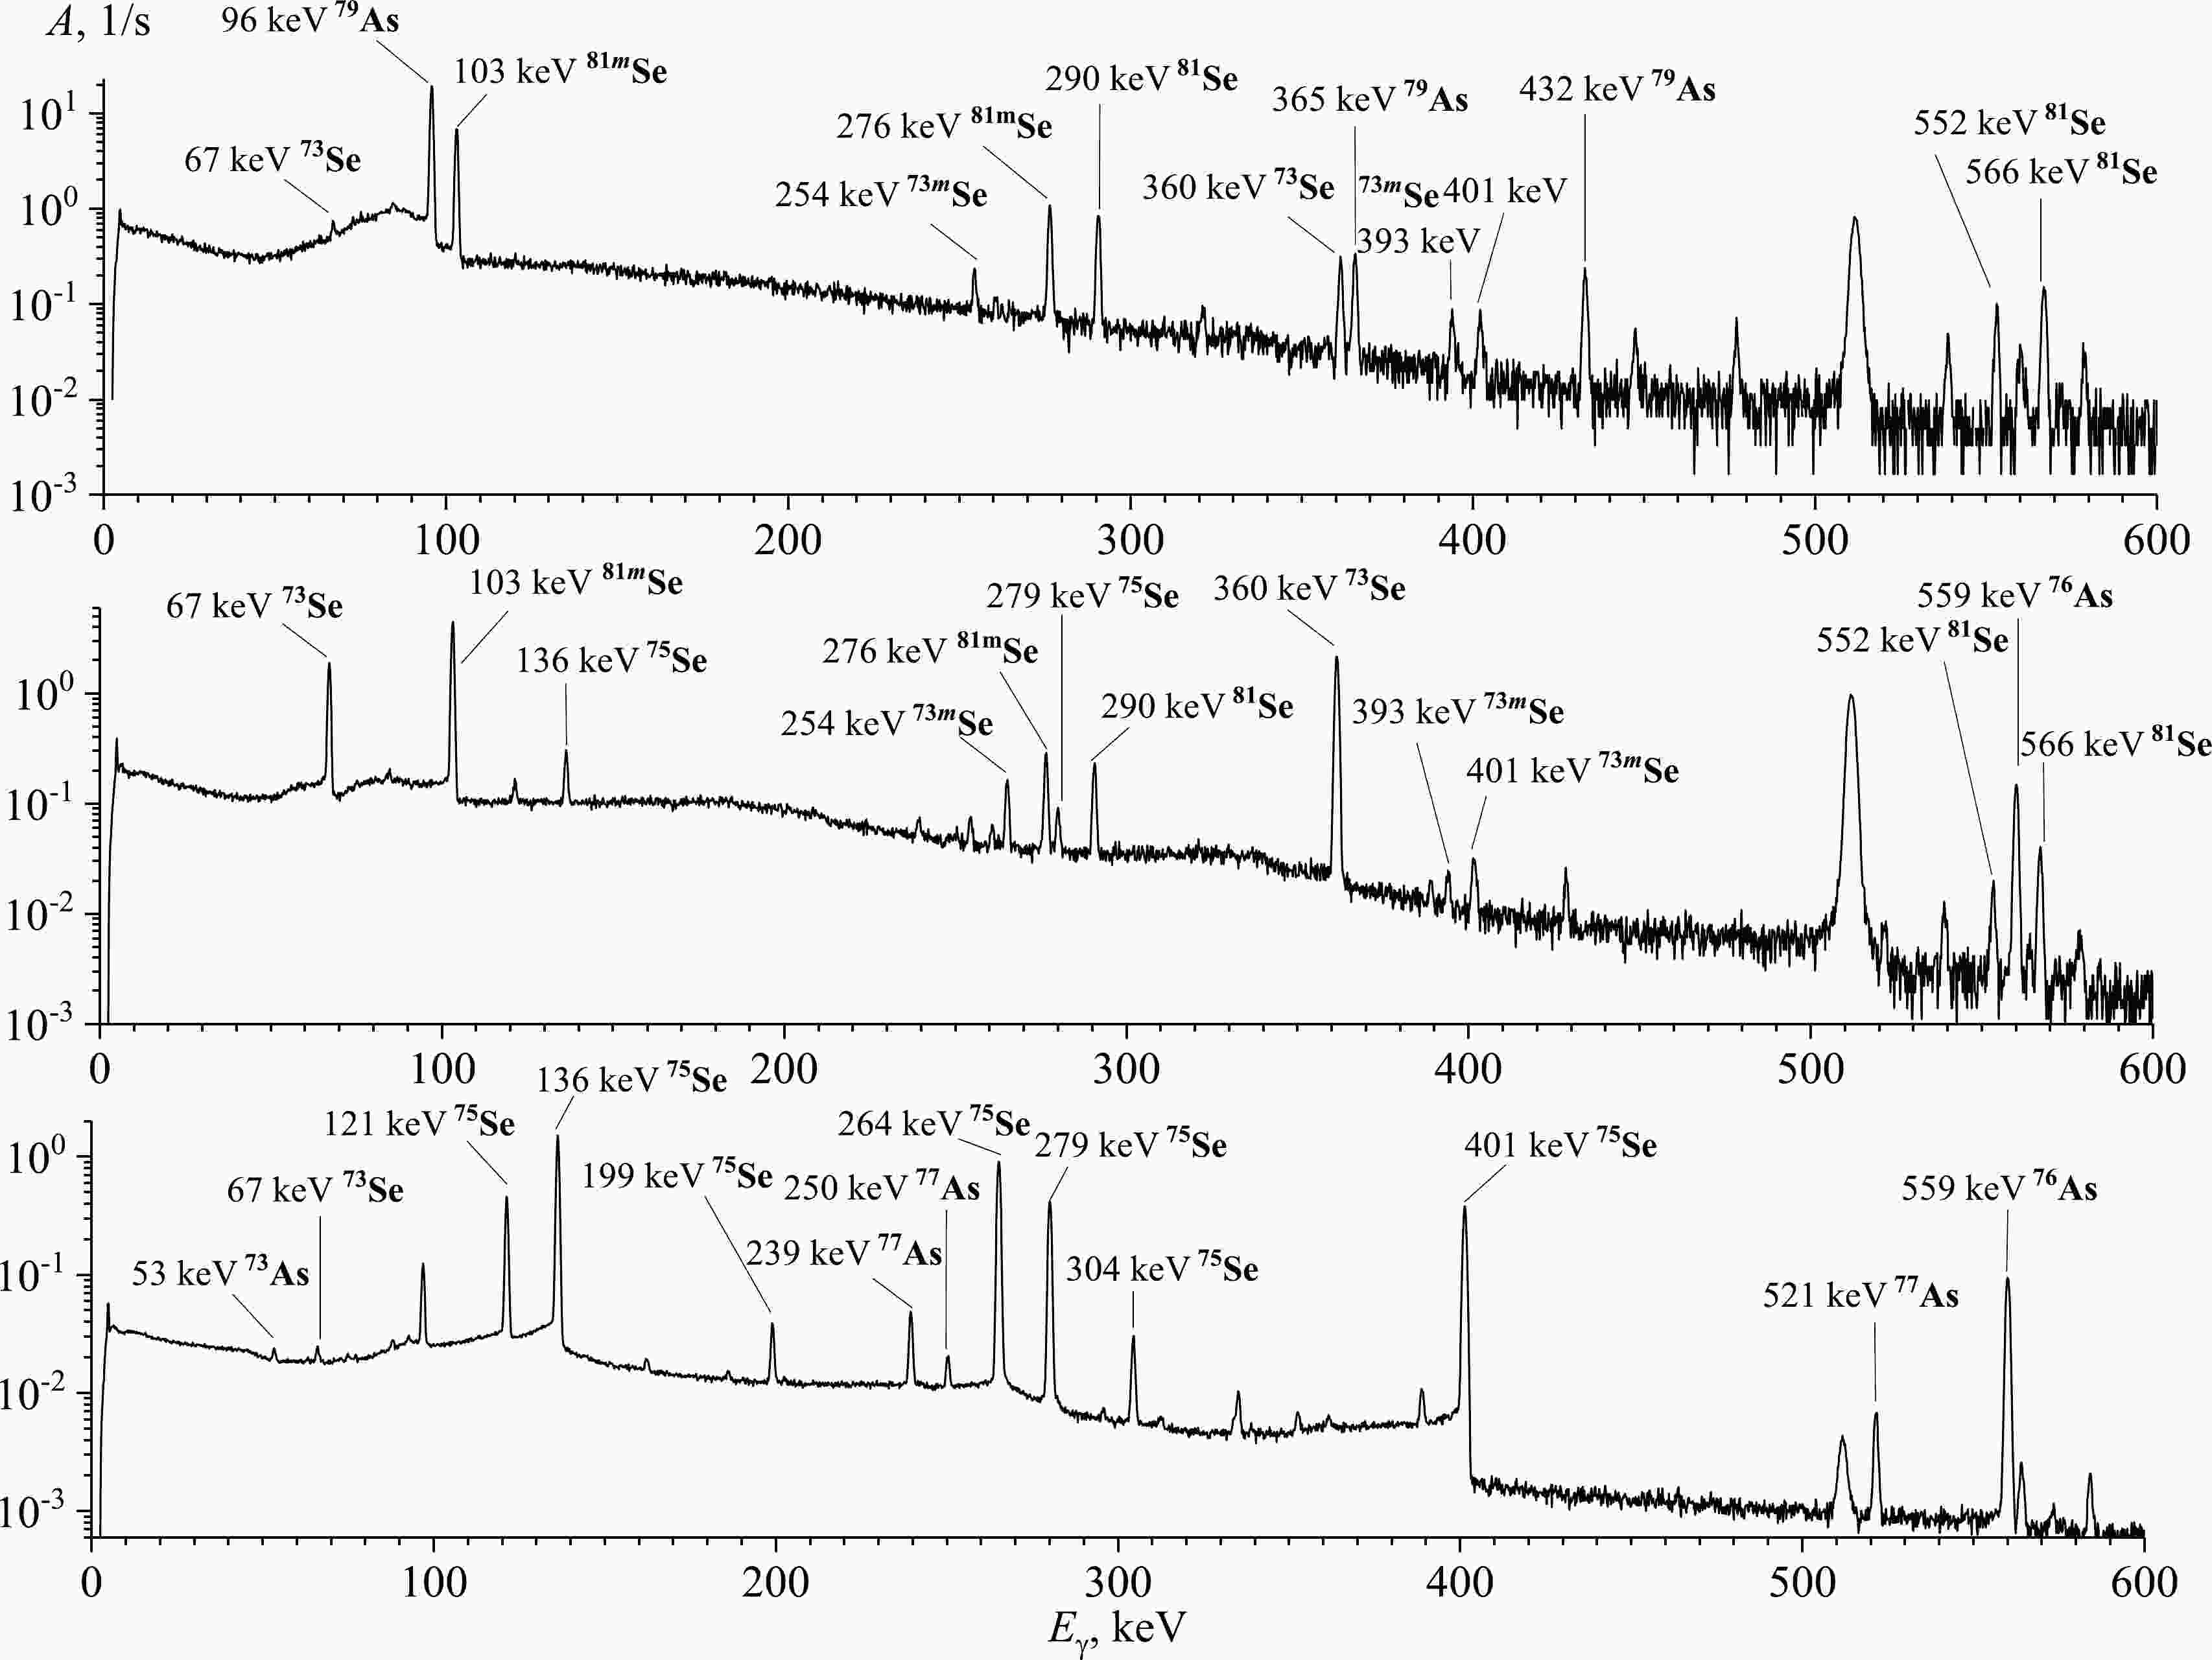
The time from the end of irradiation to the start of measurement (cooling time) was in range from 10 to 15 min. For each sample, the spectra were measured at several times during an overall period of 0.5, 1, 2, 6, 12, and 24 h. Typical γ-ray spectra of the reaction products produced from the natSe are shown in Fig. 1. The sample was irradiated with bremsstrahlung radiation with end-point energy of 23 MeV.

Figure 1. Spectra of residual activity of the irradiated sample from a natural mixture of selenium isotopes (top-to-bottom) 10 min, 3 h, and 4 days after irradiation. The spectra measurement duration was 10 min, 1 h, and 1 day, respectively. The bremsstrahlung end-point energy used for the irradiation was 23 MeV.
The gamma-ray spectra were processed using the DEIMOS32 code [31], which fits the count area of the full-energy peaks with the Gaussian function. The identification of the processed peaks was based on the gamma-ray energy and intensity and the half-life of the generated residual nuclei. The radionuclides produced were identified based on their characteristic γ-ray energies and half-lives. The main γ-ray energies and intensities used to determine the yield of the reaction products are listed in Table 2. The nuclear data presented in columns 4−5 of Table 2 are taken from Ref. [32].
Reaction product Reactions Eth/MeV γ-ray energy, E>γ /keV (Iγ /%) Half-life, T1/2 73Se 74Se(γ,1n) 12.07 67.07 (70), 361.2 (97) 7.15 h 73mSe 74Se(γ,1n) 12.07 253.70 (2.36) 39.8 m 75Se 76Se(γ,1n) 11.15 121.12 (17.2), 136.00 (58.50), 264.66 (58.90), 279.54 (25.02), 400.66 (11.41) 119.78 d 81Se 82Se(γ,1n) 9.27 275.93 (0.68), 290.04 (0.56), 566.03 (0.224) 18.45 m 81mSe 82Se(γ,1n) 9.27 103.01 (12.8) 57.28 m 73As 74Se(γ,1p) 8.54 53.437 (10.6) 80.3 d 76As 77Se(γ,1p) 9.59 559.10 (45), 657.05 (6.2), 1216.08 (3.42) 1.09 d 77As 78Se(γ,1p) 10.39 239.01 (1.59), 249.81 (0.39), 520.65 (0.56) 1.62 d 79As 80Se(γ,1p) 11.41 95.73 (9.3), 365.0 (1.86), 432.1 (1.49) 9.01 m Table 2. Spectroscopic data from Ref. [32] for the product nuclei from the photonuclear reactions on the stable isotopes of selenium.
-
The experimental yields of the reactions Yexp were normalized to one electron of the accelerated beam incident on the bremsstrahlung target and calculated using the following formula:
$ {Y}_{\rm exp}=\frac{{S}_{p}\cdot {C}_{\rm abs}}{\epsilon \cdot {I}_{\gamma }}\frac{{t}_{\rm real}}{{t}_{\rm live}}\frac{1}{N}\frac{1}{{N}_{\rm e}}\frac{{\rm e}^{\lambda \cdot {t}_{\rm cool}}}{(1-{\rm e}^{-\lambda \cdot {t}_{\rm real}})}\frac{\lambda \cdot {t}_{\rm irr}}{(1-{\rm e}^{-\lambda \cdot {t}_{\rm irr}})}, $

(1) where
$ {S}_{p} $ is the full-energy-peak area;$ \epsilon $ is the full-energy-peak detector efficiency;$ {I}_{\gamma } $ is the gamma emission probability;$ {C}_{\rm abs} $ is the correction for self-absorption of gamma rays in the sample;$ {t}_{\rm real} $ and$ {t}_{\rm live} $ are the real time and live time of the measurement, respectively;$ N $ is the number of atoms in the activation sample;$ {N}_{e} $ is the integral number of incident electrons;$ \lambda $ is the decay constant;${t}_{\rm cool}$ is the cooling time; and${t}_{\rm irr}$ is the irradiation time.The yields Ytheor of photonuclear reactions representing the convolution of the photonuclear reactions cross section σ(E) and the distribution density of the number of bremsstrahlung photons over energy per one electron of the accelerator W(E, Eγmax) were determined as a result of the experiment. For the yield measurement of a natural mixture of isotopes, the result is the yield of isotope production in all possible reactions on the natural mixture:
$ {Y}_{\rm theor}=\sum _{i}{\eta }_{i}\underset{{E}_{\rm th}}{\overset{{E}_{\gamma \max}}{\int }}\sigma \left(E\right)W\left(E,{E}_{\gamma \max}\right){\rm d}E, $

(2) where Eγmax is the kinetic energy of electrons hitting the tungsten radiator, E is the energy of bremsstrahlung photons produced on the radiator, Eth is the threshold of the studied photonuclear reaction, η is the percentage of the studied isotope in the natural mixture of selenium isotopes, and the index i corresponds to the number of the reaction contributing to the production of the studied isotope.
The total and partial cross sections σ(E) of the photonuclear reactions on the selenium isotopes were computed for the monochromatic photons using the TALYS1.96 code [22] with the standard parameters and CMPR [23]. The TALYS program analyzes all reactions occurring in the nucleus and transitions between states. Therefore, it is possible to determine not only the total cross sections of photonuclear reactions, but also the cross sections of reactions with the formation of specific states, in particular isomeric states. The CMPR calculates the cross sections of photonuclear reactions with production of a studied isotope, that is, the sum of the ground and isomeric states. The result of the yield measurement for a natural mixture of isotopes is the yield of isotope production in all possible reactions on the natural mixture. In our case, each radioactive nucleus was formed as a result of one specific photonuclear reaction, because the thresholds of other formation channels exceed 23 MeV.
The main disadvantage of bremsstrahlung beam experiments is that the yield of photonuclear reaction depends both on the studied cross section of the reaction σ(E) and the shape of the bremsstrahlung spectrum W(E, Eγmax), which is often known with insufficient accuracy. That is the reason why the data obtained from photonuclear experiments on bremsstrahlung beams are generally represented in terms of the relative yields or the integrated reaction cross section [33−35], flux weighted average cross section <σ> [36−43], or cross section per equivalent photon σq [35, 37, 43, 44].
The use of the relative yields makes it possible to obtain the dependence of the probability of photonuclear reactions on the maximum energy of bremsstrahlung under different experimental conditions. The calibration with respect to the yield of the most probable reaction excludes the influence of the total photon absorption cross section. In our case, the dominant reaction is 82Se(γ,1n)81m+gSe. Theoretical values of the relative yields can be calculated using the following formula:
$ {Y}_{{\rm rel},i}=\frac{\sum _{i}{\eta }_{i}\underset{{E}_{\rm th}}{\overset{{E}_{\gamma \max}}{\int }}{\sigma }_{i}\left(E\right)W\left(E,{E}_{\gamma \max}\right){\rm d}E}{{\eta }_{\rm Se-82}\underset{{E}_{\rm th}}{\overset{{E}_{\gamma \max}}{\int }}{\sigma }_{(\gamma ,n)}\left(E\right)W\left(E,{E}_{\gamma \max}\right){\rm d}E}. $

(3) Owing to the assumption on the unchanged shape of the bremsstrahlung spectrum, the bremsstrahlung photon production cross section σ(E, Eγmax) should be taken as the function W (E, Eγmax):
$ {Y}_{{\rm rel},i}=\frac{\sum _{i}{\eta }_{i}\underset{{E}_{\rm th}}{\overset{{E}_{\gamma \max}}{\int }}{\sigma }_{i}\left(E\right)\sigma \left(E,{E}_{m}\right){\rm d}E}{{\eta }_{\rm Se-82}\underset{{E}_{\rm th}}{\overset{{E}_{\gamma \max}}{\int }}{\sigma }_{(\gamma ,n)}\left(E\right)\sigma \left(E,{E}_{m}\right){\rm d}E}, $

(4) where σ(E, Eγmax) is calculated based on the Zeltzer-Berger tables [45].
Figure 2 and Fig. 3 show experimental values of the relative yields of photoneutron reactions normalized to the yield of the reaction 82Se(γ,1n)81m+gSe (Table 3 contains exactly this). In the case of the photoneutron reactions, theoretical calculations and experimental results are in good agreement with each other. The experimental values of relative yields lie closer to the curves of TALYS and CMPR.
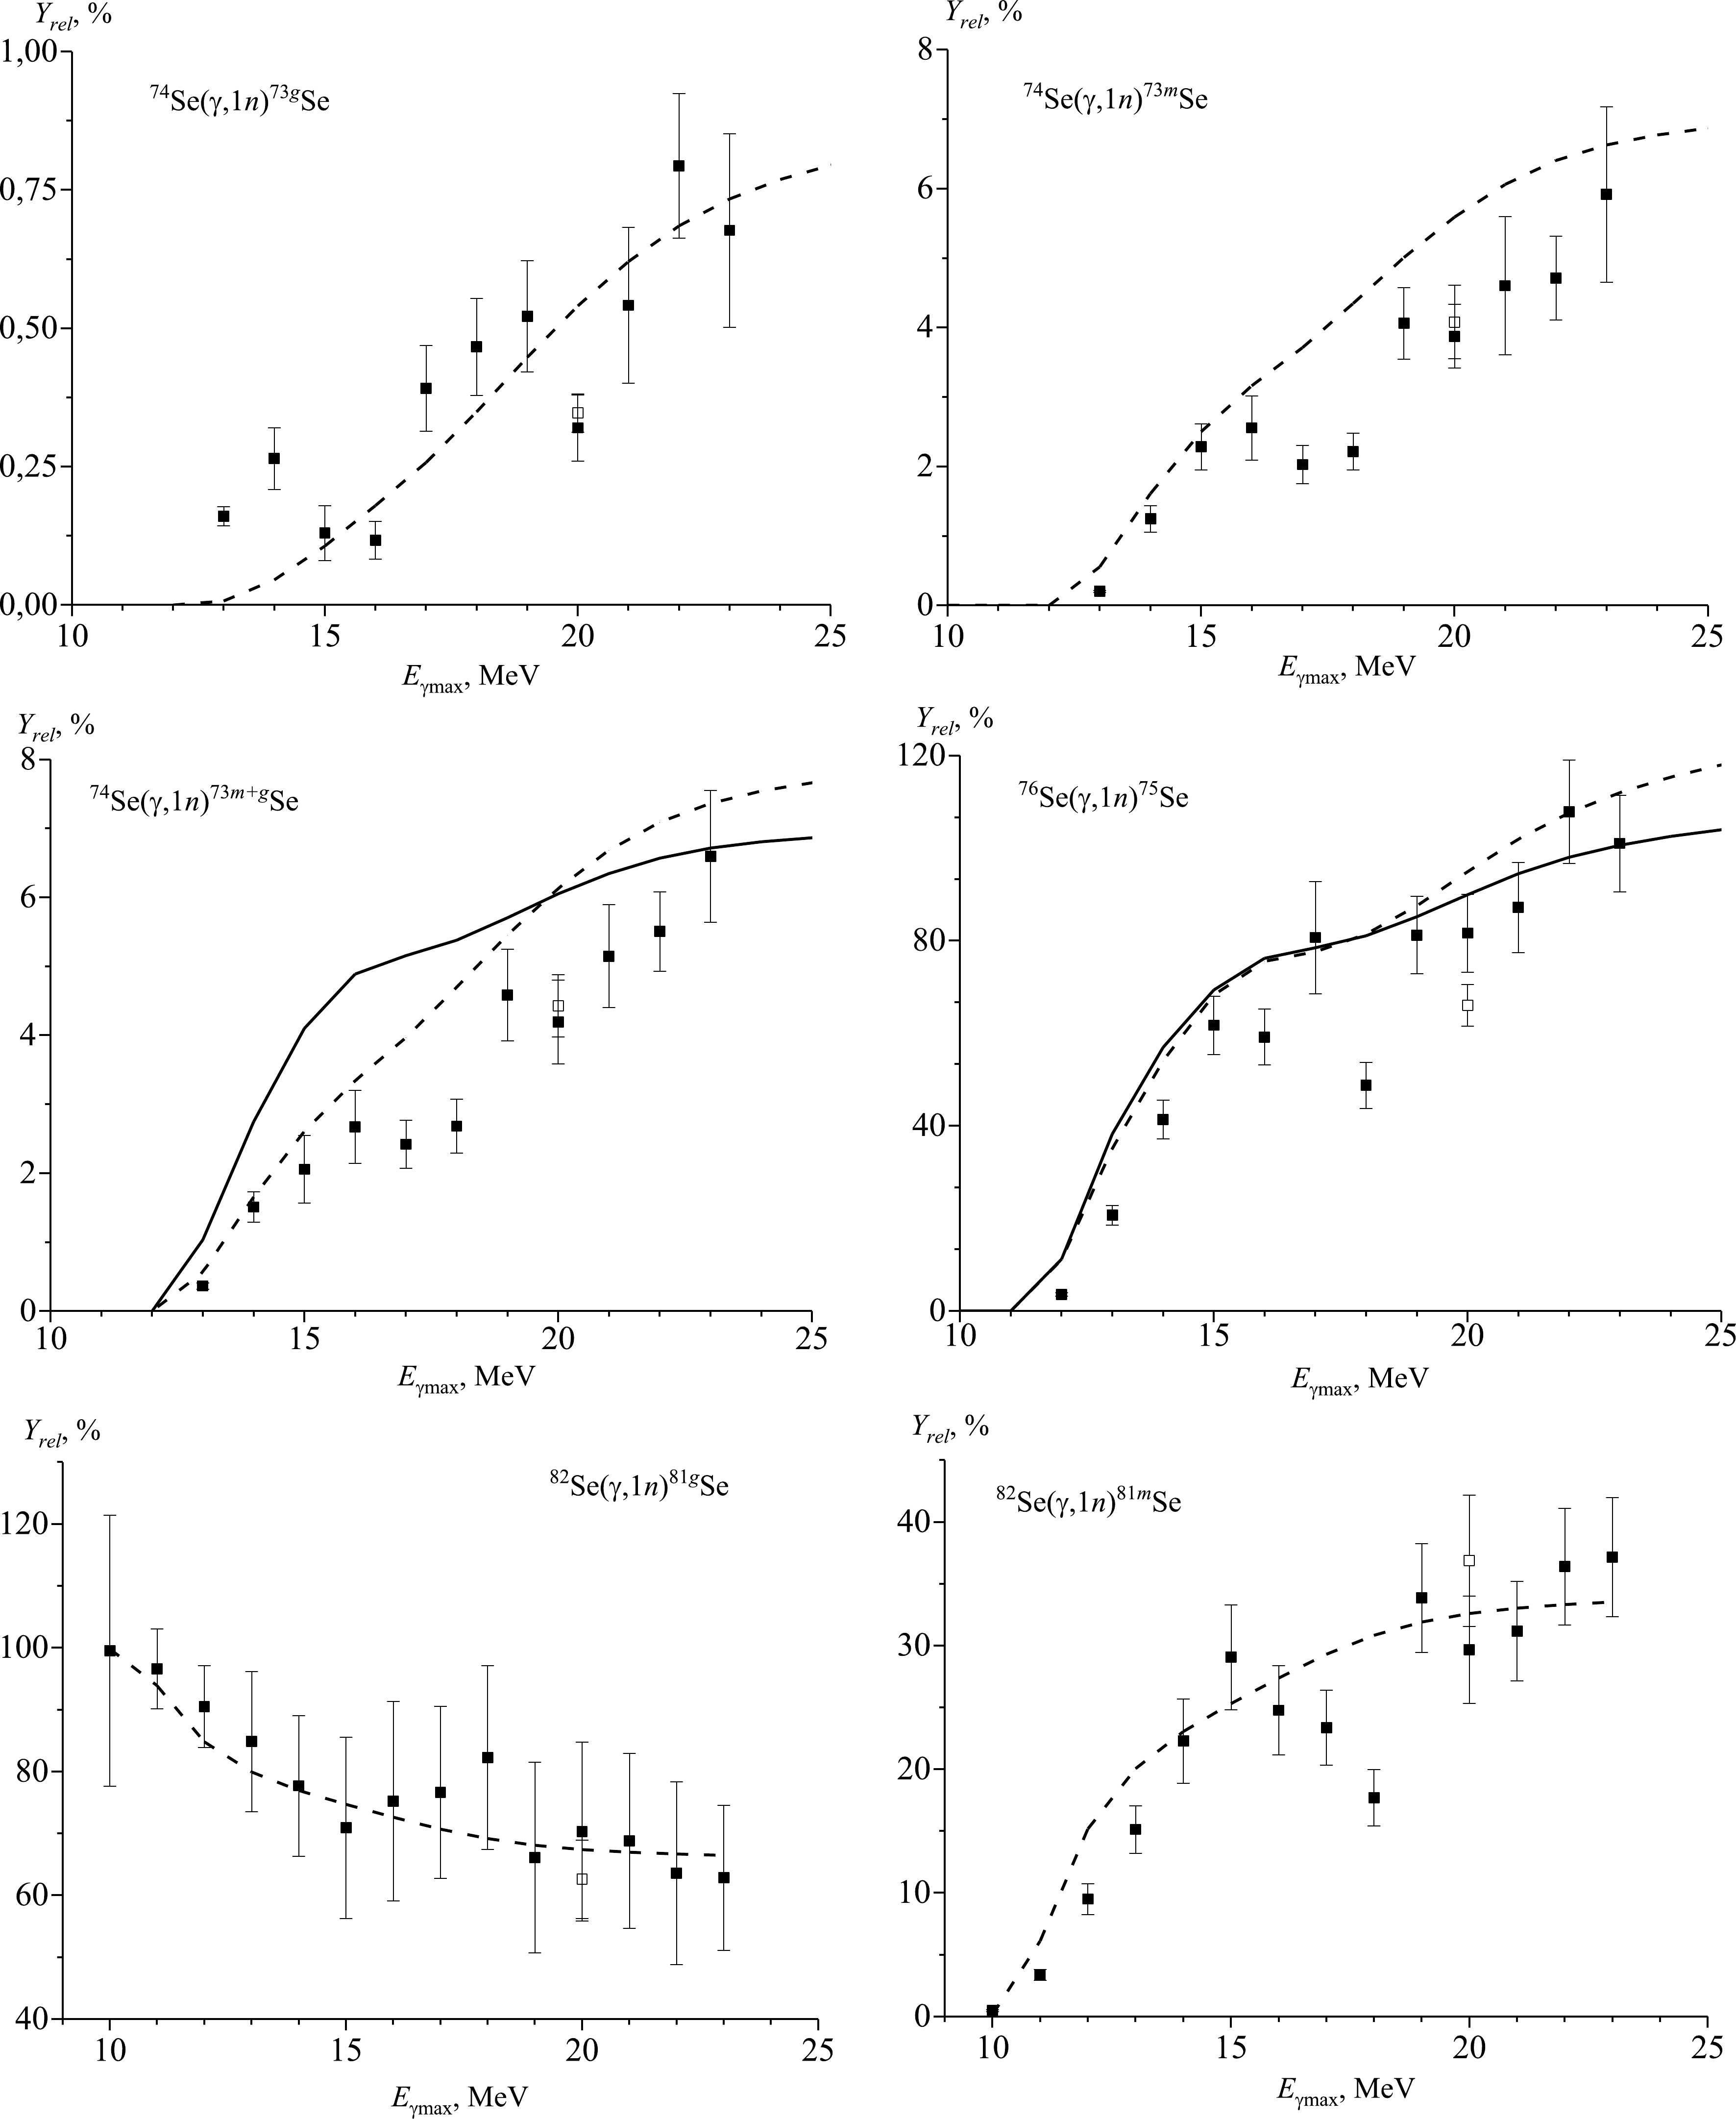
Figure 2. Relative yields of natSe(γ,1n) reactions as a function of bremsstrahlung end-point energy from the present work (solid rectangles), literature data [14] (open rectangles), and simulated values using the CMPR (solid lines) and TALYS code (dashed lines) based on monoenergetic photons.
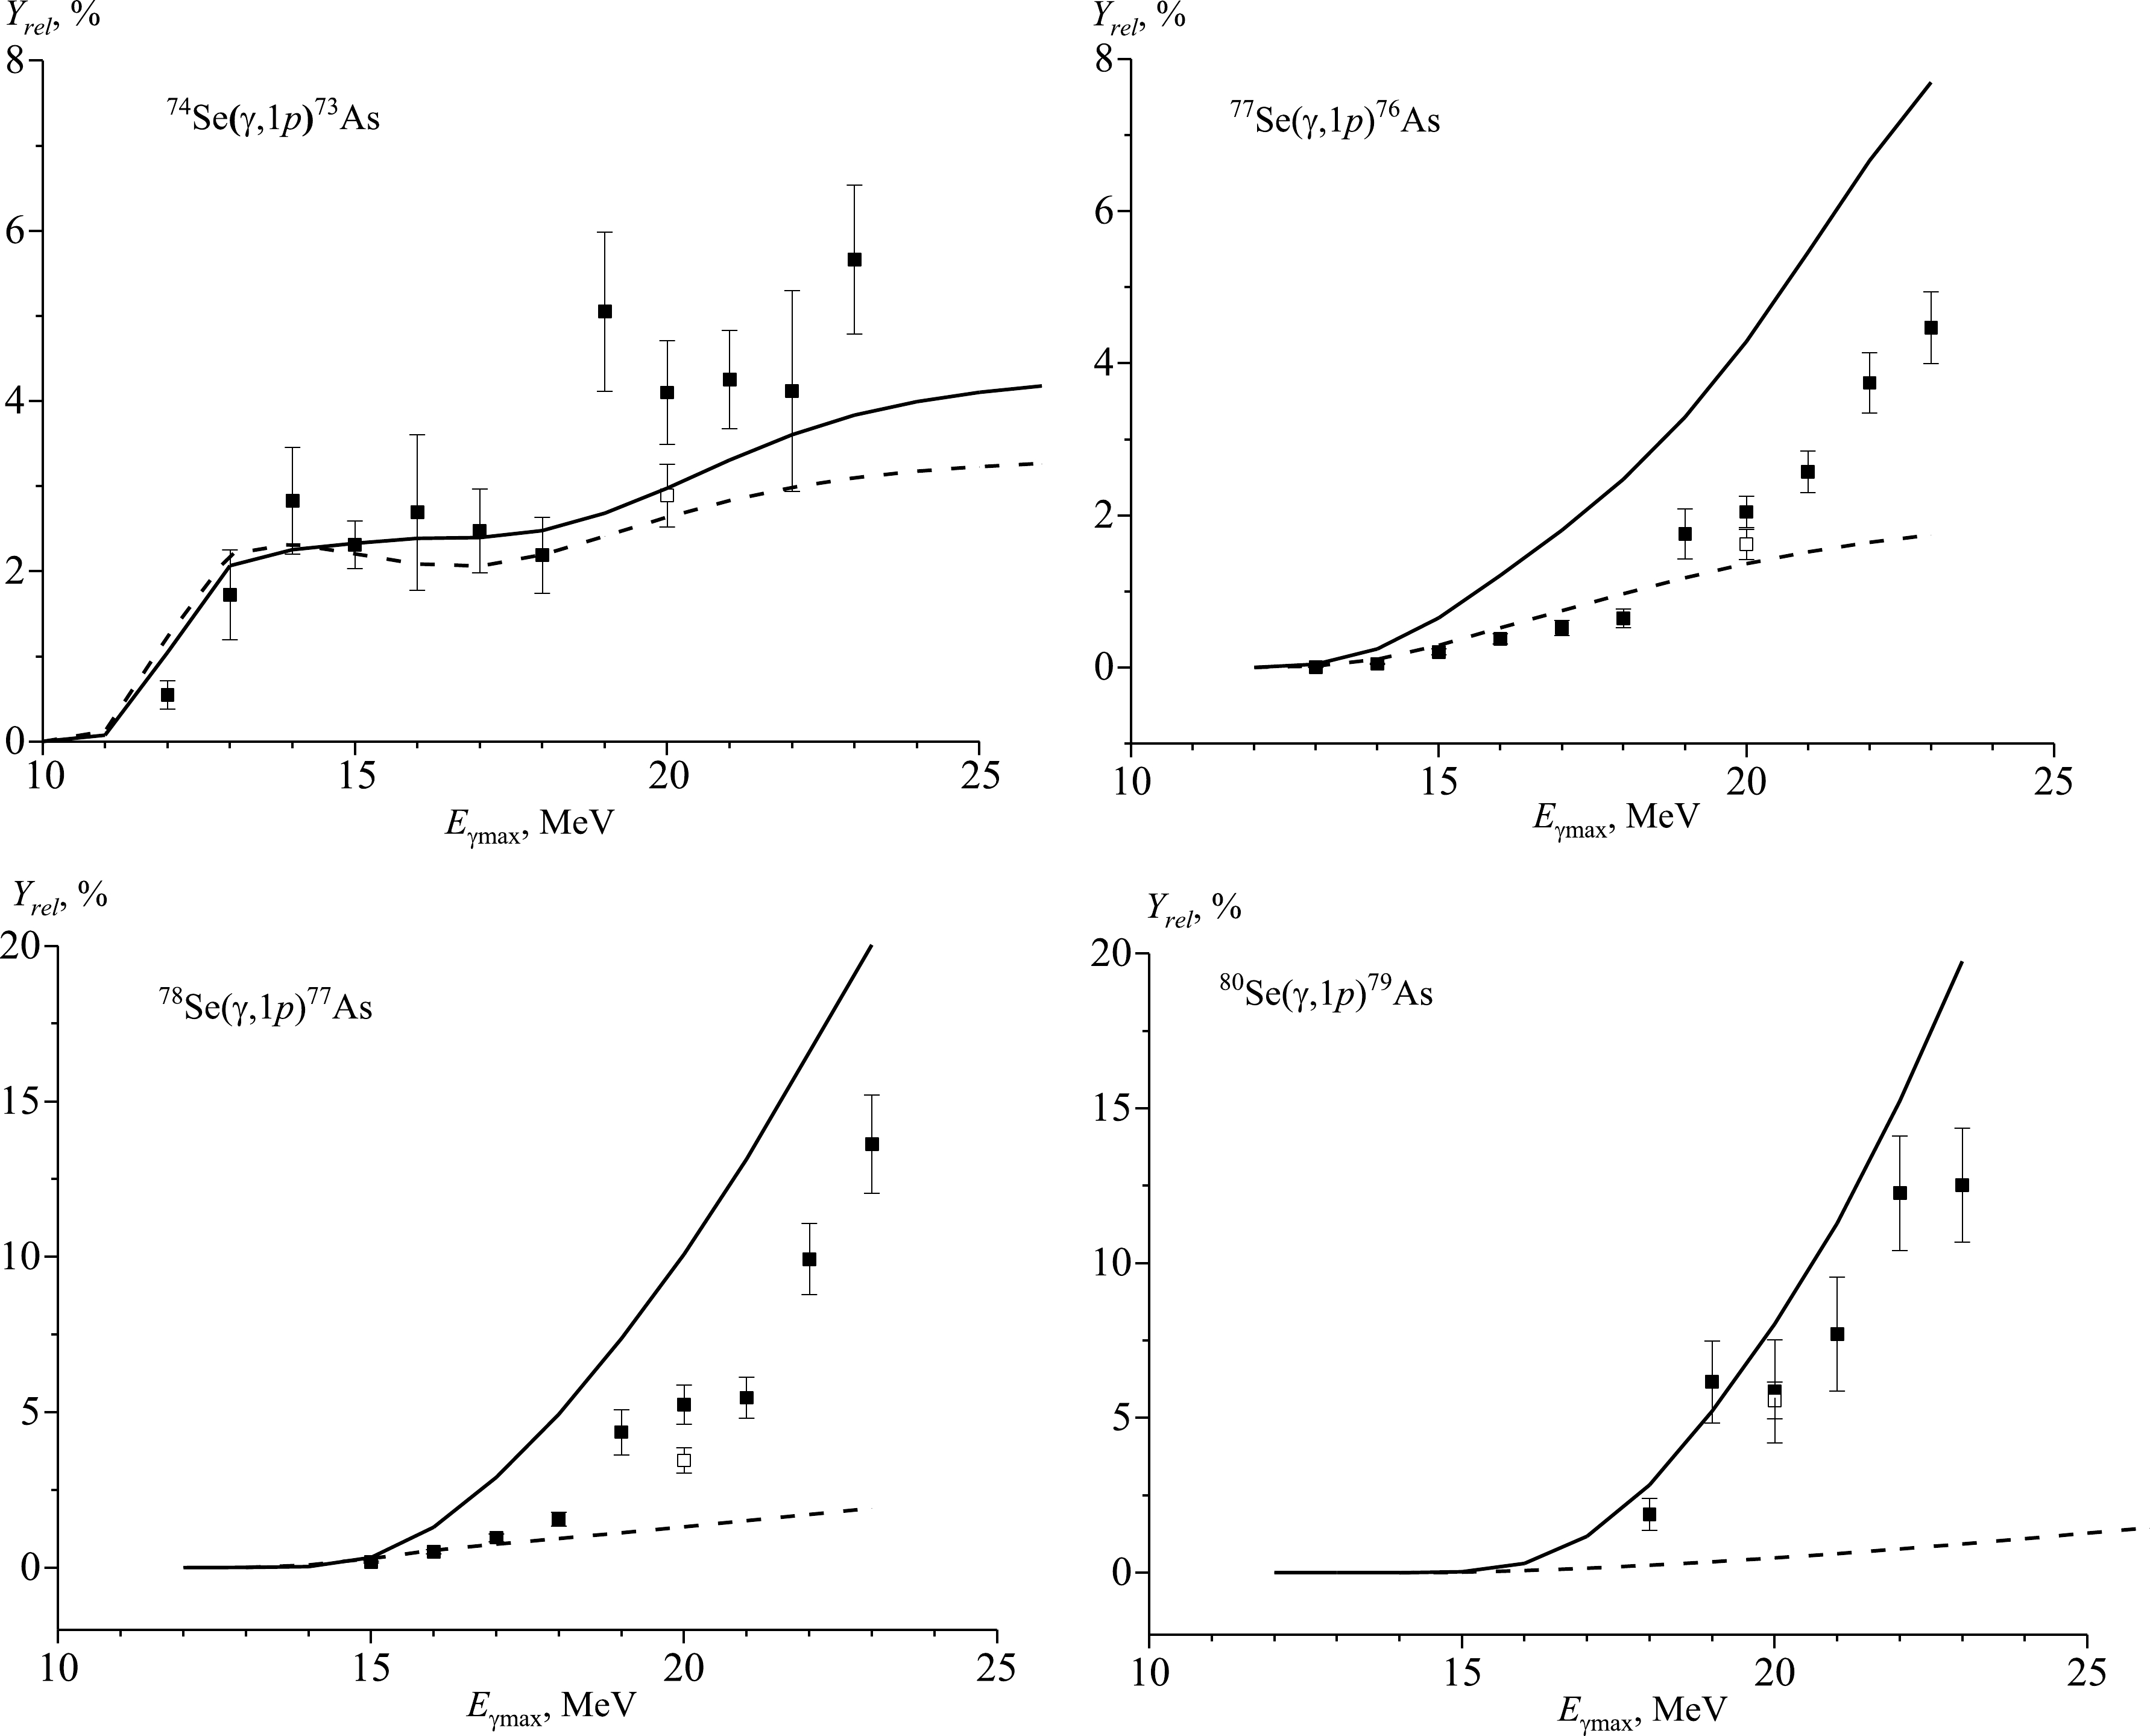
Figure 3. Relative yields of natSe(γ,1p) reactions as a function of bremsstrahlung end-point energy from the present work (solid rectangles), literature data [14] (open rectangles), and simulated values using the CMPR (solid line) and TALYS code (dashed line) based on monoenergetic photons.
Reaction Eγmax Yrel/% YrelTALYS/% YrelCMPR/% 74Se(γ, n)73gSe 13 MeV 0.16 ± 0.02 0.01 14 MeV 0.26 ± 0.06 0.04 15 MeV 0.13 ± 0.05 0.10 16 MeV 0.12 ± 0.03 0.17 17 MeV 0.39 ± 0.08 0.25 18 MeV 0.47 ± 0.09 0.33 19 MeV 0.52 ± 0.10 0.43 20 MeV 0.32 ± 0.06
0.35 ± 0.03 [14]0.52 21 MeV 0.54 ± 0.14 0.59 22 MeV 0.79 ± 0.13 0.65 23 MeV 0.68 ± 0.17 0.70 74Se(γ, n)73mSe 13 MeV 0.20 ± 0.01 0.53 14 MeV 1.25 ± 0.19 1.54 15 MeV 1.93 ± 0.33 2.39 16 MeV 2.56 ± 0.46 3.02 17 MeV 2.03 ± 0.27 3.55 18 MeV 2.22 ± 0.26 4.16 19 MeV 4.06 ± 0.51 4.79 20 MeV 3.87 ± 0.46
4.08 ± 0.53 [14]5.35 21 MeV 4.60 ± 0.99 5.79 22 MeV 4.71 ± 0.60 6.12 23 MeV 5.92 ± 1.26 6.34 74Se(γ, n)73m+gSe 13 MeV 0.37 ± 0.05 0.54 1.03 14 MeV 1.51 ± 0.22 1.58 2.75 15 MeV 2.06 ± 0.49 2.49 4.10 16 MeV 2.67 ± 0.53 3.19 4.89 17 MeV 2.42 ± 0.350 3.79 5.15 18 MeV 2.68 ± 0.39 4.49 5.38 19 MeV 4.58 ± 0.67 5.22 5.70 20 MeV 4.19 ± 0.61
4.43 ± 0.45 [14]5.86 6.05 21 MeV 5.15 ± 0.75 6.39 6.35 22 MeV 5.51 ± 0.58 6.78 6.57 23 MeV 6.59 ± 0.96 7.04 6.71 76Se(γ, n)75Se 12 MeV 3.60 ± 0.37 10.78 11.20 13 MeV 20.73 ± 2.12 34.22 38.23 14 MeV 41.38 ± 4.24 52.70 56.98 15 MeV 61.73 ± 6.32 66.58 69.35 16 MeV 59.20 ± 6.06 73.65 76.19 17 MeV 80.70 ± 12.13 75.65 78.46 Continued on next page Table 3. Relative yields of natSe(γ,1n) reactions and comparison with theoretical results calculated on the basis of TALYS and CMPR.
Figure 3 and Table 4 show the experimental values of the relative yields for the photoproton reactions on a natural mixture of selenium, in addition to the data computed with the use of the TALYS and CMPR codes. In the case of the 74Se(γ,1p) reaction, theoretical calculations and experimental results are in good agreement with each other. In the case of relative yields for photoproton reactions on the heavy selenium isotopes, the theoretical values calculated using the CMPR are much larger than the TALYS results. For photoproton reactions on the isotopes of 77Se, 78Se, and 80Se, the ratios of theoretical relative yields YrelCMPR/YrelTALYS with increasing energy increase in the ranges of 2−5, 3−11, and 11−23, respectively. The experimentally obtained results lie closer to the theoretical curve according to the CMPR code. Including isospin splitting in the CMPR allows describing experimental data on reactions with proton escape in the energy range from 10 to 23 MeV. At the energy region above 25 MeV, in addition to isospin splitting, quadrupole resonance, the overtone of the giant resonance, and the quasideuteron mechanism make a significant contribution to the cross sections [14].
Reaction Eγmax Yrel/% YrelTALYS/% YrelCMPR/% 74Se(γ, p)73As 12 MeV 0.55 ± 0.17 1.23 1.05 13 MeV 1.72 ± 0.52 2.20 2.06 14 MeV 2.83 ± 0.63 2.32 2.25 15 MeV 2.31 ± 0.28 2.20 2.33 16 MeV 2.69 ± 0.91 2.08 2.39 17 MeV 2.47 ± 0.49 2.06 2.39 18 MeV 2.19 ± 0.45 2.19 2.48 19 MeV 5.05 ± 0.94 2.41 2.68 20 MeV 4.10 ± 0.61
2.89 ± 0.37 [14]2.64 2.97 21 MeV 4.25 ± 0.58 2.83 3.30 22 MeV 4.12 ± 1.18 2.98 3.60 23 MeV 5.66 ± 0.87 3.09 3.83 77Se(γ, p)76As 13 MeV 0.005 ± 0.001 0.0004 0.002 14 MeV 0.05 ± 0.01 0.02 0.04 15 MeV 0.21 ± 0.04 0.11 0.24 16 MeV 0.38 ± 0.07 0.29 0.65 17 MeV 0.52 ± 0.09 0.52 1.21 18 MeV 0.65 ± 0.12 0.75 1.81 19 MeV 1.76 ± 0.33 0.97 2.47 20 MeV 2.05 ± 0.21
1.62 ± 0.20 [14]1.18 3.29 21 MeV 2.57 ± 0.27 1.36 4.29 22 MeV 3.74 ± 0.39 1.52 5.46 23 MeV 4.47 ± 0.47 1.65 6.67 78Se(γ, p)77As 15 MeV 0.18 ± 0.03 0.29 0.32 16 MeV 0.51 ± 0.07 0.56 1.29 17 MeV 0.96 ± 0.13 0.76 2.90 18 MeV 1.56 ± 0.22 0.93 4.94 19 MeV 4.36 ± 0.73 1.12 7.37 20 MeV 5.24 ± 0.63
3.45 ± 0.40 [14]1.31 10.08 21 MeV 5.46 ± 0.66 1.51 13.14 22 MeV 9.92 ± 1.14 1.71 16.59 23 MeV 13.63 ± 1.57 1.91 20.04 80Se(γ, p)79As 18 MeV 1.89 ± 0.51 0.24 2.83 19 MeV 6.16 ± 1.33 0.35 5.22 20 MeV 5.86 ± 1.66
5.57 ± 0.60 [14]0.48 8.03 21 MeV 7.71 ± 1.84 0.61 11.29 22 MeV 12.27 ± 1.85 0.77 15.23 23 MeV 12.52 ± 1.84 0.93 19.75 Table 4. Relative yields of natSe(γ,1p) reactions and comparison with theoretical results calculated on the basis of TALYS and CMPR.
Unlike widely used numerical codes such as TALYS, GNASH, and EMPIRE, the CMPR considers not only the GDR and quasideuteron photoabsorption mechanism but also the contribution to the cross section of isovector quadrupole resonance and the GDR overtone in the calculation of the photoabsorption cross section. The energies and integral cross sections of this giant resonances are calculated in the framework of the semimicroscopic model with multipole–multipole residual forces [23].
In nuclei with N ≠ Z, upon absorption of electric dipole γ photons, two branches of the GDR are excited, T< = T0 and T> = T0 + 1, where T0 =
$ \dfrac{|N-Z|}{2} $ . Figure 4 shows the excitations of the isospin components T< and T> of the GDR in initial nucleus (N, Z) and their decay according to the proton (N, Z − 1) and neutron (N − 1, Z) channels. From Fig. 4, it can be observed that the decay of excited GDR states with isospin T> = T0 + 1 according to the neutron channel to low-lying states T = T0 – 1/2 with neutron emission is forbidden, which leads to an increase in the reaction cross section (γ, 1p) and to a maximum shift of the reaction cross section (γ, 1p) with respect to reactions (γ, 1n) towards higher energies in the nucleus (N, Z).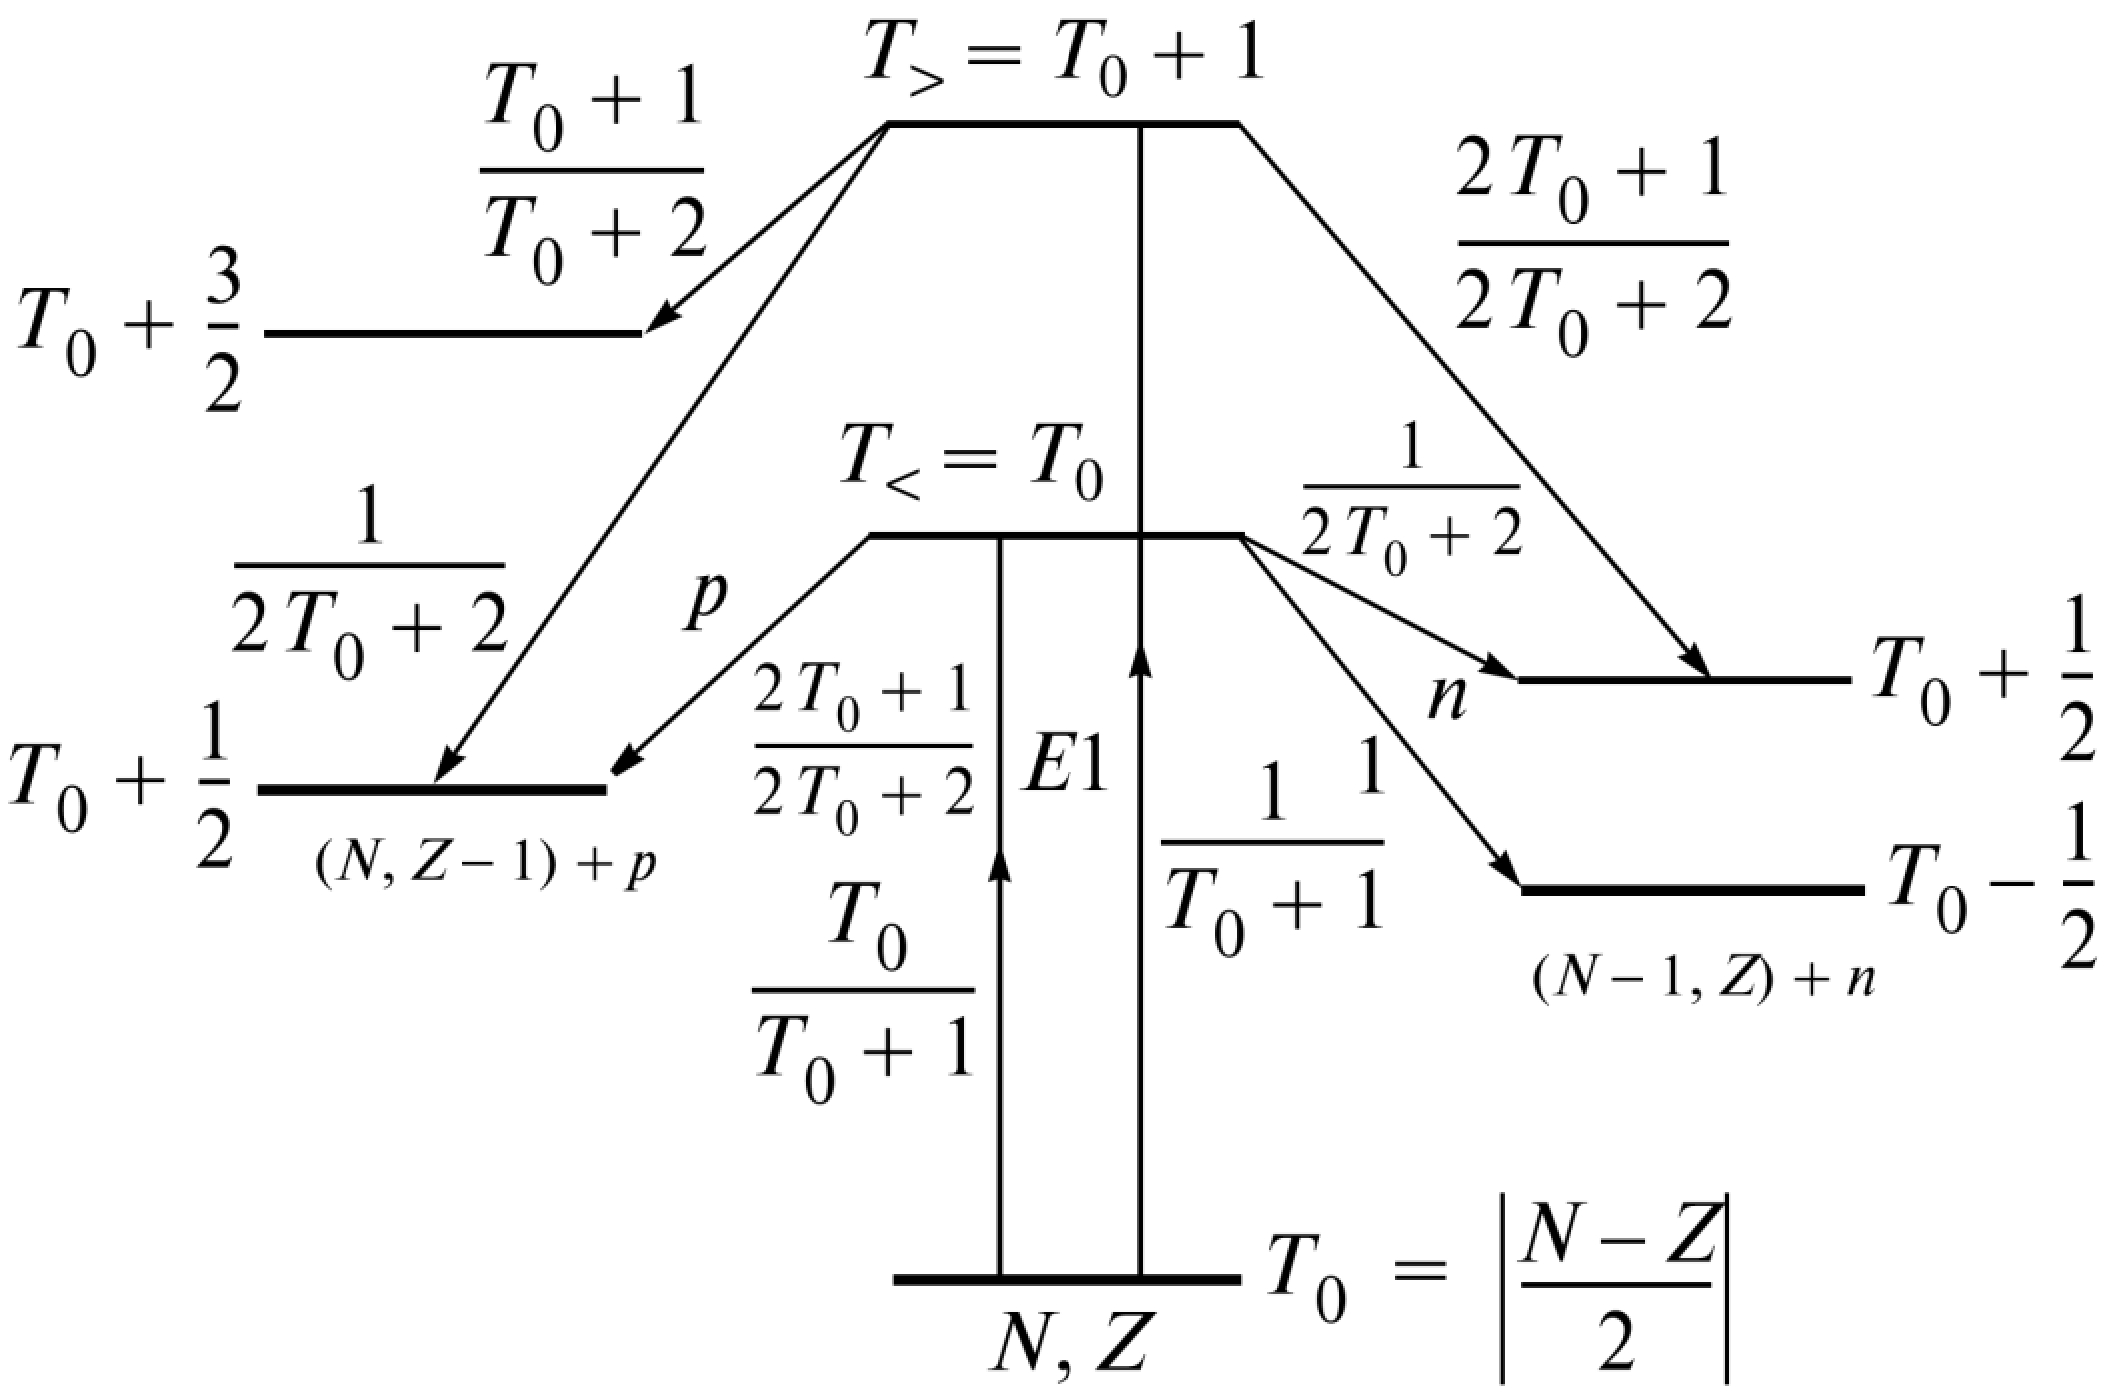
Figure 4. Scheme of excitation of states T< and T> in the nucleus (N, Z) and their decay along the proton channel (N, Z − 1) and neutron channel (N − 1, Z).
The value of isospin splitting of the GDR is determined by the following relation (5):
$ \Delta E=E\left({T}_{ > }\right)-E\left({T}_{ < }\right)=\frac{60}{A}\left({T}_{0}+1\right). $

(5) For isotopes 74,77,78,80Se, the isospin increases from 3 to 6, which leads to an increase in the isospin splitting of the GDR for these isotopes from 3.24 to 5.25 MeV.
The ratio of the probabilities of excitation of states T> and T< is described by the following relation (6):
$ \frac{s\left({T}_{ > }\right)}{s\left({T}_{ < }\right)}=\frac{1}{{T}_{0}}\frac{1-1.5{T}_{0}{A}^{-2/3}}{1+1.5{T}_{0}{A}^{-2/3}}. $

(6) For isotopes 74,77,78,80Se, the ratio s(T>)/s(T<) decreases from 0.20 to 0.06 with an increase in the mass number A. Thus, for isotopes 74,77,78,80Se, the isospin splitting of GDR increases with an increase in the mass number A, but the relative role of the excitation channel decreases.
The decay of excited GDR states with isospin T> = T0 + 1 according to the neutron channel to low-lying states T = T0 – 1/2 with neutron emission is forbidden, which leads to an increase in the reaction cross section (γ, 1p) and to a maximum shift of the reaction cross section (γ, 1p) with respect to reactions (γ, 1n) towards higher energies in the nucleus (N, Z). Figure 5 and Fig. 6 show the contribution of the T<- and T>-components to the theoretical cross sections and the relative yields for photoproton reactions of 74,77,78,80Se isotopes. As can be observed in Fig. 5, in heavy isotopes of selenium, isospin splitting plays a significant role; by taking this into account, it is possible to correctly describe the GDR decay photoproton channel. The experimental data obtained by us also confirm this fact.
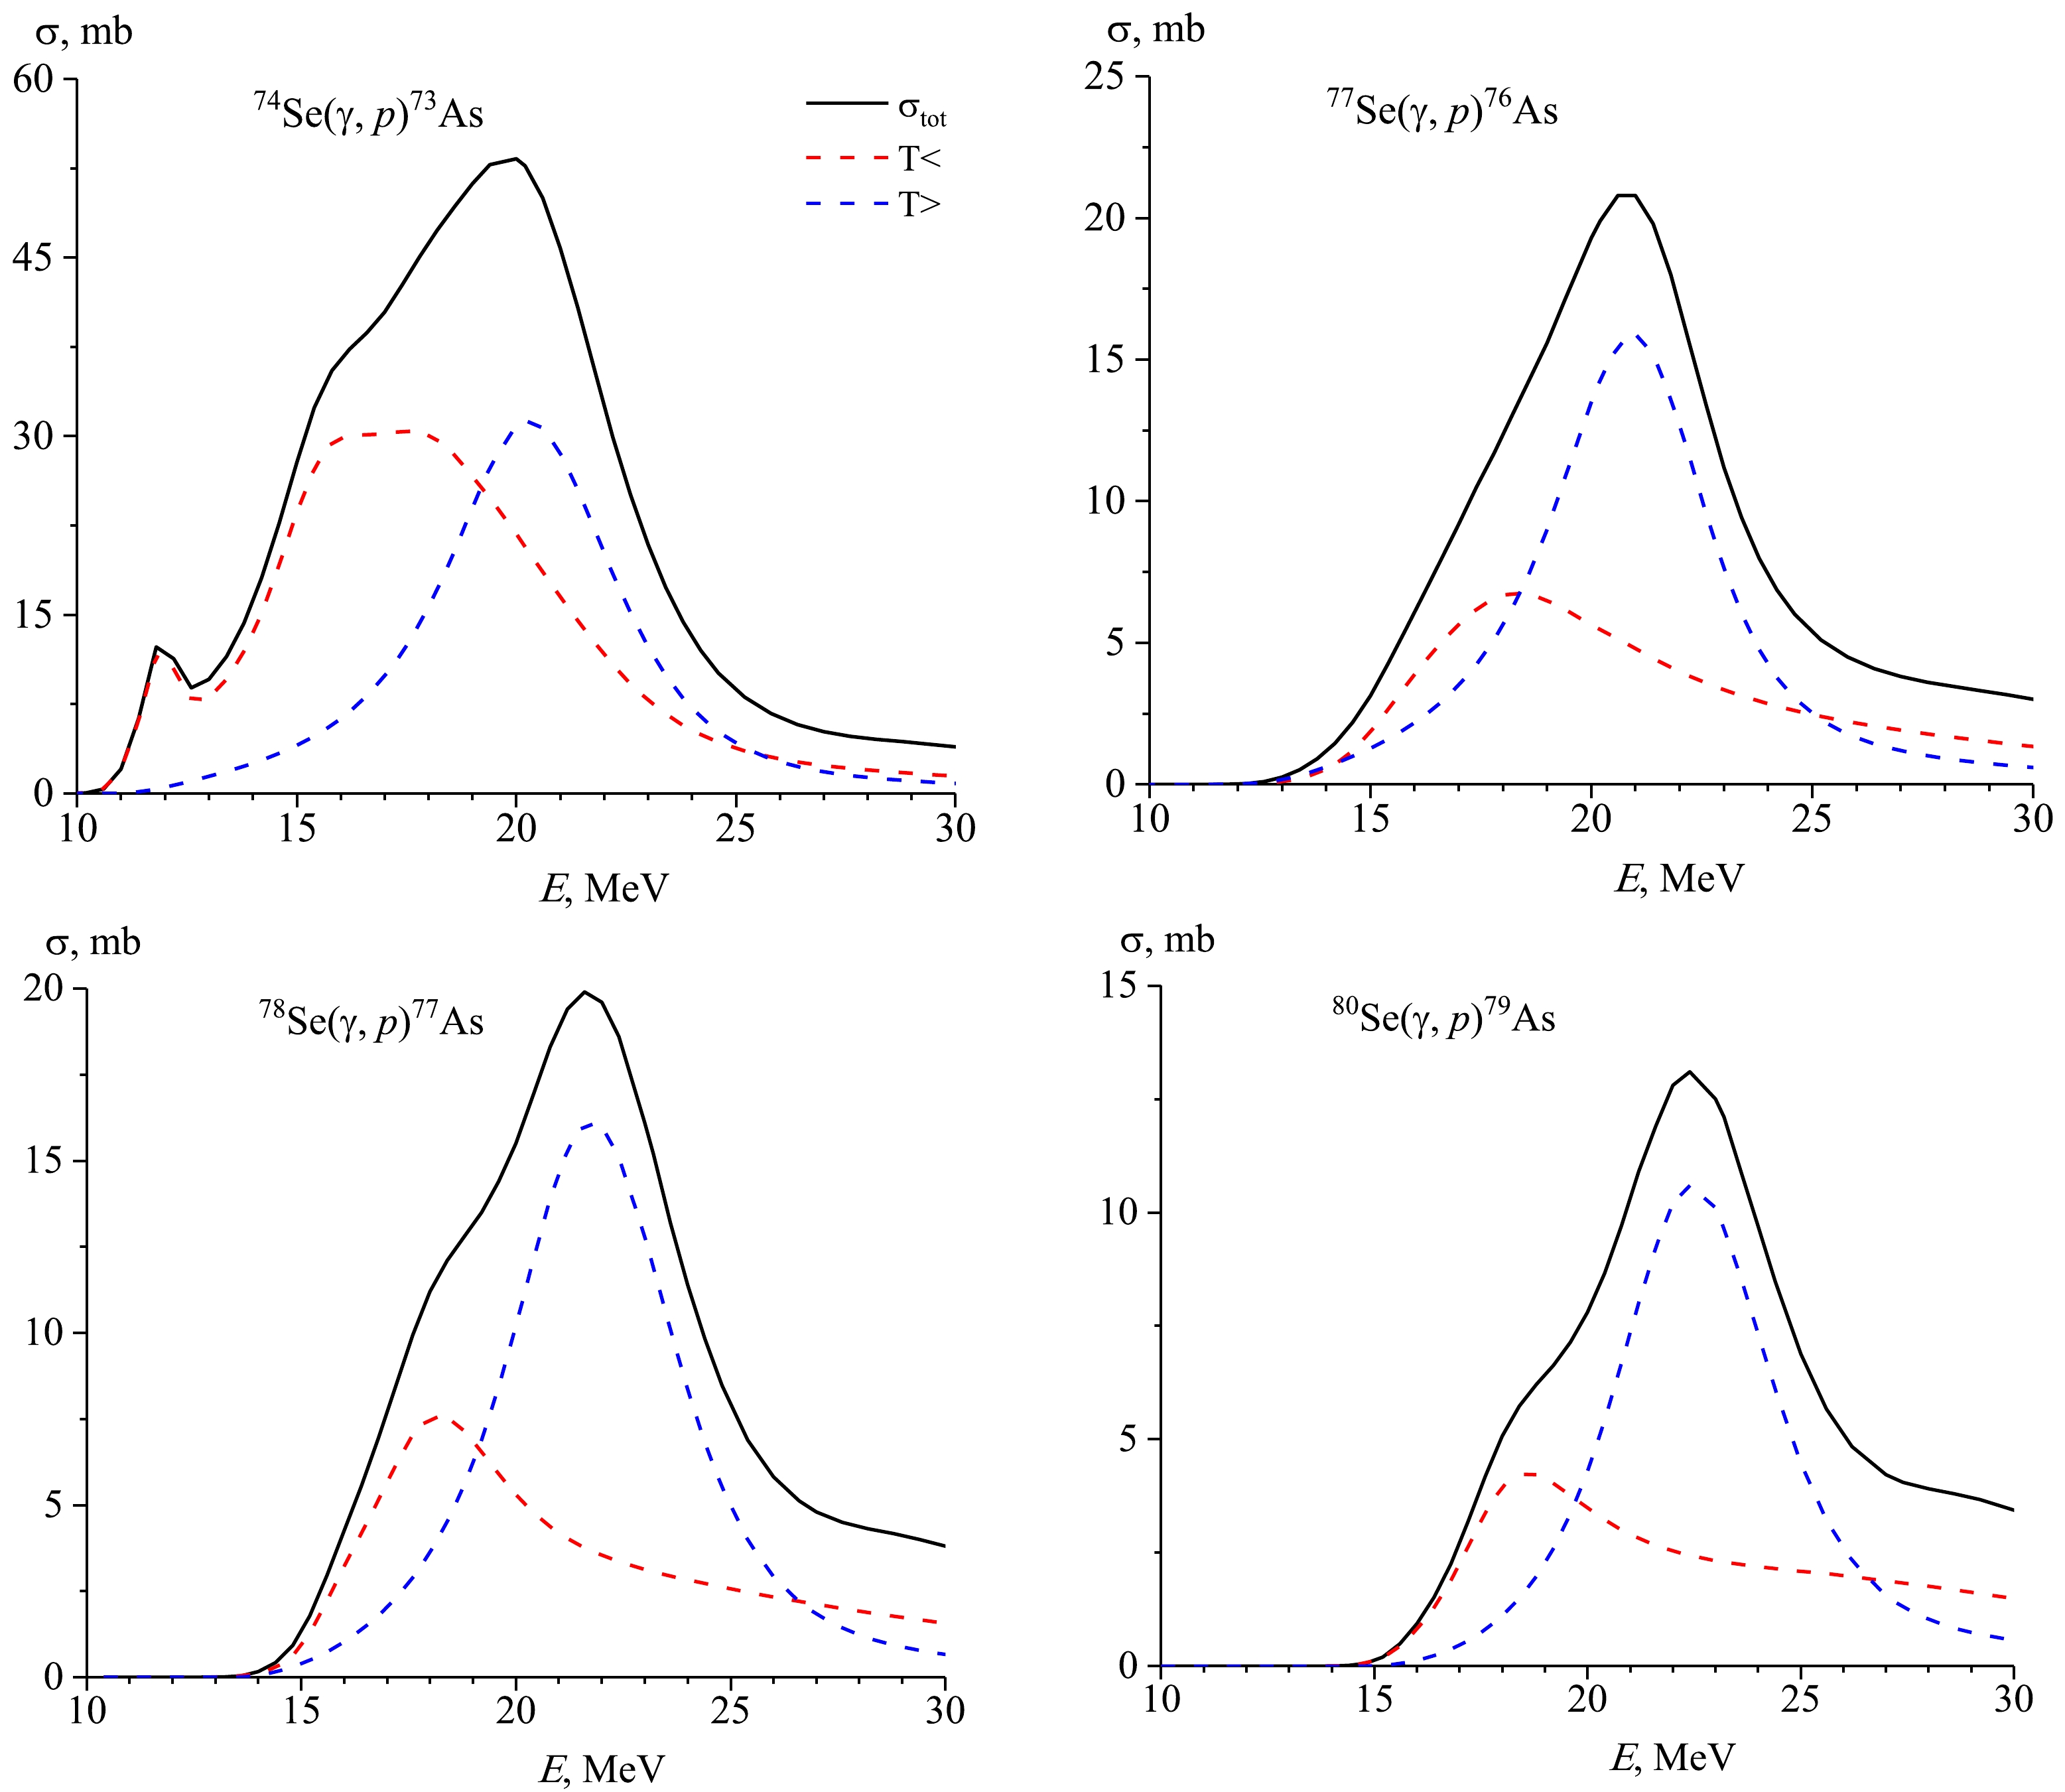
Figure 5. (color online) Cross section reactions and cross sections of the GDR components T< = T0 and T> = T0 +1 for reaction (γ, 1p) on 74,77,78,80Se isotopes.
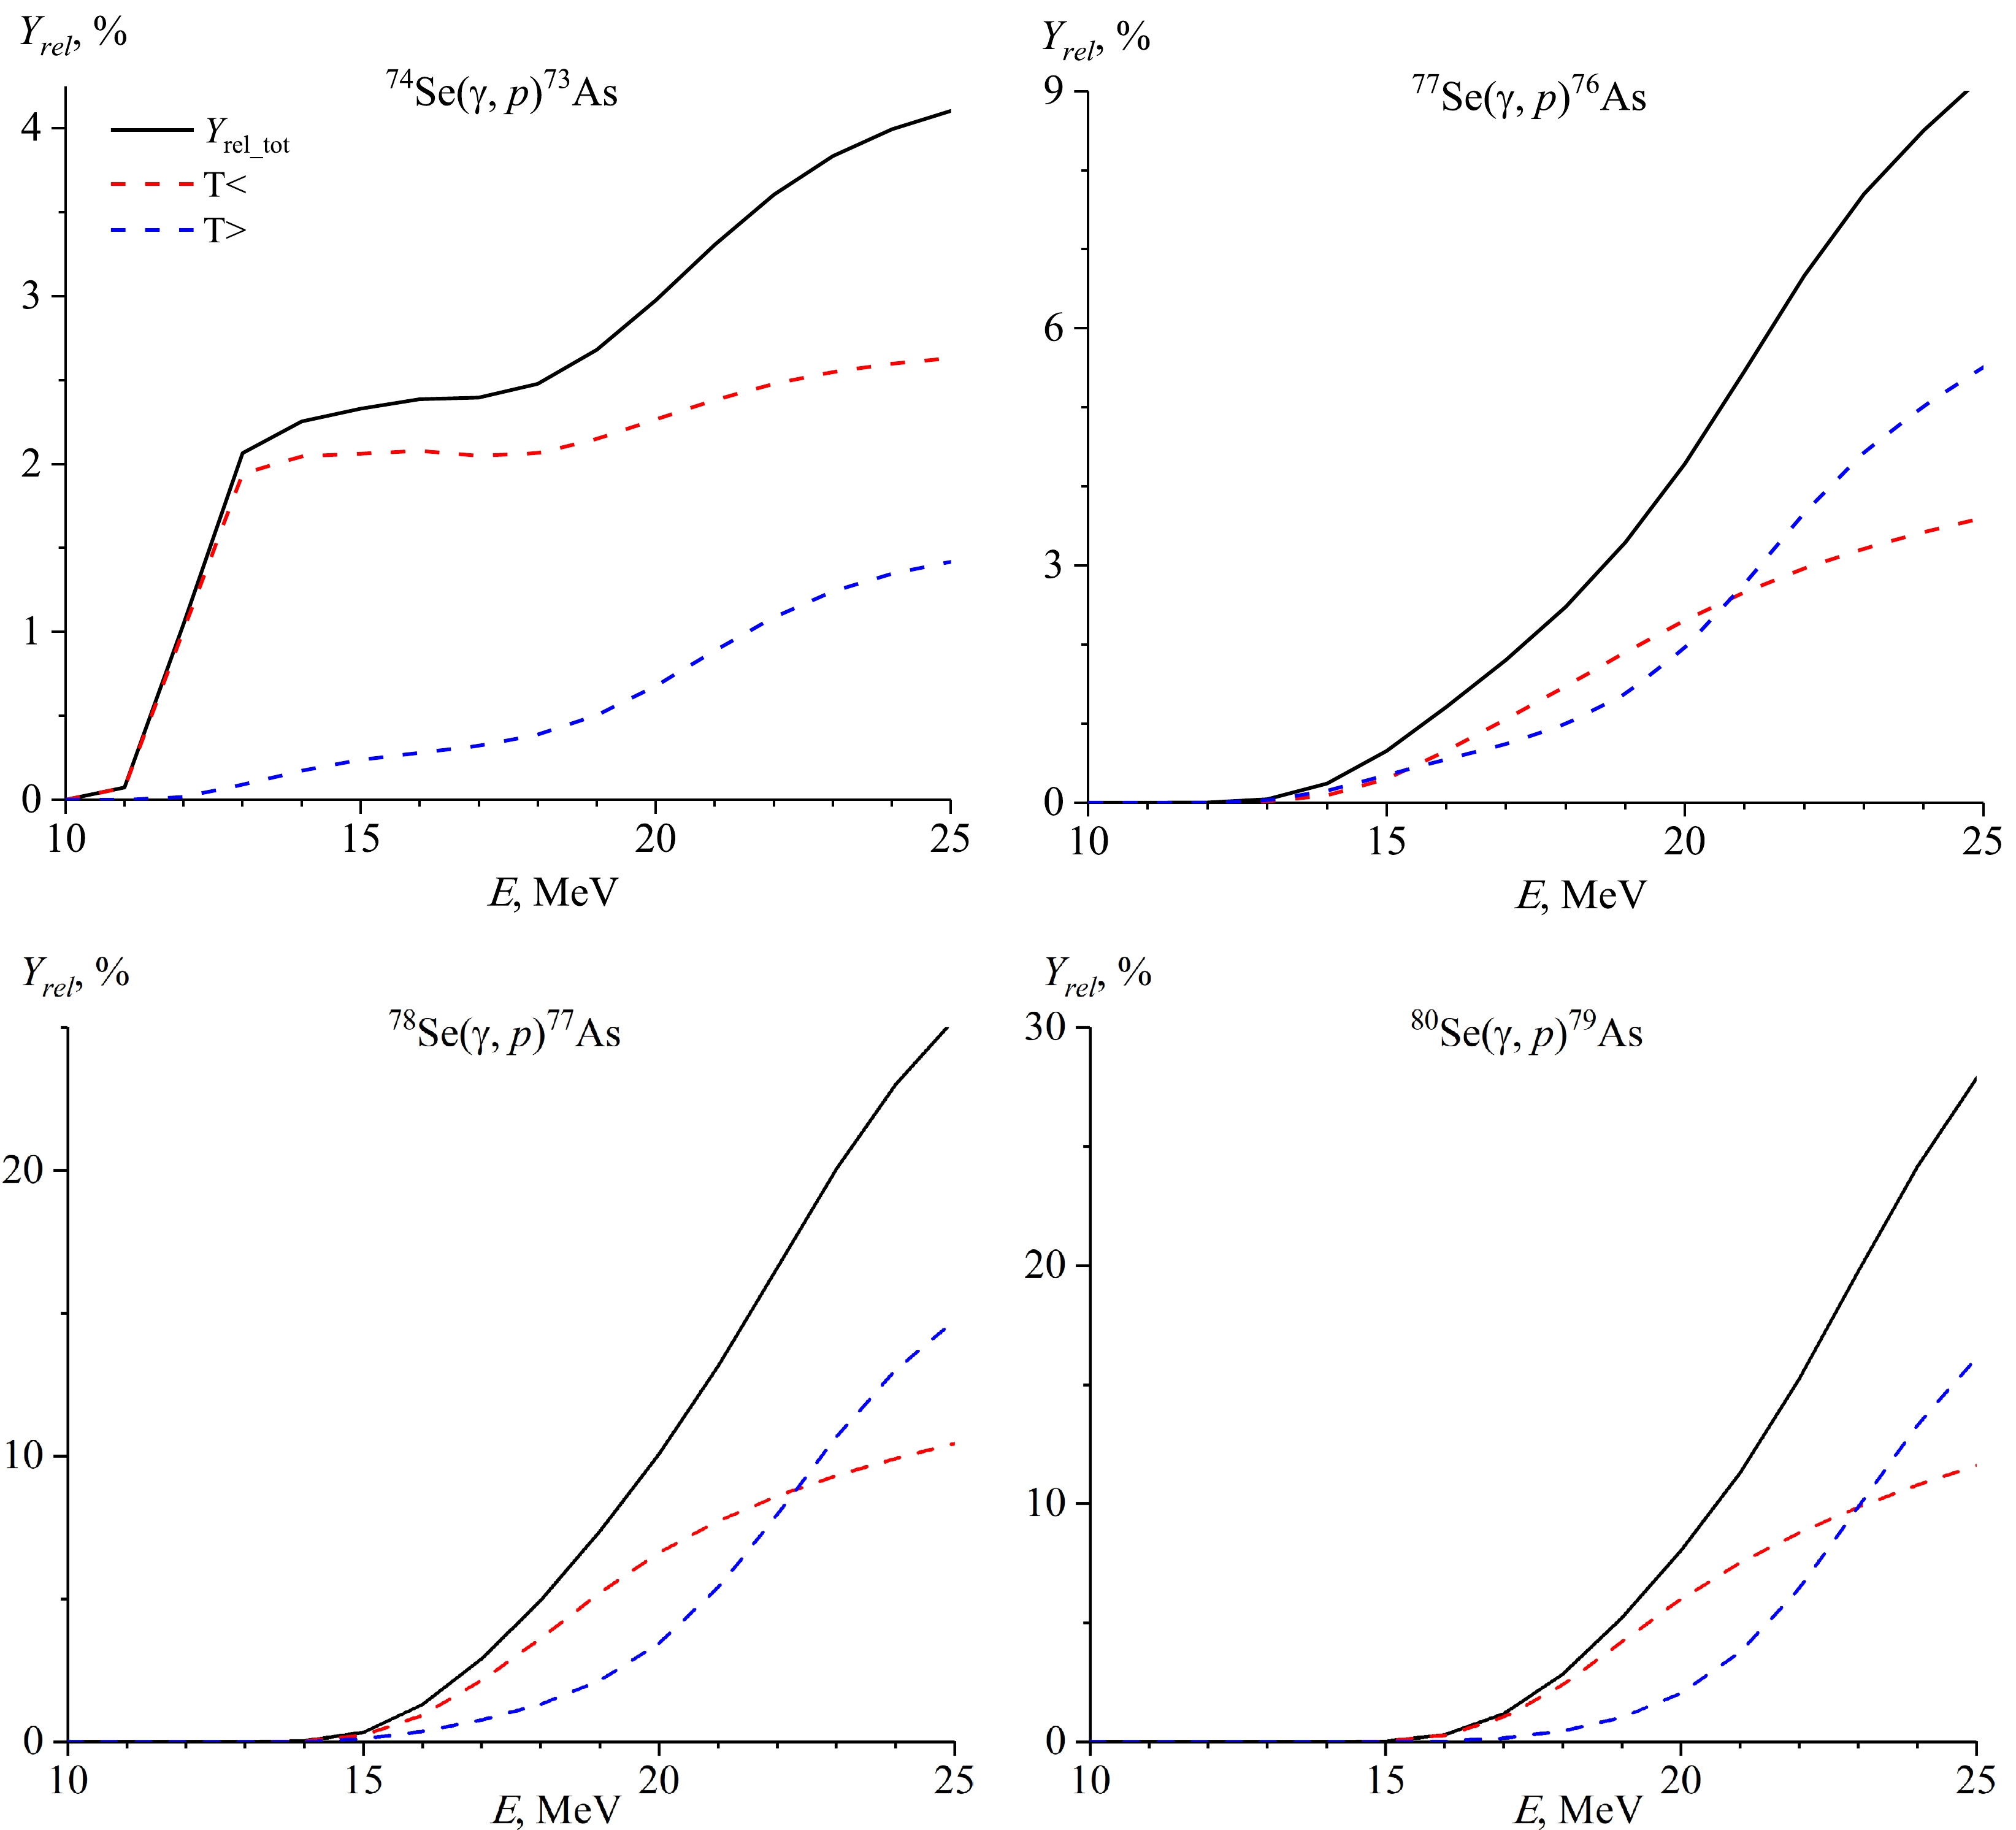
Figure 6. (color online) Contribution of the T< and T> components to the theoretical relative yields for photoproton reactions on a natural mixture of selenium isotopes.
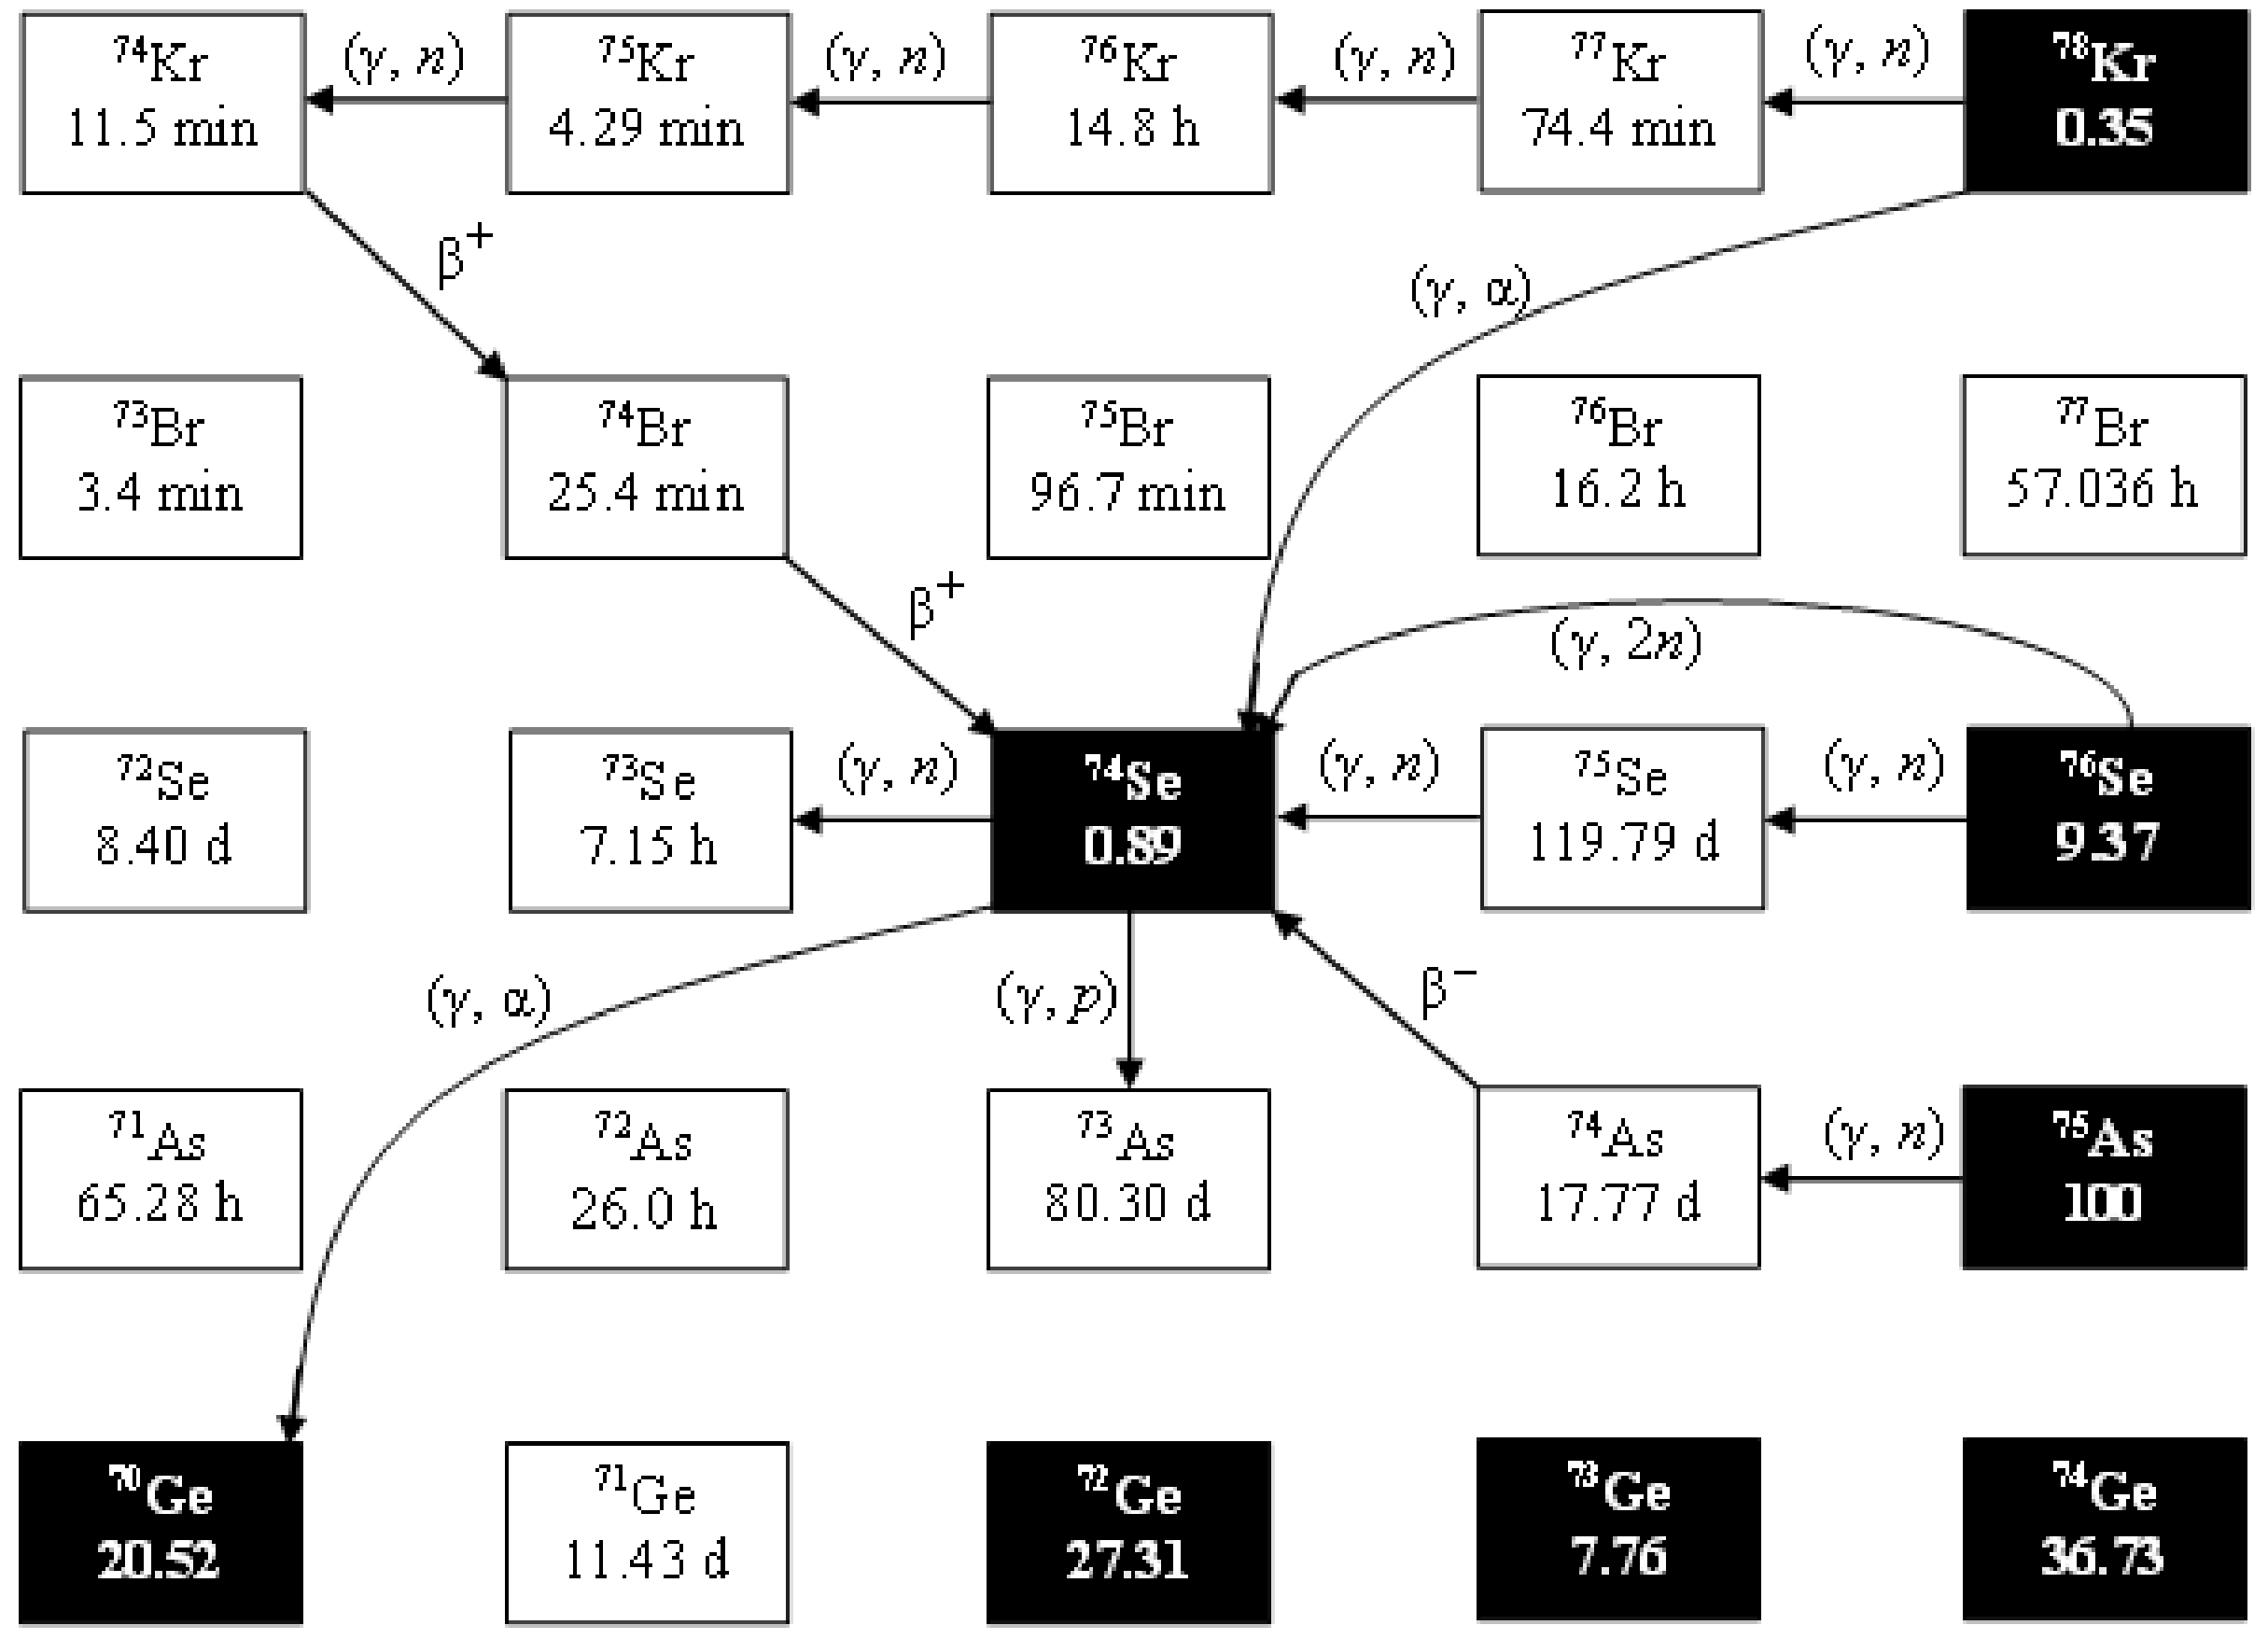
Among the nuclei heavier than 56Fe, the formation of a group of 35 neutron-deficient stable nuclei starting with 74Se, with very low abundance in the solar sistem, cannot be described by neutron capture reactions. Many production sites of the p-nuclei have been proposed: oxygen/neon layers of highly evolved massive stars during their presupernova phase [46] and during their supernova explosion [47], X-ray novae [48], neutrinodriven winds originating from a nascent neutron star shortly after supernova explosion [49], Type Ia supernova explosions [50], and helium-accreting CO white dwarfs of sub-Chandrasekhar mass [51]. Among them, the most promising is the oxygen/neon layers during a Type II supernova explosion. The p-nuclei are synthesized by the photodisintegration of s-nuclei (s-process seeds) produced in the layers during the core helium burning in the progenitor. The production of p-nuclei via the subsequent photodisintegration is referred to as a p-process [52]. Photonuclear reactions represent a threshold; therefore, a necessary condition for their occurrence is a high temperature T = 1 − 3.5 K [47], which is fulfilled when a shock wave passes through the layers of a pre-supernova star of the SnII type after the collapse of the supernova core [53−54]. For the synthesis of p-nuclei, in addition to the considered gamma-ray processes on equilibrium photons, other models have been proposed, such as nuclear reactions of proton capture (p, γ), (p, n), reactions under the influence of powerful fluxes of neutrino radiation from the stellar core, and reactions of rapid capture of protons accreted on the surface of a neutron star . To describe the formation and decay of p-nuclei as a result of photonuclear reactions, it is necessary to accurately know the yields of photoproton and photoneutron reactions, the correct calculation of which is impossible without taking into account the isospin splitting of the GDR. The p-process involves positron production and capture, proton capture, and (γ, n) or (p, n) reactions starting from the s- and r-isotopes as seed nuclei. Figure 7 shows the paths of the formation and decay of 74Se p-nuclide in stellar nucleosynthesis. Figure 8(a) shows the cross sections of (γ, 1n), (γ, 2n), and (γ, 3n) reactions corresponding to the isotopes 75Se, 76Se, and 77Se calculated based on the CMPR. According to the data shown in Fig. 8 (a), the main reactions of the formation of the isotope 74Se are (γ, 1n) and (γ, 2n). This leads to a significant buildup of the p-nucleus, assisted by a moderately strong 75As(γ, n)74As(β–)74Se branch.

Figure 8. (color online) (a) Cross sections of the (γ, 1n), (γ, 2n), and (γ, 3n) reactions corresponding to the isotopes 75Se, 76Se, and 77Se calculated based on TALYS. (b) Cross sections of the (γ, n), (γ, p), and (γ, α) reactions on the isotope 74Se calculated based on TALYS. (с) Relative yields of reactions with the emission of a neutron (open rectangles) and a proton (solid rectangles) as a function of bremsstrahlung end-point energy.
As shown in Fig 7, there are three competing pathways for the decay of 74Se: (γ, 1n) (12.07 MeV), (γ, 1p) (8.54 MeV), and (γ, α) (4.07 MeV). 74Se has a two-neutron separation energy (20.46 MeV) greater than 20 MeV, and thus, it cannot be destroyed via the (γ, 2n) reaction. To compare the main destruction channels of the bypassed nucleus, the cross sections of (γ, n), (γ, p), and (γ, α) reactions on the isotope 74Se calculated based on TALYS are shown in Fig. 8 (b). The calculated reaction cross sections at maximum GDR are 100, 35, and 3 mb, respectively. The results of our research will allow us to experimentally compare the 74Se(γ, 1n) and 74Se(γ, 1p) reactions. Figure 8 (c) shows the relative yields of the 74Se(γ, 1n) and 74Se(γ, 1p) reactions. As can be observed from Fig. 8 (c), the two main competing ways of decay of 74Se are almost equal. The reaction product 74Se(γ, α)70Ge is stable and it is impossible to estimate the probability of passing this reaction using the gamma activation method.
-
The present study addressed the measurements of relative yields for the photonuclear reactions on a natural mixture of selenium using bremsstrahlung end-point energies of 10 to 23 MeV. The bremsstrahlung photon flux was computed in the Geant4.11.1 code. The experimental results were compared with calculations using the TALYS model with the standard parameters and the CMPR. For the obtained photoneutron reactions, a good agreement was observed between the experimental relative yields and calculations according to the TALYS program and CMPR framework. For the photoproton reaction on the light isotope 74Se, there was no difference between the data calculated using TALYS and CMPR and the experimental values. On the heavy selenium isotopes, the theoretical relative yields calculated using the CMPR were much larger than the TALYS results. Including isospin splitting in the CMPR allows describing experimental data on reactions with proton escape in the energy range from 10 to 23 MeV. Therefore, taking into account isospin splitting is necessary for a correct description of the decay of the GDR. At the energy region above 25 MeV, in addition to isospin splitting, quadrupole resonance, the overtone of the giant resonance, and the quasideuteron mechanism make a significant contribution to the cross sections. The study of photonuclear reactions on selenium isotopes is important for understanding the formation and decay of bypassed nuclei during nucleosynthesis.
Photonuclear reactions on stable isotopes of selenium at bremsstrahlung end-point energies of 10−23 MeV
- Received Date: 2023-09-02
- Available Online: 2024-02-15
Abstract: In this study, experiments were performed at bremsstrahlung end-point energies of 10−23 MeV with the beam from the MT-25 microtron using the


 Abstract
 HTML
HTML Reference
 Related
 PDF
PDF






 DownLoad: