


 Abstract
 HTML
HTML Reference
 Related
 PDF
PDF


-
The neutron induced 10B reaction is one of the most important reactions in nuclear engineering, which includes neutron detection, reactor control, and boron neutron capture therapy (BNCT). [1]. In addition, the study of the n + 10B system can enhance our understanding of nuclear reaction mechanism in light nuclei [2]. In the neutron energy region below 1 MeV, the 10B(n, α)7Li reaction is dominant among neutron induced 10B reactions, which can be further divided into 10B(n, α0)7Li (Q = 2.79 MeV) and 10B(n, α1)7Li* (Q = 2.31 MeV) reactions, corresponding to the ground state and the first excited state of the residual nuclei 7Li. In the neutron energy region from thermal to 1 MeV, the cross sections of the 10B(n, α)7Li and 10B(n, α1)7Li* reactions have been adopted as standard cross sections [3]. However, in the MeV energy region and above, discrepancies exist among different measurements and evaluations because of the small cross sections, strong background interference, and mutual interference between the 10B(n, α0)7Li and 10B(n, α1)7Li* reactions. Accurate differential cross-section data are essential for nuclear technology applications. Therefore, high-precision measurements are required.
For neutron energy En ≤ 1.0 MeV, although numerous measurements of the 10B(n, α)7Li reaction have been conducted since 1954 [4], only four measurements of angular distribution and differential cross sections (i.e., Sealock [5], Stelts [6], Hambsch [2], and Jiang [7]) can be found in EXFOR [4]; for 1.0 < En ≤ 3.0 MeV, only two measurements of differential cross sections (Haoyu Jiang [7] and T.N.Massey [8]) can be found in EXFOR for this reaction [4]. In 2019, our team (Jiang et al. [7]) published the differential and angle-integrated cross sections of the 10B(n, α)7Li reaction for the neutron energy range from 1.0 eV to 2.5 MeV, measured at the China Spallation Neutron Source (CSNS) [9] Back streaming white neutron source (Back-n) [10, 11]. The measurement used 15 silicon detectors with angle positions ranging from 19.2° to 160.8° to detect charged particles. Under the same experimental conditions, our team (Bai et al. [12]) have also measured differential and angle-integrated cross sections of the 6Li(n, t)4He reaction, which have been used in the evaluations of standard cross sections. To reduce the uncertainties introduced from the neutron flux, our team (Liu et al. [13]) reanalyzed the measurement data and obtained the ratios of the differential and angle-integrated cross sections of the 10B(n, α)7Li reaction over the 6Li(n, t)4He reaction. Analysis shows that the relative uncertainties of these ratios are primarily attributed to the uncertainties in the results of the 10B(n, α)7Li reaction. Considering these factors, new and accurate measurements of differential and angle-integrated cross sections for the 10B(n, α)7Li reaction are necessary.
In the present study, new measurements of relative differential and angle-integrated cross sections were performed for the 10B(n, α1)7Li*, 10B(n, α0)7Li, and 10B(n, α)7Li reactions at CSNS Back-n white neutron source with optimized experimental conditions including thinner samples, thinner backing, stronger neutron fluences, and simultaneous monitoring of the neutron flux using the 6Li(n, t)4He reaction. In the remaining part of this paper, Section II briefly introduces the experimental setup, Section III presents the data analysis processes, and Section IV reports the results and conclusions.
-
Neutron induced 10B reaction is one of the most important reactions in the nuclear engineering, such as in neutron detection, reactor control, boron neutron capture therapy (BNCT), etc. [1]. In addition, the study of n + 10B system can enhance the understanding of nuclear reaction mechanism in light nuclei [2]. In the neutron energy region below 1 MeV, the 10B(n, α)7Li reaction is the dominate reaction among neutron induced 10B reactions, which can be further divided into 10B(n, α0)7Li (Q = 2.79 MeV) and 10B(n, α1)7Li* (Q = 2.31 MeV) reactions corresponding to the ground state and the first excited state of the residual nuclei 7Li. In the neutron energy region from thermal to 1 MeV, the cross sections of the 10B(n, α)7Li and 10B(n, α1)7Li* reactions have been adopted as the standard cross sections [3]. However, in the MeV energy region and above, discrepancies exist among the results of different measurements and evaluations, because of the small cross sections, strong background interference and mutual interference between the 10B(n, α0)7Li and 10B(n, α1)7Li* reactions. Accurate differential cross-section data are essential for nuclear technology applications. Therefore, high-precision measurements are demanded.
For neutron energy En ≤ 1.0 MeV, although numerous measurements of the 10B(n, α)7Li reaction have been conducted since 1954 [4], only four measurements of angular distribution and differential cross sections of the 10B(n, α)7Li reaction (i. e. Sealock [5], Stelts [6], Hambsch [2] and Haoyu Jiang [7]) can be found in EXFOR [4]; and for 1.0 < En ≤ 3.0 MeV, only two measurements of differential cross sections (Haoyu Jiang [7] and T.N.Massey [8]) for this reaction can be found in EXFOR [4]. In 2019, our team (Haoyu Jiang et al. [7]) published the differential and angle-integrated cross sections of the 10B(n, α)7Li reaction in the neutron energy range from 1.0 eV to 2.5 MeV measured at the China Spallation Neutron Source (CSNS) [9] Back streaming white neutron source (Back-n) [10,11]. The measurement used 15 silicon detectors with angle positions ranging from 19.2o to 160.8o to detect the charged particles. Under the same experimental conditions, our team (Huaiyong Bai et al. [12]) have also measured differential and angle-integrated cross sections of the 6Li(n, t)4He reaction, which have been used in the evaluations of the standard cross sections. To reduce the uncertainties introduced from the neutron flux, our team (Jie Liu et al. [13]) reanalyzed the measurement data and obtained the ratios of the differential and angle-integrated cross sections of the 10B(n, α)7Li reaction over the 6Li(n, t)4He reaction. Analysis shows that the relative uncertainties of these ratios are primarily contributed from the uncertainties in results of the 10B(n, α)7Li reaction. Taking these factors into consideration, new and accurate measurements of differential and angle-integrated cross sections for the 10B(n, α)7Li reaction are necessary.
In the present work, new measurements of relative differential and angle-integrated cross sections were performed for the 10B(n, α1)7Li*, 10B(n, α0)7Li and 10B(n, α)7Li reactions at CSNS Back-n white neutron source with optimized experimental conditions including thinner samples, thinner backing, stronger neutron fluences and simultaneous monitoring of the neutron flux using the 6Li(n, t)4He reaction. In the remaining part of this paper, Section II briefly introduces the experimental setup. Section III presents the data analysis processes, and Section IV reports the results and conclusions.
-
The neutron induced 10B reaction is one of the most important reactions in nuclear engineering, which includes neutron detection, reactor control, and boron neutron capture therapy (BNCT). [1]. In addition, the study of the n + 10B system can enhance our understanding of nuclear reaction mechanism in light nuclei [2]. In the neutron energy region below 1 MeV, the 10B(n, α)7Li reaction is dominant among neutron induced 10B reactions, which can be further divided into 10B(n, α0)7Li (Q = 2.79 MeV) and 10B(n, α1)7Li* (Q = 2.31 MeV) reactions, corresponding to the ground state and the first excited state of the residual nuclei 7Li. In the neutron energy region from thermal to 1 MeV, the cross sections of the 10B(n, α)7Li and 10B(n, α1)7Li* reactions have been adopted as standard cross sections [3]. However, in the MeV energy region and above, discrepancies exist among different measurements and evaluations because of the small cross sections, strong background interference, and mutual interference between the 10B(n, α0)7Li and 10B(n, α1)7Li* reactions. Accurate differential cross-section data are essential for nuclear technology applications. Therefore, high-precision measurements are required.
For neutron energy En ≤ 1.0 MeV, although numerous measurements of the 10B(n, α)7Li reaction have been conducted since 1954 [4], only four measurements of angular distribution and differential cross sections (i.e., Sealock [5], Stelts [6], Hambsch [2], and Jiang [7]) can be found in EXFOR [4]; for 1.0 < En ≤ 3.0 MeV, only two measurements of differential cross sections (Haoyu Jiang [7] and T.N.Massey [8]) can be found in EXFOR for this reaction [4]. In 2019, our team (Jiang et al. [7]) published the differential and angle-integrated cross sections of the 10B(n, α)7Li reaction for the neutron energy range from 1.0 eV to 2.5 MeV, measured at the China Spallation Neutron Source (CSNS) [9] Back streaming white neutron source (Back-n) [10, 11]. The measurement used 15 silicon detectors with angle positions ranging from 19.2° to 160.8° to detect charged particles. Under the same experimental conditions, our team (Bai et al. [12]) have also measured differential and angle-integrated cross sections of the 6Li(n, t)4He reaction, which have been used in the evaluations of standard cross sections. To reduce the uncertainties introduced from the neutron flux, our team (Liu et al. [13]) reanalyzed the measurement data and obtained the ratios of the differential and angle-integrated cross sections of the 10B(n, α)7Li reaction over the 6Li(n, t)4He reaction. Analysis shows that the relative uncertainties of these ratios are primarily attributed to the uncertainties in the results of the 10B(n, α)7Li reaction. Considering these factors, new and accurate measurements of differential and angle-integrated cross sections for the 10B(n, α)7Li reaction are necessary.
In the present study, new measurements of relative differential and angle-integrated cross sections were performed for the 10B(n, α1)7Li*, 10B(n, α0)7Li, and 10B(n, α)7Li reactions at CSNS Back-n white neutron source with optimized experimental conditions including thinner samples, thinner backing, stronger neutron fluences, and simultaneous monitoring of the neutron flux using the 6Li(n, t)4He reaction. In the remaining part of this paper, Section II briefly introduces the experimental setup, Section III presents the data analysis processes, and Section IV reports the results and conclusions.
-
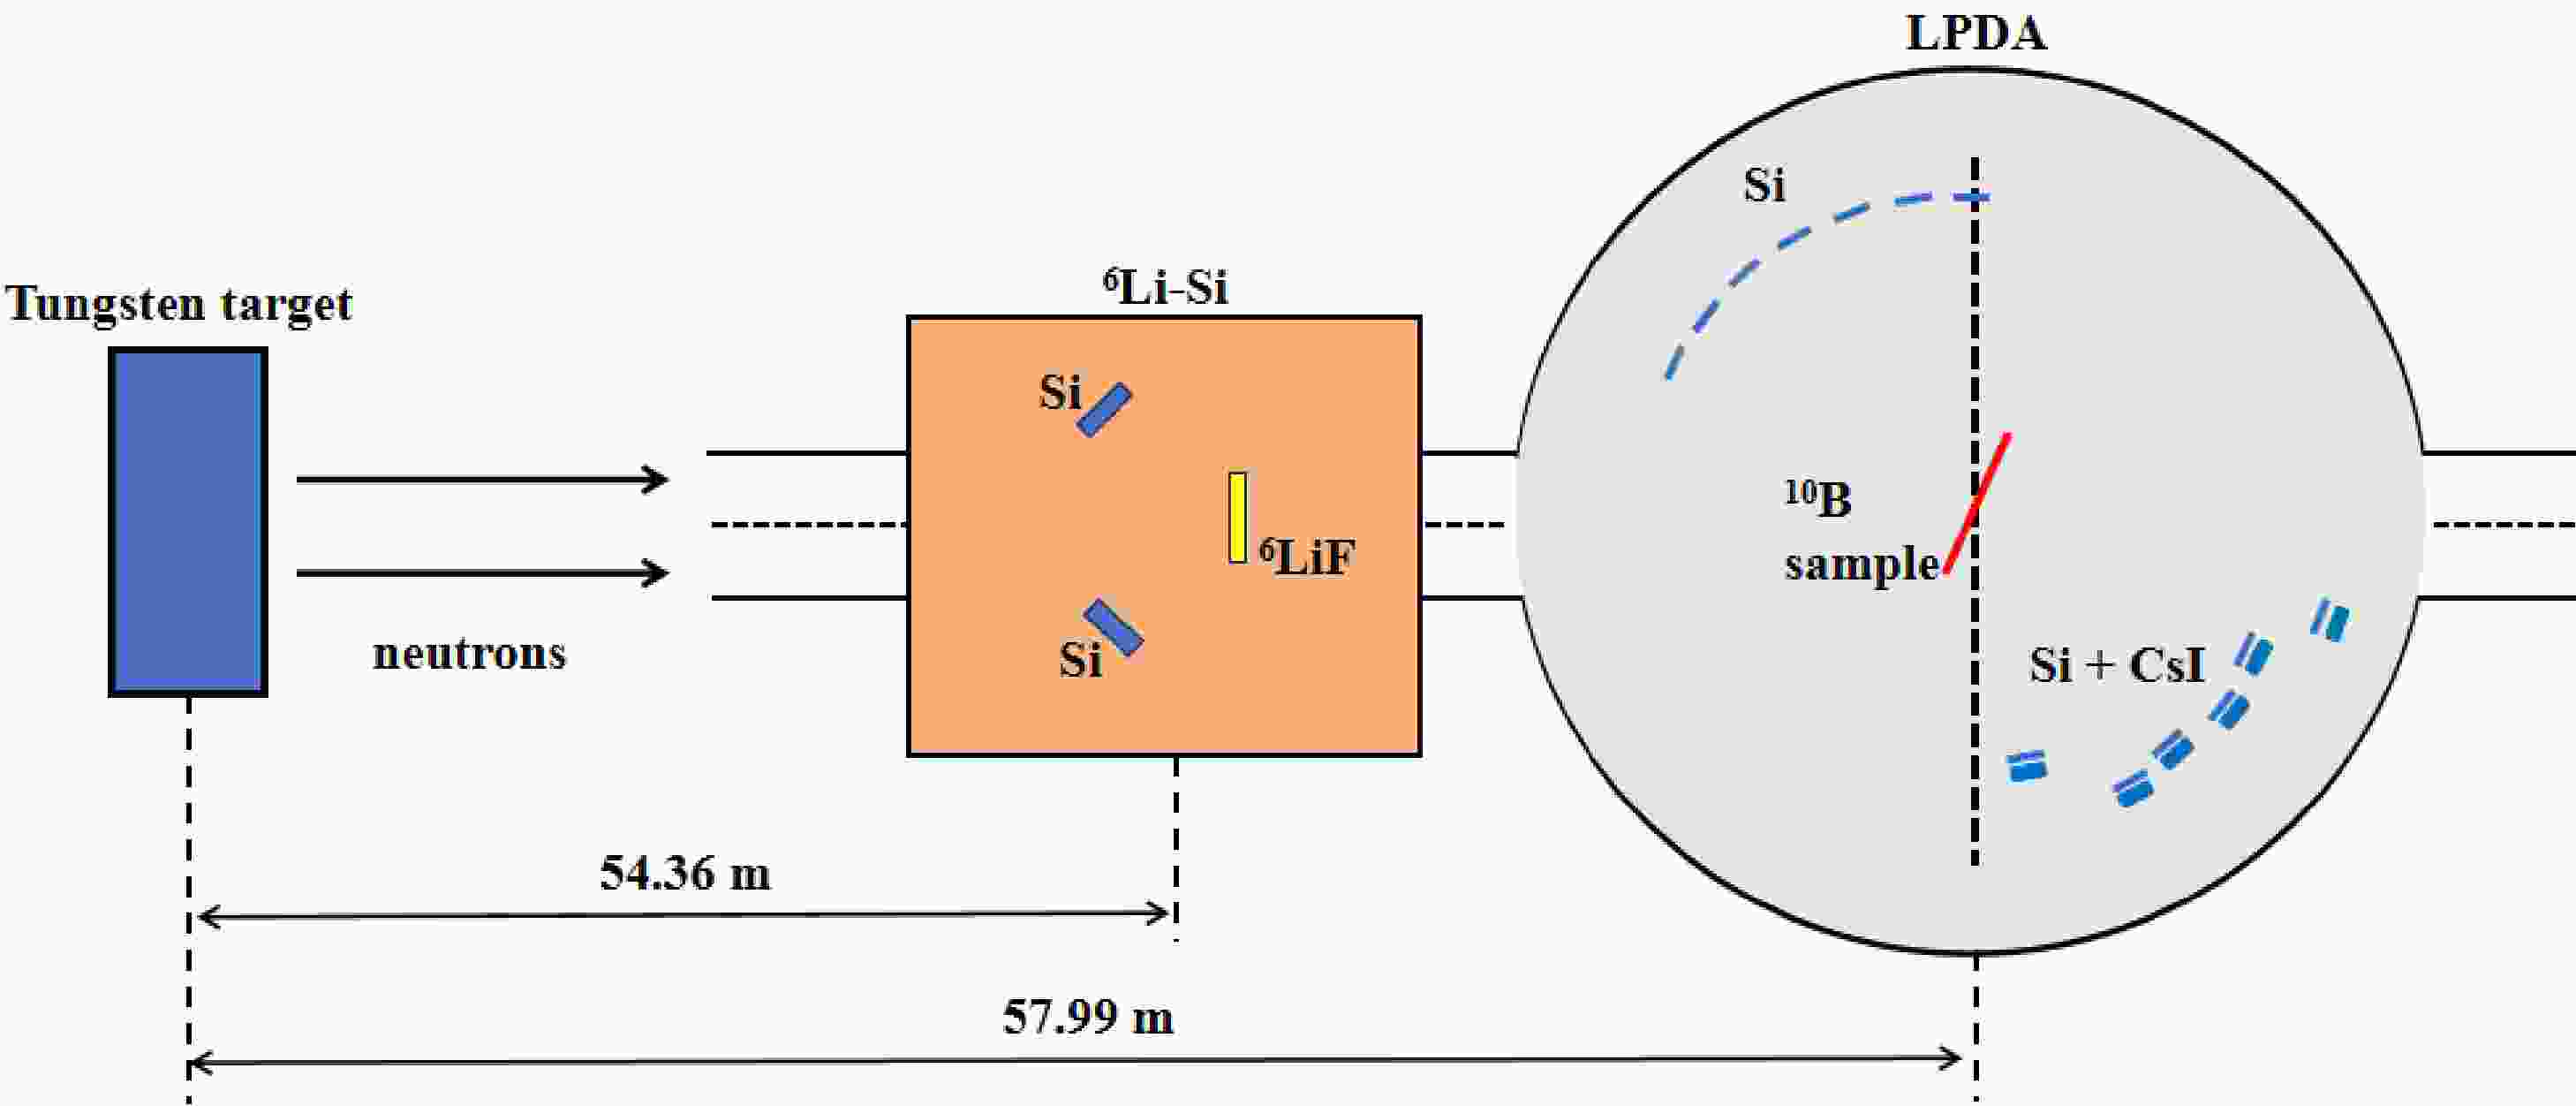
The experiment was performed at EndStation#1 of the CSNS Back-n white neutron source in 2024. As shown in Fig. 1, the setup includes three components: the neutron source, the 10B samples, and the charged particle detectors (including the 6Li-Si monitor and the Light-charged Particle Detector Array (LPDA) system).
Figure 1. (color online) The sketch of the experimental setup.
-
The experiment was performed at EndStation#1 of the CSNS Back-n white neutron source in 2024. As shown in the sketch in Fig. 1, the experimental setup includes three components: the neutron source, the 10B samples and the charged particle detectors (including the 6Li-Si monitor and the Light-charged Particle Detector Array (LPDA) system).
Figure 1. (color online) The sketch of the experimental setup.
-
The experiment was performed at EndStation#1 of the CSNS Back-n white neutron source in 2024. As shown in Fig. 1, the setup includes three components: the neutron source, the 10B samples, and the charged particle detectors (including the 6Li-Si monitor and the Light-charged Particle Detector Array (LPDA) system).
Figure 1. (color online) The sketch of the experimental setup.
-
The CSNS Back-n white neutrons were generated using a proton beam (1.6 GeV) bombarding a tungsten target, with neutron energy range spanning from 0.3 eV to 300 MeV [11]. The repetition rate of the beam pulse was 25 Hz, the full width at half maximum (FWHM) was ~70 ns, and the interval between the double proton bunches was 410 ns [14]. During the present experiment, the beam power was ~ 160 kW. The flight path from the spallation target to the samples was 57.99 m. In the EndStation#1 of the CSNS Back-n white neutron source, there are three configuration of the shutter and the Collimator-1. To achieve a balance between high count rates and low background interference, the intermediate configuration of Ø50 mm (shutter) + Ø15 mm (collimator 1) [15] was selected. In contrast to the largest (Ø50 mm (shutter) + Ø50 mm (collimator 1)) and smallest (Ø12 mm (shutter) + Ø15 mm (collimator 1)) configurations, this intermediate setup is less commonly used, and its neutron flux data have not been previously published. For this configuration, the neutron beam spot size was approximately 22 mm. Since the present measurement was performed in the double-bunch mode [16], the unfolding process is necessary in the data analysis.
-
The CSNS Back-n white neutrons was generated by a proton beam (1.6 GeV) bombarding a tungsten target, with neutron energy range spanning from 0.3 eV to 300 MeV [11]. The repetition rate of the beam pulse was 25 Hz, the full width at half maximum (FWHM) of the pulse was ~70 ns and the interval between the double proton bunches was 410 ns [14]. During the present experiment, the beam power was ~ 160 kW. The flight path from the spallation target to the samples was 57.99 m. In the EndStation#1 of the CSNS Back-n white neutron source, there are three configuration of the shutter and the Collimator-1. To achieve a balance between high count rates and low background interference, the intermediate configuration of Ø50 mm (shutter) + Ø15 mm (collimator 1) [15] was selected. In contrast to the largest (Ø50 mm (shutter) + Ø50 mm (collimator 1)) and smallest (Ø12 mm (shutter) + Ø15 mm (collimator 1)) configurations, this intermediate setup is less commonly used, and its neutron flux data have not been previously published. Under this selected configuration, the neutron beam spot size is approximately 22 mm. Since the present measurement was performed under double-bunch mode [16], the unfolding process is necessary in the data analysis.
-
The CSNS Back-n white neutrons were generated using a proton beam (1.6 GeV) bombarding a tungsten target, with neutron energy range spanning from 0.3 eV to 300 MeV [11]. The repetition rate of the beam pulse was 25 Hz, the full width at half maximum (FWHM) was ~70 ns, and the interval between the double proton bunches was 410 ns [14]. During the present experiment, the beam power was ~ 160 kW. The flight path from the spallation target to the samples was 57.99 m. In the EndStation#1 of the CSNS Back-n white neutron source, there are three configuration of the shutter and the Collimator-1. To achieve a balance between high count rates and low background interference, the intermediate configuration of Ø50 mm (shutter) + Ø15 mm (collimator 1) [15] was selected. In contrast to the largest (Ø50 mm (shutter) + Ø50 mm (collimator 1)) and smallest (Ø12 mm (shutter) + Ø15 mm (collimator 1)) configurations, this intermediate setup is less commonly used, and its neutron flux data have not been previously published. For this configuration, the neutron beam spot size was approximately 22 mm. Since the present measurement was performed in the double-bunch mode [16], the unfolding process is necessary in the data analysis.
-
Two enriched (90%) 10B samples were used back-to-back, plated on an aluminum backing with a thickness of 10 μm. The sample data are presented in Table 1, and the corresponding images are shown in Fig. 2. In addition, a 10 μm thick aluminum sheet without samples was used for background measurements. The LPDA sample holder had four sample positions. The 241Am α sources (for energy calibration of the detection system), the 10B samples, and the aluminum sheet were installed at different sample positions [7].
Sample position Sample Thickness/(μg·cm−2) Diameter/mm Forward 10B 69.5 50 Backward 10B 73.0 50 Table 1. Sample characteristics.
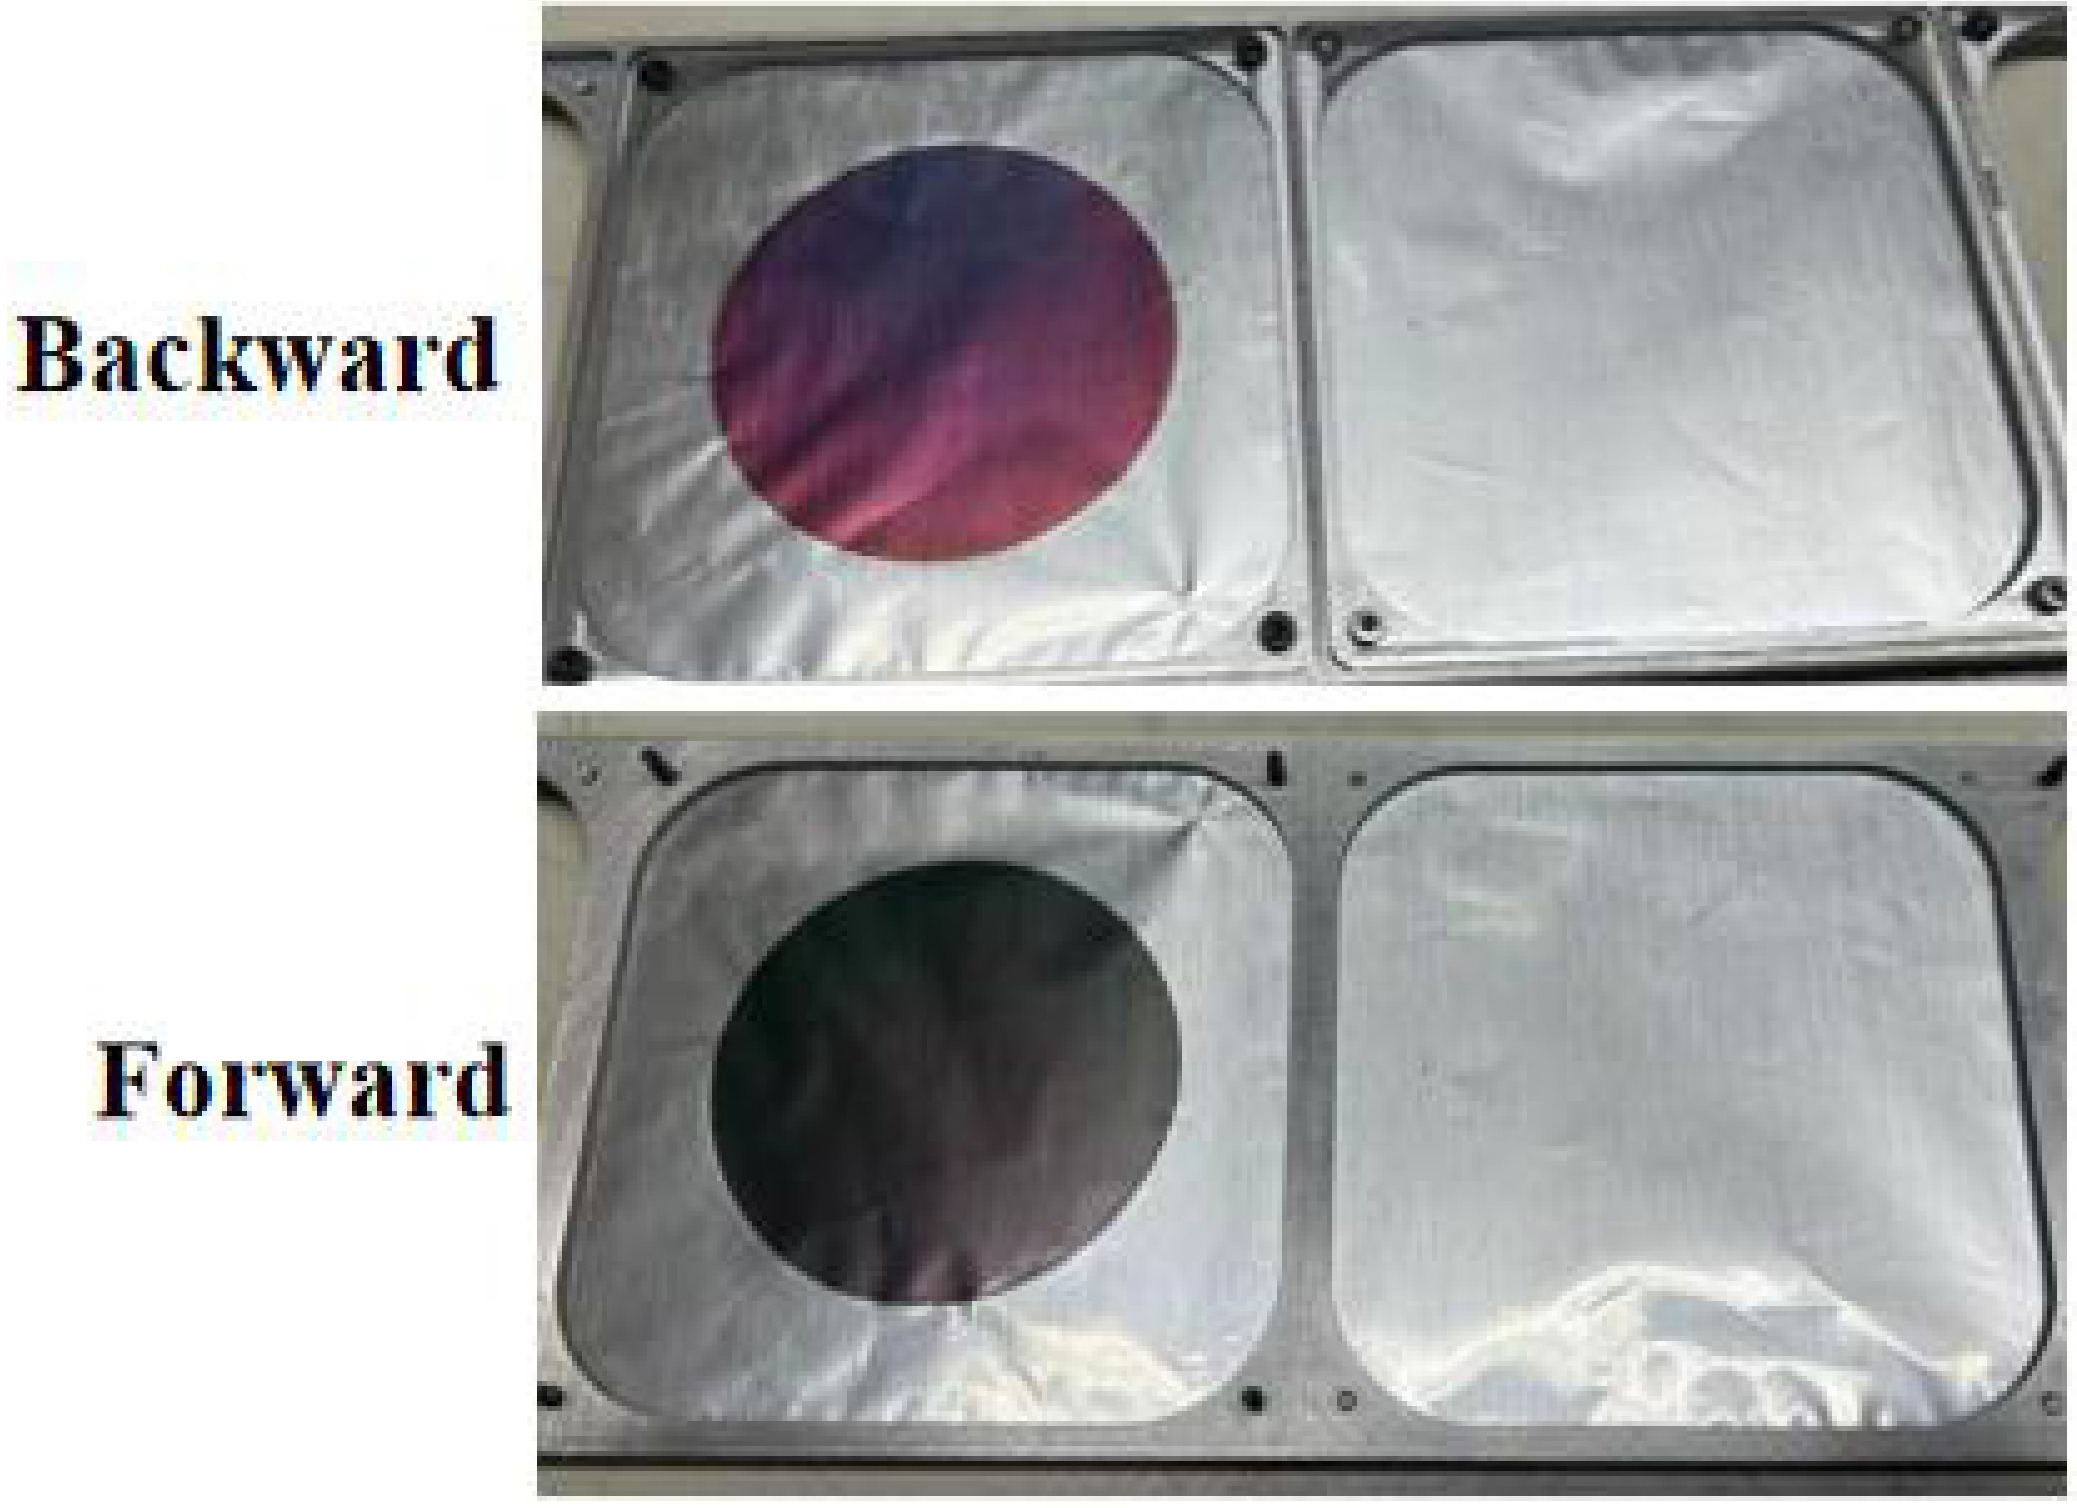
Figure 2. (color online) Images of the 10B samples.
-
Two enriched (90%) 10B samples were used back-to-back, plated on an aluminum backing with a thickness of 10 μm. The sample data are presented in Table 1, and the corresponding images are shown in Fig. 2. In addition, a 10 μm thick aluminum sheet without samples was used for background measurements. The LPDA sample holder had four sample positions. The 241Am α sources (for energy calibration of the detection system), the 10B samples, and the aluminum sheet were installed at different sample positions [7].
Sample position Sample Thickness/(μg·cm−2) Diameter/mm Forward 10B 69.5 50 Backward 10B 73.0 50 Table 1. Sample characteristics.
Figure 2. (color online) Images of the 10B samples.
-
Two enriched (90%) 10B samples were used back-to-back plated on an aluminum backing 10 μm in thickness. The data of the samples are presented in Table 1, and the pictures are shown in Fig. 2. In additions, an aluminum sheet 10 μm in thickness without samples were also used for background measurement. The LPDA sample holder has four sample positions. The 241Am α sources (for energy calibration of the detection system), the 10B samples and the aluminum sheet were installed at different sample positions [7].
Sample position Sample Thickness (μg/cm2) diameter (mm) Forward 10B 69.5 50 Backward 10B 73.0 50 Table 1. Sample characteristics
Figure 2. (color online) The pictures of the 10B samples.
-
Two enriched (90%) 10B samples were used back-to-back, plated on an aluminum backing with a thickness of 10 μm. The sample data are presented in Table 1, and the corresponding images are shown in Fig. 2. In addition, a 10 μm thick aluminum sheet without samples was used for background measurements. The LPDA sample holder had four sample positions. The 241Am α sources (for energy calibration of the detection system), the 10B samples, and the aluminum sheet were installed at different sample positions [7].
Sample position Sample Thickness/(μg·cm−2) Diameter/mm Forward 10B 69.5 50 Backward 10B 73.0 50 Table 1. Sample characteristics.
Figure 2. (color online) Images of the 10B samples.
-
As shown in Fig. 1, a 6Li-Si [17] monitor (an array of silicon detectors and a 6LiF sample) inside the neutron tube was used to measure the relative neutron flux through the 6Li(n, t)4He reaction. A 6LiF sample (~350 μg/cm2 thick, ~90% enrichment, 60 mm diameter) deposited on a 10 μm thick aluminum backing film was used. The neutron attenuation of the aluminum backing film was less than 0.15% [17]. The 6Li-Si monitor consisted of the 6LiF sample and the 8 silicon detectors, each with a thickness of 300 μm and a sensitive area of 20 mm × 20 mm. The eight silicon detectors were isotropically distributed around the 6LiF sample at 135° relative to the beam direction.
The Light-charged Particle Detector Array (LPDA) system [18] was used to detect charged particles, as shown in Fig. 1. In the present work, 13 individual silicon detectors (25 mm × 25 mm × 300 μm) were utilized, comprising six forward detectors and seven backward detectors, to cover the particle emission angle from 20.1° to 158.3°. In addition, six cesium iodide scintillator (CsI(Tl)) detectors were installed behind the six forward silicon detectors for measuring the events of the 10B(n, t2α) reaction. The distributions of the receiving angles of the 13 silicon detectors with respect to the 10B samples are shown in Fig. 3, and their solid angles are (0.00792 ~ 0.0289) sr according to Monte Carlo simulations using Geant4 code [19]. The uncertainties of the receiving angles were obtained by fitting each curve with a Gaussian function. Signals from the 6Li-Si monitor and LPDA detectors were delivered to the Back-n general purpose data acquisition system (DAQ) [20].
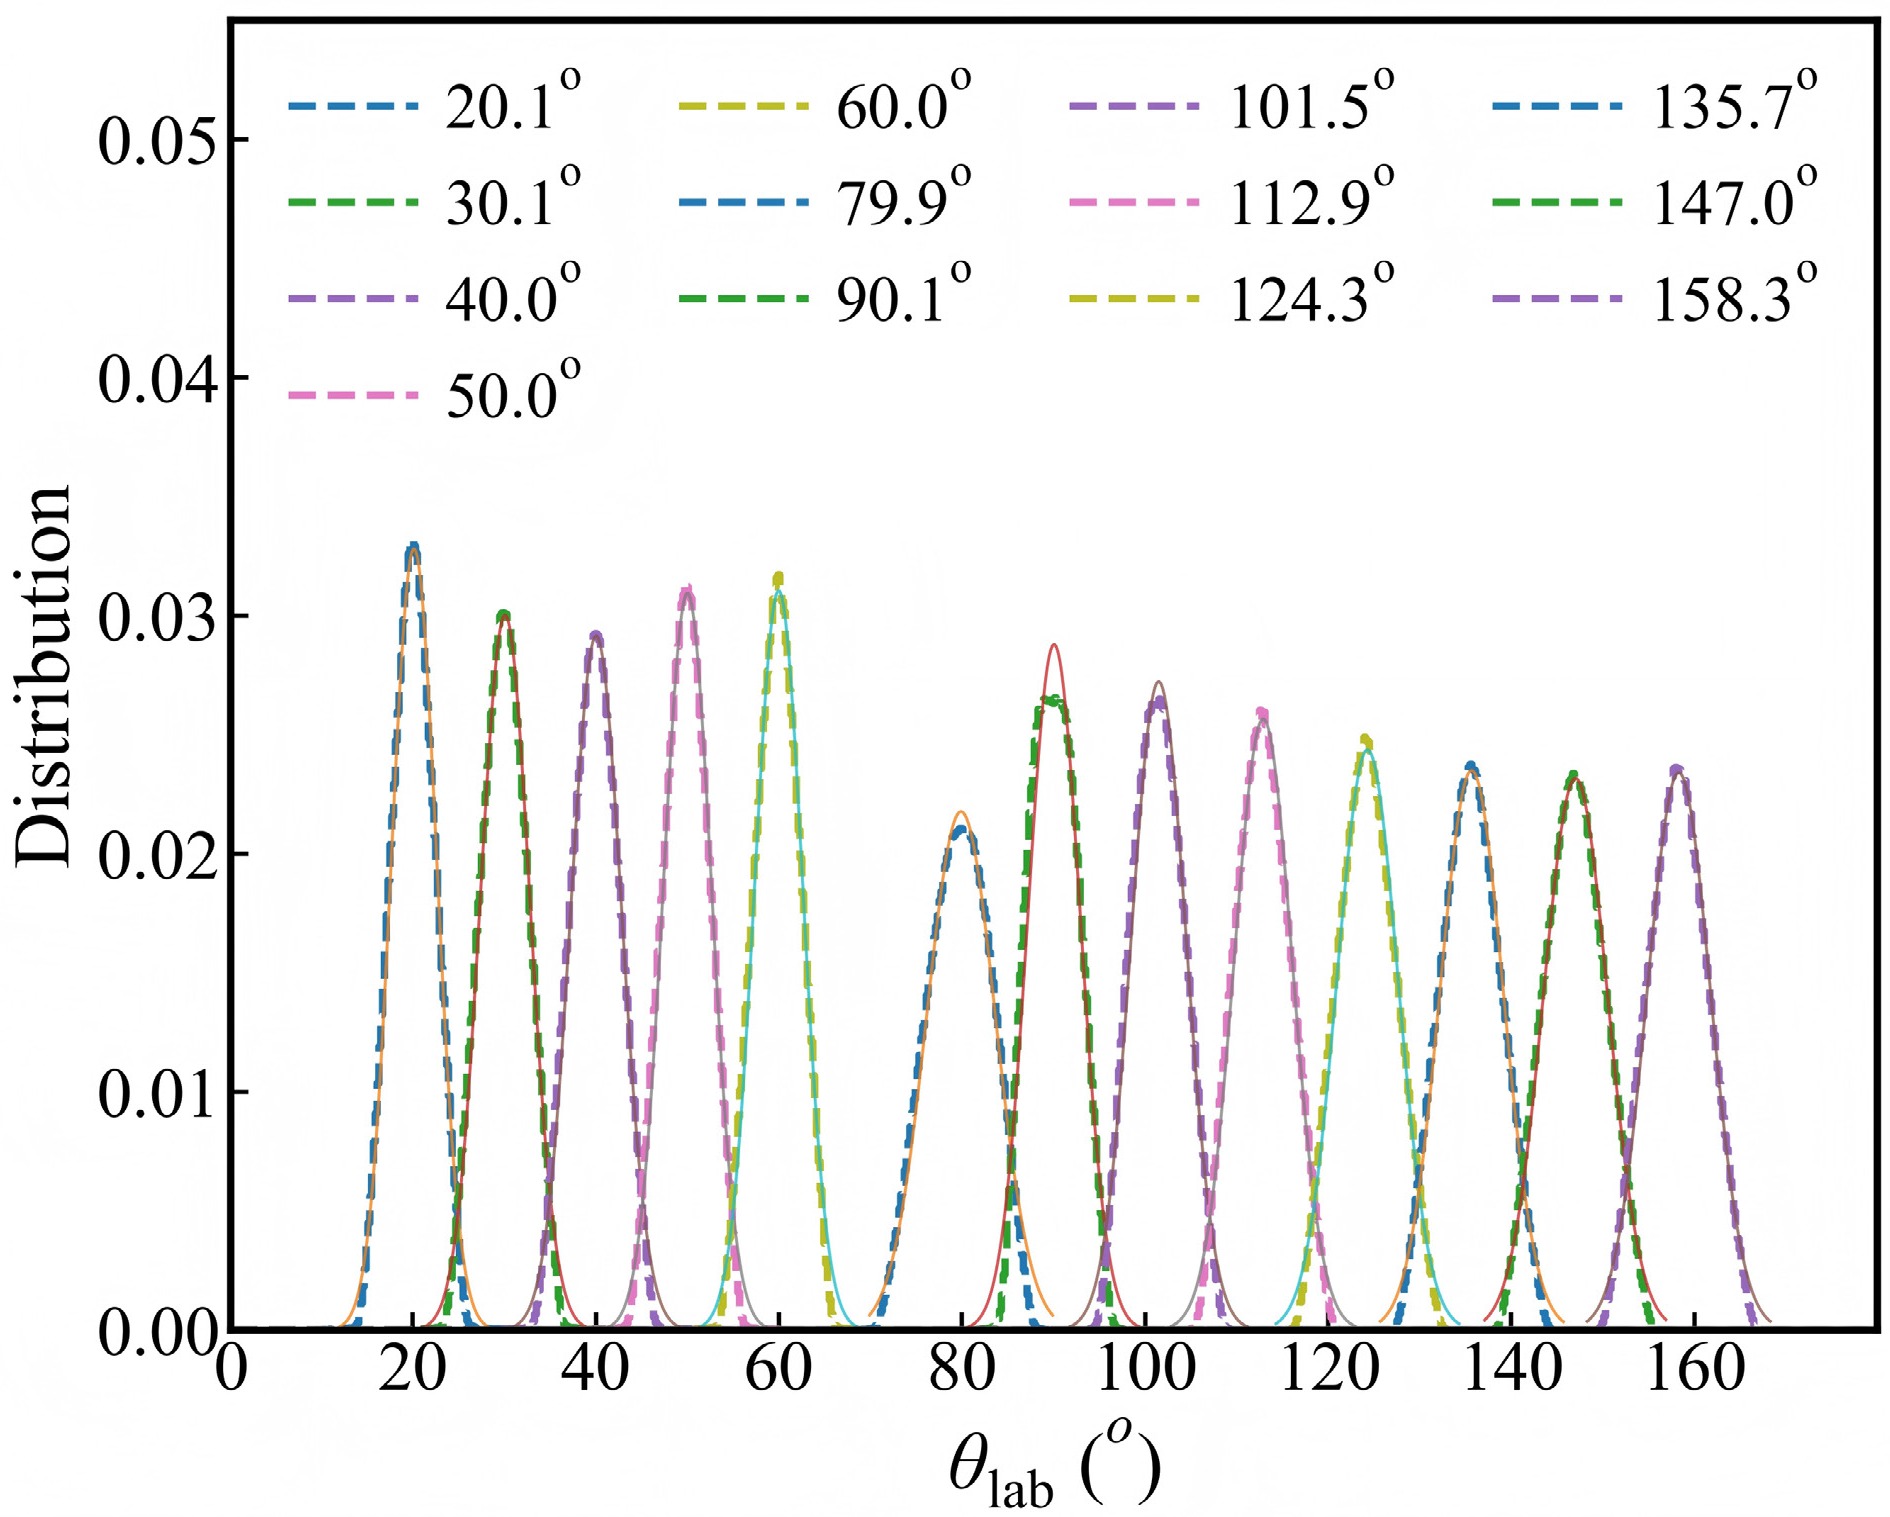
Figure 3. (color online) Simulated distributions of the receiving angles of the silicon detectors.
In the present experiment, the 10B samples and the aluminum backing sheet were measured alternately, and the ratio of their measurement durations was approximately 3:1. The beam duration for each turn was ~24 h, and the total beam duration was ~ 240 h.
-
As shown in Fig. 1, a 6Li-Si [17] monitor (an array of silicon detectors together with a 6LiF sample) inside the neutron tube was used to measure the relative neutron flux through the 6Li(n, t)4He reaction. A 6LiF sample (~350 μg/cm2 in thickness, ~90% in enrichment, 60 mm in diameter) deposited on a 10 μm thick aluminum backing film was used. The neutron attenuation of the aluminum backing film is less than 0.15% [17]. This 6Li-Si monitor consists of the 6LiF sample and the 8 silicon detectors each with a thickness of 300 μm and a sensitive area of 20 mm × 20 mm. The eight silicon detectors are isotropically distributed around the 6LiF sample at 135o relative to the beam direction.
The Light-charged Particle Detector Array (LPDA) system [18] was used to detect charged particles, as shown in Fig. 1. In the present work, 13 individual silicon detectors (25 mm × 25 mm × 300 μm) were implemented, comprising six forward detectors and seven backward detectors, which could cover the particle emission angle from 20.2o to 160.8o. In addition, six cesium iodide scintillator (CsI(Tl)) detectors were also installed behind the six forward silicon detectors intending to measure the events of the 10B(n, t2α) reaction. The distributions of the receiving angles of the 13 silicon detectors with respect to the 10B samples are shown in Fig. 3 and their solid angles were (0.00792 ~ 0.0289) sr according to Monte Carlo simulations using Geant4 code [19]. The uncertainties of the receiving angles were obtained by fitting each curve with a Gaussian function. Signals from the 6Li-Si monitor and LPDA detectors were delivered to the Back-n general purpose data acquisition system (DAQ) [20] for data acquisition.
Figure 3. (color online) The simulated distributions of the receiving angles of the silicon detectors.
In the present experiment, the measurements of the 10B samples and the aluminum backing sheet were conducted alternately, and the ratio of their measurement durations was about 3:1. The beam duration for each turn was ~24 h, and the total beam duration was ~ 240 h.
-
As shown in Fig. 1, a 6Li-Si [17] monitor (an array of silicon detectors and a 6LiF sample) inside the neutron tube was used to measure the relative neutron flux through the 6Li(n, t)4He reaction. A 6LiF sample (~350 μg/cm2 thick, ~90% enrichment, 60 mm diameter) deposited on a 10 μm thick aluminum backing film was used. The neutron attenuation of the aluminum backing film was less than 0.15% [17]. The 6Li-Si monitor consisted of the 6LiF sample and the 8 silicon detectors, each with a thickness of 300 μm and a sensitive area of 20 mm × 20 mm. The eight silicon detectors were isotropically distributed around the 6LiF sample at 135° relative to the beam direction.
The Light-charged Particle Detector Array (LPDA) system [18] was used to detect charged particles, as shown in Fig. 1. In the present work, 13 individual silicon detectors (25 mm × 25 mm × 300 μm) were utilized, comprising six forward detectors and seven backward detectors, to cover the particle emission angle from 20.1° to 158.3°. In addition, six cesium iodide scintillator (CsI(Tl)) detectors were installed behind the six forward silicon detectors for measuring the events of the 10B(n, t2α) reaction. The distributions of the receiving angles of the 13 silicon detectors with respect to the 10B samples are shown in Fig. 3, and their solid angles are (0.00792 ~ 0.0289) sr according to Monte Carlo simulations using Geant4 code [19]. The uncertainties of the receiving angles were obtained by fitting each curve with a Gaussian function. Signals from the 6Li-Si monitor and LPDA detectors were delivered to the Back-n general purpose data acquisition system (DAQ) [20].
Figure 3. (color online) Simulated distributions of the receiving angles of the silicon detectors.
In the present experiment, the 10B samples and the aluminum backing sheet were measured alternately, and the ratio of their measurement durations was approximately 3:1. The beam duration for each turn was ~24 h, and the total beam duration was ~ 240 h.
-
The differential cross sections of the 10B(n, α)7Li reaction can be calculated as follows:
$ \begin{aligned}[b]\frac{\text{d}\sigma }{\text{d}\Omega }\left({E}_{n},\theta {}_{\text{lab}}\right)=\;&{\varepsilon }_{\text{nor}}\cdot \frac{\text{d}\sigma }{\text{d}\Omega }{\left({E}_{n},\theta {}_{\text{lab}}\right)}_{\text{realtive}}\\=\;&{\varepsilon }_{\text{nor}}\cdot \frac{{N}_{\alpha }({E}_{n},\theta {}_{\text{lab}})}{I({E}_{n})\cdot {N}_{\text{c}}\cdot \Delta \Omega \cdot {\varepsilon }_{\text{d}}}, \end{aligned}$
(1) where En is the neutron energy, θlab is the emission angle of the α particle in the laboratory reference system, Nα(En, θlab) is the α particle count in an energy bin centered at En and in the angle bin centered at θlab, I(En) is the relative neutron fluence in each neutron energy bin, Nc is the 10B atom number in the sample, ∆Ω is the solid angle of each silicon detector in the LPDA, and εd is the detection efficiency of each silicon detector. Owing to the lack of an absolute neutron fluence and the non-uniformity correction of the neutron beam, the normalization factor (εnor) was determined in the neutron energy range from 0.5 eV to 1.5 eV, based on the evaluated data from IAEA-Std17 [3], which is consistent with the values reported in ENDF-B/VIII.1 [21].
The values of θlab and ∆Ω were obtained in Sec. II.C, and the 10B atom number Nc can be calculated from the data presented in Table 1. The value for En was determined using the time-of-flight (TOF) method. The uncertainty of En was mainly attributed to the width of the proton beam pulse. Nα(En, θlab) was obtained by analyzing the measured LPDA data from the 10B samples, which will be shown in Sec. III.A. The values of εd were determined based on a comparison between the measured and simulated spectra. I(En) was obtained by analyzing the data from the 6Li-Si monitor. In the present study, relative differential cross sections were obtained, and the relative angle-integrated cross sections were then calculated using Legendre polynomial fitting. Finally, the normalization factor (εnor) was calculated using the standard cross sections of the 10B(n, α)7Li reaction in the 0.5 ~ 1.5 eV region.
-
The differential cross sections of the 10B(n, α)7Li reaction can be calculated by
$ \begin{aligned}[b]\frac{\text{d}\sigma }{\text{d}\Omega }\left({E}_{\text{n}},\theta {}_{\text{lab}}\right)=\;&{\varepsilon }_{\text{nor}}\cdot \frac{\text{d}\sigma }{\text{d}\Omega }{\left({E}_{\text{n}},\theta {}_{\text{lab}}\right)}_{\text{realtive}}\\=\;&{\varepsilon }_{\text{nor}}\cdot \frac{{N}_{\alpha }({E}_{\text{n}},\theta {}_{\text{lab}})}{I({E}_{\text{n}})\cdot {N}_{\text{c}}\cdot \Delta \Omega \cdot {\varepsilon }_{\text{d}}}, \end{aligned}$
(1) where En is the neutron energy, θlab is the emission angle of the α particle in the laboratory reference system, Nα(En, θlab) is the number of the counts of the α particles in an energy bin centered at En and in the angle bin centered at θlab, I(En) is the relative neutron fluence in each neutron energy bin, Nc is the 10B atom number in the sample, ∆Ω is the solid angle of each silicon detector in the LPDA, εd is the detection efficiency of each silicon detector. Due to the lacking of the absolute neutron fluence and the non-uniformity correction of the neutron beam, the normalization factor (εnor) was determined in the neutron energy range from 0.5 eV to 1.5 eV, based on the evaluated data from IAEA-Std17 [3], which are the consistent with those in the ENDF-B/VIII.1 [21].
The values of θlab and ∆Ω have been obtained in Sec. II.C, and the 10B atom number Nc can be calculated from the data presented in Table 1. The En was determined by the time-of-flight (TOF) method. The uncertainty of En was mainly attributed to the width of the proton beam pulse. The Nα(En, θlab) was obtained through analyzing the measured LPDA data from the 10B samples which will be shown in Sec. III.A. The values of εd were obtained through the comparison between the spectra from measurements and the simulations. The I(En) was obtained through analyzing the data from the 6Li-Si monitor. In the present work, relative differential cross sections were obtained firstly, and then relative angle-integrated cross sections were calculated with the Legendre polynomial fitting. Finally, the normalization factor (εnor) was calculated using the standard cross sections of the 10B(n, α)7Li reaction in the 0.5 ~ 1.5 eV region.
-
The differential cross sections of the 10B(n, α)7Li reaction can be calculated as follows:
$ \begin{aligned}[b]\frac{\text{d}\sigma }{\text{d}\Omega }\left({E}_{n},\theta {}_{\text{lab}}\right)=\;&{\varepsilon }_{\text{nor}}\cdot \frac{\text{d}\sigma }{\text{d}\Omega }{\left({E}_{n},\theta {}_{\text{lab}}\right)}_{\text{realtive}}\\=\;&{\varepsilon }_{\text{nor}}\cdot \frac{{N}_{\alpha }({E}_{n},\theta {}_{\text{lab}})}{I({E}_{n})\cdot {N}_{\text{c}}\cdot \Delta \Omega \cdot {\varepsilon }_{\text{d}}}, \end{aligned}$
(1) where En is the neutron energy, θlab is the emission angle of the α particle in the laboratory reference system, Nα(En, θlab) is the α particle count in an energy bin centered at En and in the angle bin centered at θlab, I(En) is the relative neutron fluence in each neutron energy bin, Nc is the 10B atom number in the sample, ∆Ω is the solid angle of each silicon detector in the LPDA, and εd is the detection efficiency of each silicon detector. Owing to the lack of an absolute neutron fluence and the non-uniformity correction of the neutron beam, the normalization factor (εnor) was determined in the neutron energy range from 0.5 eV to 1.5 eV, based on the evaluated data from IAEA-Std17 [3], which is consistent with the values reported in ENDF-B/VIII.1 [21].
The values of θlab and ∆Ω were obtained in Sec. II.C, and the 10B atom number Nc can be calculated from the data presented in Table 1. The value for En was determined using the time-of-flight (TOF) method. The uncertainty of En was mainly attributed to the width of the proton beam pulse. Nα(En, θlab) was obtained by analyzing the measured LPDA data from the 10B samples, which will be shown in Sec. III.A. The values of εd were determined based on a comparison between the measured and simulated spectra. I(En) was obtained by analyzing the data from the 6Li-Si monitor. In the present study, relative differential cross sections were obtained, and the relative angle-integrated cross sections were then calculated using Legendre polynomial fitting. Finally, the normalization factor (εnor) was calculated using the standard cross sections of the 10B(n, α)7Li reaction in the 0.5 ~ 1.5 eV region.
-
A typical En-Amplitude (the amplitude of the signals from the Si detectors) two-dimensional spectrum at 30.10 is shown in Fig. 4(a), where the α0, α1 and 7Li events are clearly shown. The simulated En-Amplitude two-dimensional spectrum at the same angle position is shown in Fig. 4 (b). The simulation was performed using Geant4 code [19], and 7 reaction channels were considered, including 10B(n, α0)7Li , 10B(n, α1)7Li*, 10B(n, p) (Q = 0.23 MeV), 10B(n, t2α) (Q = 0.322 MeV), 10B(n, n)10B ,n-p scattering, and 27Al (n, α)24Na (Q = −3.132 MeV) reactions. The evaluated values of the cross sections and angular distributions from the ENDF/B-VIII.1 library [21] were used for simulation. Additionally, the double-bunch proton mode with the interval of 410 ns and the ~70 ns proton pulse width were also considered. One can see from the simulation result shown in Fig. 4(b), the 7Li events and the background events from other reactions (such as 10B(n, p), n-p scattering, etc.) rarely interfere with the α0 and α1 events for En below 3.0 MeV. The α0 events and α1 events could be clearly distinguished in the neutron energy region below 1 MeV. However, in the neutron energy region above 1 MeV, both the α0 and α1 events originating from the double-bunch proton pulses gradually separate leading to the overlap between α0 and α1 events.
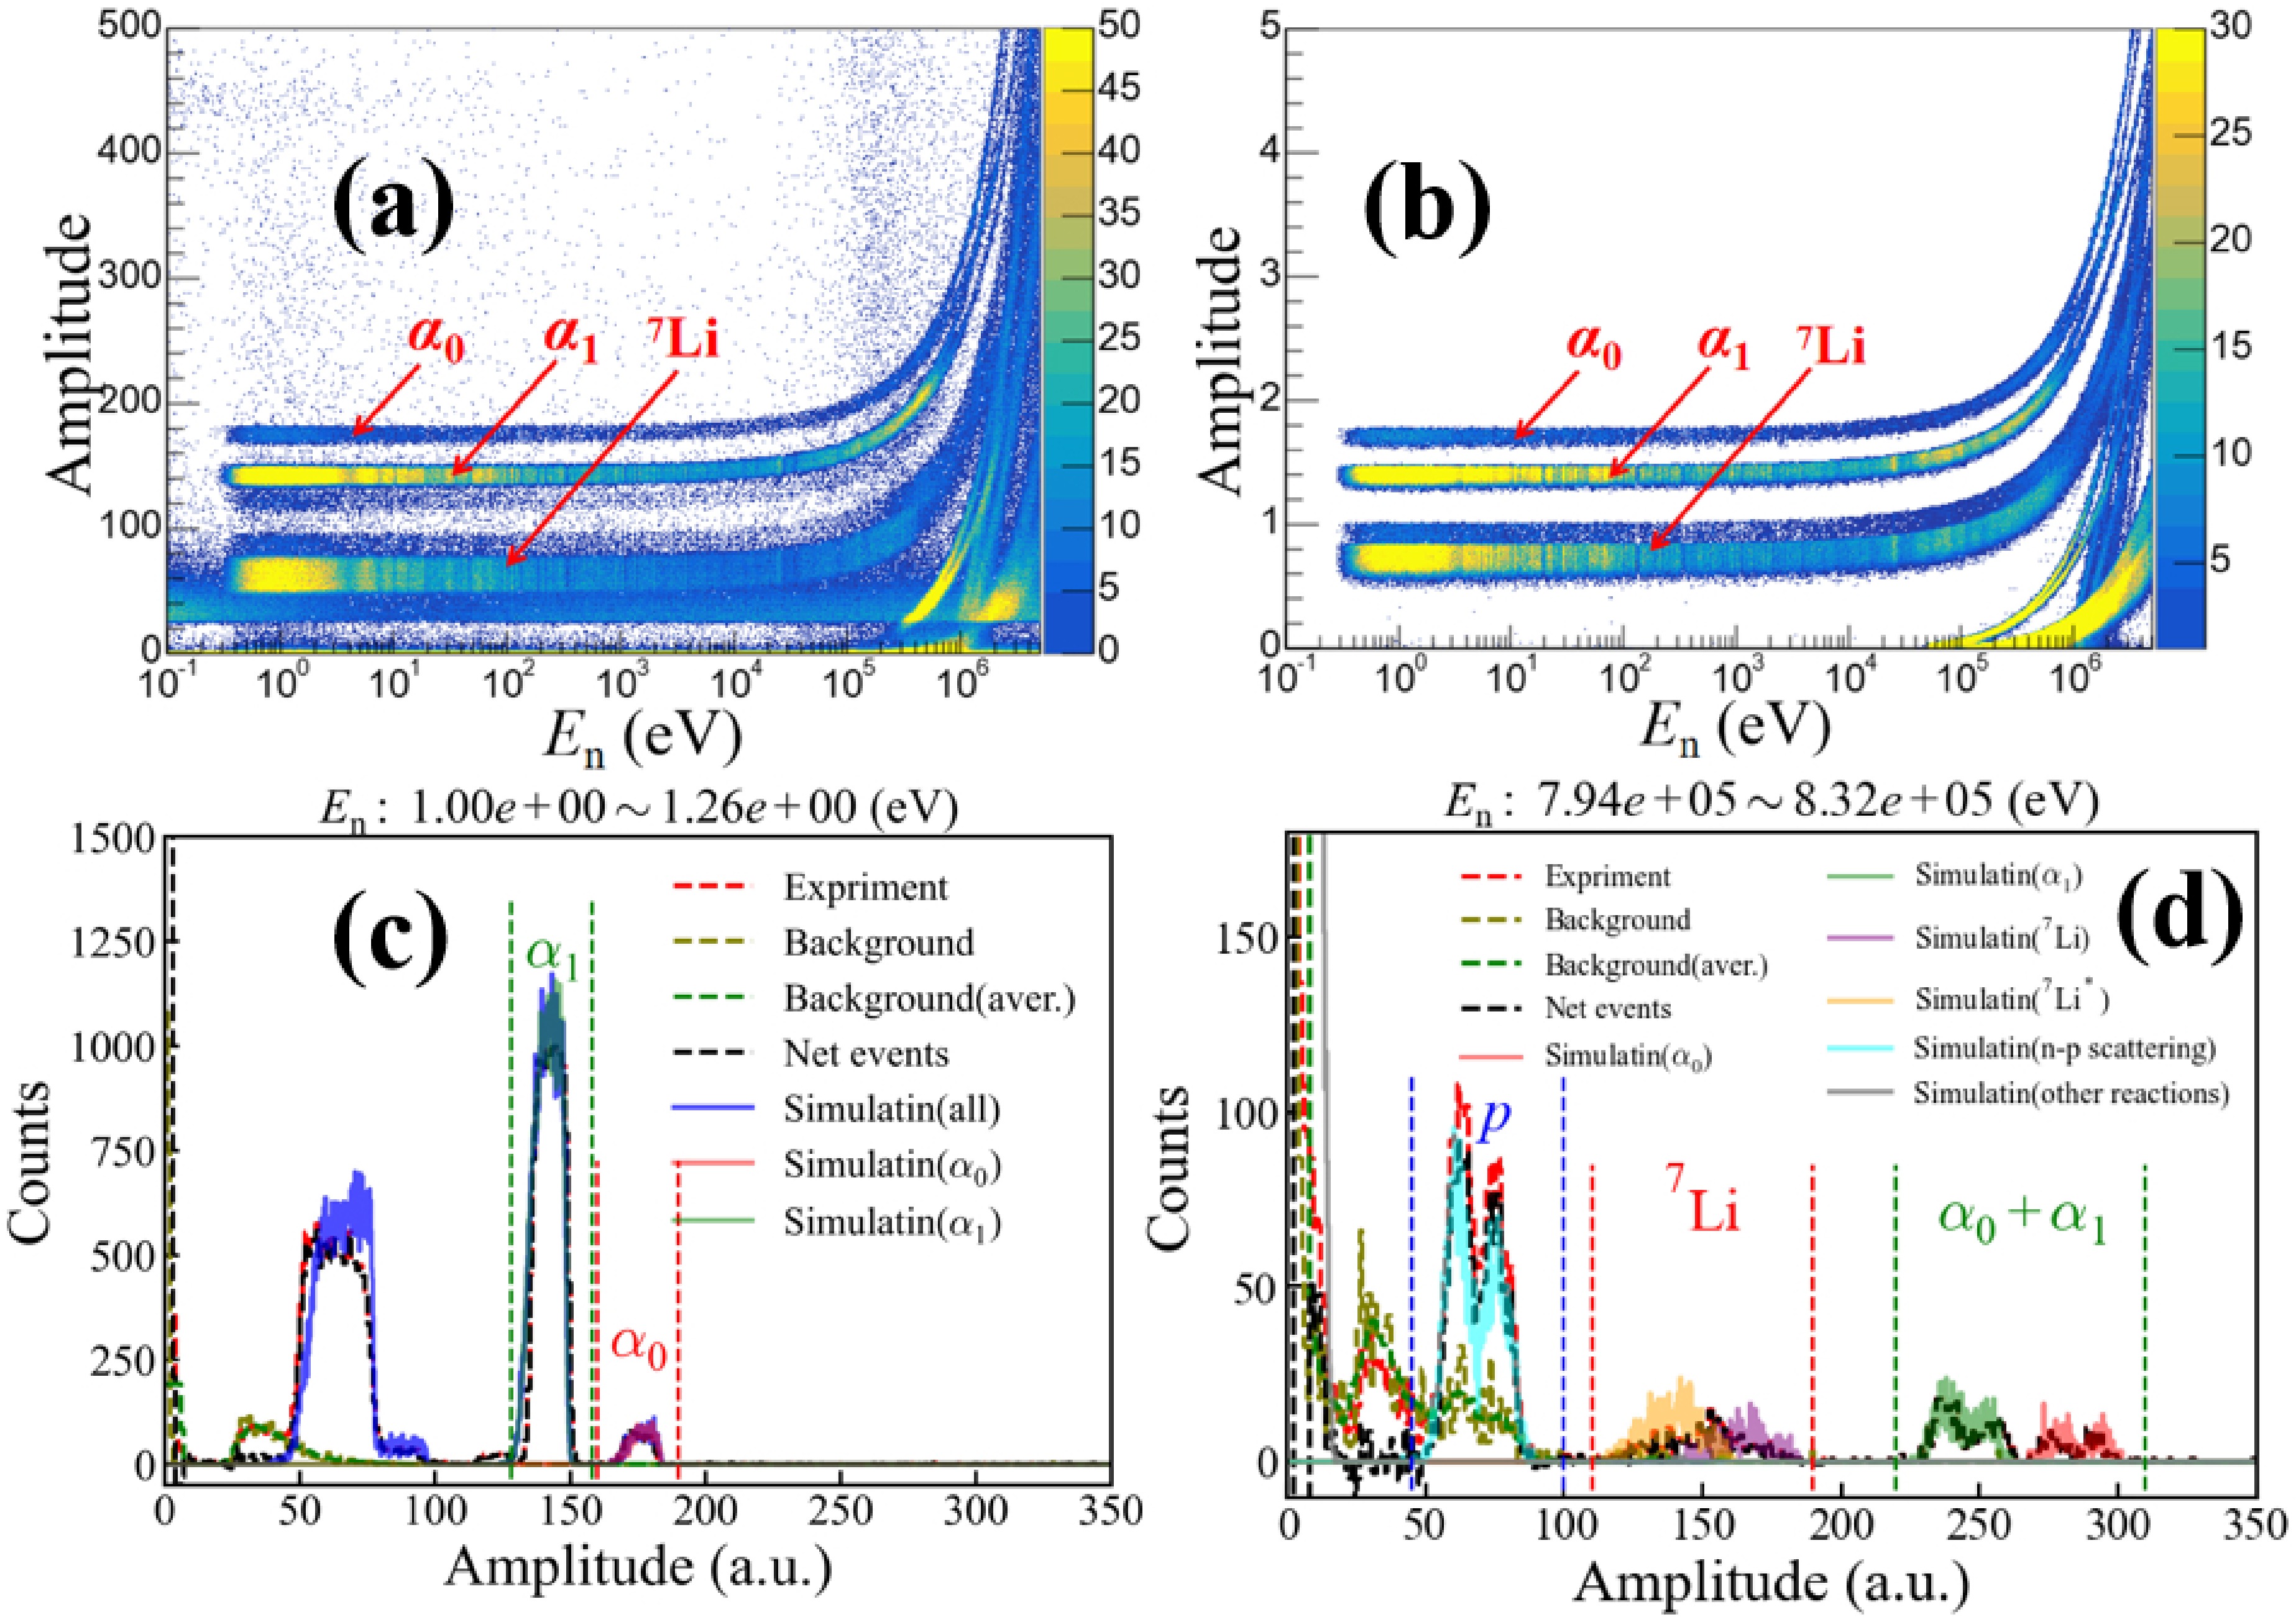
Figure 4. (color online) The measured En-Amplitude two-dimensional spectrum at the angle position of 30.1o (a), the simulated En-Amplitude two-dimensional spectrum at the angle position of 30.1o (b), the experimental PHS and the simulated PHS in the neutron energy bin from 1.00 eV to 1.26 eV (c) and those in the neutron energy bin from 794 keV to 832 keV (d) at 30.1o.
The pulse height spectra (PHSs) at different En bins were obtained to determine the Nα(En, θlab) counts. For En < 100 keV, because the kinetic energies of the emitted α particles remain nearly constant, the measured and simulated PHSs at 10 neutron energy bins per decade (bpd) were obtained, one of which is shown in Fig. 4(c). For En > 100 keV, in order to enhance energy resolution in the PHSs, the PHSs at 50 bpd were constructed to determine the counts of a events and to subtract the background, one of the PHSs at 50 bpd is shown in Fig. 4(d). These counts were subsequently re-binned to 10 bpd in order to derive differential cross sections.
The background from both the strong gamma flash and the backing sheet is non-negligible, so background measurement and subtraction are essential. The measured PHSs of the foreground spectra are shown in Figs. 4(c) and (d) by red dashed lines, while the corresponding background spectra are shown by the yellow dashed lines. The neutron fluences were normalized between the background measurement and the 10B(n, α)7Li measurement according to the integration of the accelerator proton flux. The experimental background PHSs were smoothed before obtaining the background-subtracted (net) PHSs, with the smoothed background spectra shown by the green dashed lines in Figs. 4(c) and (d). The resulting net spectra are indicated by the black dashed lines in Figs. 4(c) and (d). To identify the 10B(n, α)7Li, 10B(n, α0)7Li and 10B(n, α1)7Li* events, the background-subtracted PHSs were compared with the simulated ones, which are shown by the blue, red, and green solid lines in Figs. 4(c) and (d). One can see that the simulated PHSs agrees well with the measured PHSs. These simulations also enabled the determination of the detection efficiencies at various angle positions. In addition, the contribution of ambient-scattered thermal neutrons to the background is negligible, due to the their very low flux (< 10 /cm2/s) [22].
At detection angles bigger than 30.00, the impact of the background on the α event was very small. Considering that the background was smoothed, one fifth of the background counts was considered as error, and the uncertainty from background subtraction was less than 1%. At the smallest detection angle (20.10), the background interference was more significant, because the Si detection was near the neutron beam. The uncertainty from background subtraction for the 10B(n, α0)7Li events reaches up to 20% only in a few energy bins above 100 keV, while in most energy bins it remains below 1%. Furthermore, the uncertainty of determination of the valid area for the 10B(n, α)7Li and 10B(n, α1)7Li* events was estimated to be less than 1% in the neutron energy region below 300 keV, and less than 3% in the neutron energy region from 300 keV to 1 MeV. For the 10B(n, α0)7Li events, the uncertainty of determination of the valid area could reach up to 17.5% only in a few energy bins above 300 keV, while in most energy bins it remains below 4%. In several energy bins above 300 keV, the statistical errors and the the uncertainty of background subtraction for 10B(n, α0)7Li events become significant, owing to low counts of 10B(n, α0)7Li events and high counts of background. The detection efficiency at each detection angles was found to be approximately 100%.
Due to the 410 ns interval between the double-bunch proton beams, there is a non-negligible error in the determination of neutron energies above 0.02 MeV. For En < 3.0 MeV, since there is no dense resonance structure in the 10B(n, α)7Li, 10B(n, α0)7Li and 10B(n, α1)7Li* cross sections, an iterative method was used for unfolding. This unfolding method have been successfully used in our previous measurements of the 6Li(n, t)4He and 10B(n, α)7Li reactions at CSNS Back-n white neutron source [7,12]. While the double-bunch unfolding effectively reduces neutron energy deviation, it is the most significant source of the uncertainty for the measured differential and angle-integrated cross sections. The deviation before and after the double-bunch unfolding is regarded as the error of the double-bunch unfolding. For differential cross sections the uncertainty introduced from the unfolding process ranges from 0.2% to 19.8%, while for angle-integrated cross sections, the uncertainty ranges from 0.2% to 2.3%. A summary of the uncertainty can be found in Sec. C.
-
A typical En-Amplitude (the amplitude of the signal from the Si detectors) two-dimensional spectrum at 30.1° is shown in Fig. 4(a), where the α0, α1, and 7Li events are evident. The simulated En-Amplitude two-dimensional spectrum at the same angle position is shown in Fig. 4 (b). The simulation was performed using Geant4 code [19], and 7 reaction channels were considered, including 10B(n, α0)7Li , 10B(n, α1)7Li*, 10B(n, p) (Q = 0.23 MeV), 10B(n, t2α) (Q = 0.322 MeV), 10B(n, n)10B, n-p scattering, and 27Al (n, α)24Na (Q = –3.132 MeV) reactions. The evaluated values of the cross sections and angular distributions from the ENDF/B-VIII.1 library [21] were used during the simulations. Additionally, the double-bunch proton mode with an interval of 410 ns and the ~70 ns proton pulse width were considered. The simulation result shown in Fig. 4(b) indicates that the 7Li and background events from other reactions (such as 10B(n, p), n-p scattering, etc.) rarely interfere with the α0 and α1 events for En below 3.0 MeV. The α0 and α1 events could be clearly distinguished in the neutron energy region below 1 MeV. However, above this energy region, both the α0 and α1 events originating from the double-bunch proton pulses gradually separate, resulting in the overlap of α0 and α1 events.
Figure 4. (color online) Measured En-Amplitude two-dimensional spectrum at the angle position of 30.1° (a), simulated En-Amplitude two-dimensional spectrum at the angle position of 30.1° (b), experimental PHS and simulated PHS in the neutron energy bin from 1.00 eV to 1.26 eV (c) and from 794 keV to 832 keV (d) at 30.1°.
The pulse height spectra (PHSs) at different En bins were obtained to determine the Nα(En, θlab) counts. For En < 100 keV, because the kinetic energies of the emitted α particles remained nearly constant, the measured and simulated PHSs at 10 neutron energy bins per decade (bpd) were obtained, one of which is shown in Fig. 4(c). For En > 100 keV, to enhance the energy resolution, PHSs at 50 bpd were constructed to determine the counts of a events and to subtract the background. One of the PHSs at 50 bpd is shown in Fig. 4(d). These counts were subsequently re-binned to 10 bpd to derive differential cross sections.
The background from both the strong gamma flash and the backing sheet is non-negligible, so background measurement and subtraction are essential. The measured PHSs of the foreground spectra are represented in Figs. 4(c) and (d) as red dashed lines, whereas the corresponding background spectra are represened by yellow dashed lines. The neutron fluences were normalized between the background and the 10B(n, α)7Li measurement by integrating the accelerator proton flux. The experimental background PHSs were smoothed before obtaining the background-subtracted (net) PHSs, with the smoothed background spectra represented by the green dashed lines in Figs. 4(c) and (d). The resulting net spectra are indicated by the black dashed lines in Figs. 4(c) and (d). To identify the 10B(n, α)7Li, 10B(n, α0)7Li, and 10B(n, α1)7Li* events, the background-subtracted PHSs were compared with the simulated results, which are represented by the blue, red, and green solid lines in Figs. 4(c) and (d). The results indicate that the simulated PHSs agree with the measured PHSs. These simulations also enabled the determination of the detection efficiencies at various angle positions. In addition, the contribution of ambient-scattered thermal neutrons to the background is negligible, due to the their very low flux (< 10 /cm2/s) [22].
At detection angles greater than 30.0°, the impact of the background on the α event was very small. Considering that the background was smoothed, one fifth of the background counts was considered to be error, and the uncertainty from background subtraction was less than 1%. At the smallest detection angle (20.1°), the background interference was more significant, because the Si detection was near the neutron beam. The uncertainty from the background subtraction for the 10B(n, α0)7Li events reached 20% only in a few energy bins above 100 keV, whereas in most energy bins, it remained below 1%. Furthermore, the uncertainty of determination of the valid area for the 10B(n, α)7Li and 10B(n, α1)7Li* events was estimated to be less than 1% in the neutron energy region below 300 keV and less than 3% in the region from 300 keV to 1 MeV. For the 10B(n, α0)7Li events, the uncertainty of determination of the valid area could reach up to 17.5% only in a few energy bins above 300 keV, whereas in most energy bins, it remained below 4%. In several energy bins above 300 keV, the statistical errors and the the uncertainty of the background subtraction for 10B(n, α0)7Li events were significant, owing to low counts of 10B(n, α0)7Li events and high background counts. The detection efficiency at each detection angle was found to be approximately 100%.
Owing to the 410 ns interval between the double-bunch proton beams, there is a non-negligible error in the determination of neutron energies above 0.02 MeV. For En < 3.0 MeV, since there is no dense resonance structure in the 10B(n, α)7Li, 10B(n, α0)7Li, and 10B(n, α1)7Li* cross sections, an iterative method was used for unfolding. This unfolding method has been successfully used in our previous measurements of the 6Li(n, t)4He and 10B(n, α)7Li reactions at the CSNS Back-n white neutron source [7,12]. Although the double-bunch unfolding effectively reduces neutron energy deviation, it is the most significant source of uncertainty of the measured differential and angle-integrated cross sections. The deviation before and after the double-bunch unfolding is regarded as the error of the double-bunch unfolding. For differential cross sections, the uncertainty introduced from the unfolding process ranges from 0.2% to 19.8%, whereas for angle-integrated cross sections, the uncertainty ranges from 0.2% to 2.3%. A summary of the uncertainty can be found in Sec. C.
-
The 6Li-Si monitor [17] was used to measure the neutron flux. The relative neutron fluence I(En) was calculated from
$ I({E}_{\text{n}})={\varepsilon }_{\text{nor}}\frac{N({E}_{\text{n}})}{\dfrac{\text{d}\sigma }{\text{d}\Omega }({E}_{\text{n}},{\theta }_{\text{lab}}={135}^{\text{o}})\cdot \Delta \Omega \cdot {N}_{\text{s}}}, $
(2) where N(En) is the 6Li(n, t)4He event number in each neutron energy bin, and
$ \dfrac{d\sigma }{d\Omega } $ (En, θlab = 1350) is the differential cross sections of the 6Li(n, t)4He reaction taken from evaluation data form ENDF/B-VIII.1 [21], JEFF-3.3 [23], and BROND-3.1 [24]. ∆Ω is the solid angle of the silicon detector, and Ns is the relative 6Li atom number in the 6LiF sample. The Ns has been presented in Sec. II.C, and the ∆Ω was obtained by Monte Carlo simulations using Geant4 code [19]. Consistent with Eq. (1), the same normalization factor (εnor) was used here.The signals from five silicon detectors, positioned at the same receiving angle of 1350 with respect to the 6LiF sample in the laboratory system (as described in Sec. II.C), were merged and analyzed to enhance statistical accuracy of the neutron fluence. The En-Amplitude two-dimensional spectrum measured by the 6Li-Si monitor after merging is shown in Fig. 5(a), where the triton and α events from the 6Li(n, t)4He reaction are clearly separated at En < 3.0 MeV. The simulated En-Amplitude two-dimensional spectrum is shown in Fig. 5(b). In the neutron energy below 3.0 MeV, the valid-event-area of the triton and α events from the 6Li(n, t)4He reaction can be clearly identified, and the influence of the background is negligible. The primary background sources include neutron-induced reactions from the aluminum backing (e.g., 27Al(n, p)27Mg (Q = −1.828 MeV), 27Al (n, α)24Na (Q = −3.132 MeV) and 19F(n, α)16N (Q = −1.525 MeV) reactions) and the gamma-flash. The gamma-flash effects are minimal due to the large angle placement of the detectors, and background contributions from the aluminum backing are significant only for En > 3.0 MeV.
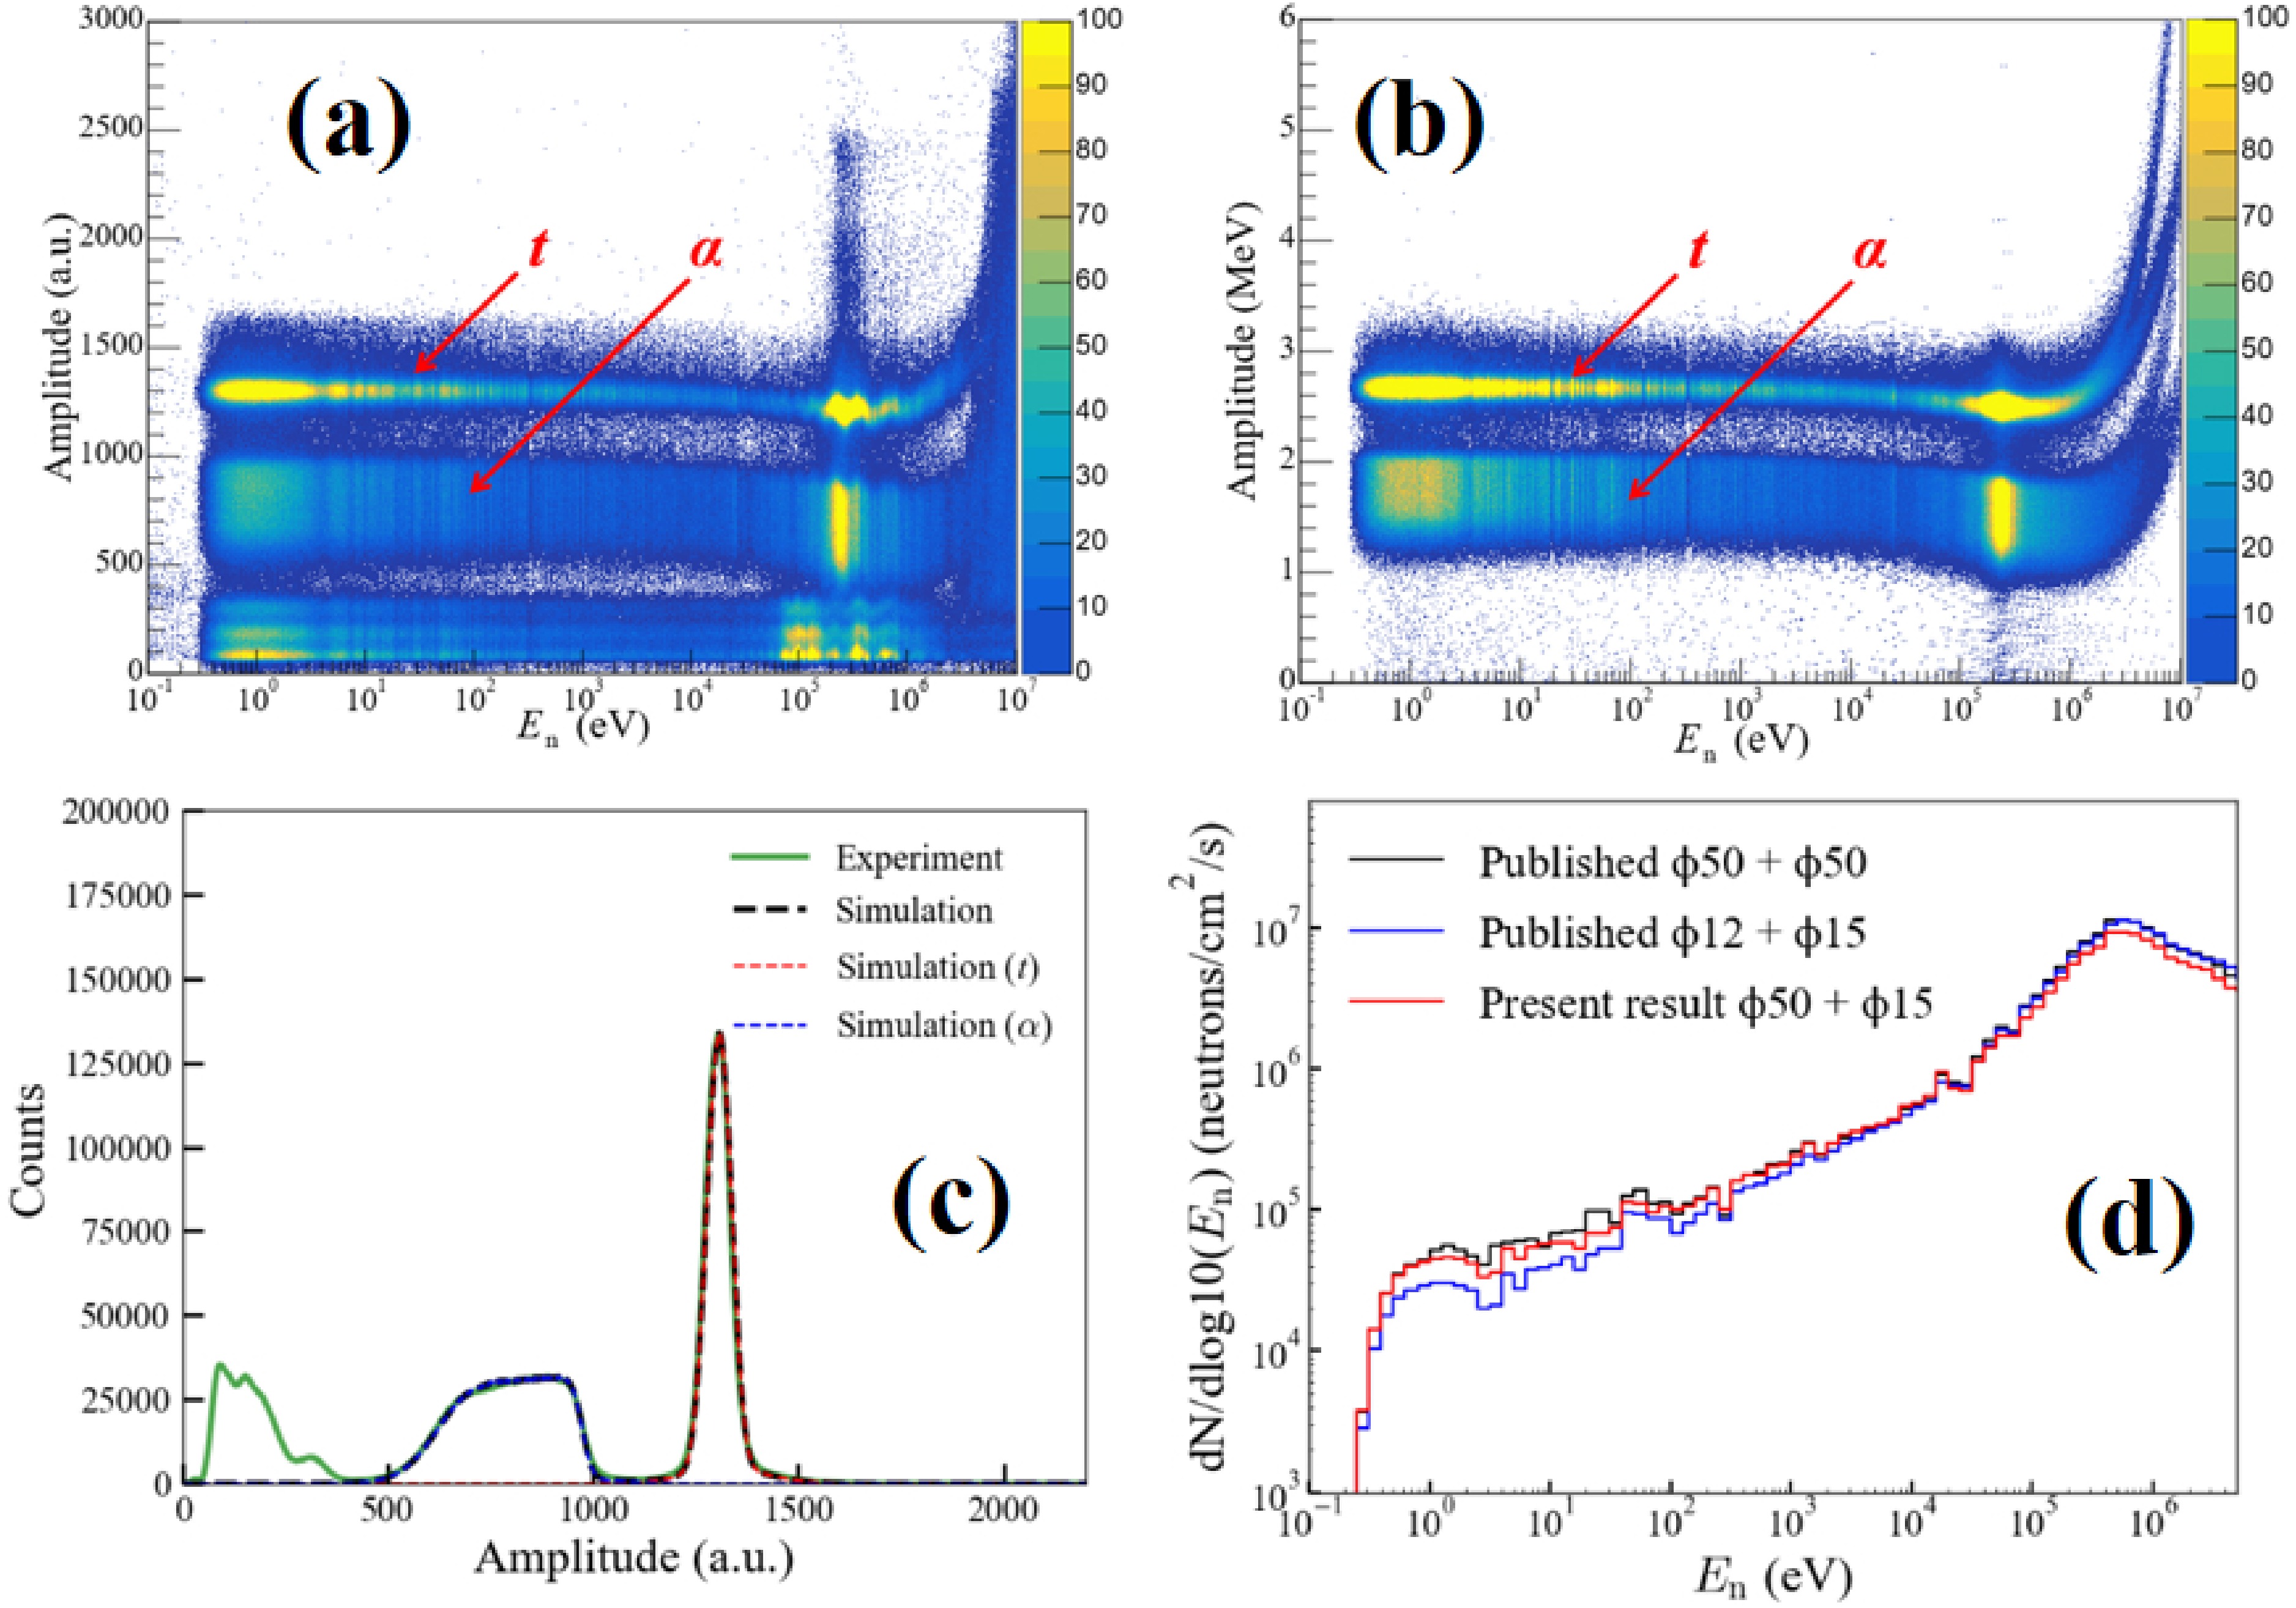
To obtain the triton and α count at an energy bin and to determine their detection efficiencies, the experimental PHSs with 10 neutron bins per decade (10 bpd) were compared with the simulated ones. A typical experimental PHS at En < 100 keV is shown in Fig 5(c), compared with the simulated PHS. The detector efficiency for triton and α events in the neutron energy below 100 keV is nearly 100% from simulation. For En < 100 keV, the uncertainty of the determination for the valid area and the detector efficiency is less than 0.5%, and the statistical uncertainty of the triton and α events is less than 1.0%. The triton and alpha counts spectra from the double-bunch neutron were unfolded using the iterative method, which is the same method used for the analysis of the 10B data in Sec. III.A. The method of uncertainty calculation is the same as in Sec. III.A, and the uncertainty introduced from the double-brunch unfolding is less than 1.6%.
The differential cross sections of the 6Li(n, t)4He reaction for different neutron energies were taken from the average of the evaluation data from ENDF/B-VIII.1 [21], JEFF-3.3 [23], and BROND-3.1 [24]. The uncertainties of the evaluation data were estimated from the maximum deviation among different datasets. The uncertainties of the evaluated differential cross sections for both triton and α emission at θlab = 1350 are less than 0.5% for neutron energies below 1 keV. In the neutron energy range from 1 keV to 100 keV, the uncertainties of the evaluated differential cross sections for triton emission increase from 0.5% to 3.2%, and those for α emission increase from 0.5% to 1.4%.The εnor was calculated using the neutron flux in the neutron energy from 0.5 eV to 1.5 MeV with a beam configuration of Ø50 mm (shutter) + Ø50 mm (collimator 1) published in 2024 [25,26], with a normalization uncertainty of ~1.3%. In the energy range from 0.3 eV to 100 keV, the neutron flux was calculated using both the counts of triton and α events from Fig. 5(a), according to Eq. (2). The neutron fluxes derived from triton events and from α events show a discrepancy of less than 3.0%. To address the constraint of relying solely on the differential cross sections from a single angle position, a statistically weighted average of the two neutron fluxes derived independently from triton and from α events was employed, with weights determined by their event statistics. The resulting flux was used in Eq. (1), and their uncertainties range from 1.5% to 2.6% for the determination of the differential cross sections of the 10B(n, α)7Li reaction.
The pronounced resonance at approximately 0.24 MeV in the excitation function of the 6Li(n, t)4He reaction renders this reaction unsuitable for direct neutron flux measurements at neutron energies above 100 keV. In the neutron energy range from 100 keV to 3.0 MeV, the neutron flux was derived by normalizing the neutron flux with the Ø50 mm + Ø50 mm configuration to the integral of the flux measured by the 6Li-Si monitor. The final uncertainty, combining the contributions from the published data and normalization, ranges from 1.8% to 2.7%. The measured neutron flux using the 6Li-Si monitor is shown by the red line in Fig 5(d). The black line in Fig. 5(d) represents the published neutron flux data obtained with a beam configuration of Ø50 mm (shutter) + Ø50 mm (collimator 1), while the blue line corresponds to the configuration of Ø12 mm (shutter) + Ø15 mm (collimator 1). Compared with the Ø50 mm + Ø50 mm configuration, the neutron flux measured with Ø12 mm + Ø15 mm differs more significantly from that of the present experiment (Ø50 mm + Ø15 mm).
-
The 6Li-Si monitor [17] was used to measure the neutron flux. The relative neutron fluence I( En) was calculated as follows:
$ I({E}_{n})={\varepsilon }_{\text{nor}}\frac{N({E}_{n})}{\dfrac{\text{d}\sigma }{\text{d}\Omega }({E}_{n},{\theta }_{\text{lab}}={135}^{\text{o}})\cdot \Delta \Omega \cdot {N}_{\text{s}}}, $
(2) where N(En) is the 6Li(n, t)4He event number in each neutron energy bin, and
$ \dfrac{\mathrm{d}\sigma}{\mathrm{d}\Omega} $ ( En, θlab = 135°) is the differential cross sections of the 6Li(n, t)4He reaction determined using the evaluation data obtained form ENDF/B-VIII.1 [21], JEFF-3.3 [23], and BROND-3.1 [24]. ∆Ω is the solid angle of the silicon detector, and Ns is the relative 6Li atom number in the 6LiF sample. Ns was presented in Sec. II.C, and ∆Ω was obtained by Monte Carlo simulations using Geant4 code [19]. Consistent with Eq. (1), the same normalization factor (εnor) was used here.The signals from five silicon detectors, positioned at the same receiving angle of 135° with respect to the 6LiF sample in the laboratory system (as described in Sec. II.C), were merged and analyzed to enhance the statistical accuracy of the neutron fluence. The En-Amplitude two-dimensional spectrum measured by the 6Li-Si monitor after merging is shown in Fig. 5(a), where the triton and α events from the 6Li(n, t)4He reaction are clearly separated at En < 3.0 MeV. The simulated En-Amplitude two-dimensional spectrum is shown in Fig. 5(b). When the neutron energy is below 3.0 MeV, the valid-event-area of the triton and α events from the 6Li(n, t)4He reaction can be clearly identified, and the influence of the background is negligible. The primary background sources include neutron-induced reactions from the aluminum backing (e.g., 27Al(n, p)27Mg (Q = −1.828 MeV), 27Al (n, α)24Na (Q = −3.132 MeV), and 19F(n, α)16N (Q = −1.525 MeV) reactions) and the gamma-flash. The gamma-flash effects are minimal owing to the large angle placement of the detectors, and the background contributions from the aluminum backing are significant only for En > 3.0 MeV.
To obtain the triton and α count at an energy bin and to determine their detection efficiencies, the experimental PHSs with 10 neutron bins per decade (10 bpd) were compared with the simulated results. A typical experimental PHS at En < 100 keV is shown in Fig. 5(c), compared with the simulated PHS. The detector efficiency for triton and α events in the neutron energy below 100 keV is nearly 100% based on the simulation data. For En < 100 keV, the uncertainty of determination for the valid area and the detector efficiency is less than 0.5%, and the statistical uncertainty of the triton and α events is less than 1.0%. The triton and alpha count spectra from the double-bunch neutron were unfolded using the iterative method, which is the same method used for the analysis of the 10B data in Sec. III.A. The uncertainty calculation is the same as in Sec. III.A, and the uncertainty introduced from the double-brunch unfolding is less than 1.6%.
The differential cross sections of the 6Li(n, t)4He reaction for different neutron energies were taken from the average of the evaluation data for ENDF/B-VIII.1 [21], JEFF-3.3 [23], and BROND-3.1 [24]. The uncertainties of the evaluation data were estimated from the maximum deviation among different datasets. The uncertainties of the evaluated differential cross sections for both triton and α emissions at θlab = 135° were less than 0.5% for neutron energies below 1 keV. In the neutron energy range from 1 keV to 100 keV, the uncertainties of the evaluated differential cross sections for triton emission increase from 0.5% to 3.2%, and those for α emission increase from 0.5% to 1.4%. εnor was calculated using the neutron flux in the neutron energy from 0.5 eV to 1.5 MeV with a beam configuration of Ø50 mm (shutter) + Ø50 mm (collimator 1) published in 2024 [25, 26], with a normalization uncertainty of ~1.3%. In the energy range from 0.3 eV to 100 keV, the neutron flux was calculated using both the counts of triton and α events from Fig. 5(a), according to Eq. (2). The neutron fluxes derived from triton and α events show a discrepancy of less than 3.0%. To address the constraint of relying solely on the differential cross sections from a single angle position, a statistically weighted average of the two neutron fluxes derived independently from triton and α events was employed, with weights determined by their event statistics. The resulting flux was used in Eq. (1), and the uncertainty values ranged from 1.5% to 2.6% for the determination of the differential cross sections of the 10B(n, α)7Li reaction.
The pronounced resonance at approximately 0.24 MeV in the excitation function of the 6Li(n, t)4He reaction renders this reaction unsuitable for direct neutron flux measurements at neutron energies above 100 keV. In the neutron energy range from 100 keV to 3.0 MeV, the neutron flux was derived by normalizing this parameter for the Ø50 mm + Ø50 mm configuration to the integral of the flux measured by the 6Li-Si monitor. The final uncertainty was obtained by combining the contributions from published data and the normalization process and ranged from 1.8% to 2.7%. The measured neutron flux using the 6Li-Si monitor is represented by the red line in Fig. 5(d). The black line in Fig. 5(d) indicates the published neutron flux data obtained with a beam configuration of Ø50 mm (shutter) + Ø50 mm (collimator 1), whereas the blue line corresponds to the configuration of Ø12 mm (shutter) + Ø15 mm (collimator 1). Compared with the Ø50 mm + Ø50 mm configuration, the neutron flux measured with Ø12 mm + Ø15 mm differs more significantly from that of the Ø50 mm + Ø15 mm configuration of the present experiment.
-
According to Eq. (1), the relative differential cross sections were obtained and subsequently fitted using fourth-order Legendre polynomial series. The fitted functions were then integrated to yield the relative angle-integrated cross sections. As shown in Fig. 6, the relative angle-integrated cross sections for the 10B(n, α1)7Li* reaction (the blue points) were normalized to the standard cross section (angle-integrated cross sections) from IAEA-Std17 [3] in the neutron energy range from 0.5 eV to 1.5 eV. This procedure was used to determine the normalization factor εnor of the present work for both the angle-integrated and differential cross sections.
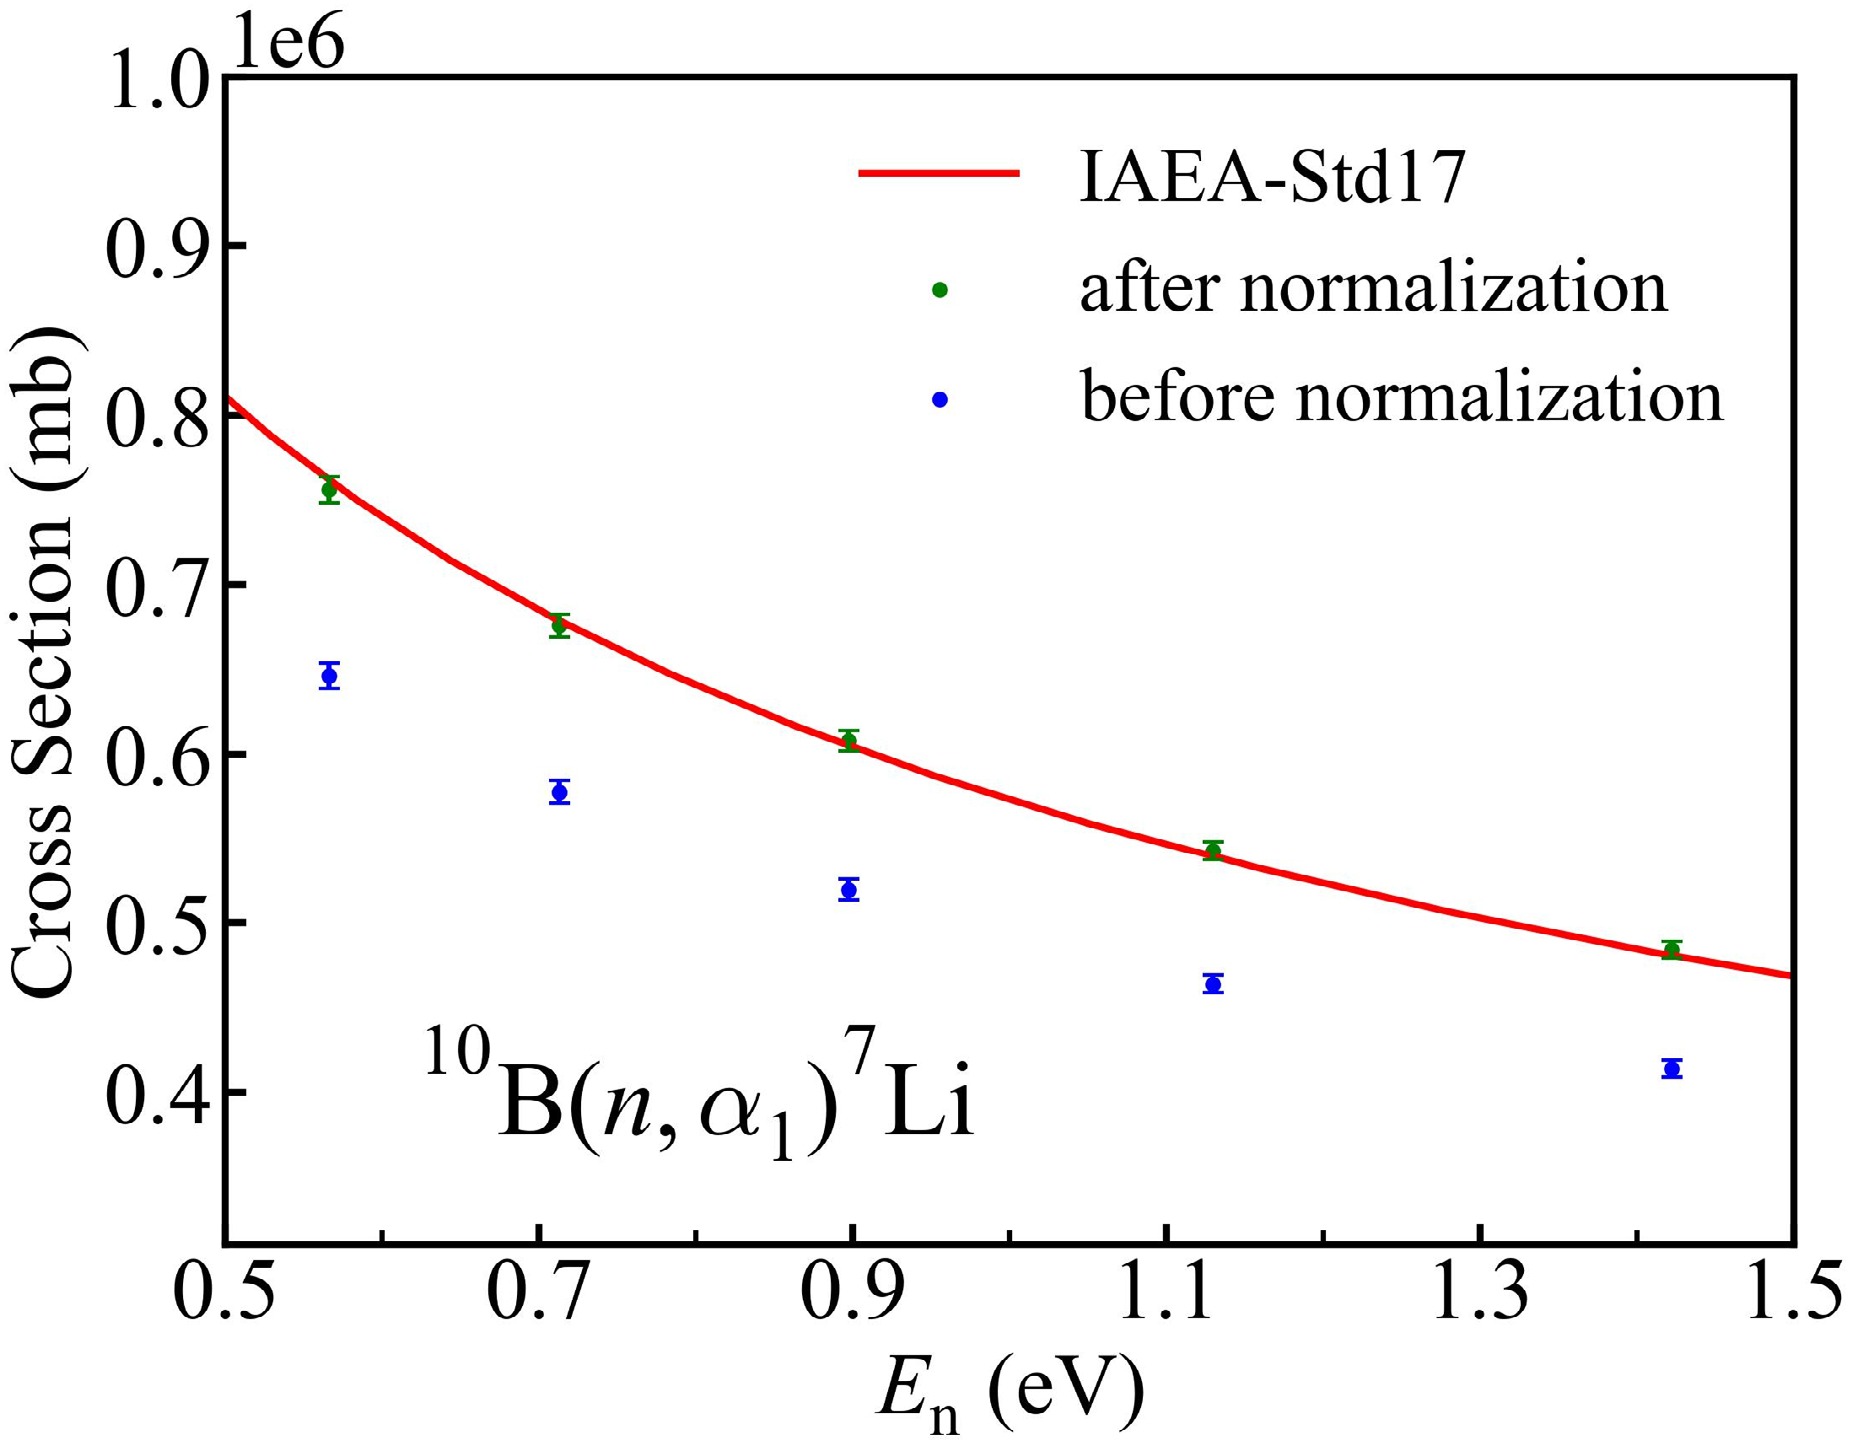
Figure 6. (color online) The determination of the normalization factor.
The uncertainty of this normalization factor is 1.3%, which accounts for both the uncertainty of the standard cross section and the deviation of cross sections between the normalized results and evaluated values. Table 2 details the sources of the uncertainties and their magnitudes.
Source of uncertainty Magnitude (%) Differential cross sections Angle-integrated cross sections Relative neutron flux 1.5−3.0 1.5−3.0 Statistical error of the valid α events 0.5−5.5a (10.7b) 0.2−2.6 Unfolding of the double-bunch proton beams 0.5−5.6a (18.5b) 0.2−2.8 Determination of the valid-even-area < 4.0a (< 17.5b) < 0.6 a (< 3.0b) Background subtraction < 5.0a (< 22.8b) < 0.1a (< 1.5b) Detection efficiency < 0.1 < 0.1 Number of 10B atoms 1.0 1.0 Detection solid angle < 0.4 < 0.4 Legendre polynomial fitting - 0.2−6.2 Normalization 1.3 1.3 Total uncertainty of the 10B(n, α) 7Li reaction 2.4−8.5 2.4−7.0 Total uncertainty of the 10B(n, α0) 7Li reaction 3.3−32.7 3.3−7.9 Total uncertainty of the 10B(n, α1) 7Li reaction 2.4−8.7 2.4−6.4 a: uncertainties of the 10B(n, α) 7Li and 10B(n, α1) 7Li* reactions. b: uncertainties of the 10B(n, α0) 7Li reaction. Table 2. Sources of uncertainties and their magnitudes.
The sources of uncertainties for the differential cross sections of the 10B(n, α1)7Li* ,10B(n, α0)7Li, and 10B(n, α)7Li reactions include the uncertainties of the counts of events, relative neutron flux, detection solid angles, number of 10B atoms, and normalization factor. Among these, the uncertainties of the counts of the 10B(n, α1)7Li* ,10B(n, α0)7Li, and 10B(n, α)7Li reactions arise from the uncertainties in the statistical error of the valid α events, the unfolding of the double-bunch proton beams, the determination of the valid-even-area, the background subtraction, and the detection efficiency. For the differential cross sections of the 10B(n, α) 7Li and 10B(n, α1)7Li* reactions, the total uncertainty ranges from 2.4% to 8.7%. For the 10B(n, α0)7Li reaction, the uncertainty ranges from 3.3% to 32.7%, which is mainly because the counts of the 10B(n, α0)7Li reaction are significantly less than those of the 10B(n, α) 7Li and 10B(n, α1)7Li* reactions. In the neutron energy range below 1 keV, the uncertainties of the differential cross sections for the 10B(n, α) 7Li and 10B(n, α1)7Li* reactions primarily originate from the uncertainties in normalization, nuclear number, and neutron flux measurements. In contrast, at high neutron energies, statistical errors and double-bunch unfolding errors are the primary sources of uncertainties. For the 10B(n, α0)7Li reaction, the uncertainties due to statistical errors, double-bunch unfolding, determination of the valid-even-area, and background subtraction are larger than those of 0B(n, α) 7Li and 10B(n, α1)7Li* reactions. The complete differential cross section data of the present study are provided in the Supporting Information file "Differential cross sections.xlsx".
For the angle-integrated cross sections, the uncertainties owing to the statistical errors, double-bunch unfolding, determination of the valid-even-area, and background subtraction are significantly reduced, whereas an additional uncertainty component is introduced by the Legendre polynomial fitting. For the angle-integrated cross sections of the 10B(n, α) 7Li and 10B(n, α1)7Li* reactions, the total uncertainty ranges from 2.4% to 7.0%. For the 10B(n, α0)7Li reaction, the uncertainty ranges from 3.3% to 7.9%. The present experimental data for the angle-integrated cross sections for the 10B(n, α1)7Li* ,10B(n, α0)7Li, and 10B(n, α)7Li* reactions are included in the Supporting Information file "Angle-integrated cross sections.xlsx".
-
According to Eq. (1), the relative differential cross sections were obtained and subsequently fitted using fourth-order Legendre polynomial series. The fitted functions were then integrated to yield the relative angle-integrated cross sections. As shown in Fig. 6, the relative angle-integrated cross sections for the 10B(n, α1)7Li* reaction (the blue points) were normalized to the standard cross section (angle-integrated cross sections) from IAEA-Std17 [3] in the neutron energy range from 0.5 eV to 1.5 eV. This procedure was used to determine the normalization factor εnor of the present work for both the angle-integrated and differential cross sections.
Figure 6. (color online) The determination of the normalization factor.
The uncertainty of this normalization factor is 1.3%, which accounts for both the uncertainty of the standard cross section and the deviation of cross sections between the normalized results and evaluated values. Table 2 details the sources of the uncertainties and their magnitudes.
Source of uncertainty Magnitude (%) Differential cross sections Angle-integrated cross sections Relative neutron flux 1.5−3.0 1.5−3.0 Statistical error of the valid α events 0.5−5.5a (10.7b) 0.2−2.6 Unfolding of the double-bunch proton beams 0.5−5.6a (18.5b) 0.2−2.8 Determination of the valid-even-area < 4.0a (< 17.5b) < 0.6 a (< 3.0b) Background subtraction < 5.0a (< 22.8b) < 0.1a (< 1.5b) Detection efficiency < 0.1 < 0.1 Number of 10B atoms 1.0 1.0 Detection solid angle < 0.4 < 0.4 Legendre polynomial fitting - 0.2−6.2 Normalization 1.3 1.3 Total uncertainty of the 10B(n, α) 7Li reaction 2.4−8.5 2.4−7.0 Total uncertainty of the 10B(n, α0) 7Li reaction 3.3−32.7 3.3−7.9 Total uncertainty of the 10B(n, α1) 7Li reaction 2.4−8.7 2.4−6.4 a: uncertainties of the 10B(n, α) 7Li and 10B(n, α1) 7Li* reactions. b: uncertainties of the 10B(n, α0) 7Li reaction. Table 2. Sources of uncertainties and their magnitudes.
The sources of uncertainties for the differential cross sections of the 10B(n, α1)7Li* ,10B(n, α0)7Li, and 10B(n, α)7Li reactions include the uncertainties of the counts of events, relative neutron flux, detection solid angles, number of 10B atoms, and normalization factor. Among these, the uncertainties of the counts of the 10B(n, α1)7Li* ,10B(n, α0)7Li, and 10B(n, α)7Li reactions arise from the uncertainties in the statistical error of the valid α events, the unfolding of the double-bunch proton beams, the determination of the valid-even-area, the background subtraction, and the detection efficiency. For the differential cross sections of the 10B(n, α) 7Li and 10B(n, α1)7Li* reactions, the total uncertainty ranges from 2.4% to 8.7%. For the 10B(n, α0)7Li reaction, the uncertainty ranges from 3.3% to 32.7%, which is mainly because the counts of the 10B(n, α0)7Li reaction are significantly less than those of the 10B(n, α) 7Li and 10B(n, α1)7Li* reactions. In the neutron energy range below 1 keV, the uncertainties of the differential cross sections for the 10B(n, α) 7Li and 10B(n, α1)7Li* reactions primarily originate from the uncertainties in normalization, nuclear number, and neutron flux measurements. In contrast, at high neutron energies, statistical errors and double-bunch unfolding errors are the primary sources of uncertainties. For the 10B(n, α0)7Li reaction, the uncertainties due to statistical errors, double-bunch unfolding, determination of the valid-even-area, and background subtraction are larger than those of 0B(n, α) 7Li and 10B(n, α1)7Li* reactions. The complete differential cross section data of the present study are provided in the Supporting Information file "Differential cross sections.xlsx".
For the angle-integrated cross sections, the uncertainties owing to the statistical errors, double-bunch unfolding, determination of the valid-even-area, and background subtraction are significantly reduced, whereas an additional uncertainty component is introduced by the Legendre polynomial fitting. For the angle-integrated cross sections of the 10B(n, α) 7Li and 10B(n, α1)7Li* reactions, the total uncertainty ranges from 2.4% to 7.0%. For the 10B(n, α0)7Li reaction, the uncertainty ranges from 3.3% to 7.9%. The present experimental data for the angle-integrated cross sections for the 10B(n, α1)7Li* ,10B(n, α0)7Li, and 10B(n, α)7Li* reactions are included in the Supporting Information file "Angle-integrated cross sections.xlsx".
-
According to Eq. (1), the relative differential cross sections were obtained and subsequently fitted using fourth-order Legendre polynomial series. The fitted functions were then integrated to yield the relative angle-integrated cross sections. As shown in Fig. 6, the relative angle-integrated cross sections for the 10B(n, α1)7Li* reaction (the blue points) were normalized to the standard cross section (angle-integrated cross sections) from IAEA-Std17 [3] in the neutron energy range from 0.5 eV to 1.5 eV. This procedure determined the normalization factor εnor of the present work for both the angle-integrated cross section and the differential cross sections.
Figure 6. (color online) The determination of the normalization factor.
The uncertainty of this normalization factor is 1.3%, which accounts for both the uncertainty of the standard cross section and the deviation of cross sections between the normalized results and evaluated values. Table 2 details the sources of the uncertainties and their magnitudes.
Source of uncertainty Magnitude (%) Differential cross sections Angle-integrated cross sections Relative neutron flux 1.5 ~ 3.0 1.5 ~ 3.0 Statistical error of the valid α events 0.5 ~ 5.5a (10.7b) 0.2 ~ 2.6 Unfolding of the double-bunch proton beams 0.5 ~5.6a (18.5b) 0.2 ~ 2.8 Determination of the valid-even-area < 4.0a (< 17.5b) < 0.6 a (< 3.0b) Background subtraction < 5.0a (< 22.8b) < 0.1a (< 1.5b) Detection efficiency < 0.1 < 0.1 Number of the 10B atoms 1.0 1.0 Detection solid angle < 0.4 < 0.4 Legendre polynomial fitting - 0.2 ~ 6.2 Normalization 1.3 1.3 Total uncertainty of the 10B(n, α) 7Li reaction 2.4 ~ 8.5 2.4 ~ 7.0 Total uncertainty of the 10B(n, α0) 7Li reaction 3.3 ~ 32.7 3.3 ~ 7.9 Total uncertainty of the 10B(n, α1) 7Li reaction 2.4 ~ 8.7 2.4 ~ 6.4 a: uncertainties of the 10B(n, α) 7Li and 10B(n, α1) 7Li* reactions. b: uncertainties of the 10B(n, α0) 7Li reaction. Table 2. Sources of the uncertainties and their magnitudes
The sources of uncertainties for the differential cross sections of the 10B(n, α1)7Li* ,10B(n, α0)7Li and 10B(n, α)7Li reactions include the uncertainties of the counts of events, relative neutron flux, detection solid angles, number of 10B atoms, and normalization factor. Among these, the uncertainties of counts of the 10B(n, α1)7Li* ,10B(n, α0)7Li and 10B(n, α)7Li reactions arise from the uncertainties in the statistical error of the valid α events, the unfolding of the double-bunch proton beams, the determination of the valid-even-area, the background subtraction and the detection efficiency. For the differential cross sections of the 10B(n, α) 7Li and 10B(n, α1)7Li* reactions, the total uncertainty ranges from 2.4% to 8.7%. For the 10B(n, α0)7Li reaction, the uncertainty ranges from 3.3% to 32.7%, which is mainly because the counts of the 10B(n, α0)7Li reaction are significantly less than the counts of the 10B(n, α) 7Li and 10B(n, α1)7Li* reactions. In the neutron energy range below 1 keV, the uncertainties of the differential cross sections for the 10B(n, α) 7Li and 10B(n, α1)7Li* reactions primarily come from the uncertainties in normalization, nuclear number, and neutron flux measurements. In contrast, at high neutron energies, statistical error and double-bunch unfolding error are the primary sources of uncertainties. For the 10B(n, α0)7Li reaction, the uncertainties due to statistical errors, double-bunch unfolding, determination of the valid-even-area and background subtraction are larger than those uncertainty of 0B(n, α) 7Li and 10B(n, α1)7Li* reactions. The complete differential cross section data of the present work are provided in the Supporting Information file "Differential cross sections.xlsx".
For the angle-integrated cross sections, the uncertainties due to the statistical errors, double-bunch unfolding, determination of the valid-even-area and background subtraction are significantly reduced, while an additional uncertainty component is introduced by the Legendre polynomial fitting. For the angle-integrated cross sections of the 10B(n, α) 7Li and 10B(n, α1)7Li* reactions, the total uncertainty ranges from 2.4% to 7.0%. For the 10B(n, α0)7Li reaction, the uncertainty ranges from 3.3% to 7.9%. The present experimental data of angle-integrated cross sections for the 10B(n, α1)7Li* ,10B(n, α0)7Li and 10B(n, α)7Li* reactions are included in the Supporting Information file "Angle-integrated cross sections.xlsx".
-
According to Eq. (1), the relative differential cross sections were obtained and subsequently fitted using fourth-order Legendre polynomial series. The fitted functions were then integrated to yield the relative angle-integrated cross sections. As shown in Fig. 6, the relative angle-integrated cross sections for the 10B(n, α1)7Li* reaction (the blue points) were normalized to the standard cross section (angle-integrated cross sections) from IAEA-Std17 [3] in the neutron energy range from 0.5 eV to 1.5 eV. This procedure was used to determine the normalization factor εnor of the present work for both the angle-integrated and differential cross sections.
Figure 6. (color online) The determination of the normalization factor.
The uncertainty of this normalization factor is 1.3%, which accounts for both the uncertainty of the standard cross section and the deviation of cross sections between the normalized results and evaluated values. Table 2 details the sources of the uncertainties and their magnitudes.
Source of uncertainty Magnitude (%) Differential cross sections Angle-integrated cross sections Relative neutron flux 1.5−3.0 1.5−3.0 Statistical error of the valid α events 0.5−5.5a (10.7b) 0.2−2.6 Unfolding of the double-bunch proton beams 0.5−5.6a (18.5b) 0.2−2.8 Determination of the valid-even-area < 4.0a (< 17.5b) < 0.6 a (< 3.0b) Background subtraction < 5.0a (< 22.8b) < 0.1a (< 1.5b) Detection efficiency < 0.1 < 0.1 Number of 10B atoms 1.0 1.0 Detection solid angle < 0.4 < 0.4 Legendre polynomial fitting - 0.2−6.2 Normalization 1.3 1.3 Total uncertainty of the 10B(n, α) 7Li reaction 2.4−8.5 2.4−7.0 Total uncertainty of the 10B(n, α0) 7Li reaction 3.3−32.7 3.3−7.9 Total uncertainty of the 10B(n, α1) 7Li reaction 2.4−8.7 2.4−6.4 a: uncertainties of the 10B(n, α) 7Li and 10B(n, α1) 7Li* reactions. b: uncertainties of the 10B(n, α0) 7Li reaction. Table 2. Sources of uncertainties and their magnitudes.
The sources of uncertainties for the differential cross sections of the 10B(n, α1)7Li* ,10B(n, α0)7Li, and 10B(n, α)7Li reactions include the uncertainties of the counts of events, relative neutron flux, detection solid angles, number of 10B atoms, and normalization factor. Among these, the uncertainties of the counts of the 10B(n, α1)7Li* ,10B(n, α0)7Li, and 10B(n, α)7Li reactions arise from the uncertainties in the statistical error of the valid α events, the unfolding of the double-bunch proton beams, the determination of the valid-even-area, the background subtraction, and the detection efficiency. For the differential cross sections of the 10B(n, α) 7Li and 10B(n, α1)7Li* reactions, the total uncertainty ranges from 2.4% to 8.7%. For the 10B(n, α0)7Li reaction, the uncertainty ranges from 3.3% to 32.7%, which is mainly because the counts of the 10B(n, α0)7Li reaction are significantly less than those of the 10B(n, α) 7Li and 10B(n, α1)7Li* reactions. In the neutron energy range below 1 keV, the uncertainties of the differential cross sections for the 10B(n, α) 7Li and 10B(n, α1)7Li* reactions primarily originate from the uncertainties in normalization, nuclear number, and neutron flux measurements. In contrast, at high neutron energies, statistical errors and double-bunch unfolding errors are the primary sources of uncertainties. For the 10B(n, α0)7Li reaction, the uncertainties due to statistical errors, double-bunch unfolding, determination of the valid-even-area, and background subtraction are larger than those of 0B(n, α) 7Li and 10B(n, α1)7Li* reactions. The complete differential cross section data of the present study are provided in the Supporting Information file "Differential cross sections.xlsx".
For the angle-integrated cross sections, the uncertainties owing to the statistical errors, double-bunch unfolding, determination of the valid-even-area, and background subtraction are significantly reduced, whereas an additional uncertainty component is introduced by the Legendre polynomial fitting. For the angle-integrated cross sections of the 10B(n, α) 7Li and 10B(n, α1)7Li* reactions, the total uncertainty ranges from 2.4% to 7.0%. For the 10B(n, α0)7Li reaction, the uncertainty ranges from 3.3% to 7.9%. The present experimental data for the angle-integrated cross sections for the 10B(n, α1)7Li* ,10B(n, α0)7Li, and 10B(n, α)7Li* reactions are included in the Supporting Information file "Angle-integrated cross sections.xlsx".
-
After the data processing presented in Sec. III, the differential cross sections for the 10B(n, α)7Li reaction were obtained from 20.1° to 158.3° (13 angles) in the neutron energy region from 0.3 eV to 3.0 MeV with 10 bpd (70 energy points). The differential cross sections for the 10B(n, α0)7Li and 10B(n, α1)7Li* reactions were also obtained at the same angular positions in the neutron energy region from 0.3 eV to 1.0 MeV with 10 bpd (65 energy points). The present differential cross section results are discussed in Sec. IV.A. In addition, the present angle-integrated cross sections for these three reactions were obtained in the corresponding neutron energy range, which are discussed in Sec. IV.B.
-
After the data processing presented in Sec. III, The differential cross sections for the 10B(n, α)7Li reaction were obtained from 20.20 to 158.70 (13 angles) in the neutron energy region from 0.3 eV to 3.0 MeV with 10 bpd (70 energy points). The differential cross sections for the 10B(n, α0)7Li and 10B(n, α1)7Li* reactions were also obtained at the same angular positions in the neutron energy region from 0.3 eV to 1.0 MeV with 10 bpd (65 energy points). The present differential cross sections results are discussed in Sec. IV.A. In addition, the present angle-integrated cross sections for these three reactions were also obtained in the corresponding neutron energy range, which are discussed in Sec. IV.B.
-
Typical measurement results of differential cross sections for 10B(n, α1)7Li*,10B(n, α0)7Li, and 10B(n, α)7Li* reactions are shown in Figs. 7, 8, and 9, respectively. These results are compared with existing data from measurements and evaluations.
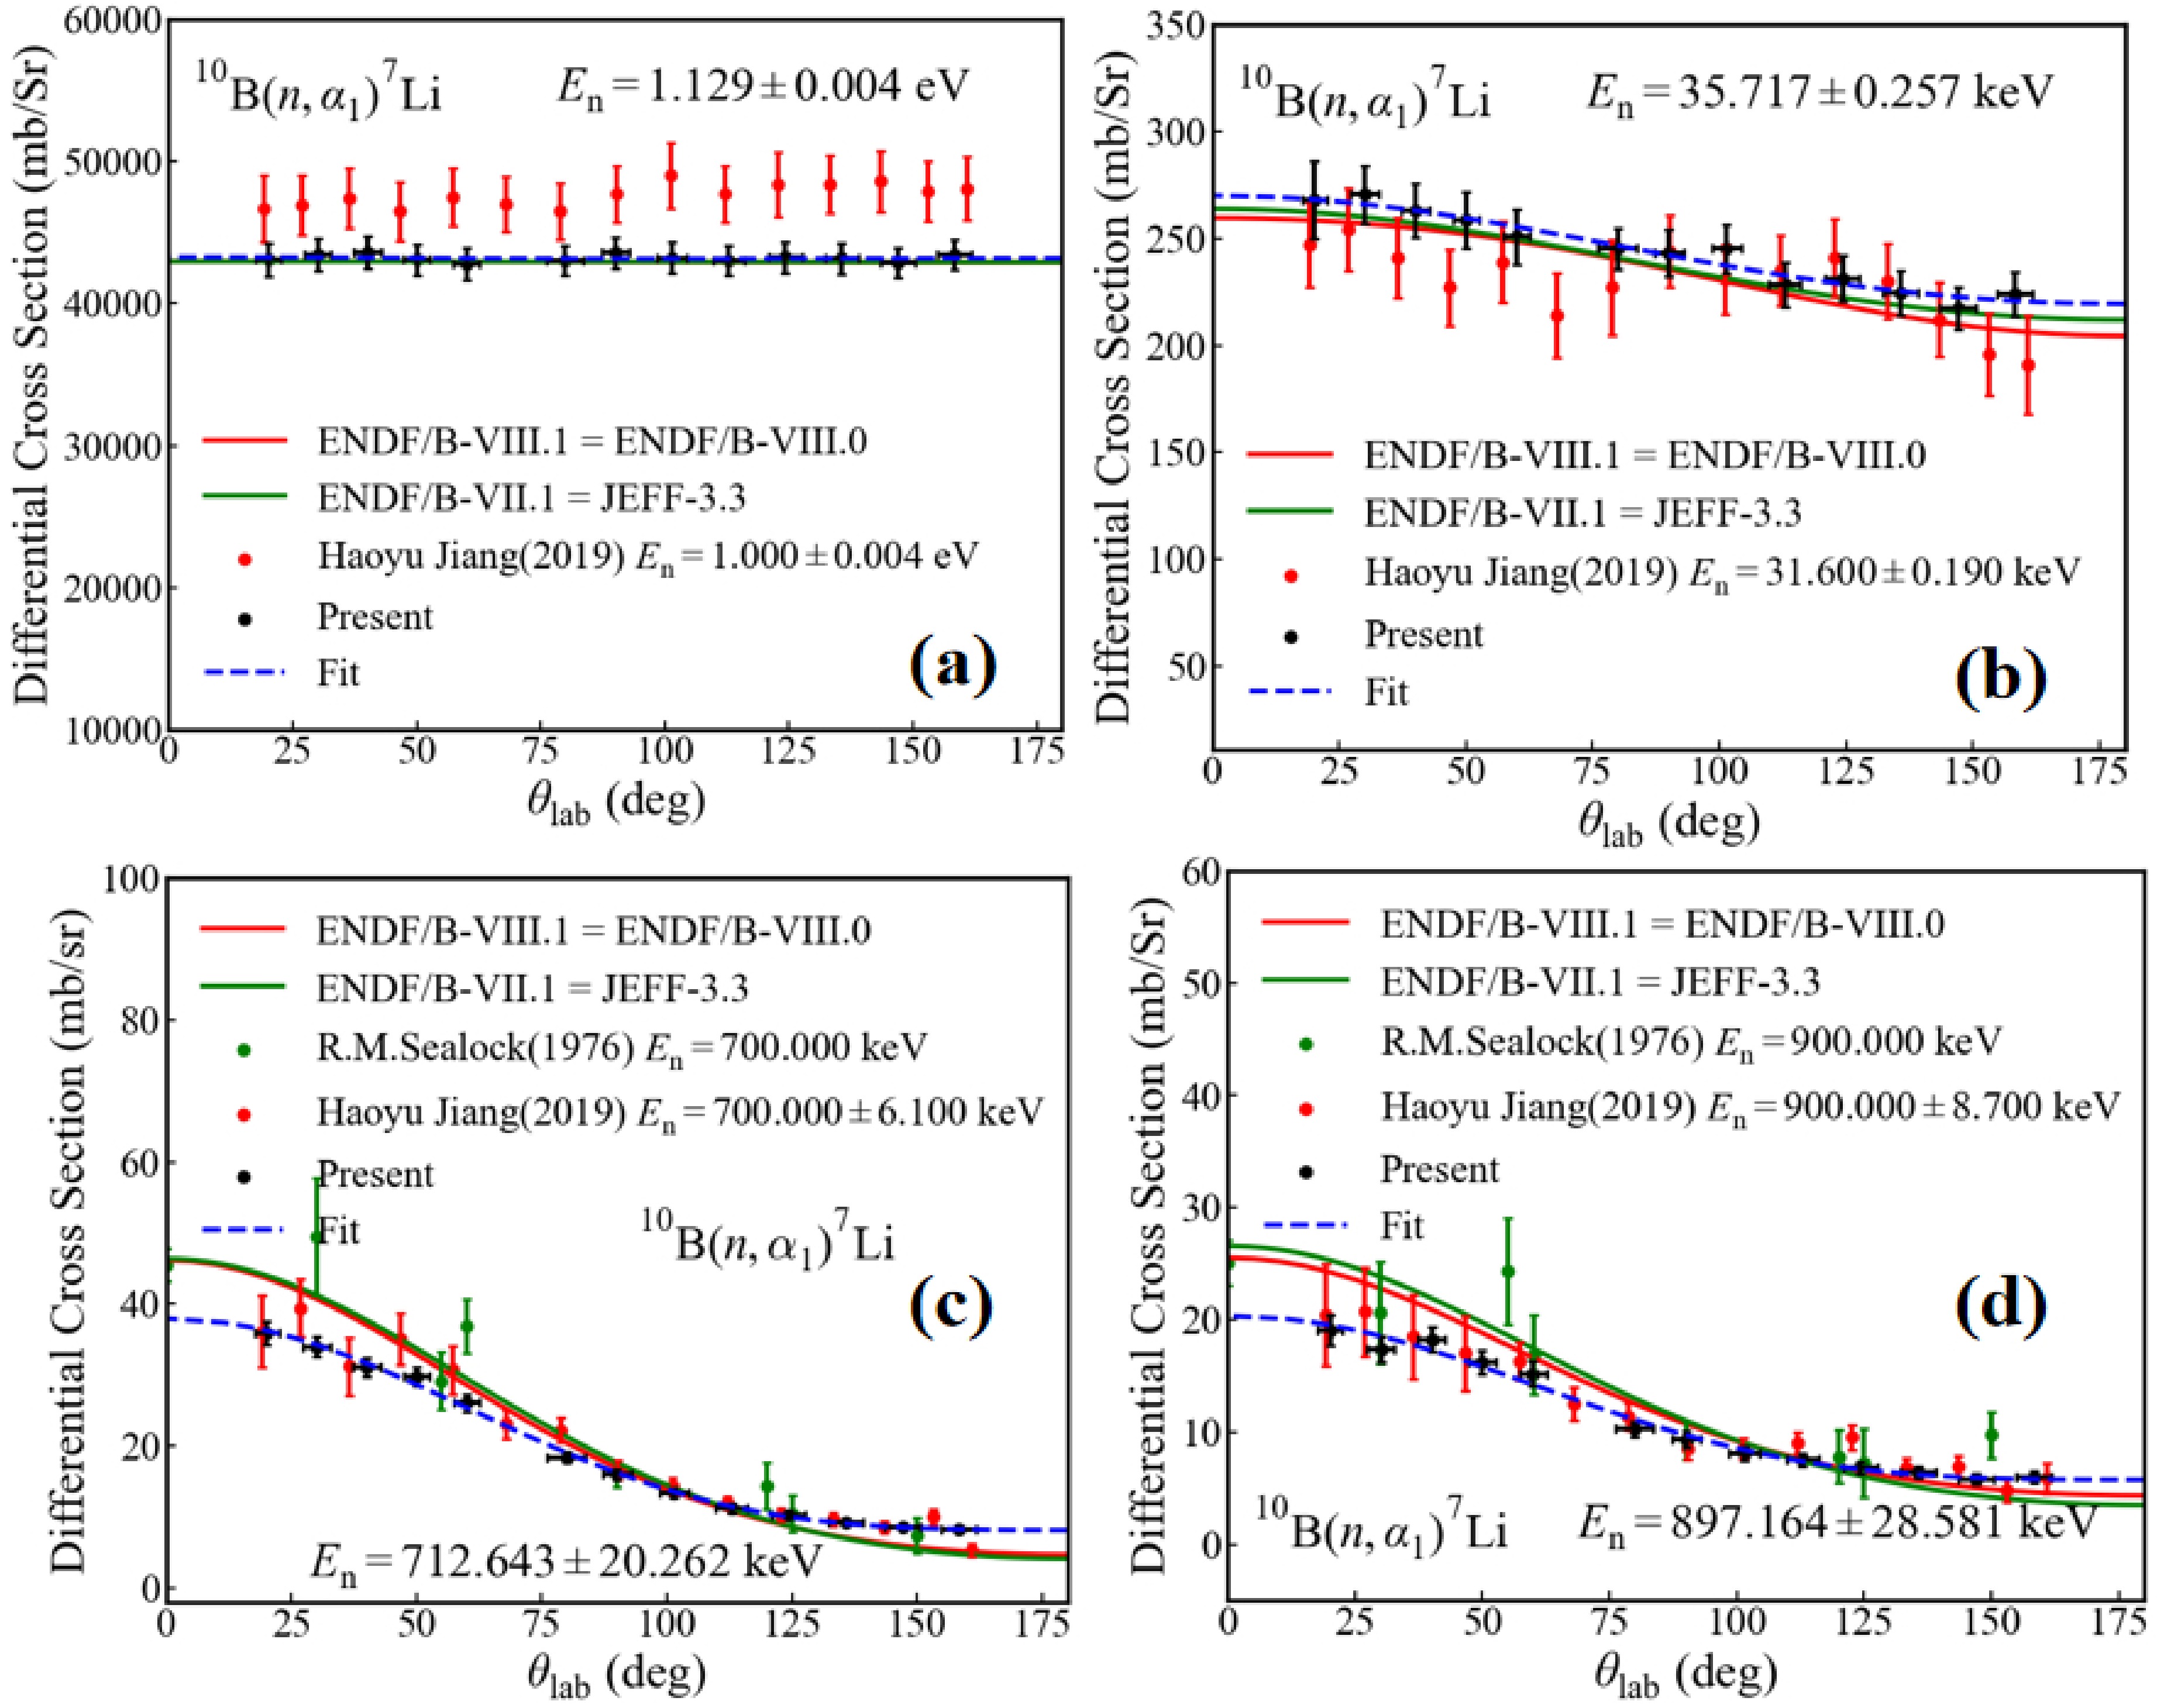
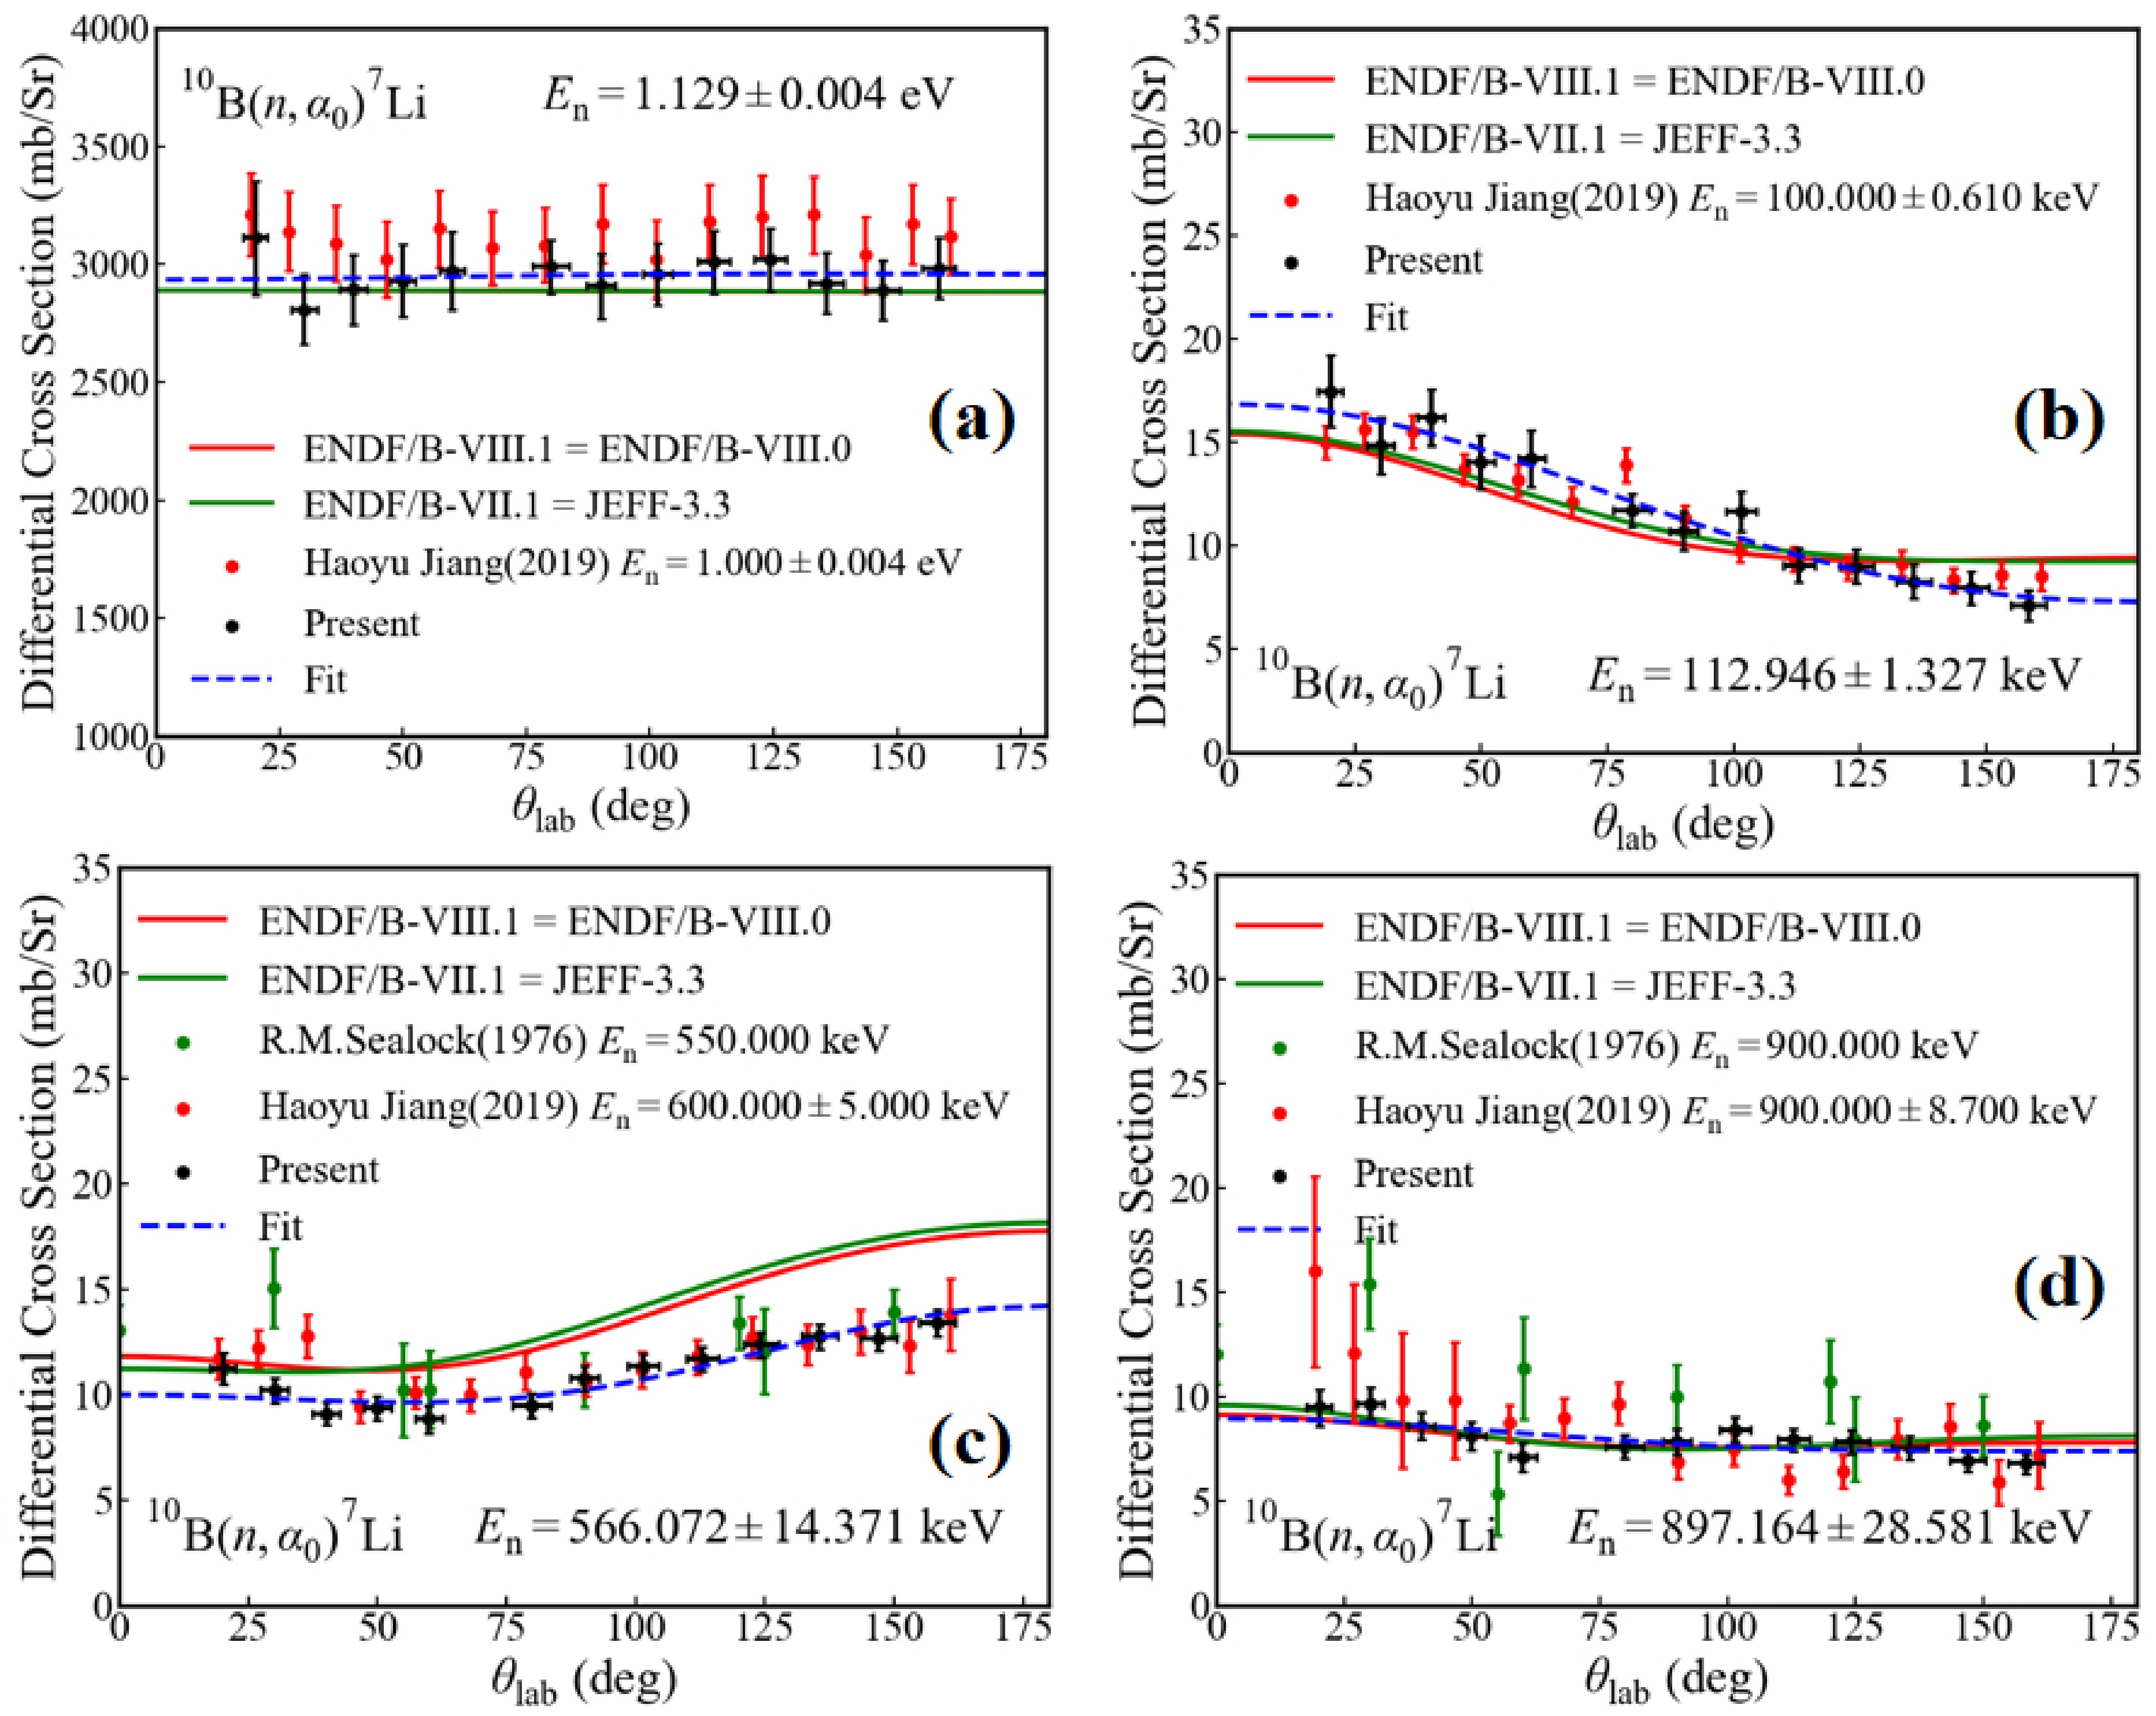
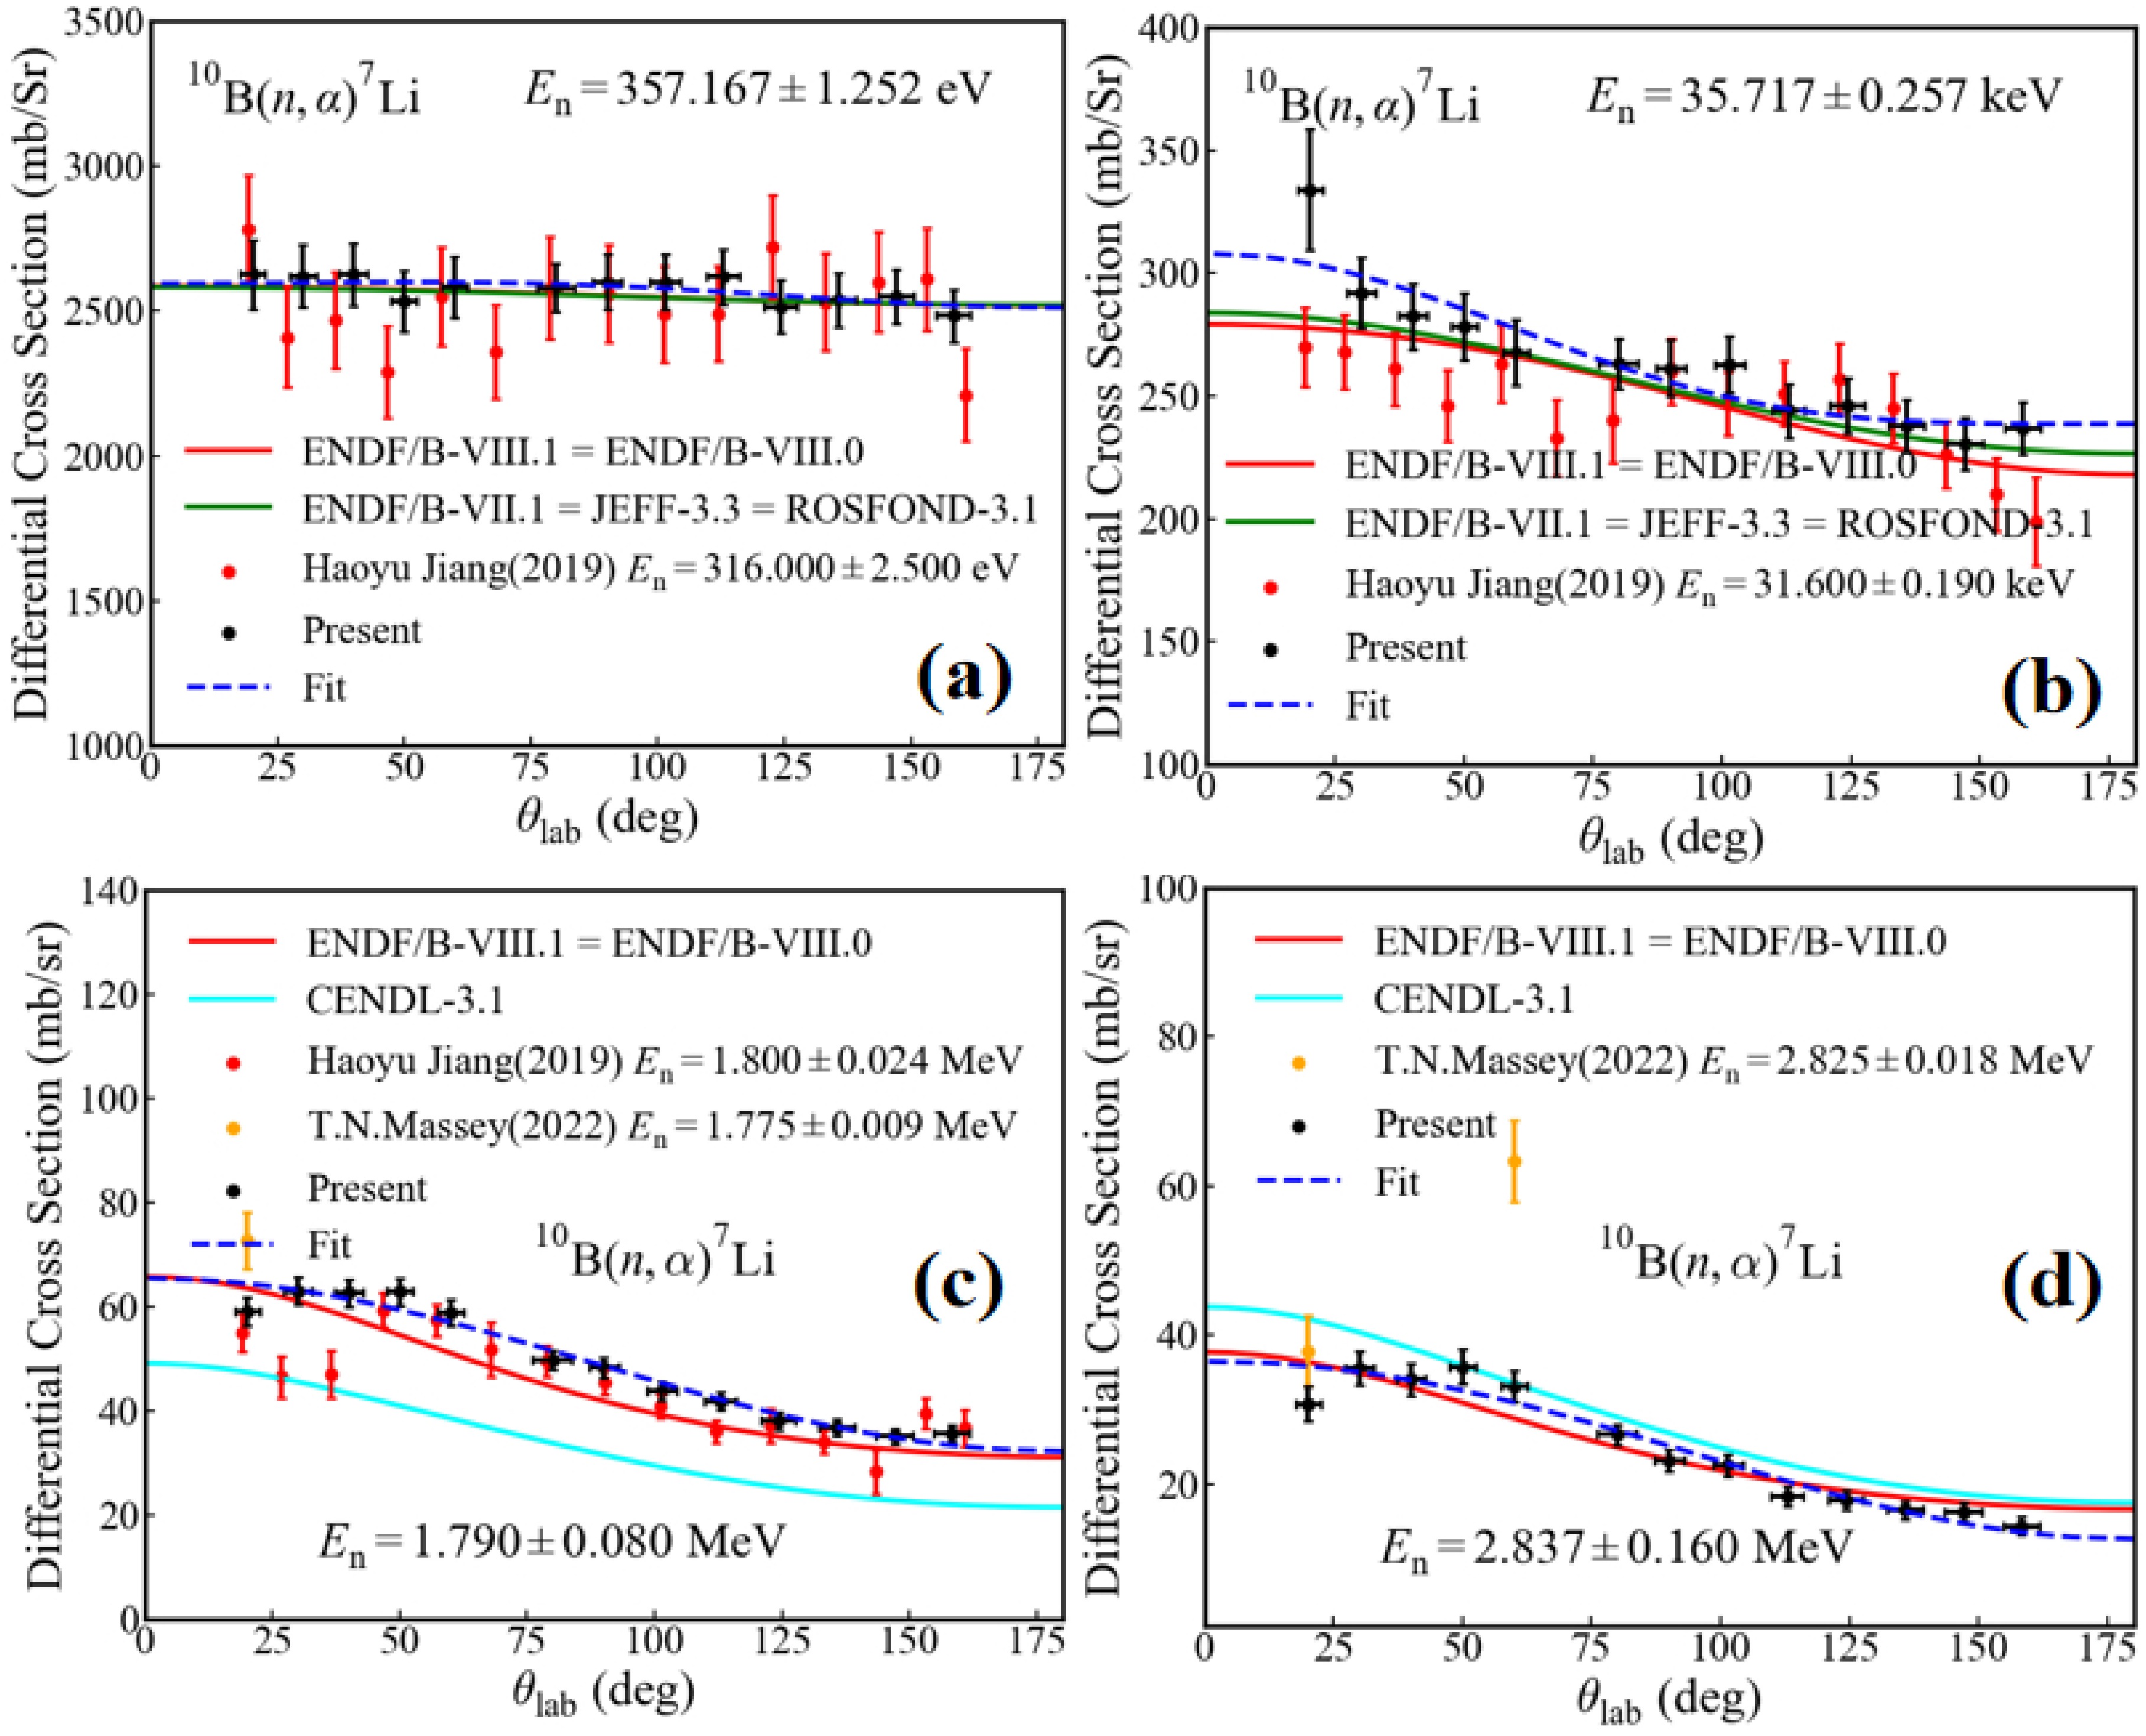
In the neutron energy range below 1 keV, the present differential cross sections of these three reactions exhibit a nearly isotropic distribution in the center-of-mass system, consistent with both the evaluations and measurements of Haoyu Jiang (2019) [7]. As shown in Figs. 7(a), 8(a), and 9(a), this agreement confirms the reliability of the present experimental results to an extent. In Fig. 7(a), the differences between the present results (black points) and the previous results (red points) arise from the difference in neutron energy. According to IAEA-Std17 [3], the 10B(n, α1)7Li* cross section is 540 b at En = 1.129±0.004 eV for the present measurement, compared to 573 b at En = 1.000±0.004 eV for the previous measurement.
In the neutron energy range from 1 keV to 100 keV, the present differential cross sections of these three reactions exhibit a slight forward bias in the laboratory reference system, due to the effect of nuclear reaction kinetics, as shown in Figs. 7(b) and 9(b). In addition, these results agree well with both the evaluations and measurements.
In the neutron energy range from 100 keV to 1 MeV, the present differential cross sections of the 10B(n, α1)7Li* reaction display a strong forward bias, which is mainly attributed to the 7/2+ s-wave state of the compound nucleus 11B [30], as shown in Figs. 7(c) and 7(d). Compared with existing measurements, the present results are consistent with the measurement data of Haoyu Jiang (2019) [7]. However, noticeable discrepancies are observed between the present data and the measurement data of R.M.Sealock (1974) [5]. Compared with the evaluations, the present results show a similar forward trend, with smaller magnitudes than those predicted in the evaluation libraries including ENDF/B-VIII.1 [21] and JEFF-3.3 [23]. For the 10B(n, α0)7Li reaction, the present differential cross sections show a strong backward bias in the 0.3−0.6 MeV region, which is attributed to the 5/2– p-wave ( En ~ 0.52 MeV) resonance of the compound nucleus 11B [30], as shown in Fig. 8(c). In the 0.6−1.0 MeV region, the present differential cross sections of the 10B(n, α0)7Li reaction exhibit a nearly isotropic distribution in the laboratory system, as shown in Fig. 8(d). Compared with the measurement results, the present results are consistent with the measurement data of Haoyu Jiang (2019) [7] and are lower than those of R.M.Sealock (1974) [5] at small angles.
In the neutron energy range of 1.0−3.0 MeV, the present differential cross sections of the 10B(n, α)7Li reaction exhibit a forward peak, which might be attributed to the resonances of the 9/2– p-wave state ( En = 1.83 MeV) and 5/2+ or 7/2+ d-wave state ( En = 1.88 MeV) of the compound nucleus 11B [32], as shown in Figs. 9(c) and 9(d). Compared with the data from evaluations, the present results deviate from the evaluated trends in the ENDF/B-VIII.1 [21] and CENDL-3.2 [27] libraries, where the differential cross sections decrease monotonically with increasing emission angle. The experimental results are in best agreement with the ENDF/B-VIII.1 data [21] among all the evaluated nuclear data libraries. In comparison with previous measurements, the present differential cross sections of the 10B(n, α)7Li reaction at 30.1° and 40.0° are significantly higher than those reported by Jiang (2019) [7], as shown in Fig. 9(c). This might be due to the excessive background noise in the experiments by Jiang (2019) [7]. Compared with the results of T.N. Massey (2022) [8], the present data have lower values at the forward emission angles, as shown in Fig. 9(d).
In general, the present differential cross sections are consistent with the evaluation data. Compared with existing measurement results of the differential cross sections for the 10B(n, α1)7Li* ,10B(n, α0)7Li, and 10B(n, α)7Li reactions available in the EXFOR library [4], the present results are in good overall agreement with those reported by Haoyu Jiang (2019) [7]. In comparison, the present results exhibit a more systematic behavior and smaller uncertainties, particularly for the 10B(n, α0)7Li reaction, owing to improved statistics.
-
Typical measurement results of differential cross sections for 10B(n, α1)7Li*,10B(n, α0)7Li, and 10B(n, α)7Li* reactions are shown in Figs. 7, 8, and 9, respectively. These results are compared with existing data from measurements and evaluations.
In the neutron energy range below 1 keV, the present differential cross sections of these three reactions exhibit a nearly isotropic distribution in the center-of-mass system, consistent with both the evaluations and measurements of Haoyu Jiang (2019) [7]. As shown in Figs. 7(a), 8(a), and 9(a), this agreement confirms the reliability of the present experimental results to an extent. In Fig. 7(a), the differences between the present results (black points) and the previous results (red points) arise from the difference in neutron energy. According to IAEA-Std17 [3], the 10B(n, α1)7Li* cross section is 540 b at En = 1.129±0.004 eV for the present measurement, compared to 573 b at En = 1.000±0.004 eV for the previous measurement.
In the neutron energy range from 1 keV to 100 keV, the present differential cross sections of these three reactions exhibit a slight forward bias in the laboratory reference system, due to the effect of nuclear reaction kinetics, as shown in Figs. 7(b) and 9(b). In addition, these results agree well with both the evaluations and measurements.
In the neutron energy range from 100 keV to 1 MeV, the present differential cross sections of the 10B(n, α1)7Li* reaction display a strong forward bias, which is mainly attributed to the 7/2+ s-wave state of the compound nucleus 11B [30], as shown in Figs. 7(c) and 7(d). Compared with existing measurements, the present results are consistent with the measurement data of Haoyu Jiang (2019) [7]. However, noticeable discrepancies are observed between the present data and the measurement data of R.M.Sealock (1974) [5]. Compared with the evaluations, the present results show a similar forward trend, with smaller magnitudes than those predicted in the evaluation libraries including ENDF/B-VIII.1 [21] and JEFF-3.3 [23]. For the 10B(n, α0)7Li reaction, the present differential cross sections show a strong backward bias in the 0.3−0.6 MeV region, which is attributed to the 5/2– p-wave ( En ~ 0.52 MeV) resonance of the compound nucleus 11B [30], as shown in Fig. 8(c). In the 0.6−1.0 MeV region, the present differential cross sections of the 10B(n, α0)7Li reaction exhibit a nearly isotropic distribution in the laboratory system, as shown in Fig. 8(d). Compared with the measurement results, the present results are consistent with the measurement data of Haoyu Jiang (2019) [7] and are lower than those of R.M.Sealock (1974) [5] at small angles.
In the neutron energy range of 1.0−3.0 MeV, the present differential cross sections of the 10B(n, α)7Li reaction exhibit a forward peak, which might be attributed to the resonances of the 9/2– p-wave state ( En = 1.83 MeV) and 5/2+ or 7/2+ d-wave state ( En = 1.88 MeV) of the compound nucleus 11B [32], as shown in Figs. 9(c) and 9(d). Compared with the data from evaluations, the present results deviate from the evaluated trends in the ENDF/B-VIII.1 [21] and CENDL-3.2 [27] libraries, where the differential cross sections decrease monotonically with increasing emission angle. The experimental results are in best agreement with the ENDF/B-VIII.1 data [21] among all the evaluated nuclear data libraries. In comparison with previous measurements, the present differential cross sections of the 10B(n, α)7Li reaction at 30.1° and 40.0° are significantly higher than those reported by Jiang (2019) [7], as shown in Fig. 9(c). This might be due to the excessive background noise in the experiments by Jiang (2019) [7]. Compared with the results of T.N. Massey (2022) [8], the present data have lower values at the forward emission angles, as shown in Fig. 9(d).
In general, the present differential cross sections are consistent with the evaluation data. Compared with existing measurement results of the differential cross sections for the 10B(n, α1)7Li* ,10B(n, α0)7Li, and 10B(n, α)7Li reactions available in the EXFOR library [4], the present results are in good overall agreement with those reported by Haoyu Jiang (2019) [7]. In comparison, the present results exhibit a more systematic behavior and smaller uncertainties, particularly for the 10B(n, α0)7Li reaction, owing to improved statistics.
-
Typical measurement results of differential cross sections for 10B(n, α1)7Li*,10B(n, α0)7Li and 10B(n, α)7Li* reactions are shown in Figs. 7, 8 and 9, respectively. These results are compared with existing data from measurements and evaluations.
In the neutron energy range below 1 keV, the present differential cross sections of these three reactions exhibit a nearly isotropic distribution in the center-of-mass system, consistent with both the evaluations and with the measurements of Haoyu Jiang (2019) [7]. As shown in Figs. 7(a), 8(a) and 9(a), this agreement confirms the reliability of the present experimental results to a certain extent. In Fig. 7(a), the differences between the present results (black points) and the previous results (red points) arise from the difference in neutron energy. According to IAEA-Std17 [3], the 10B(n, α1)7Li* cross section is 540 b at En = 1.129±0.004 eV for the present measurement, compared to 573 b at En = 1.000±0.004 eV for the previous measurement.
In the neutron energy range from 1 keV to 100 keV, the present differential cross sections of these three reactions exhibit a slight forward bias in the laboratory reference system, due to the effect of nuclear reaction kinetics, as shown in Figs. 7(b) and 9(b). In addition, these results agree well with both the results from evaluations and measurements.
In the neutron energy range from 100 keV to 1 MeV, the present differential cross sections of the 10B(n, α1)7Li* reaction display a strong forward bias, which are mainly contributed from the 7/2+ s-wave state of the compound nucleus 11B [30], as shown in Figs. 7(c), and 7(d). Compared with those from existing measurements, the present results are consistent with the measurement data of Haoyu Jiang (2019) [7]. Noticeable discrepancies are observed between the present data and the measurement data of R.M.Sealock (1974) [5]. Compared to the evaluations, the present results show a similar forward trend, though with smaller magnitudes than those predicted in the evaluation libraries including ENDF/B-VIII.1 [21] and JEFF-3.3 [23]. For the 10B(n, α0)7Li reaction, the present differential cross sections show a strong backward bias at the 0.3 ~ 0.6 MeV region, which are contributed from the 5/2- p-wave (En ~ 0.52 MeV) resonance of the compound nucleus 11B [30], as shown in Fig. 8(c). In the 0.6 ~ 1.0 MeV region, the present differential cross sections of the 10B(n, α0)7Li reaction become nearly an isotropic distribution in the laboratory system, as shown in Fig. 8(d). Compared to the measurement results, the present results are consistent with the measurement data of Haoyu Jiang (2019) [7], and are lower than the measurement data of R.M.Sealock (1974) [5] at small angles.
In the neutron energy range of 1.0 MeV ~ 3.0 MeV, the present differential cross sections of the 10B(n, α)7Li reaction show a forward-peak behavior, which might be contributed from the resonances of the 9/2- p-wave state (En = 1.83 MeV) and 5/2+ or 7/2+ d-wave state (En = 1.88 MeV) of the compound nucleus 11B [32], as shown in Figs. 9(c) and 9(d). Compared with the data from evaluations, the present results deviate from the evaluated trends in ENDF/B-VIII.1 [21] and CENDL-3.2 [27] libraries, where the differential cross sections decrease monotonically with increasing emission angle, the present experimental results are in best agreement with the data from ENDF/B-VIII.1 [21] among all the evaluated nuclear data libraries. In comparison with previous measurements, the present differential cross sections of the 10B(n, α)7Li reaction at 30.1o and 40.0o are significantly higher than those of Haoyu Jiang(2019) [7], as shown in Fig. 9(c). This might be due to the excessive background noise in the experiments of Haoyu Jiang (2019) [7]. Compared with the results of T.N. Massey (2022) [8], the present data are lower at the forward emission angles, as shown in Fig. 9(d).
In general, the present differential cross sections are consistent with the evaluation data. Compared with existing measurement results of the differential cross sections for the 10B(n, α1)7Li* ,10B(n, α0)7Li and 10B(n, α)7Li reactions available in the EXFOR library [4], the present results are in good overall agreement with those reported by Haoyu Jiang (2019) [7]. In comparison, the present results exhibit more systematic behavior and smaller uncertainties, particularly for the 10B(n, α0)7Li reaction, owing to improved statistics.
-
Typical measurement results of differential cross sections for 10B(n, α1)7Li*,10B(n, α0)7Li, and 10B(n, α)7Li* reactions are shown in Figs. 7, 8, and 9, respectively. These results are compared with existing data from measurements and evaluations.
In the neutron energy range below 1 keV, the present differential cross sections of these three reactions exhibit a nearly isotropic distribution in the center-of-mass system, consistent with both the evaluations and measurements of Haoyu Jiang (2019) [7]. As shown in Figs. 7(a), 8(a), and 9(a), this agreement confirms the reliability of the present experimental results to an extent. In Fig. 7(a), the differences between the present results (black points) and the previous results (red points) arise from the difference in neutron energy. According to IAEA-Std17 [3], the 10B(n, α1)7Li* cross section is 540 b at En = 1.129±0.004 eV for the present measurement, compared to 573 b at En = 1.000±0.004 eV for the previous measurement.
In the neutron energy range from 1 keV to 100 keV, the present differential cross sections of these three reactions exhibit a slight forward bias in the laboratory reference system, due to the effect of nuclear reaction kinetics, as shown in Figs. 7(b) and 9(b). In addition, these results agree well with both the evaluations and measurements.
In the neutron energy range from 100 keV to 1 MeV, the present differential cross sections of the 10B(n, α1)7Li* reaction display a strong forward bias, which is mainly attributed to the 7/2+ s-wave state of the compound nucleus 11B [30], as shown in Figs. 7(c) and 7(d). Compared with existing measurements, the present results are consistent with the measurement data of Haoyu Jiang (2019) [7]. However, noticeable discrepancies are observed between the present data and the measurement data of R.M.Sealock (1974) [5]. Compared with the evaluations, the present results show a similar forward trend, with smaller magnitudes than those predicted in the evaluation libraries including ENDF/B-VIII.1 [21] and JEFF-3.3 [23]. For the 10B(n, α0)7Li reaction, the present differential cross sections show a strong backward bias in the 0.3−0.6 MeV region, which is attributed to the 5/2– p-wave ( En ~ 0.52 MeV) resonance of the compound nucleus 11B [30], as shown in Fig. 8(c). In the 0.6−1.0 MeV region, the present differential cross sections of the 10B(n, α0)7Li reaction exhibit a nearly isotropic distribution in the laboratory system, as shown in Fig. 8(d). Compared with the measurement results, the present results are consistent with the measurement data of Haoyu Jiang (2019) [7] and are lower than those of R.M.Sealock (1974) [5] at small angles.
In the neutron energy range of 1.0−3.0 MeV, the present differential cross sections of the 10B(n, α)7Li reaction exhibit a forward peak, which might be attributed to the resonances of the 9/2– p-wave state ( En = 1.83 MeV) and 5/2+ or 7/2+ d-wave state ( En = 1.88 MeV) of the compound nucleus 11B [32], as shown in Figs. 9(c) and 9(d). Compared with the data from evaluations, the present results deviate from the evaluated trends in the ENDF/B-VIII.1 [21] and CENDL-3.2 [27] libraries, where the differential cross sections decrease monotonically with increasing emission angle. The experimental results are in best agreement with the ENDF/B-VIII.1 data [21] among all the evaluated nuclear data libraries. In comparison with previous measurements, the present differential cross sections of the 10B(n, α)7Li reaction at 30.1° and 40.0° are significantly higher than those reported by Jiang (2019) [7], as shown in Fig. 9(c). This might be due to the excessive background noise in the experiments by Jiang (2019) [7]. Compared with the results of T.N. Massey (2022) [8], the present data have lower values at the forward emission angles, as shown in Fig. 9(d).
In general, the present differential cross sections are consistent with the evaluation data. Compared with existing measurement results of the differential cross sections for the 10B(n, α1)7Li* ,10B(n, α0)7Li, and 10B(n, α)7Li reactions available in the EXFOR library [4], the present results are in good overall agreement with those reported by Haoyu Jiang (2019) [7]. In comparison, the present results exhibit a more systematic behavior and smaller uncertainties, particularly for the 10B(n, α0)7Li reaction, owing to improved statistics.
-
The present results of angle-integrated cross sections for the 10B(n, α1)7Li* ,10B(n, α0)7Li, and 10B(n, α)7Li reactions are shown in Figs. 10, 11, and 12, which are compared with existing measurements and evaluation results. The inset in the upper right corner of these three figures shows enlarged views in the 0.1−3.0 MeV region. The present results are in good agreement with the findings from evaluation libraries, including ENDF/B-VIII.1 [21], ENDF/B-VII.1 [28], JEFF-3.3 [23], ROSFOND-3.1 [24], CENDL-3.2 [27], and JENDL-5.0 [29].
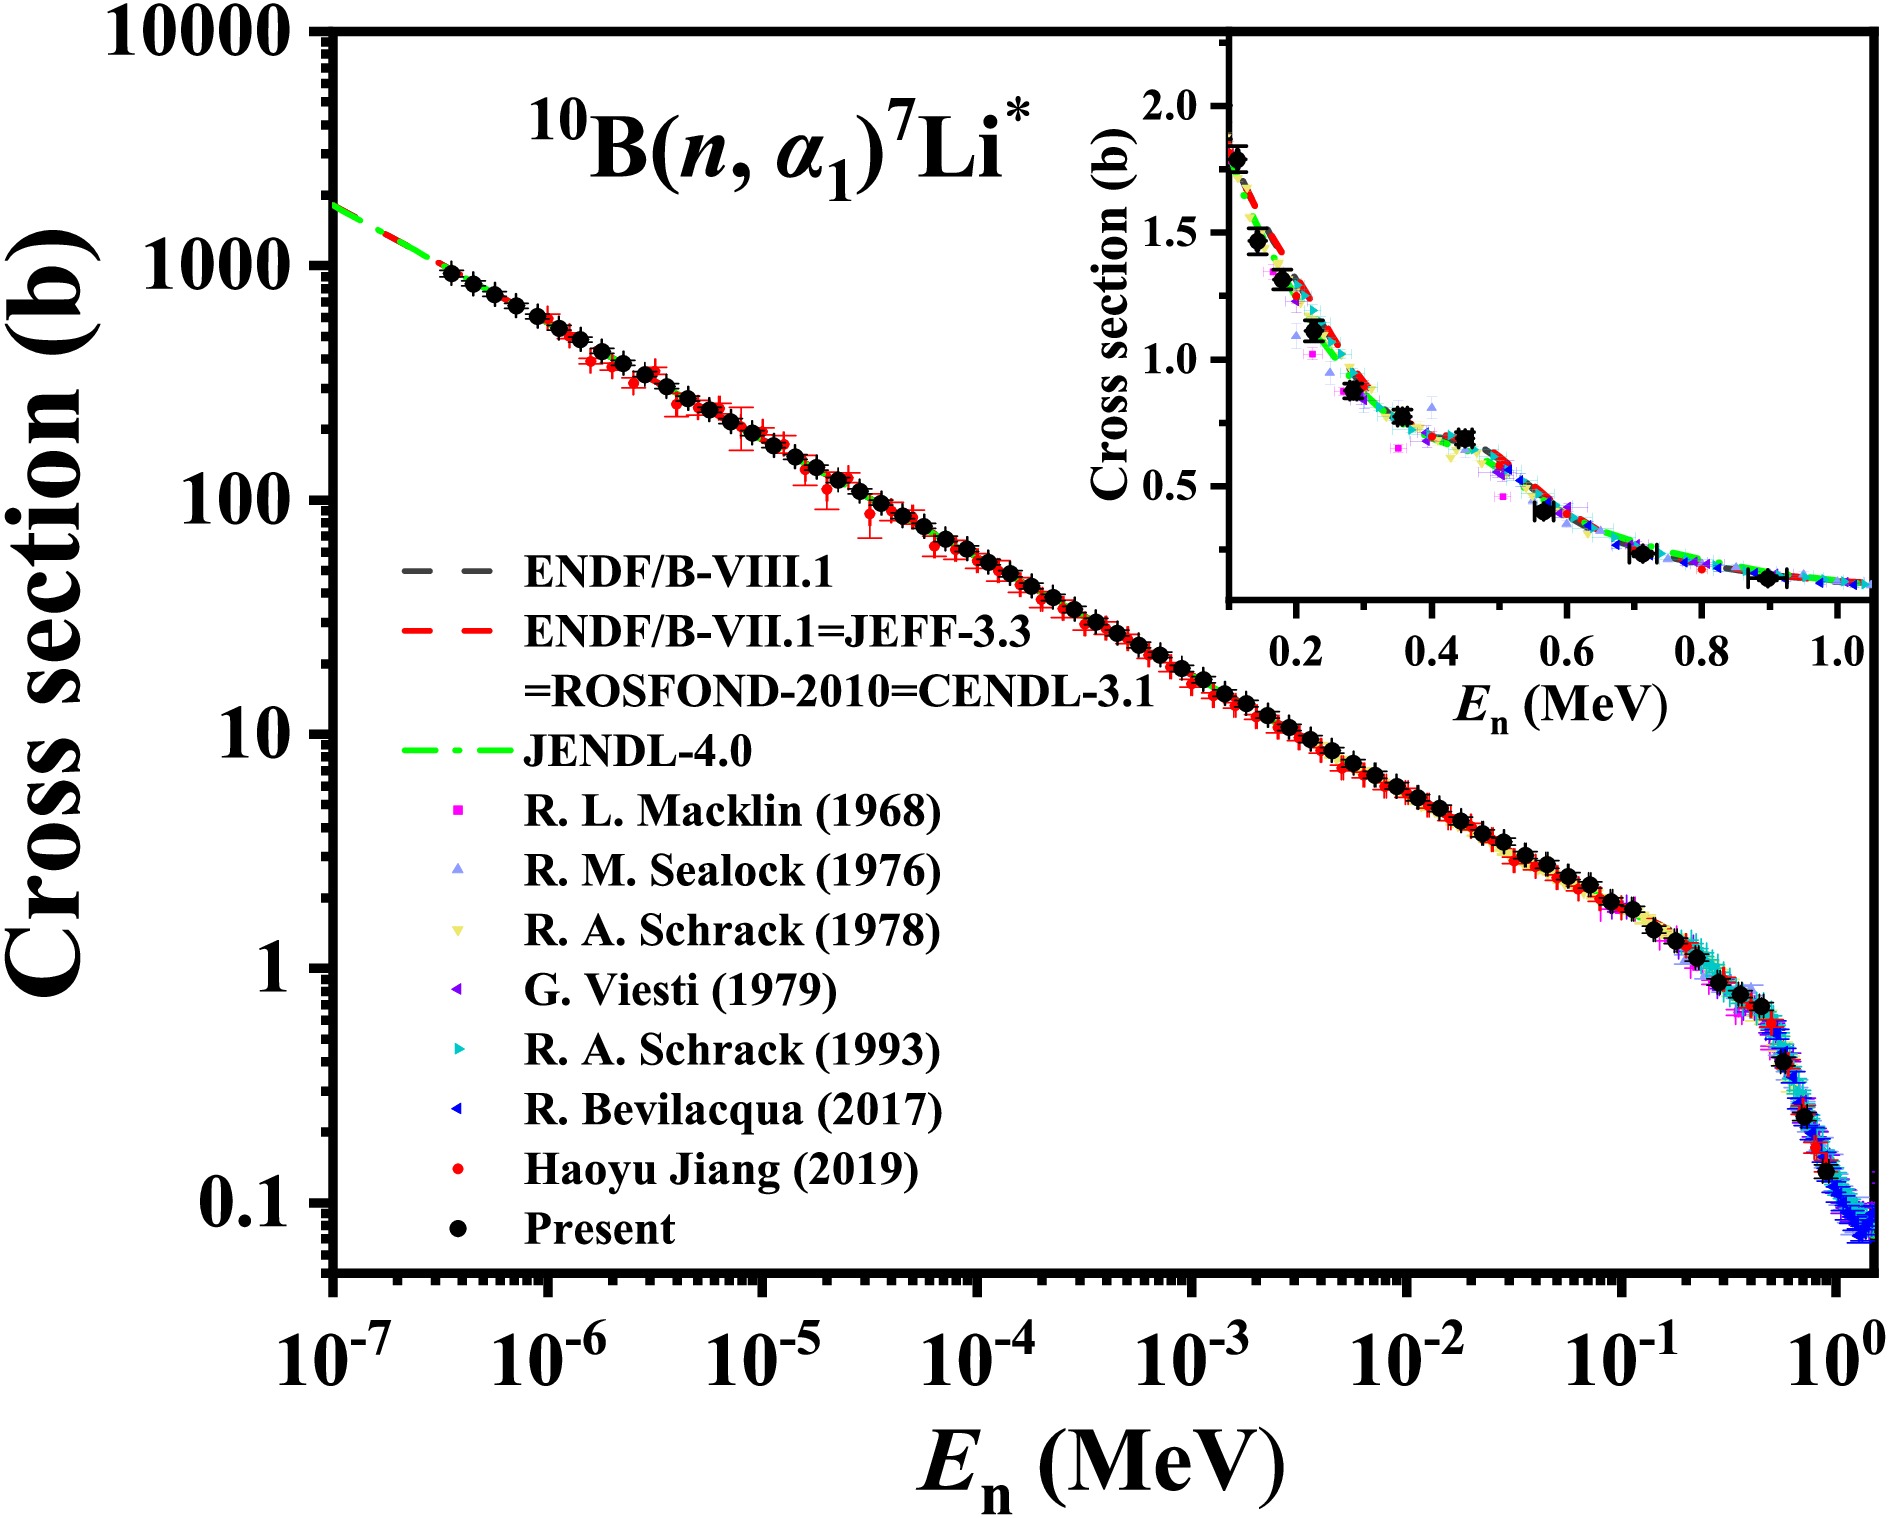
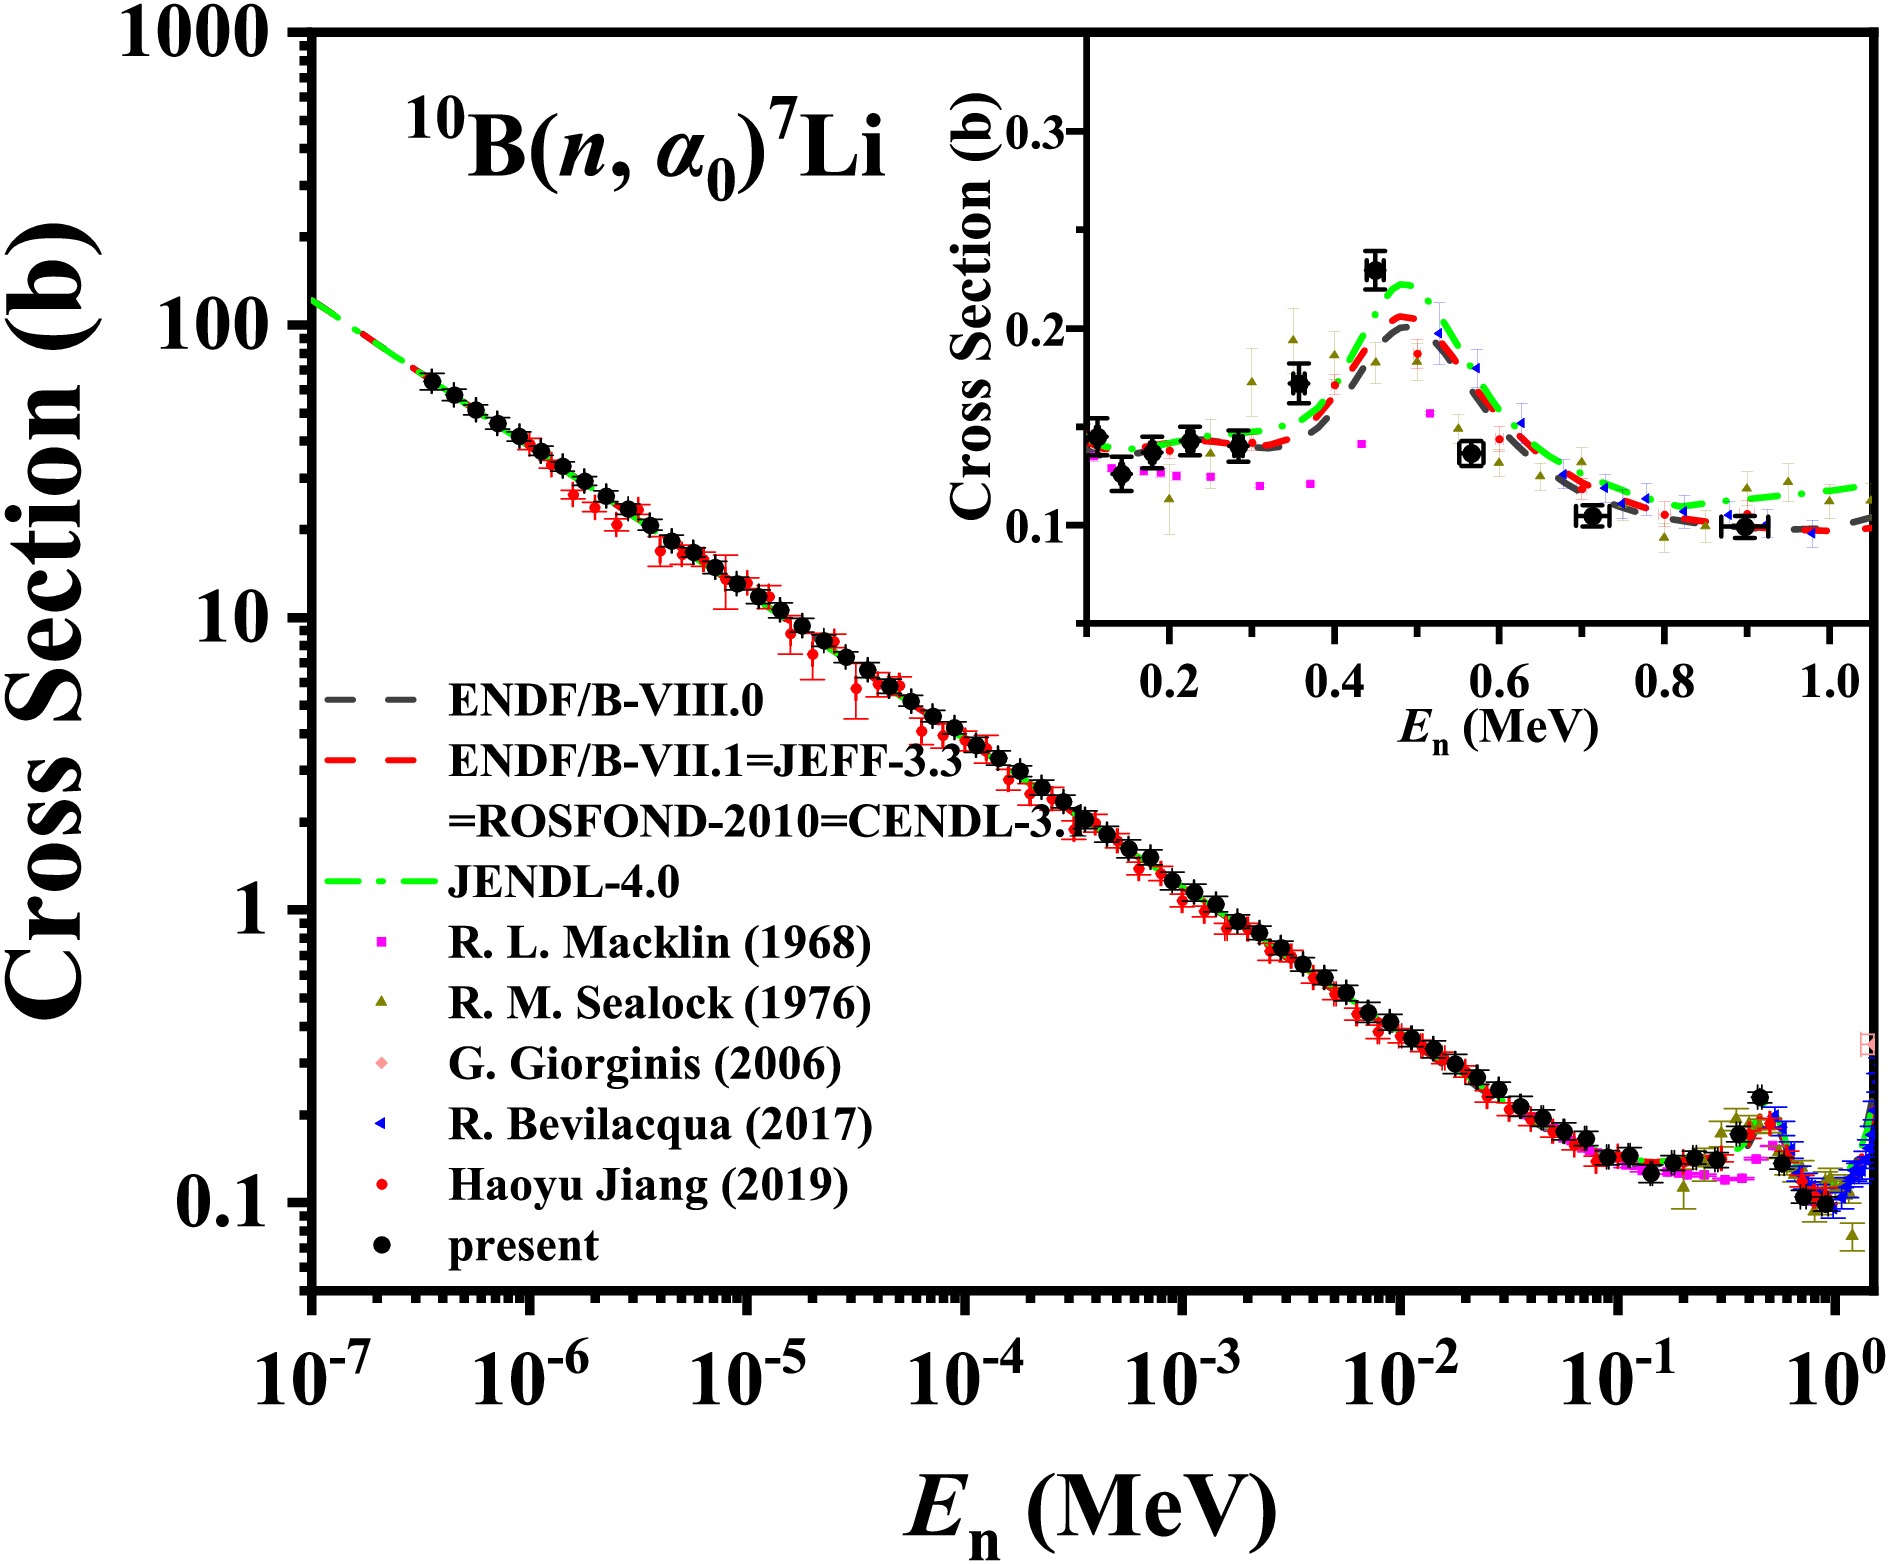
In the neutron energy range from 0.3 eV to 100 keV, where the excitation functions of these three reactions follow the 1/v law, the present angle-integrated cross sections agree well with the evaluation results. In this energy region, given that the s-wave states of α1 partial (Γn(C.M.) = 0.77 MeV and Γα(C.M.) = 0.113 MeV) have a larger width compared with the α0 partial width (Γα(C.M.) = 0.001 MeV) [30], the cross sections of the 10B(n, α1)7Li* reaction are much larger than those of the 10B(n, α0)7Li reaction. Compared with the results of Haoyu Jiang (2019) [7], the present cross sections do not exhibit oscillations as a function of the neutron energy and have smaller uncertainties because the energy spectrum was measured using the 6Li-Si monitor instead of the 235U(n, f) reaction. Compared with the results of Haoyu Jiang (2019) [7], the present uncertainties of the cross sections are reduced from 2.2%−21.6% to 2.0%−7.6%. In the experiment of Haoyu Jiang (2019) [7], the neutron energy spectrum was measured using a multi-layer fission chamber, which is based on the cross section data of the 235U(n, f) reaction [12]. The cross sections of the 235U(n, f) reaction exhibit dense resonance structures in the neutron energy region below 100 keV. On the contrary, the cross sections of the 6Li(n, t)4He reaction follow a 1/v law without significant resonance structures in the same neutron energy range. Thus, in the neutron energy region below 100 keV, the uncertainties of the present neutron energy spectrum measured using the 6Li-Si monitor are smaller.
In the neutron energy region from 100 keV to 1 MeV, the excitation functions of these three reactions do not follow the 1/v law. In the 0.5−1.0 MeV, the angle-integrated cross sections of the 10B(n, α1)7Li* and 10B(n, α)7Li reactions exhibit a rapid decline, as shown in Figs. 10 and 12. Conversely, the angle-integrated cross sections of the 10B(n, α0)7Li cross section have a resonance peak in the 300 keV – 600 keV region, due to the effect of 5/2– p-wave ( En ~ 0.52 MeV) resonance [30], as shown in Fig. 11. This resonance state significantly increases the 10B(n, α0)7Li cross sections and leads to a rapid decrease in the 10B(n, α1)7Li* cross sections above 500 keV. The angle-integrated cross sections of the 10B(n, α1)7Li* and 10B(n, α)7Li reactions are consistent with the evaluation data. However, the present angle-integrated cross sections of the 10B(n, α0)7Li reaction are higher at En < 0.5 MeV and lower at En > 0.5 MeV than the evaluations and other measurements. Compared with existing measurement data, the present cross section data of the 10B(n, α)7Li reaction are closer to the results of Haoyu Jiang (2019) [7] and lower than those of Friesenhahn (1975) [31].
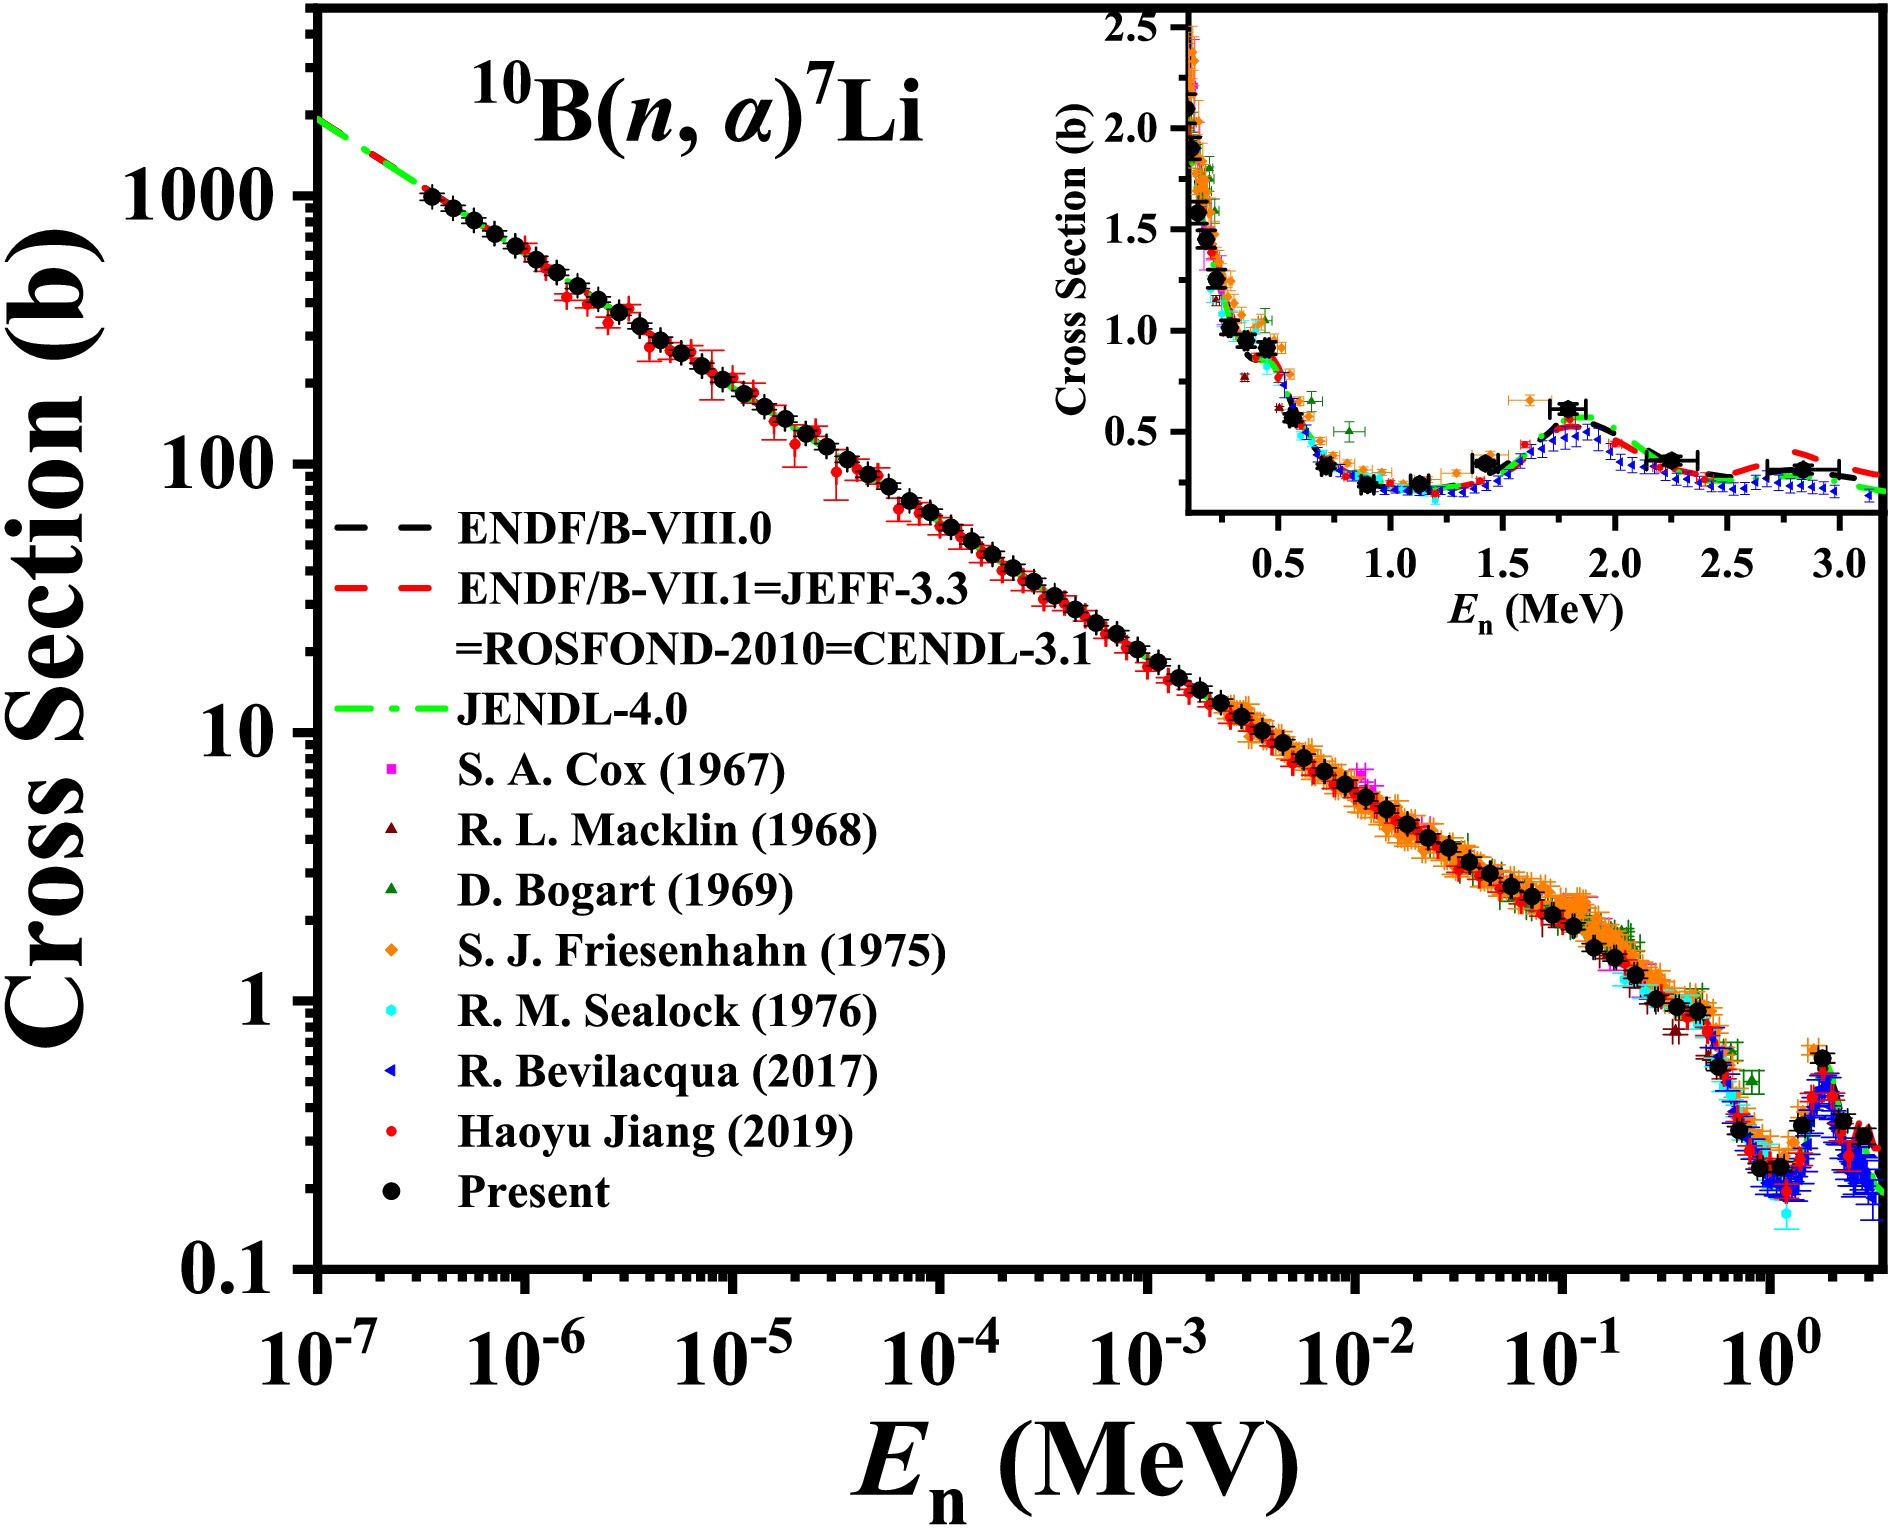
In the neutron energy region from 1.0 MeV to 3.0 MeV, the present results show the resonance effect in the excitation function of the 10B(n, α)7Li reaction near En ~ 1.8 MeV, which might be attributed to the 9/2– p-wave state ( En = 1.83 MeV) and 5/2+ or 7/2+ d-wave state ( En = 1.88 MeV) of the compound nucleus 11B [32], as shown in Fig. 12. The angle-integrated cross sections of the 10B(n, α)7Li reaction were consistent with the results of Haoyu Jiang (2019) [7] and the evaluations. Moreover, they were lower than those of Friesenhahn (1975) [31] and higher than those of Hausladen (2017) [33].
-
The present results of angle-integrated cross sections for the 10B(n, α1)7Li* ,10B(n, α0)7Li, and 10B(n, α)7Li reactions are shown in Figs. 10, 11, and 12, which are compared with existing measurements and evaluation results. The inset in the upper right corner of these three figures shows enlarged views in the 0.1−3.0 MeV region. The present results are in good agreement with the findings from evaluation libraries, including ENDF/B-VIII.1 [21], ENDF/B-VII.1 [28], JEFF-3.3 [23], ROSFOND-3.1 [24], CENDL-3.2 [27], and JENDL-5.0 [29].
In the neutron energy range from 0.3 eV to 100 keV, where the excitation functions of these three reactions follow the 1/v law, the present angle-integrated cross sections agree well with the evaluation results. In this energy region, given that the s-wave states of α1 partial (Γn(C.M.) = 0.77 MeV and Γα(C.M.) = 0.113 MeV) have a larger width compared with the α0 partial width (Γα(C.M.) = 0.001 MeV) [30], the cross sections of the 10B(n, α1)7Li* reaction are much larger than those of the 10B(n, α0)7Li reaction. Compared with the results of Haoyu Jiang (2019) [7], the present cross sections do not exhibit oscillations as a function of the neutron energy and have smaller uncertainties because the energy spectrum was measured using the 6Li-Si monitor instead of the 235U(n, f) reaction. Compared with the results of Haoyu Jiang (2019) [7], the present uncertainties of the cross sections are reduced from 2.2%−21.6% to 2.0%−7.6%. In the experiment of Haoyu Jiang (2019) [7], the neutron energy spectrum was measured using a multi-layer fission chamber, which is based on the cross section data of the 235U(n, f) reaction [12]. The cross sections of the 235U(n, f) reaction exhibit dense resonance structures in the neutron energy region below 100 keV. On the contrary, the cross sections of the 6Li(n, t)4He reaction follow a 1/v law without significant resonance structures in the same neutron energy range. Thus, in the neutron energy region below 100 keV, the uncertainties of the present neutron energy spectrum measured using the 6Li-Si monitor are smaller.
In the neutron energy region from 100 keV to 1 MeV, the excitation functions of these three reactions do not follow the 1/v law. In the 0.5−1.0 MeV, the angle-integrated cross sections of the 10B(n, α1)7Li* and 10B(n, α)7Li reactions exhibit a rapid decline, as shown in Figs. 10 and 12. Conversely, the angle-integrated cross sections of the 10B(n, α0)7Li cross section have a resonance peak in the 300 keV – 600 keV region, due to the effect of 5/2– p-wave ( En ~ 0.52 MeV) resonance [30], as shown in Fig. 11. This resonance state significantly increases the 10B(n, α0)7Li cross sections and leads to a rapid decrease in the 10B(n, α1)7Li* cross sections above 500 keV. The angle-integrated cross sections of the 10B(n, α1)7Li* and 10B(n, α)7Li reactions are consistent with the evaluation data. However, the present angle-integrated cross sections of the 10B(n, α0)7Li reaction are higher at En < 0.5 MeV and lower at En > 0.5 MeV than the evaluations and other measurements. Compared with existing measurement data, the present cross section data of the 10B(n, α)7Li reaction are closer to the results of Haoyu Jiang (2019) [7] and lower than those of Friesenhahn (1975) [31].
In the neutron energy region from 1.0 MeV to 3.0 MeV, the present results show the resonance effect in the excitation function of the 10B(n, α)7Li reaction near En ~ 1.8 MeV, which might be attributed to the 9/2– p-wave state ( En = 1.83 MeV) and 5/2+ or 7/2+ d-wave state ( En = 1.88 MeV) of the compound nucleus 11B [32], as shown in Fig. 12. The angle-integrated cross sections of the 10B(n, α)7Li reaction were consistent with the results of Haoyu Jiang (2019) [7] and the evaluations. Moreover, they were lower than those of Friesenhahn (1975) [31] and higher than those of Hausladen (2017) [33].
-
The present results of angle-integrated cross sections for the 10B(n, α1)7Li* ,10B(n, α0)7Li and 10B(n, α)7Li reactions are shown in Figs. 10, 11 and 12, which are compared with those from existing measurements and evaluations. The inset in the upper right corner of Figs. 10, 11 and 12 shows the enlarged views in the 0.1 ~ 3.0 MeV region. The present results are in good agreement with the results from evaluation libraries, including ENDF/B-VIII.1 [21], ENDF/B-VII.1 [28], JEFF-3.3 [23], ROSFOND-3.1 [24], CENDL-3.2 [27] and JENDL-5.0 [29].
In the neutron energy range from 0.3 eV to 100 keV, where the excitation functions of these three reactions follow the 1/v law, the present angle-integrated cross sections agree well with the evaluation results. In this energy region, due to the s-wave states of α1 partial (Γn(C.M.) = 0.77 MeV and Γα(C.M.) = 0.113 MeV) have broader width compared with the α0 partial width (Γα(C.M.) = 0.001 MeV) [30], the cross sections of the 10B(n, α1)7Li* reaction are much bigger than those of the 10B(n, α0)7Li reaction. Compared with the results of Haoyu Jiang (2019) [7], the present cross sections do not exhibit oscillations as a function of the neutron energy and have smaller uncertainties, because the energy spectrum was measured using the 6Li-Si monitor instead of using 235U(n, f) reaction. Compared with the results of Haoyu Jiang (2019) [7], the present uncertainties of the cross sections reduce from 2.2% ~ 21.6% to 2.0% ~ 7.6%. In the experiment of Haoyu Jiang (2019) [7], the neutron energy spectrum was measured using a multi-layer fission chamber, which are based on the cross sections of the 235U(n, f) reaction [12]. The cross sections of the 235U(n, f) reaction exhibit dense resonances structure in the neutron energy region below 100 keV. On the contrary, the cross sections of the 6Li(n, t)4He reaction follow the 1/v law without significant resonance structures in the same neutron energy range. Thus, in the neutron energy region below 100 keV, the uncertainties of the present neutron energy spectrum measured using the 6Li-Si monitor are smaller.
In the neutron energy region from 100 keV to 1 MeV, the excitation functions of these three reactions do not follow the 1/v law anymore. In the 0.5 ~ 1.0 MeV, the angle-integrated cross sections of the 10B(n, α1)7Li* and 10B(n, α)7Li reactions exhibits a trend of rapid decline, as shown in Figs. 10 and 12. Conversely, the angle-integrated cross sections of the 10B(n, α0)7Li cross section have an observed resonance peak in the 300 keV – 600 keV region, due to the effect of 5/2- p-wave (En ~ 0.52 MeV) resonance [30], as shown in Fig. 11. This resonance state significantly increases the 10B(n, α0)7Li cross sections, and lead to a rapid decrease in the 10B(n, α1)7Li* cross sections above 500 keV. The angle-integrated cross sections of the 10B(n, α1)7Li* and 10B(n, α)7Li reactions are consistent with the evaluation data. However, the present angle-integrated cross sections of the 10B(n, α0)7Li reaction are higher at En < 0.5 MeV and lower at En > 0.5 MeV than the data of evaluations and other measurements. Compared with existing measurement data, the present cross sections of the 10B(n, α)7Li reaction are closer to the results of Haoyu Jiang (2019) [7], and lower than those of Friesenhahn (1975) [31].
In the neutron energy region from 1.0 MeV to 3.0 MeV, the present results show the resonance effect in the excitation function of the 10B(n, α)7Li reaction near En ~ 1.8 MeV, which might be contributed from the 9/2- p-wave state (En = 1.83 MeV) and 5/2+ or 7/2+ d-wave state (En = 1.88 MeV) of the compound nucleus 11B [32], as shown in Fig. 12. The angle-integrated cross sections of the 10B(n, α)7Li reaction remain consistent with the results of Haoyu Jiang (2019) [7] and the evaluations, and they are lower than those of Friesenhahn (1975) [31] and higher than those of Hausladen (2017) [33].
-
The present results of angle-integrated cross sections for the 10B(n, α1)7Li* ,10B(n, α0)7Li, and 10B(n, α)7Li reactions are shown in Figs. 10, 11, and 12, which are compared with existing measurements and evaluation results. The inset in the upper right corner of these three figures shows enlarged views in the 0.1−3.0 MeV region. The present results are in good agreement with the findings from evaluation libraries, including ENDF/B-VIII.1 [21], ENDF/B-VII.1 [28], JEFF-3.3 [23], ROSFOND-3.1 [24], CENDL-3.2 [27], and JENDL-5.0 [29].
In the neutron energy range from 0.3 eV to 100 keV, where the excitation functions of these three reactions follow the 1/v law, the present angle-integrated cross sections agree well with the evaluation results. In this energy region, given that the s-wave states of α1 partial (Γn(C.M.) = 0.77 MeV and Γα(C.M.) = 0.113 MeV) have a larger width compared with the α0 partial width (Γα(C.M.) = 0.001 MeV) [30], the cross sections of the 10B(n, α1)7Li* reaction are much larger than those of the 10B(n, α0)7Li reaction. Compared with the results of Haoyu Jiang (2019) [7], the present cross sections do not exhibit oscillations as a function of the neutron energy and have smaller uncertainties because the energy spectrum was measured using the 6Li-Si monitor instead of the 235U(n, f) reaction. Compared with the results of Haoyu Jiang (2019) [7], the present uncertainties of the cross sections are reduced from 2.2%−21.6% to 2.0%−7.6%. In the experiment of Haoyu Jiang (2019) [7], the neutron energy spectrum was measured using a multi-layer fission chamber, which is based on the cross section data of the 235U(n, f) reaction [12]. The cross sections of the 235U(n, f) reaction exhibit dense resonance structures in the neutron energy region below 100 keV. On the contrary, the cross sections of the 6Li(n, t)4He reaction follow a 1/v law without significant resonance structures in the same neutron energy range. Thus, in the neutron energy region below 100 keV, the uncertainties of the present neutron energy spectrum measured using the 6Li-Si monitor are smaller.
In the neutron energy region from 100 keV to 1 MeV, the excitation functions of these three reactions do not follow the 1/v law. In the 0.5−1.0 MeV, the angle-integrated cross sections of the 10B(n, α1)7Li* and 10B(n, α)7Li reactions exhibit a rapid decline, as shown in Figs. 10 and 12. Conversely, the angle-integrated cross sections of the 10B(n, α0)7Li cross section have a resonance peak in the 300 keV – 600 keV region, due to the effect of 5/2– p-wave ( En ~ 0.52 MeV) resonance [30], as shown in Fig. 11. This resonance state significantly increases the 10B(n, α0)7Li cross sections and leads to a rapid decrease in the 10B(n, α1)7Li* cross sections above 500 keV. The angle-integrated cross sections of the 10B(n, α1)7Li* and 10B(n, α)7Li reactions are consistent with the evaluation data. However, the present angle-integrated cross sections of the 10B(n, α0)7Li reaction are higher at En < 0.5 MeV and lower at En > 0.5 MeV than the evaluations and other measurements. Compared with existing measurement data, the present cross section data of the 10B(n, α)7Li reaction are closer to the results of Haoyu Jiang (2019) [7] and lower than those of Friesenhahn (1975) [31].
In the neutron energy region from 1.0 MeV to 3.0 MeV, the present results show the resonance effect in the excitation function of the 10B(n, α)7Li reaction near En ~ 1.8 MeV, which might be attributed to the 9/2– p-wave state ( En = 1.83 MeV) and 5/2+ or 7/2+ d-wave state ( En = 1.88 MeV) of the compound nucleus 11B [32], as shown in Fig. 12. The angle-integrated cross sections of the 10B(n, α)7Li reaction were consistent with the results of Haoyu Jiang (2019) [7] and the evaluations. Moreover, they were lower than those of Friesenhahn (1975) [31] and higher than those of Hausladen (2017) [33].
-
In the present study, differential cross sections of the 10B(n, α)7Li reaction were measured using an LPDA detector system at 13 angles from 20.1° to 158.3° in the neutron energy range from 0.3 eV to 3.0 MeV with 10 bpd (70 energy points). Differential cross sections of the 10B(n, α0)7Li and 10B(n, α1)7Li* reactions were also measured at the same angular positions in the neutron energy region from 0.3 eV to 1.0 MeV with 10 bpd (65 energy points). Using Legendre polynomial series fitting and integration, the angle-integrated cross sections of these three reactions were obtained in the corresponding neutron energy region. In the neutron energy region from 0.3 eV to 100 keV, the differential cross sections of the 10B(n, α1)7Li*, 10B(n, α0)7Li, and 10B(n, α)7Li reactions exhibited a nearly isotropic distribution in the center-of-mass system, and a slight forward bias emerged in the laboratory system as the neutron energy increased. In the neutron energy region from 300 keV to 600 keV, the present differential cross sections of the 10B(n, α0)7Li reaction exhibited a strong backward trend, consistent with our previous results (Haoyu Jiang, 2019). In the neutron energy region from 100 keV to 1 MeV, the forward trend of the 10B(n, α1)7Li* differential cross sections in the present result is weaker than that in the evaluations, which also agree with our previous measurement results (Haoyu Jiang, 2019). In the neutron energy from 1.0 MeV to 3.0 MeV, the present differential cross sections of the 10B(n, α0)7Li reaction exhibit significant forward-peak shape. The present angle-integrated cross sections of these three reactions generally agree with most of the results of evaluations and previous measurements, with minor deviations noted for the 10B(n, α0)7Li reaction from 0.3 to 0.6 MeV. Compared with other measurement results, the present results have lower uncertainties in the neutron energy region from 0.3 eV to 100 keV. Compared with our previous measurement results (Haoyu Jiang, 2019), the present results have been improved by resolving the issues of the energy spectrum oscillation in the low-energy region, improving measurement statistics, and expanding the measured energy range.
-
In the present work, differential cross sections for the 10B(n, α)7Li reaction have been measured using LPDA detector system at 13 angles from 20.20 to 158.70 in the neutron energy from 0.3 eV to 3.0 MeV with 10 bpd (70 energy points). Differential cross sections for the 10B(n, α0)7Li and 10B(n, α1)7Li* reactions have also been measured at the same angular positions in the neutron energy region from 0.3 eV to 1.0 MeV with 10 bpd (65 energy points). With the Legendre polynomial series fitting and integration, the angle-integrated cross sections for these three reactions have been obtained in the corresponding neutron energy region. In the neutron energy region from 0.3 eV to 100 keV, the present differential cross sections of the 10B(n, α1)7Li*, 10B(n, α0)7Li and 10B(n, α)7Li reactions exhibit a nearly isotropic distribution in the center-of-mass system, and a slight forward bias emerges in the laboratory system as neutron energy increases. In the neutron energy region from 300 keV to 600 keV, the present differential cross sections of the 10B(n, α0)7Li reaction show a strong backward trend, consistent with our previous results (Haoyu Jiang, 2019). In the neutron energy region from 100 keV to 1 MeV, the forward trend of the 10B(n, α1)7Li* differential cross sections in the present result is weaker than that in the evaluations, which also agree with our previous measurement results (Haoyu Jiang, 2019). In the neutron energy from 1.0 MeV to 3.0 MeV, the present differential cross sections of the 10B(n, α0)7Li reaction exhibit significant forward-peak shape. The present angle-integrated cross sections of these three reactions generally agree with most of the results of evaluations and previous measurements, with minor deviations noted for the 10B(n, α0)7Li reaction from 0.3 to 0.6 MeV. Compared with other measurement results, the present results have lower uncertainties in the neutron energy region from 0.3 eV to 100 keV. Compared with our previous measurement results (Haoyu Jiang, 2019), the present results have been improved by resolving the issues of the energy spectrum oscillation in the low-energy region, improving measurement statistics, and expanding the measured energy range.
-
In the present study, differential cross sections of the 10B(n, α)7Li reaction were measured using an LPDA detector system at 13 angles from 20.1° to 158.3° in the neutron energy range from 0.3 eV to 3.0 MeV with 10 bpd (70 energy points). Differential cross sections of the 10B(n, α0)7Li and 10B(n, α1)7Li* reactions were also measured at the same angular positions in the neutron energy region from 0.3 eV to 1.0 MeV with 10 bpd (65 energy points). Using Legendre polynomial series fitting and integration, the angle-integrated cross sections of these three reactions were obtained in the corresponding neutron energy region. In the neutron energy region from 0.3 eV to 100 keV, the differential cross sections of the 10B(n, α1)7Li*, 10B(n, α0)7Li, and 10B(n, α)7Li reactions exhibited a nearly isotropic distribution in the center-of-mass system, and a slight forward bias emerged in the laboratory system as the neutron energy increased. In the neutron energy region from 300 keV to 600 keV, the present differential cross sections of the 10B(n, α0)7Li reaction exhibited a strong backward trend, consistent with our previous results (Haoyu Jiang, 2019). In the neutron energy region from 100 keV to 1 MeV, the forward trend of the 10B(n, α1)7Li* differential cross sections in the present result is weaker than that in the evaluations, which also agree with our previous measurement results (Haoyu Jiang, 2019). In the neutron energy from 1.0 MeV to 3.0 MeV, the present differential cross sections of the 10B(n, α0)7Li reaction exhibit significant forward-peak shape. The present angle-integrated cross sections of these three reactions generally agree with most of the results of evaluations and previous measurements, with minor deviations noted for the 10B(n, α0)7Li reaction from 0.3 to 0.6 MeV. Compared with other measurement results, the present results have lower uncertainties in the neutron energy region from 0.3 eV to 100 keV. Compared with our previous measurement results (Haoyu Jiang, 2019), the present results have been improved by resolving the issues of the energy spectrum oscillation in the low-energy region, improving measurement statistics, and expanding the measured energy range.
Measurement of differential and angle-integrated cross sections for the 10B(n, α)7Li reaction from 0.3 eV to 3.0 MeV at CSNS Back-n
- Received Date: 2026-02-10
- Available Online: 2026-07-15
Abstract: In the present study, new measurements of differential and angle-integrated cross sections for the 10B(n, α1)7Li*, 10B(n, α0)7Li, and 10B(n, α)7Li reactions were performed at the CSNS Back-n white neutron source. The Light-charged Particle Detector Array (LPDA) system was used to detect charged particles. The 6Li-Si monitor was employed to measure the neutron flux. The differential cross sections for the 10B(n, α)7Li reaction were obtained from 20.1° to 158.3° (13 angles) in the neutron energy region from 0.3 eV to 3.0 MeV (70 energy points). The differential cross sections for the 10B(n, α0)7Li and 10B(n, α1)7Li* reactions were also obtained at the same angular positions in the neutron energy region from 0.3 eV to 1.0 MeV (65 energy points). Fitting with the Legendre polynomial series, the angle-integrated cross sections of these three reactions were obtained through integration. The experimental data for these three reactions across such a wide neutron energy range are valuable references for future nuclear data evaluations.


 DownLoad: