


 Abstract
 HTML
HTML Reference
 Related
 PDF
PDF


-
The behavior of selenium (Se) is significant for evaluating the effectiveness of nuclear waste management as well as mobilization from the fuel matrix of spent nuclear fuel to the environment. Se is primarily produced as a fission product during the operation of nuclear fuel such as uranium-dioxide (UO2). During reactor operation, Se also exists in the form of selenide ions (Se2−) that substitute oxygen from the UO2 lattice, forming strong bonds and sparingly soluble solid solution with the nuclear fuel matrix [1]. Furthermore, Se isotopes are predominantly employed in the healthcare sector and as nutrient in some refined food items. Through a neutron-induced reaction, 76Se generates the residual nuclei 75Se as a potential gamma (γ) source substitute of Ir-192 for brachytherapy [2, 3]. In addition, 77Se and 78Se are transmuted into the therapeutic radioisotope (77Br) in the healthcare sector. However, the (n, p) reaction channel of Se produces arsenic (As) radioisotope that is toxic in nature. The production of As radioactive isotopes (72As and 77As) from the (n, p) reaction is exploited in medical diagnostics and therapies such as Positron Emission Tomography (PET) imaging. Moreover, a significant discrepancy in the previously reported data (EXFOR) can be attributed to the omission of appropriate monitor reaction for flux measurement, outdated nuclear spectroscopic data, and use of inadequately optimized gamma (γ) spectroscopy. Consequently, the estimation of the cross sections of Se isotopes is essential for nuclear waste management, medical radioactive isotopes, and reactor design [4, 5].
Se occurs naturally as six stable isotopes: 74Se (0.86 %), 76Se (9.23 %), 77Se (7.60 %), 78Se (23.7 %), 80Se (49.8 %), and 82Se (8.82 %). The residual nuclei from the (n, p) reaction channel, 76As, decays via β− at 559.086 keV with a spin-parity of 2−; the product nuclei of the 78Se(n, p)78As reaction decay via β− at the characteristic γ ray energy of 694.9 keV with an intensity of 16.7 % (Jπ = 2−). For the (n, 2n) reaction channel, the activated nuclei of 81Seg decay via β− at the characteristic γ-ray energy of 275.990 keV with a spin-parity of 1/2− and an intensity of 0.67 %. For the residual nuclei of 75Se with a half-life of 119.78 d, ε decay occurs at a characteristic γ-ray energy of 121.1155 keV and (Jπ = 5/2+). For the residual nuclei of 77Ge from the (n, α) reaction channel of the target nuclei (Se), decay via β− is observed with a spin parity of 7/2+ at the characteristic γ-ray energy of 211.03 keV with 30.0 % intensity (Table 1).
Reaction Decay data Half-life Eγ /keV Iγ (%) Eth/keV Decay scheme 76Se(n, p)76As 26.254 h (11) 559.086 (10) 40.67 2207.2 β− 78Se(n, p)78As 90.7 m (2) 694.9 (1) 16.7 (22) 3471 β− 82Se(n, 2n)81Seg 18.5 m (1) 275.990 (10) 0.67 (5) 9390.5 β− 76Se(n, 2n)75Se 119.78 d (5) 121.1155 (11) 17.20 (12) 11302.02 ε 80Se(n, α)77Ge 11.211 h (3) 211.03 (4) 30.0 (8) 911.6 β− Table 1. Nuclear decay data of studied reactions.
Multiple energy cross section measurements are essential for understanding the neutron induced reaction mechanism. However, for Se isotopes, several studies have been performed in the 13−15 MeV energy region owing to contradictory reported data. Therefore, single energy measurements in this region remain important for improving the previously reported EXFOR and evaluated nuclear library data. In this study, offline γ spectroscopy was employed to measure the cross sections of the 76Se(n, p)76As, 78Se(n, p)78As, 82Se(n, 2n)81Seg, 76Se(n, 2n)75Se, and 80Se(n, α)77Ge reactions at the neutron energy of 14.96 ± 0.22 MeV, along with detailed covariance analysis. The measured cross section values were compared with the previously reported EXFOR database and evaluated nuclear data libraries. Furthermore, the cross sections of all measured reactions were theoretically reproduced using the TALYS 2.0 code involving different nuclear level density models (ldmodel 1−6). In addition, an optimal set of parameters and total cross section contribution from the different nuclear reaction mechanisms were identified.
-
The behavior of selenium (Se) is significant for evaluating the effectiveness of nuclear waste management as well as mobilization from the fuel matrix of spent nuclear fuel to the environment. Se is primarily produced as a fission product during the operation of nuclear fuel such as uranium-dioxide (UO2). During reactor operation, Se also exists in the form of selenide ions (Se2−) that substitute oxygen from the UO2 lattice, forming strong bonds and sparingly soluble solid solution with the nuclear fuel matrix [1]. Furthermore, Se isotopes are predominantly employed in the healthcare sector and as nutrient in some refined food items. Through a neutron-induced reaction, 76Se generates the residual nuclei 75Se as a potential gamma (γ) source substitute of Ir-192 for brachytherapy [2, 3]. In addition, 77Se and 78Se are transmuted into the therapeutic radioisotope (77Br) in the healthcare sector. However, the (n, p) reaction channel of Se produces arsenic (As) radioisotope that is toxic in nature. The production of As radioactive isotopes (72As and 77As) from the (n, p) reaction is exploited in medical diagnostics and therapies such as Positron Emission Tomography (PET) imaging. Moreover, a significant discrepancy in the previously reported data (EXFOR) can be attributed to the omission of appropriate monitor reaction for flux measurement, outdated nuclear spectroscopic data, and use of inadequately optimized gamma (γ) spectroscopy. Consequently, the estimation of the cross sections of Se isotopes is essential for nuclear waste management, medical radioactive isotopes, and reactor design [4, 5].
Se occurs naturally as six stable isotopes: 74Se (0.86 %), 76Se (9.23 %), 77Se (7.60 %), 78Se (23.7 %), 80Se (49.8 %), and 82Se (8.82 %). The residual nuclei from the (n, p) reaction channel, 76As, decays via β− at 559.086 keV with a spin-parity of 2−; the product nuclei of the 78Se(n, p)78As reaction decay via β− at the characteristic γ ray energy of 694.9 keV with an intensity of 16.7 % (Jπ = 2−). For the (n, 2n) reaction channel, the activated nuclei of 81Seg decay via β− at the characteristic γ-ray energy of 275.990 keV with a spin-parity of 1/2− and an intensity of 0.67 %. For the residual nuclei of 75Se with a half-life of 119.78 d, ε decay occurs at a characteristic γ-ray energy of 121.1155 keV and (Jπ = 5/2+). For the residual nuclei of 77Ge from the (n, α) reaction channel of the target nuclei (Se), decay via β− is observed with a spin parity of 7/2+ at the characteristic γ-ray energy of 211.03 keV with 30.0 % intensity (Table 1).
Reaction Decay data Half-life Eγ /keV Iγ (%) Eth/keV Decay scheme 76Se(n, p)76As 26.254 h (11) 559.086 (10) 40.67 2207.2 β− 78Se(n, p)78As 90.7 m (2) 694.9 (1) 16.7 (22) 3471 β− 82Se(n, 2n)81Seg 18.5 m (1) 275.990 (10) 0.67 (5) 9390.5 β− 76Se(n, 2n)75Se 119.78 d (5) 121.1155 (11) 17.20 (12) 11302.02 ε 80Se(n, α)77Ge 11.211 h (3) 211.03 (4) 30.0 (8) 911.6 β− Table 1. Nuclear decay data of studied reactions.
Multiple energy cross section measurements are essential for understanding the neutron induced reaction mechanism. However, for Se isotopes, several studies have been performed in the 13−15 MeV energy region owing to contradictory reported data. Therefore, single energy measurements in this region remain important for improving the previously reported EXFOR and evaluated nuclear library data. In this study, offline γ spectroscopy was employed to measure the cross sections of the 76Se(n, p)76As, 78Se(n, p)78As, 82Se(n, 2n)81Seg, 76Se(n, 2n)75Se, and 80Se(n, α)77Ge reactions at the neutron energy of 14.96 ± 0.22 MeV, along with detailed covariance analysis. The measured cross section values were compared with the previously reported EXFOR database and evaluated nuclear data libraries. Furthermore, the cross sections of all measured reactions were theoretically reproduced using the TALYS 2.0 code involving different nuclear level density models (ldmodel 1−6). In addition, an optimal set of parameters and total cross section contribution from the different nuclear reaction mechanisms were identified.
-
The behavior of selenium (Se) is significant for evaluating the effectiveness of nuclear waste management as well as mobilization from the fuel matrix of spent nuclear fuel to the environment. Se is primarily produced as a fission product during the operation of nuclear fuel such as uranium-dioxide (UO2). During reactor operation, Se also exists in the form of selenide ions (Se2−) that substitute oxygen from the UO2 lattice, forming strong bonds and sparingly soluble solid solution with the nuclear fuel matrix [1]. Furthermore, Se isotopes are predominantly employed in the healthcare sector and as nutrient in some refined food items. Through a neutron-induced reaction, 76Se generates the residual nuclei 75Se as a potential gamma (γ) source substitute of Ir-192 for brachytherapy [2, 3]. In addition, 77Se and 78Se are transmuted into the therapeutic radioisotope (77Br) in the healthcare sector. However, the (n, p) reaction channel of Se produces arsenic (As) radioisotope that is toxic in nature. The production of As radioactive isotopes (72As and 77As) from the (n, p) reaction is exploited in medical diagnostics and therapies such as Positron Emission Tomography (PET) imaging. Moreover, a significant discrepancy in the previously reported data (EXFOR) can be attributed to the omission of appropriate monitor reaction for flux measurement, outdated nuclear spectroscopic data, and use of inadequately optimized gamma (γ) spectroscopy. Consequently, the estimation of the cross sections of Se isotopes is essential for nuclear waste management, medical radioactive isotopes, and reactor design [4, 5].
Se occurs naturally as six stable isotopes: 74Se (0.86 %), 76Se (9.23 %), 77Se (7.60 %), 78Se (23.7 %), 80Se (49.8 %), and 82Se (8.82 %). The residual nuclei from the (n, p) reaction channel, 76As, decays via β− at 559.086 keV with a spin-parity of 2−; the product nuclei of the 78Se(n, p)78As reaction decay via β− at the characteristic γ ray energy of 694.9 keV with an intensity of 16.7 % (Jπ = 2−). For the (n, 2n) reaction channel, the activated nuclei of 81Seg decay via β− at the characteristic γ-ray energy of 275.990 keV with a spin-parity of 1/2− and an intensity of 0.67 %. For the residual nuclei of 75Se with a half-life of 119.78 d, ε decay occurs at a characteristic γ-ray energy of 121.1155 keV and (Jπ = 5/2+). For the residual nuclei of 77Ge from the (n, α) reaction channel of the target nuclei (Se), decay via β− is observed with a spin parity of 7/2+ at the characteristic γ-ray energy of 211.03 keV with 30.0 % intensity (Table 1).
Reaction Decay data Half-life Eγ /keV Iγ (%) Eth/keV Decay scheme 76Se(n, p)76As 26.254 h (11) 559.086 (10) 40.67 2207.2 β− 78Se(n, p)78As 90.7 m (2) 694.9 (1) 16.7 (22) 3471 β− 82Se(n, 2n)81Seg 18.5 m (1) 275.990 (10) 0.67 (5) 9390.5 β− 76Se(n, 2n)75Se 119.78 d (5) 121.1155 (11) 17.20 (12) 11302.02 ε 80Se(n, α)77Ge 11.211 h (3) 211.03 (4) 30.0 (8) 911.6 β− Table 1. Nuclear decay data of studied reactions.
Multiple energy cross section measurements are essential for understanding the neutron induced reaction mechanism. However, for Se isotopes, several studies have been performed in the 13−15 MeV energy region owing to contradictory reported data. Therefore, single energy measurements in this region remain important for improving the previously reported EXFOR and evaluated nuclear library data. In this study, offline γ spectroscopy was employed to measure the cross sections of the 76Se(n, p)76As, 78Se(n, p)78As, 82Se(n, 2n)81Seg, 76Se(n, 2n)75Se, and 80Se(n, α)77Ge reactions at the neutron energy of 14.96 ± 0.22 MeV, along with detailed covariance analysis. The measured cross section values were compared with the previously reported EXFOR database and evaluated nuclear data libraries. Furthermore, the cross sections of all measured reactions were theoretically reproduced using the TALYS 2.0 code involving different nuclear level density models (ldmodel 1−6). In addition, an optimal set of parameters and total cross section contribution from the different nuclear reaction mechanisms were identified.
-
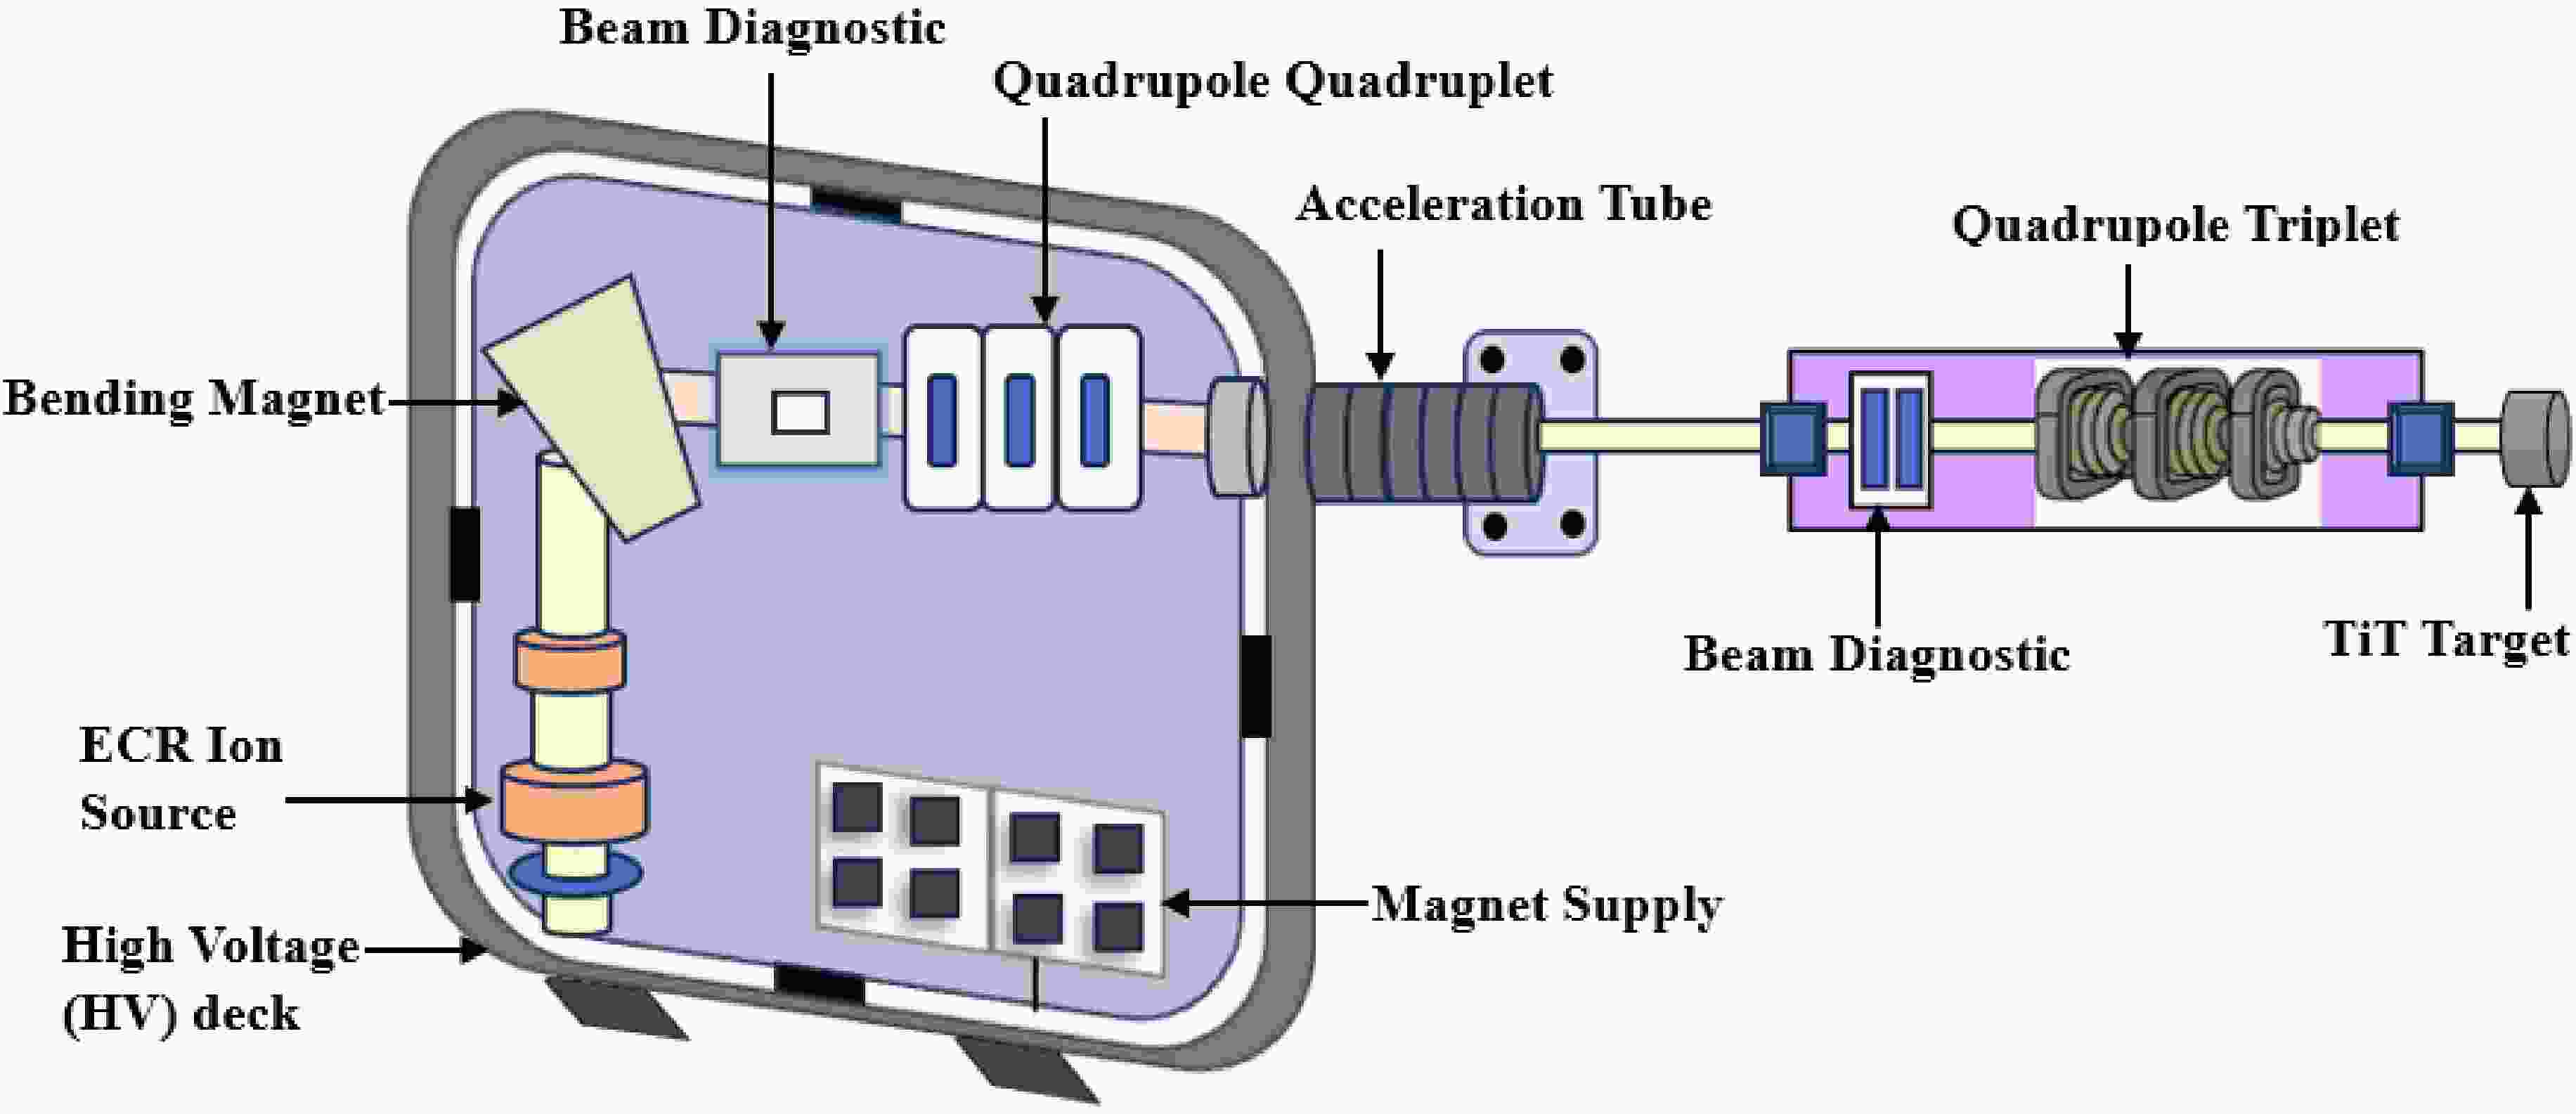
The sample (Se) was irradiated at the Neutron and Ion Irradiation Facility (NIIF) of the Institute for Plasma Research (IPR), Gandhinagar, India. Neutrons were generated via 3H(D, n)4He fusion reaction, where accelerated deuterium (D+) ions were made incident on the stationary tritium (TiT) target using an electrostatic generator. The experimental set-up consisted of three subsystems of the neutron generator: (a) Isolation transformer (350 kV), Electron Cyclotron Resonance (ECR) Ion Source, (b) Low Energy Beam Transport System (LEBTS), which included a solenoid, 90° bending magnets, quadrupole system, and beam diagnostic system, (c) Medium Energy Beam Transport System (MEBTS) consisting of a quadrupole triplet magnet, switching magnets, and TiT target [6]. The schematic of the IPR 14 MeV neutron generator is shown in Fig. 1.
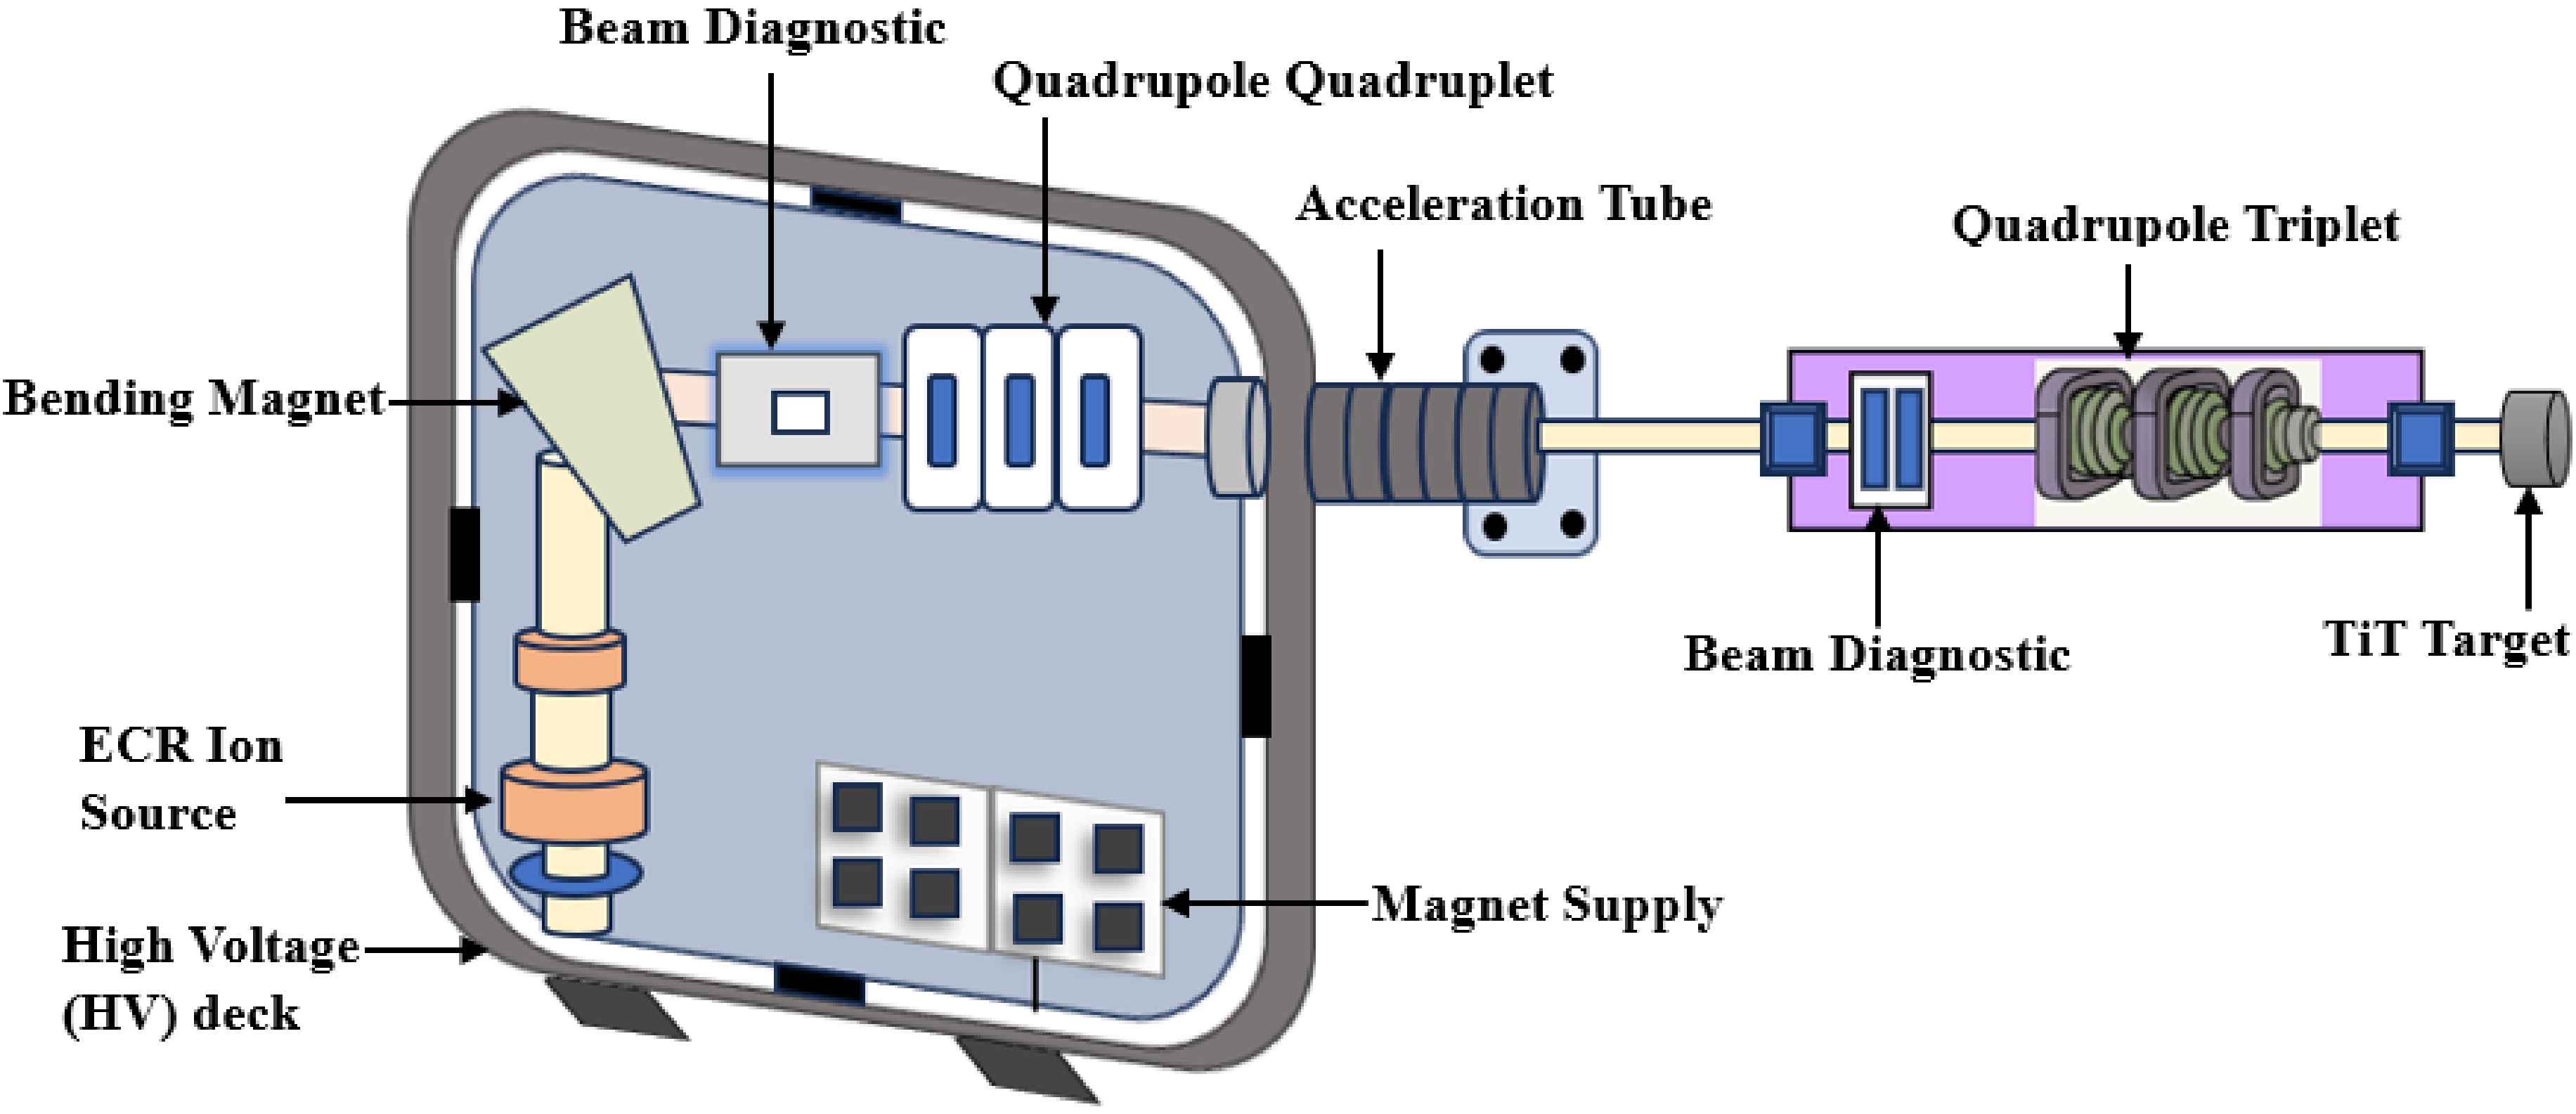
Figure 1. (color online) Schematic of IPR 14 MeV Neutron Generator.
Deuterium (D+, D2+, and D3+) ions were extracted from a 2.45 GHz ECR ion source. To avoid unnecessary heating of the system, the D+ ions were separated using 90° bending magnets. Subsequently, the deuterium beam with a beam current of 2.5 mA was focused on the acceleration column with an array of quadrupole triplets in the LEBTS. Further, the beam was focused on the TiT target through the MEBTS, and 14 MeV neutrons were generated [7]. The sample was positioned at 0°, as depicted in Fig. 2. The neutron yield was estimated by Associated Alpha Diagnostic (AAD) using an Au-Si surface barrier detector placed at a 135° angle, as shown in Fig. 3. The neutron yield, flux, and irradiation details of the investigated reactions are listed in Table 2.
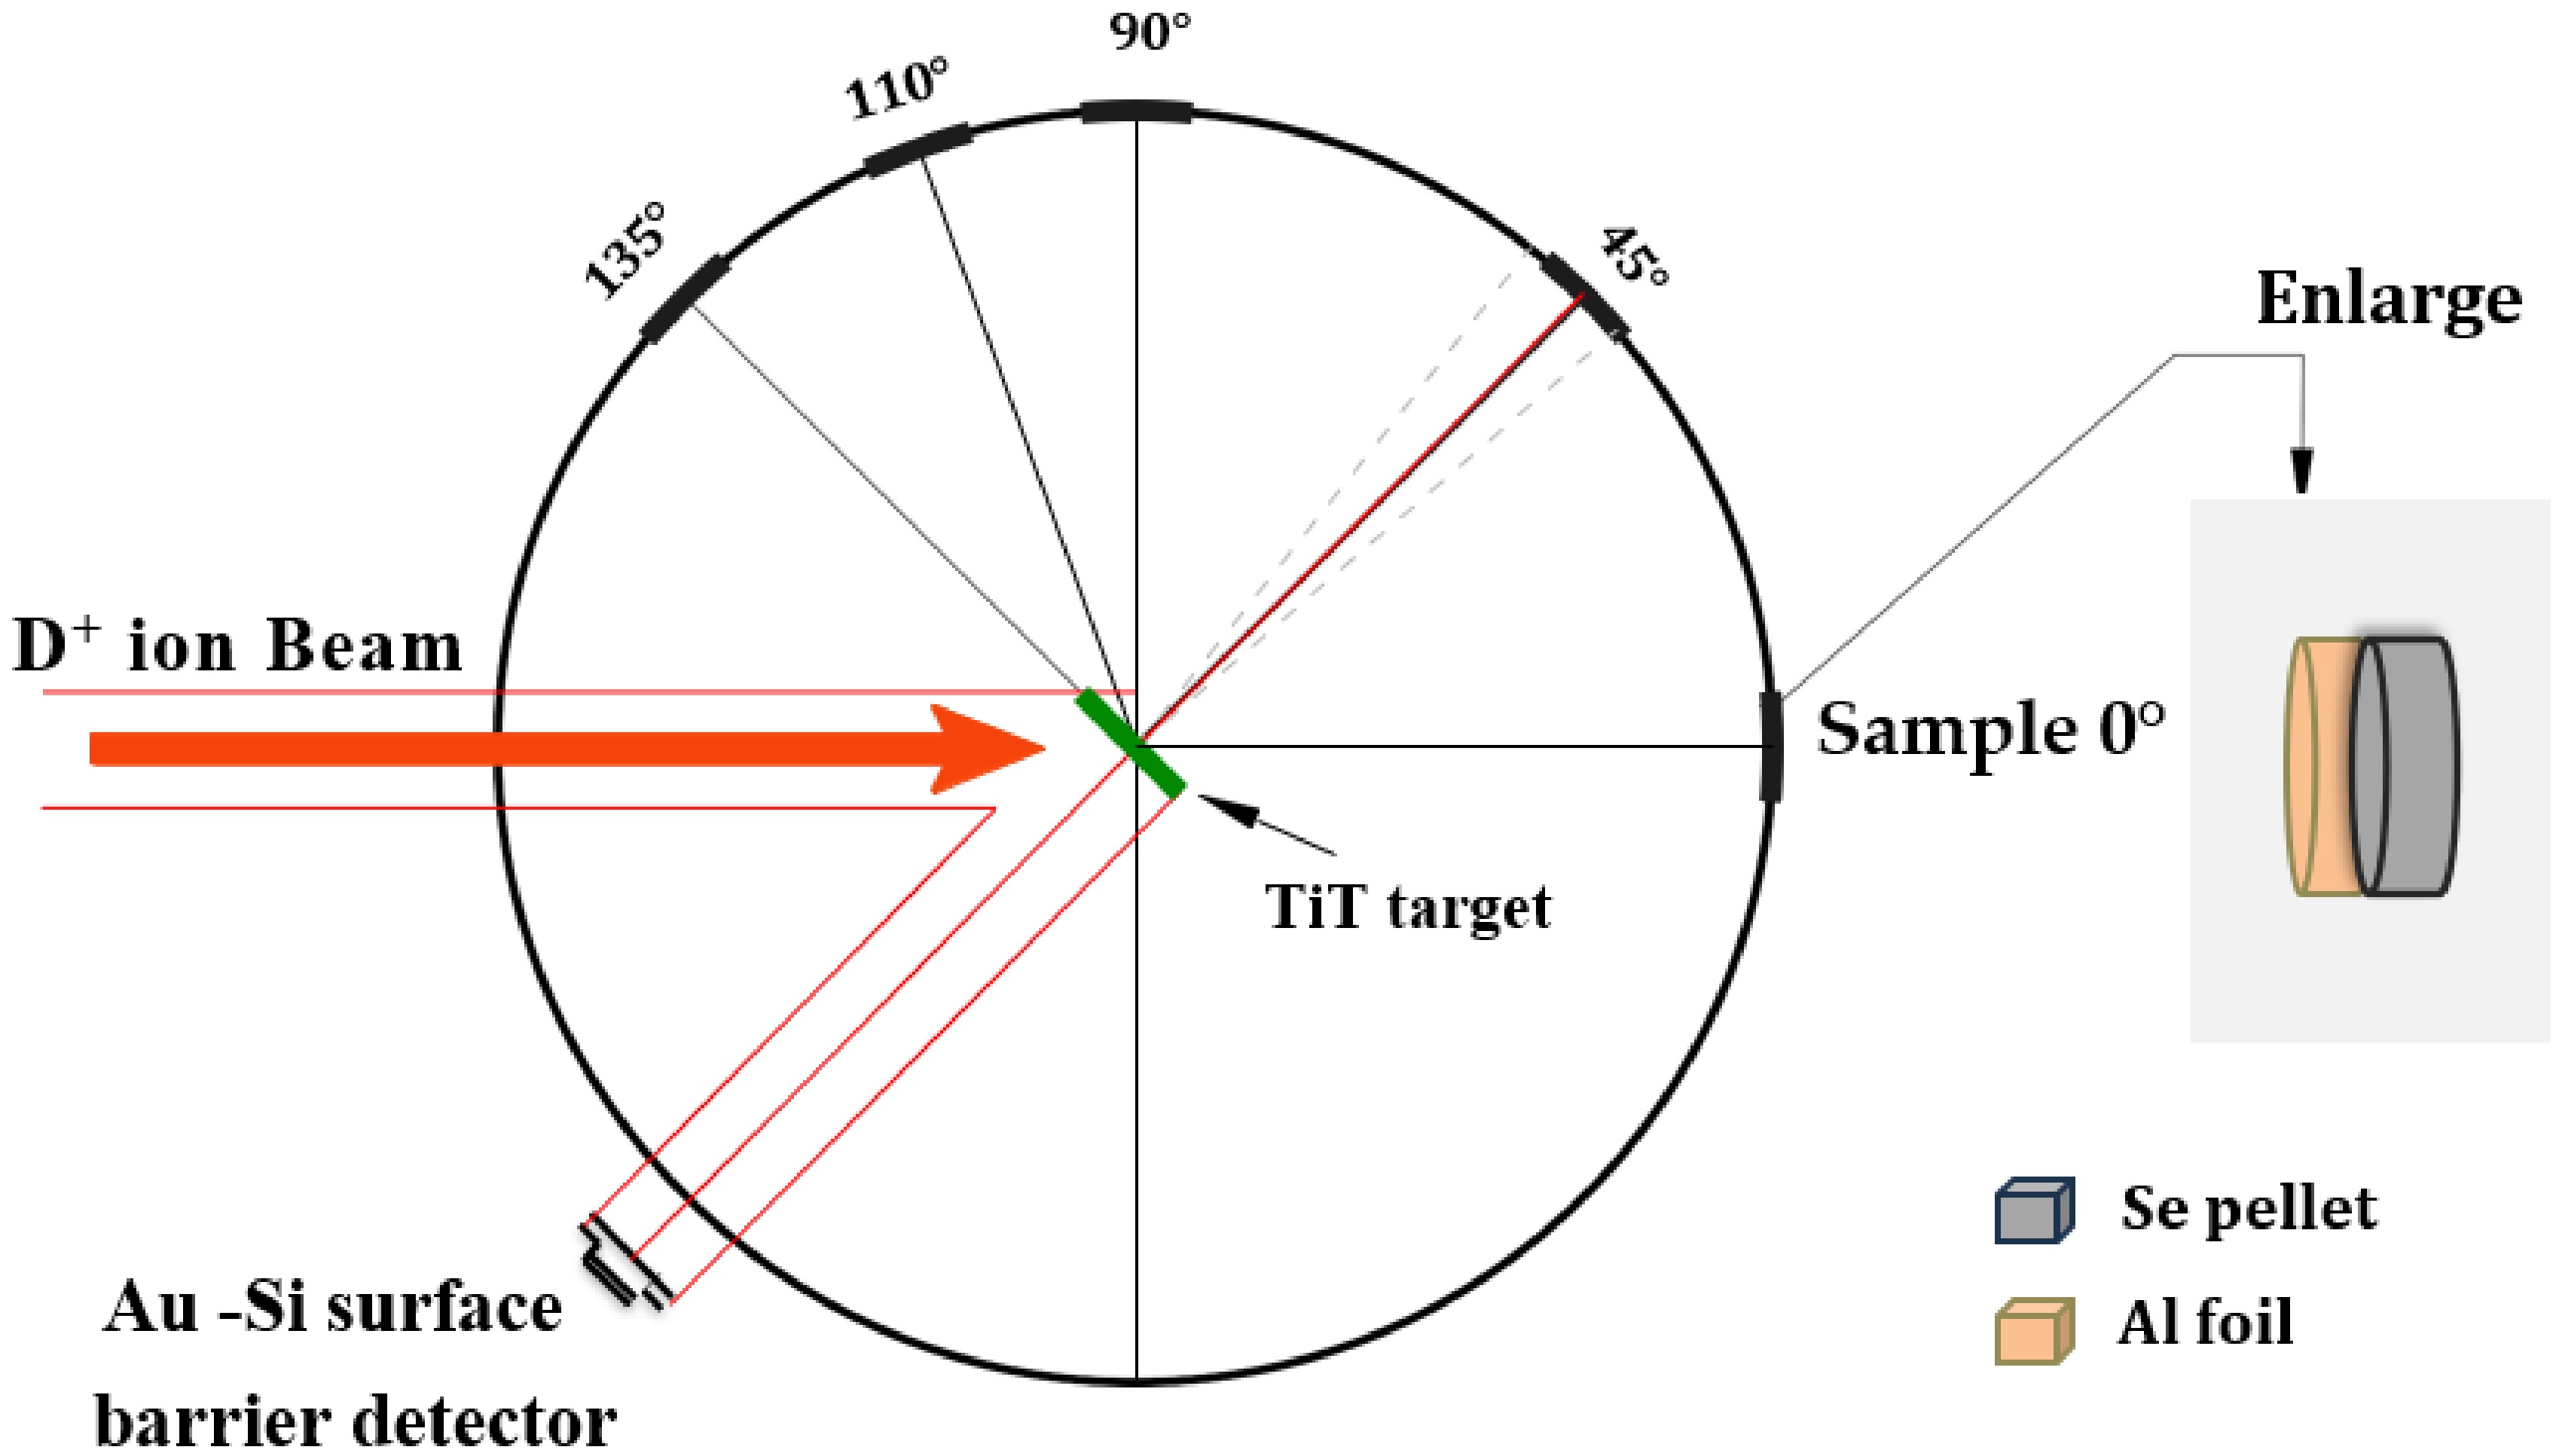
Figure 2. (color online) Schematic of the geometric position at 0° during irradiation at IPR.
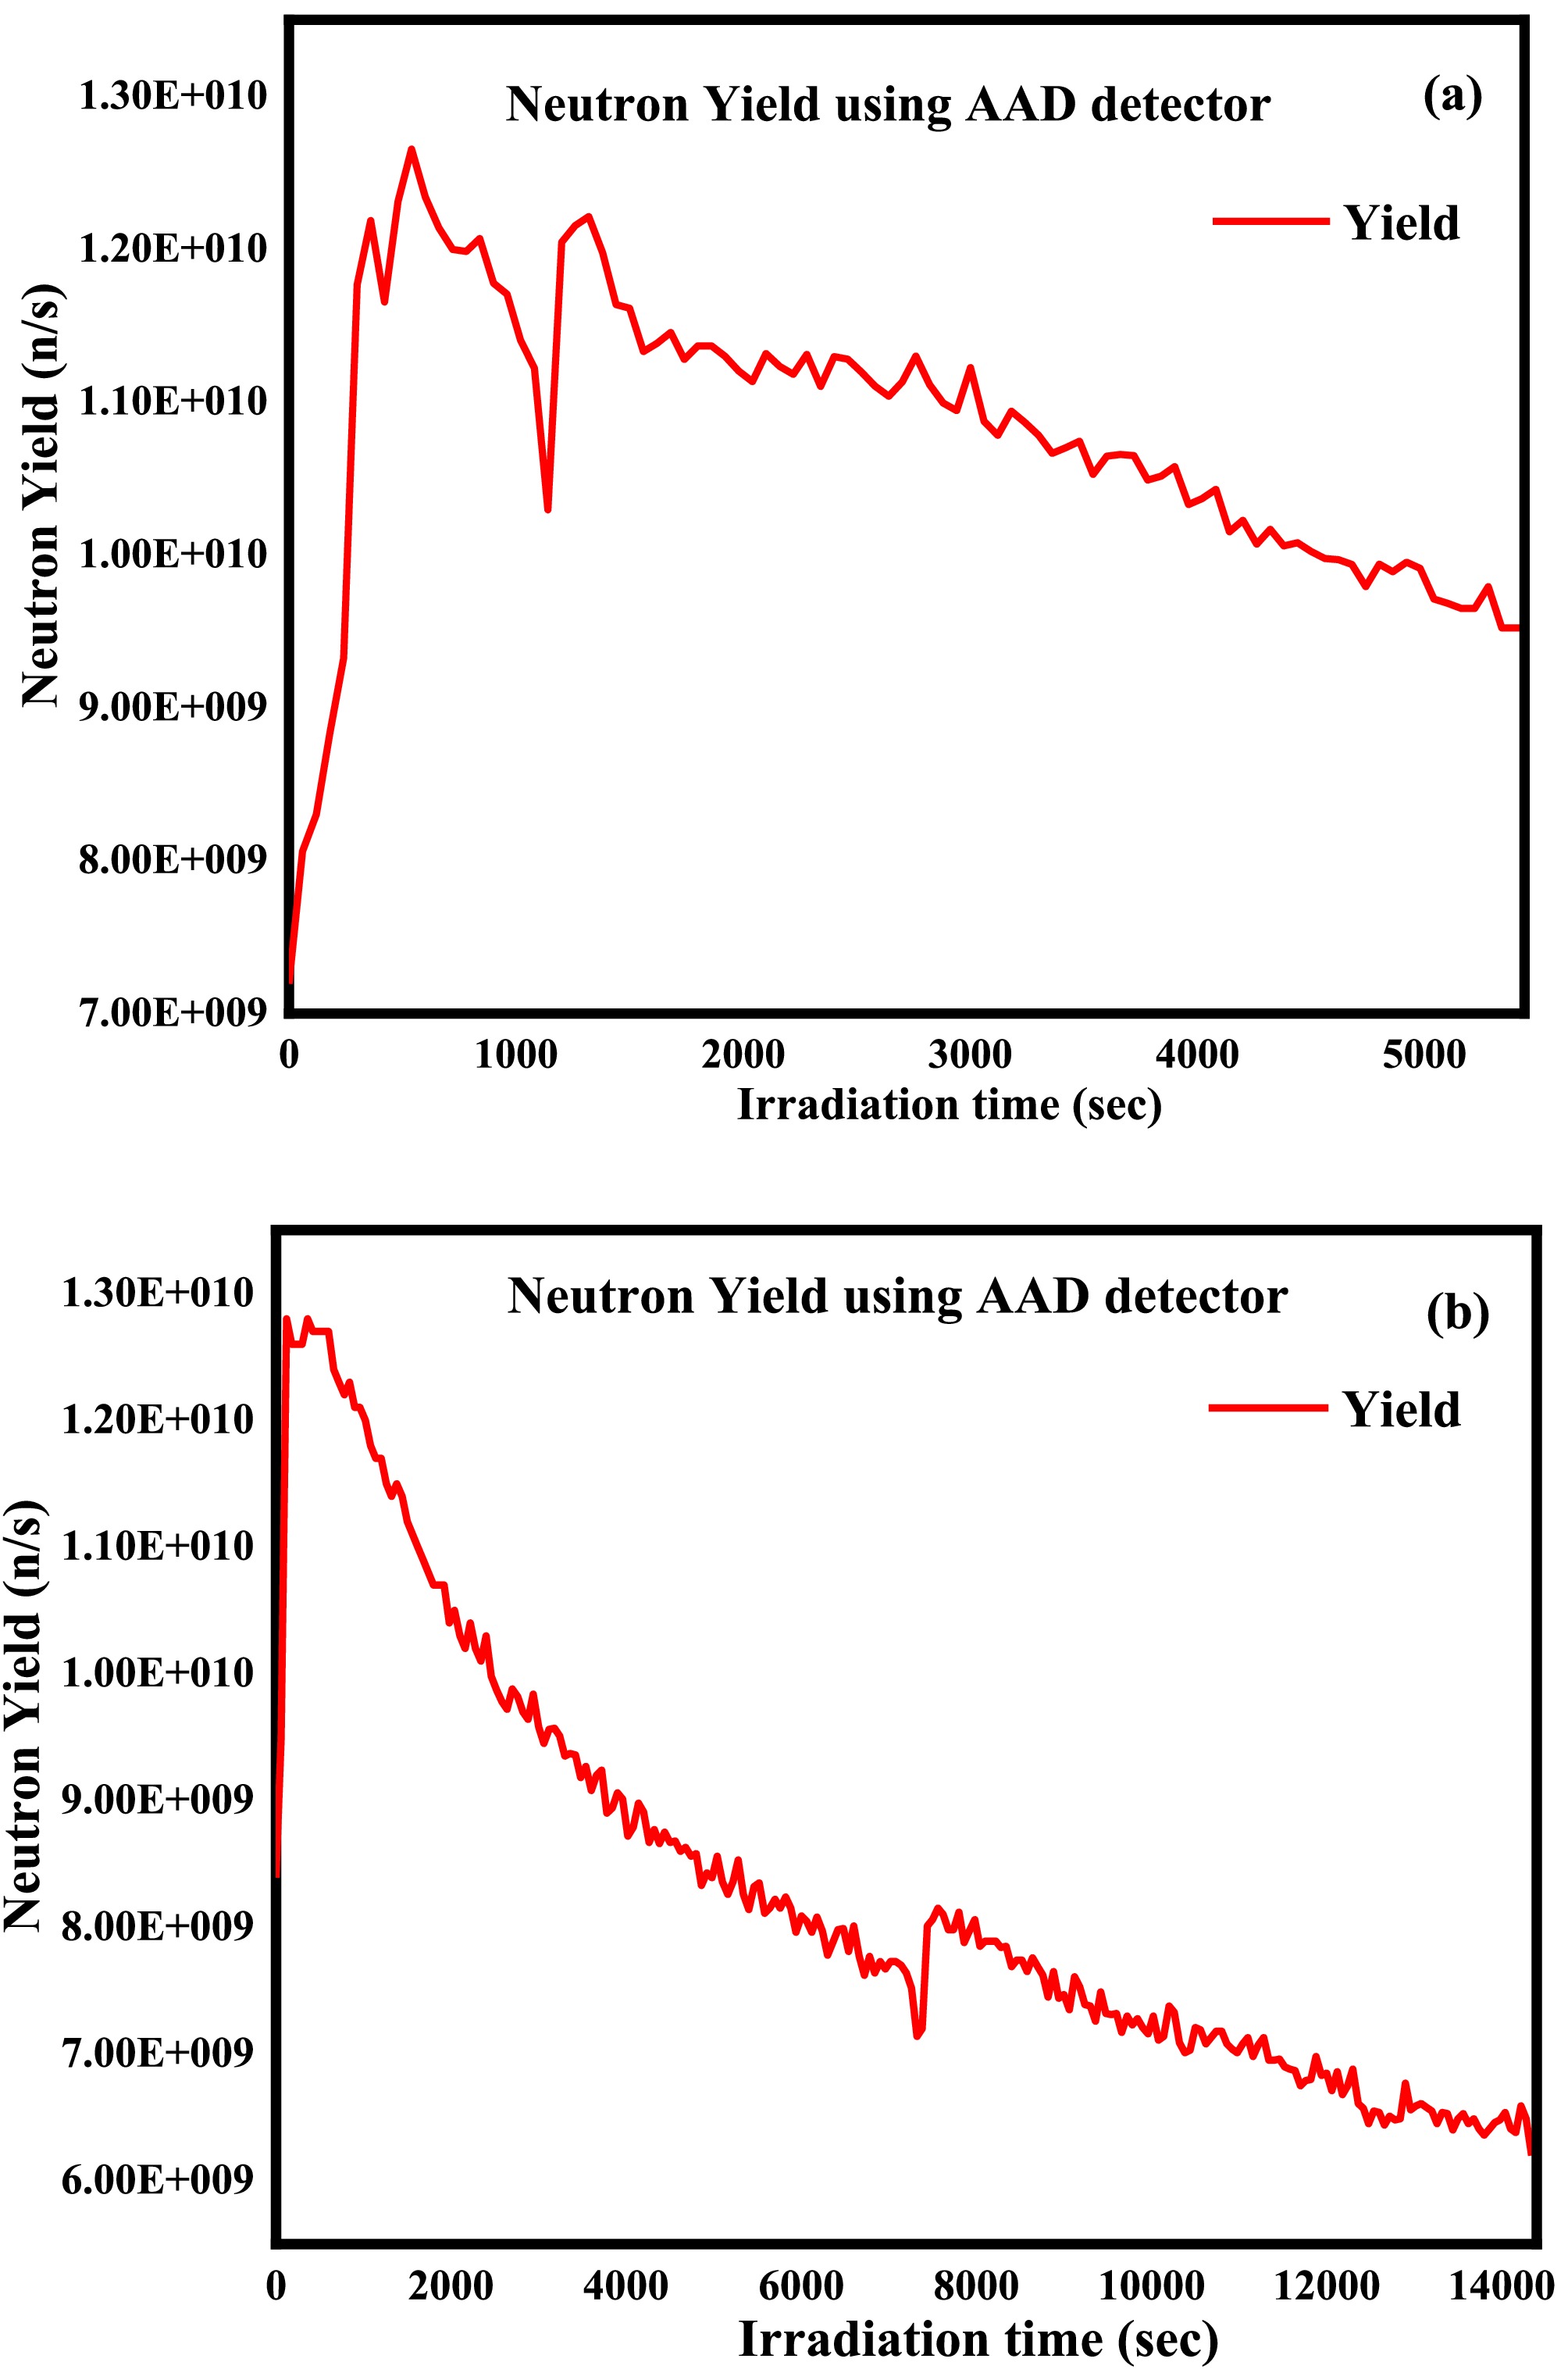
Figure 3. (color online) Neutron yield (n/s) measured using AAD during irradiation.
Reaction Yield/(n/s) Flux (e09)/(n/cm2 /s) Irradiation time Cooling time Counting time 76Se(n, p)76As 1.08e+10 1.53±0.07 5400 3765 300.74 78Se(n, p)78As 1.50±0.07 5400 3765 300.74 82Se(n, 2n)81Seg 1.53±0.07 5400 975 300.52 76Se(n, 2n)75Se 8.35e+09 1.50±0.06 14400 93299 1635.70 80Se(n, α)77Ge 1.53±0.06 14400 1880 253.12 Table 2. Neutron yield, flux, irradiation time (s), cooling time (s), and counting time (s) of the studied reactions.
Circular pellets of the sample (Se) with a diameter ~1 cm were prepared by compressing Se powder (purity: 99.9 %) using a KBr hydraulic press. The Se pellet was placed behind an aluminum (Al) foil with a thickness of 0.25 mm. The pellets were wrapped in aluminum of thickness 25 μm to avoid cross-contamination. The sample details (weight, thickness, and atomic density) are presented in Table 3.
Reaction Weight/g Thickness/cm Atomic density (1021)/(atom/cm3) 76Se(n, p)76As 0.5111 ± 0.0001 0.175 ± 0.001 2.766 ± 0.085 78Se(n, p)78As 0.5111 ± 0.0001 0.175 ± 0.001 6.837 ± 0.080 82Se(n, 2n)81Seg 0.5111 ± 0.0001 0.175 ± 0.001 2.388 ± 0.060 76Se(n, 2n)75Se 0.5661 ± 0.0001 0.182 ± 0.001 2.946 ± 0.091 80Se(n, α)77Ge 0.5661 ± 0.0001 0.182 ± 0.001 14.810 ± 1.227 Table 3. Sample details (weight, thickness, and atomic density) of the investigated reactions along with their associated uncertainties.
-
The sample (Se) was irradiated at the Neutron and Ion Irradiation Facility (NIIF) of the Institute for Plasma Research (IPR), Gandhinagar, India. Neutrons were generated via 3H(D, n)4He fusion reaction, where accelerated deuterium (D+) ions were made incident on the stationary tritium (TiT) target using an electrostatic generator. The experimental set-up consisted of three subsystems of the neutron generator: (a) Isolation transformer (350 kV), Electron Cyclotron Resonance (ECR) Ion Source, (b) Low Energy Beam Transport System (LEBTS), which included a solenoid, 90° bending magnets, quadrupole system, and beam diagnostic system, (c) Medium Energy Beam Transport System (MEBTS) consisting of a quadrupole triplet magnet, switching magnets, and TiT target [6]. The schematic of the IPR 14 MeV neutron generator is shown in Fig. 1.
Figure 1. (color online) Schematic of IPR 14 MeV Neutron Generator.
Deuterium (D+, D2+, and D3+) ions were extracted from a 2.45 GHz ECR ion source. To avoid unnecessary heating of the system, the D+ ions were separated using 90° bending magnets. Subsequently, the deuterium beam with a beam current of 2.5 mA was focused on the acceleration column with an array of quadrupole triplets in the LEBTS. Further, the beam was focused on the TiT target through the MEBTS, and 14 MeV neutrons were generated [7]. The sample was positioned at 0°, as depicted in Fig. 2. The neutron yield was estimated by Associated Alpha Diagnostic (AAD) using an Au-Si surface barrier detector placed at a 135° angle, as shown in Fig. 3. The neutron yield, flux, and irradiation details of the investigated reactions are listed in Table 2.
Figure 2. (color online) Schematic of the geometric position at 0° during irradiation at IPR.
Figure 3. (color online) Neutron yield (n/s) measured using AAD during irradiation.
Reaction Yield/(n/s) Flux (e09)/(n/cm2 /s) Irradiation time Cooling time Counting time 76Se(n, p)76As 1.08e+10 1.53±0.07 5400 3765 300.74 78Se(n, p)78As 1.50±0.07 5400 3765 300.74 82Se(n, 2n)81Seg 1.53±0.07 5400 975 300.52 76Se(n, 2n)75Se 8.35e+09 1.50±0.06 14400 93299 1635.70 80Se(n, α)77Ge 1.53±0.06 14400 1880 253.12 Table 2. Neutron yield, flux, irradiation time (s), cooling time (s), and counting time (s) of the studied reactions.
Circular pellets of the sample (Se) with a diameter ~1 cm were prepared by compressing Se powder (purity: 99.9 %) using a KBr hydraulic press. The Se pellet was placed behind an aluminum (Al) foil with a thickness of 0.25 mm. The pellets were wrapped in aluminum of thickness 25 μm to avoid cross-contamination. The sample details (weight, thickness, and atomic density) are presented in Table 3.
Reaction Weight/g Thickness/cm Atomic density (1021)/(atom/cm3) 76Se(n, p)76As 0.5111 ± 0.0001 0.175 ± 0.001 2.766 ± 0.085 78Se(n, p)78As 0.5111 ± 0.0001 0.175 ± 0.001 6.837 ± 0.080 82Se(n, 2n)81Seg 0.5111 ± 0.0001 0.175 ± 0.001 2.388 ± 0.060 76Se(n, 2n)75Se 0.5661 ± 0.0001 0.182 ± 0.001 2.946 ± 0.091 80Se(n, α)77Ge 0.5661 ± 0.0001 0.182 ± 0.001 14.810 ± 1.227 Table 3. Sample details (weight, thickness, and atomic density) of the investigated reactions along with their associated uncertainties.
-
The sample (Se) was irradiated at the Neutron and Ion Irradiation Facility (NIIF) of the Institute for Plasma Research (IPR), Gandhinagar, India. Neutrons were generated via 3H(D, n)4He fusion reaction, where accelerated deuterium (D+) ions were made incident on the stationary tritium (TiT) target using an electrostatic generator. The experimental set-up consisted of three subsystems of the neutron generator: (a) Isolation transformer (350 kV), Electron Cyclotron Resonance (ECR) Ion Source, (b) Low Energy Beam Transport System (LEBTS), which included a solenoid, 90° bending magnets, quadrupole system, and beam diagnostic system, (c) Medium Energy Beam Transport System (MEBTS) consisting of a quadrupole triplet magnet, switching magnets, and TiT target [6]. The schematic of the IPR 14 MeV neutron generator is shown in Fig. 1.
Figure 1. (color online) Schematic of IPR 14 MeV Neutron Generator.
Deuterium (D+, D2+, and D3+) ions were extracted from a 2.45 GHz ECR ion source. To avoid unnecessary heating of the system, the D+ ions were separated using 90° bending magnets. Subsequently, the deuterium beam with a beam current of 2.5 mA was focused on the acceleration column with an array of quadrupole triplets in the LEBTS. Further, the beam was focused on the TiT target through the MEBTS, and 14 MeV neutrons were generated [7]. The sample was positioned at 0°, as depicted in Fig. 2. The neutron yield was estimated by Associated Alpha Diagnostic (AAD) using an Au-Si surface barrier detector placed at a 135° angle, as shown in Fig. 3. The neutron yield, flux, and irradiation details of the investigated reactions are listed in Table 2.
Figure 2. (color online) Schematic of the geometric position at 0° during irradiation at IPR.
Figure 3. (color online) Neutron yield (n/s) measured using AAD during irradiation.
Reaction Yield/(n/s) Flux (e09)/(n/cm2 /s) Irradiation time Cooling time Counting time 76Se(n, p)76As 1.08e+10 1.53±0.07 5400 3765 300.74 78Se(n, p)78As 1.50±0.07 5400 3765 300.74 82Se(n, 2n)81Seg 1.53±0.07 5400 975 300.52 76Se(n, 2n)75Se 8.35e+09 1.50±0.06 14400 93299 1635.70 80Se(n, α)77Ge 1.53±0.06 14400 1880 253.12 Table 2. Neutron yield, flux, irradiation time (s), cooling time (s), and counting time (s) of the studied reactions.
Circular pellets of the sample (Se) with a diameter ~1 cm were prepared by compressing Se powder (purity: 99.9 %) using a KBr hydraulic press. The Se pellet was placed behind an aluminum (Al) foil with a thickness of 0.25 mm. The pellets were wrapped in aluminum of thickness 25 μm to avoid cross-contamination. The sample details (weight, thickness, and atomic density) are presented in Table 3.
Reaction Weight/g Thickness/cm Atomic density (1021)/(atom/cm3) 76Se(n, p)76As 0.5111 ± 0.0001 0.175 ± 0.001 2.766 ± 0.085 78Se(n, p)78As 0.5111 ± 0.0001 0.175 ± 0.001 6.837 ± 0.080 82Se(n, 2n)81Seg 0.5111 ± 0.0001 0.175 ± 0.001 2.388 ± 0.060 76Se(n, 2n)75Se 0.5661 ± 0.0001 0.182 ± 0.001 2.946 ± 0.091 80Se(n, α)77Ge 0.5661 ± 0.0001 0.182 ± 0.001 14.810 ± 1.227 Table 3. Sample details (weight, thickness, and atomic density) of the investigated reactions along with their associated uncertainties.
-
Before counting the induced γ-ray activity inside the irradiated sample, a 152Eu known standard γ-ray source was used to calibrate a High Purity Germanium (HPGe) detector. The HPGe detector has a relative efficiency of ≥ 50 % and ≤ 2.1 keV resolution at 1.33 MeV γ-ray energy of 60Co. The detector was encased within a lead shield to minimize interference from background activities. The samples were positioned at a distance of 3 cm from the end cap of the HPGe detector. The counts under γ-ray photopeak were determined using GENIE software with a 16K multi-channel analyzer. The counts of the 152Eu γ-ray source at the characteristic γ-ray energy are shown in Fig. 4. Furthermore, the photo-peak counts of the residual nuclei 76As, 78As, 81Seg, 75Se, and 77Ge at the characteristic γ-ray energies of 559.086 keV, 694.9 keV, 275.990 keV, 121.1155 keV, and 211.03 keV, respectively, are shown in Fig. 5.
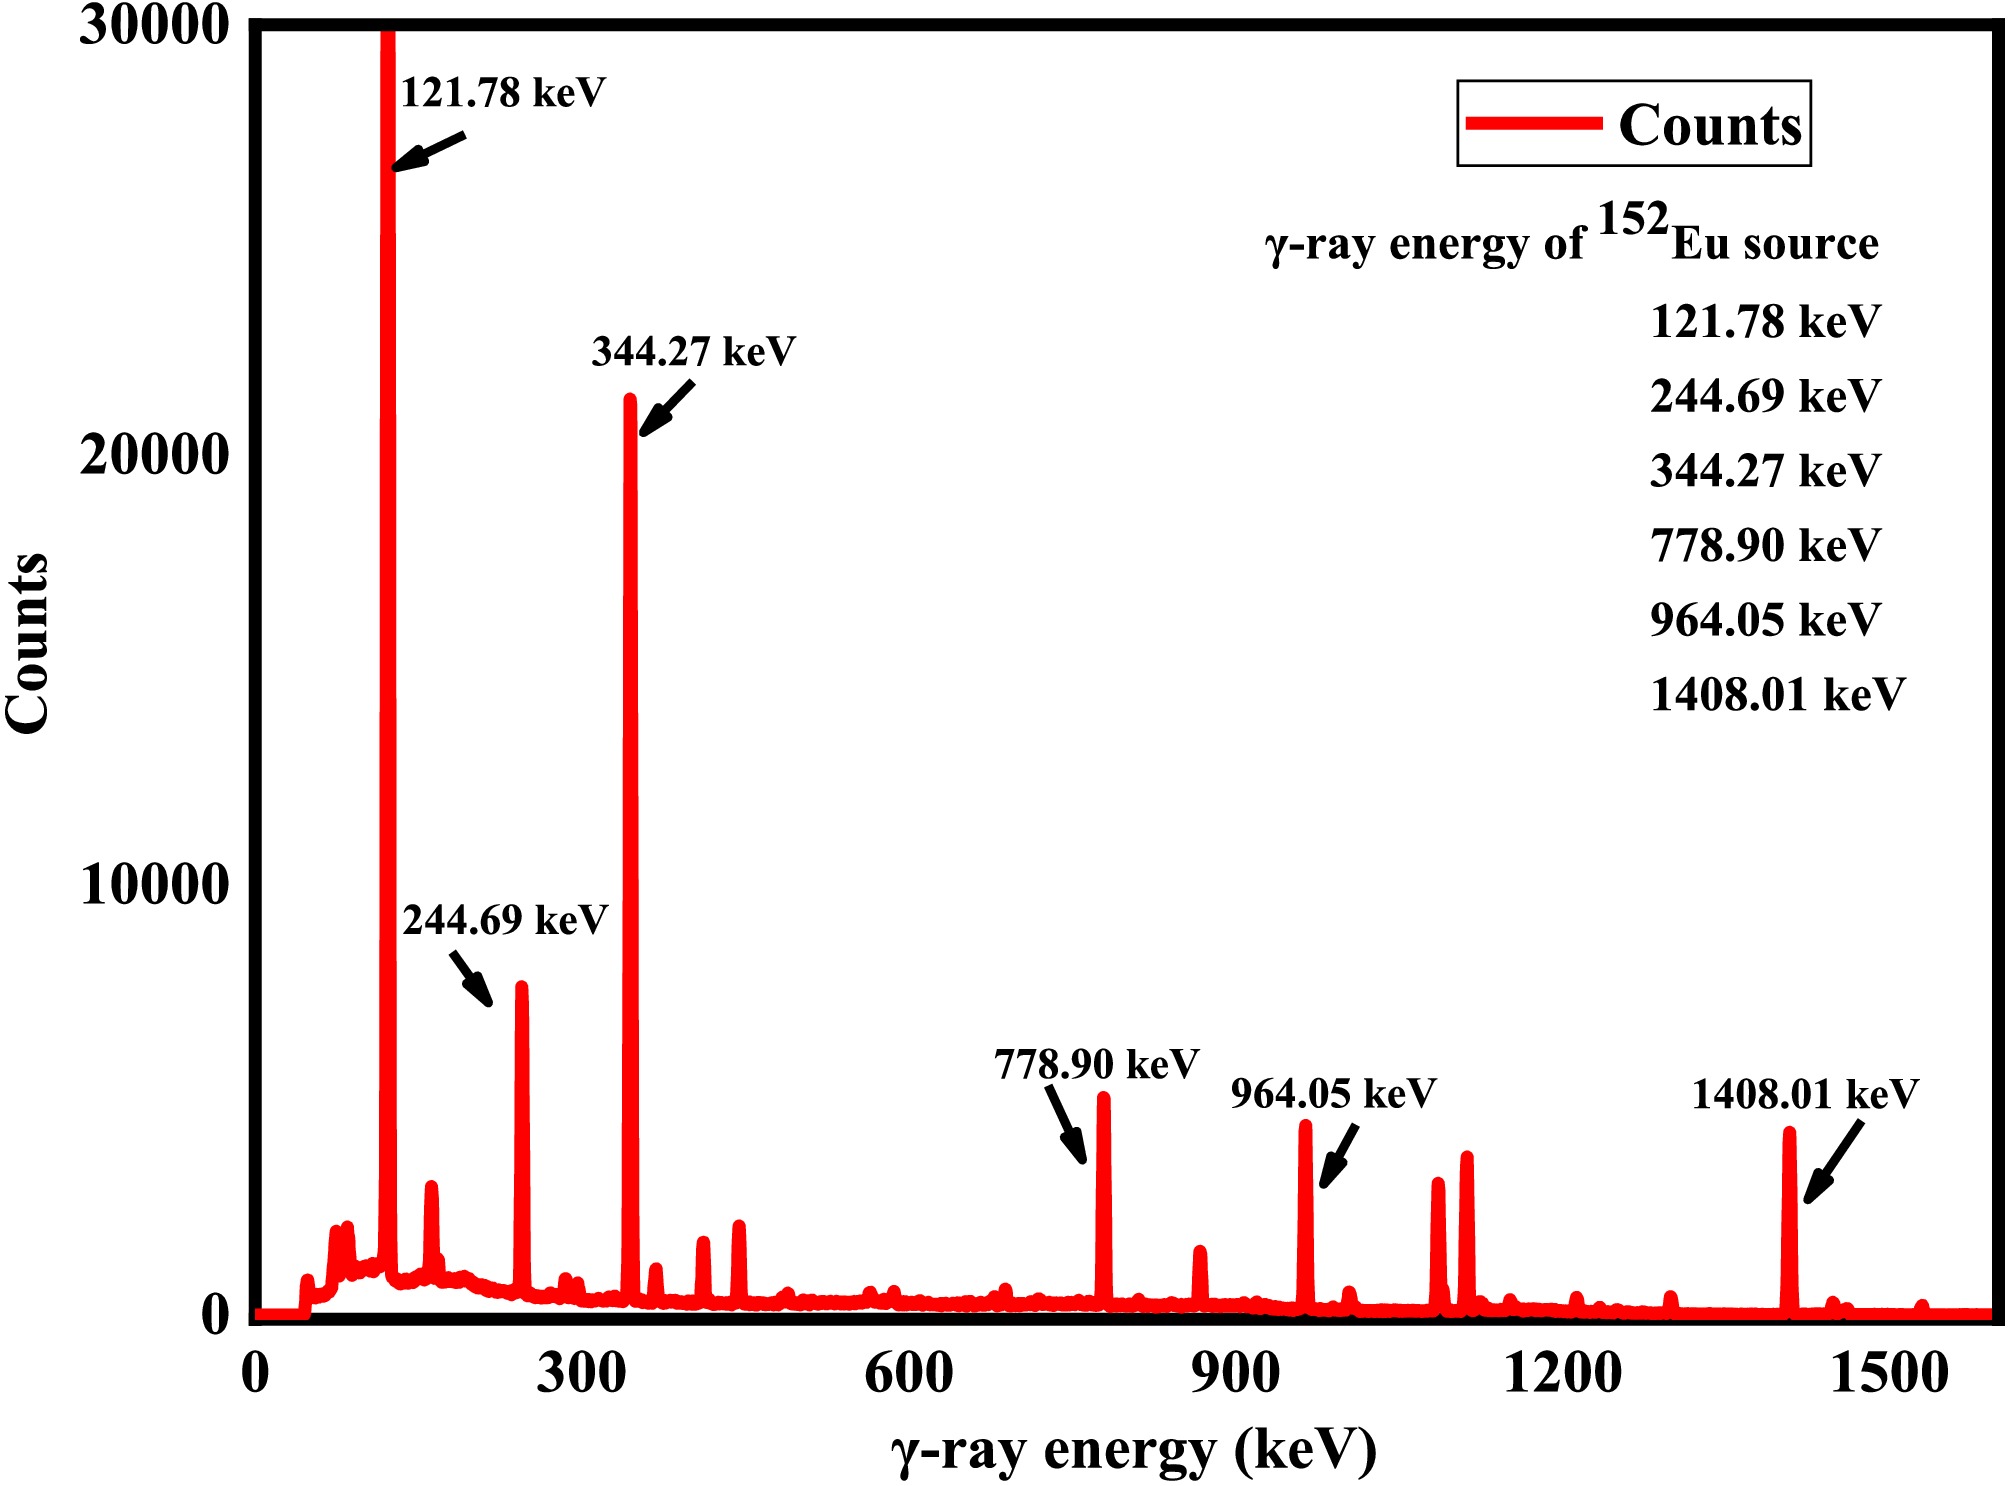
Figure 4. (color online) Count spectra of calibrated 152Eu source using GENIE software.
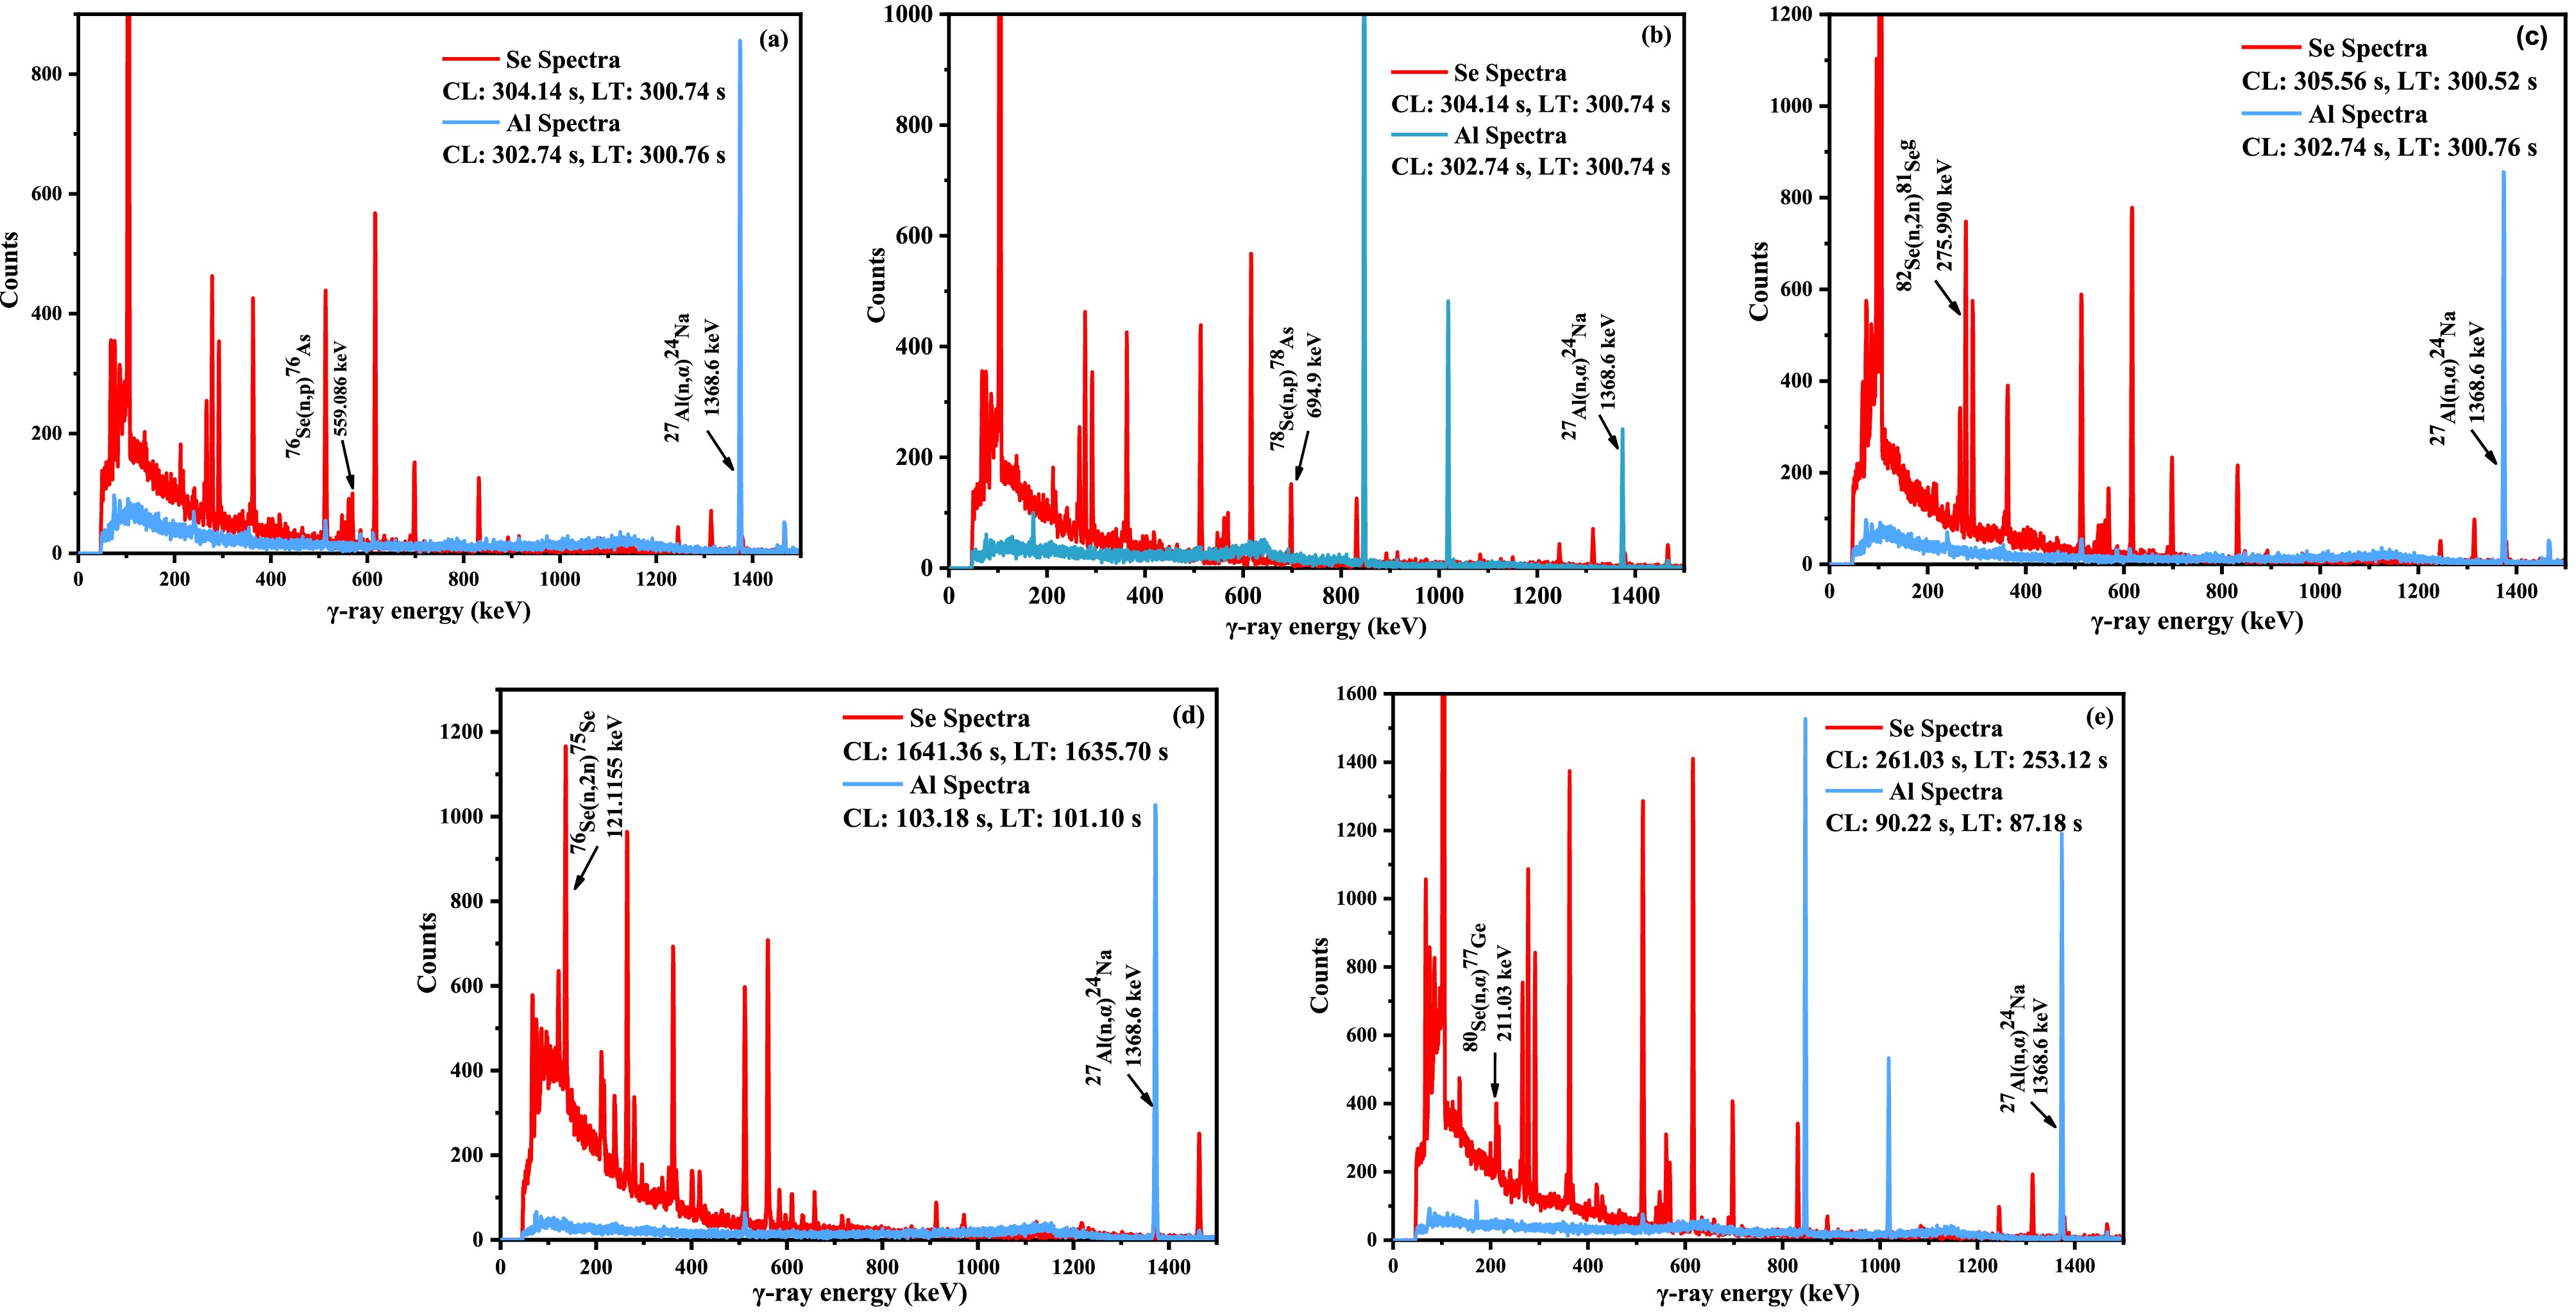
Figure 5. (color online) Spectra of γ-ray photopeak for the residual nuclei of sample (Se) and monitor (Al).
-
Before counting the induced γ-ray activity inside the irradiated sample, a 152Eu known standard γ-ray source was used to calibrate a High Purity Germanium (HPGe) detector. The HPGe detector has a relative efficiency of ≥ 50 % and ≤ 2.1 keV resolution at 1.33 MeV γ-ray energy of 60Co. The detector was encased within a lead shield to minimize interference from background activities. The samples were positioned at a distance of 3 cm from the end cap of the HPGe detector. The counts under γ-ray photopeak were determined using GENIE software with a 16K multi-channel analyzer. The counts of the 152Eu γ-ray source at the characteristic γ-ray energy are shown in Fig. 4. Furthermore, the photo-peak counts of the residual nuclei 76As, 78As, 81Seg, 75Se, and 77Ge at the characteristic γ-ray energies of 559.086 keV, 694.9 keV, 275.990 keV, 121.1155 keV, and 211.03 keV, respectively, are shown in Fig. 5.
Figure 4. (color online) Count spectra of calibrated 152Eu source using GENIE software.
Figure 5. (color online) Spectra of γ-ray photopeak for the residual nuclei of sample (Se) and monitor (Al).
-
Before counting the induced γ-ray activity inside the irradiated sample, a 152Eu known standard γ-ray source was used to calibrate a High Purity Germanium (HPGe) detector. The HPGe detector has a relative efficiency of ≥ 50 % and ≤ 2.1 keV resolution at 1.33 MeV γ-ray energy of 60Co. The detector was encased within a lead shield to minimize interference from background activities. The samples were positioned at a distance of 3 cm from the end cap of the HPGe detector. The counts under γ-ray photopeak were determined using GENIE software with a 16K multi-channel analyzer. The counts of the 152Eu γ-ray source at the characteristic γ-ray energy are shown in Fig. 4. Furthermore, the photo-peak counts of the residual nuclei 76As, 78As, 81Seg, 75Se, and 77Ge at the characteristic γ-ray energies of 559.086 keV, 694.9 keV, 275.990 keV, 121.1155 keV, and 211.03 keV, respectively, are shown in Fig. 5.
Figure 4. (color online) Count spectra of calibrated 152Eu source using GENIE software.
Figure 5. (color online) Spectra of γ-ray photopeak for the residual nuclei of sample (Se) and monitor (Al).
-
The D-T reaction with Q value (17.58 MeV), which is initiated with the deuteron energy (Ed) and emitted kinetic energy
$ ({E}_{n} $ ) of the neutrons at an angle θ (0°), is determined using Eq. (1) [8].$ \left[E_n(\theta)\right]^{\tfrac 1 2}=\frac{\left(M_d M_n E_d\right)^{\tfrac 1 2} \cos \theta+\left[M_d M_n E_d \cos ^2 \theta+\left\{M_\alpha+M_n\right\}\left(M_\alpha Q+E_d\left(M_\alpha-M_n\right)\right)\right]^{\tfrac 1 2}}{M_\alpha+M_n} ,$
(1) where
$ {M}_{d} $ is the mass of deuteron,$ {M}_{n} $ is the mass of neutron, and$ {M}_{\alpha } $ is the mass of the alpha particle. The average neutron energy at 0° emergent angle of the irradiated sample with a radius (R) at a distance (L) from the TiT target is given by Eq. (2) [9].$ \lt E> ~=\frac{2{L}^{2}}{{R}^{2}}\int\limits_{0}^{{\tan}^{-1}\left(\tfrac{R}{L}\right)}{E}_{n}\left(\theta \right)\left(\frac{\tan \theta }{{{{\cos}}}^{2}\theta }\right){\mathrm{d}}\theta. $
(2) Here, L = 1 cm and R = 0.5 cm.
The average neutron energy for the irradiated sample from Eq. (2) is 14.96 MeV. The average energy of the neutrons is affected by two factors: the D+ ion diameter (2.5 cm) and size of the sample. The uncertainty from both factors are propagated into the final neutron energy calculated using the square quadrature method. Therefore, the calculated neutron energy and its uncertainty are 14.96 ± 0.22 MeV.
-
The D-T reaction with Q value (17.58 MeV), which is initiated with the deuteron energy (Ed) and emitted kinetic energy
$ ({E}_{n} $ ) of the neutrons at an angle θ (0°), is determined using Eq. (1) [8].$ \left[E_n(\theta)\right]^{\tfrac 1 2}=\frac{\left(M_d M_n E_d\right)^{\tfrac 1 2} \cos \theta+\left[M_d M_n E_d \cos ^2 \theta+\left\{M_\alpha+M_n\right\}\left(M_\alpha Q+E_d\left(M_\alpha-M_n\right)\right)\right]^{\tfrac 1 2}}{M_\alpha+M_n} ,$
(1) where
$ {M}_{d} $ is the mass of deuteron,$ {M}_{n} $ is the mass of neutron, and$ {M}_{\alpha } $ is the mass of the alpha particle. The average neutron energy at 0° emergent angle of the irradiated sample with a radius (R) at a distance (L) from the TiT target is given by Eq. (2) [9].$ \lt E> ~=\frac{2{L}^{2}}{{R}^{2}}\int\limits_{0}^{{\tan}^{-1}\left(\tfrac{R}{L}\right)}{E}_{n}\left(\theta \right)\left(\frac{\tan \theta }{{{{\cos}}}^{2}\theta }\right){\mathrm{d}}\theta. $
(2) Here, L = 1 cm and R = 0.5 cm.
The average neutron energy for the irradiated sample from Eq. (2) is 14.96 MeV. The average energy of the neutrons is affected by two factors: the D+ ion diameter (2.5 cm) and size of the sample. The uncertainty from both factors are propagated into the final neutron energy calculated using the square quadrature method. Therefore, the calculated neutron energy and its uncertainty are 14.96 ± 0.22 MeV.
-
The D-T reaction with Q value (17.58 MeV), which is initiated with the deuteron energy (Ed) and emitted kinetic energy
$ ({E}_{n} $ ) of the neutrons at an angle θ (0°), is determined using Eq. (1) [8].$ \left[E_n(\theta)\right]^{\tfrac 1 2}=\frac{\left(M_d M_n E_d\right)^{\tfrac 1 2} \cos \theta+\left[M_d M_n E_d \cos ^2 \theta+\left\{M_\alpha+M_n\right\}\left(M_\alpha Q+E_d\left(M_\alpha-M_n\right)\right)\right]^{\tfrac 1 2}}{M_\alpha+M_n} ,$
(1) where
$ {M}_{d} $ is the mass of deuteron,$ {M}_{n} $ is the mass of neutron, and$ {M}_{\alpha } $ is the mass of the alpha particle. The average neutron energy at 0° emergent angle of the irradiated sample with a radius (R) at a distance (L) from the TiT target is given by Eq. (2) [9].$ \lt E> ~=\frac{2{L}^{2}}{{R}^{2}}\int\limits_{0}^{{\tan}^{-1}\left(\tfrac{R}{L}\right)}{E}_{n}\left(\theta \right)\left(\frac{\tan \theta }{{{{\cos}}}^{2}\theta }\right){\mathrm{d}}\theta. $
(2) Here, L = 1 cm and R = 0.5 cm.
The average neutron energy for the irradiated sample from Eq. (2) is 14.96 MeV. The average energy of the neutrons is affected by two factors: the D+ ion diameter (2.5 cm) and size of the sample. The uncertainty from both factors are propagated into the final neutron energy calculated using the square quadrature method. Therefore, the calculated neutron energy and its uncertainty are 14.96 ± 0.22 MeV.
-
Efficiency calibration of the HPGe detector was performed using a known 152Eu multi γ-ray source (initial activity
$ {N}_{0} $ = 43.7 kBq, half-life = 13.51 yrs, and date of manufacture = 24 February 2009). The detector efficiency (ε) at a distance of 3 cm from the end cap for a point source is given by Eq. (3).$ \varepsilon =\frac{{k}_{c}C}{{N}_{0}{I}_{\gamma }{t}_{c}{{\mathrm{e}}}^{-\lambda t}}\times {\epsilon }_{P} ,$
(3) where
$ C $ denotes the counts under the photopeak,$ {N}_{0} $ is the initial activity of the 152Eu source, kc is the correction factor for the coincidence summing effect calculated from EFFTRAN [10],$ {I}_{\gamma } $ is the intensity of the characteristic γ-ray, λ is the decay constant, tc is the counting time (s), t is the elapsed time, and$ {\epsilon }_{P} $ is the geometry efficiency of the detector, which is calculated using Eq. (4), as follows:$ {\epsilon }_{p}=\frac{\omega }{4\pi }=\dfrac{2\pi \left[1-\dfrac{p}{\sqrt{{p}^{2}+{b}^{2}}}\right]}{4\pi }. $
(4) $ {\epsilon }_{p} $ includes the solid angle ($ \omega ) $ , p is the distance from the source to detector, and b is the radius of the detector.From Eq. (3), the efficiency is a function of four variables (C,
$ {I}_{\gamma } $ ,$ {N}_{0} $ , λ), and the uncertainty in the efficiency of the detector can be estimated using Eq. (5) [11], as follows:$ \left(\frac{\Delta {\varepsilon }_{i}}{{\varepsilon }_{i}}\right)=\sqrt{{\left(\frac{\Delta {C}_{i}}{{C}_{i}}\right)}^{2}+{\left(\frac{\Delta {{{I}_{\gamma }}}_{i}}{{{{I}_{\gamma }}}_{i}}\right)}^{2}+{\left(\frac{\Delta {N}_{o}}{{N}_{o}}\right)}^{2}+(t\Delta \lambda {)}^{2}}. $
(5) The interpolated efficiency of the detector was estimated using a linear parametric function (Eq. 6) by Geraldo et al. [12] as
$ \ln \left(\varepsilon_m\right)=\sum_{k=1}^n P_k\left[\ln \left(E_m\right)\right]^{k-1}, \quad 1<m<6,1<n<4 . $
(6) The fitted efficiency curve of the HPGe detector is depicted in Fig. 6. In the aforementioned equation,
$ {\varepsilon }_{m} $ is the corresponding efficiency of the characteristic γ-ray ($ {E}_{m} $ ), and$ {P}_{k} $ denotes the fitting parameters given by Eq. (7).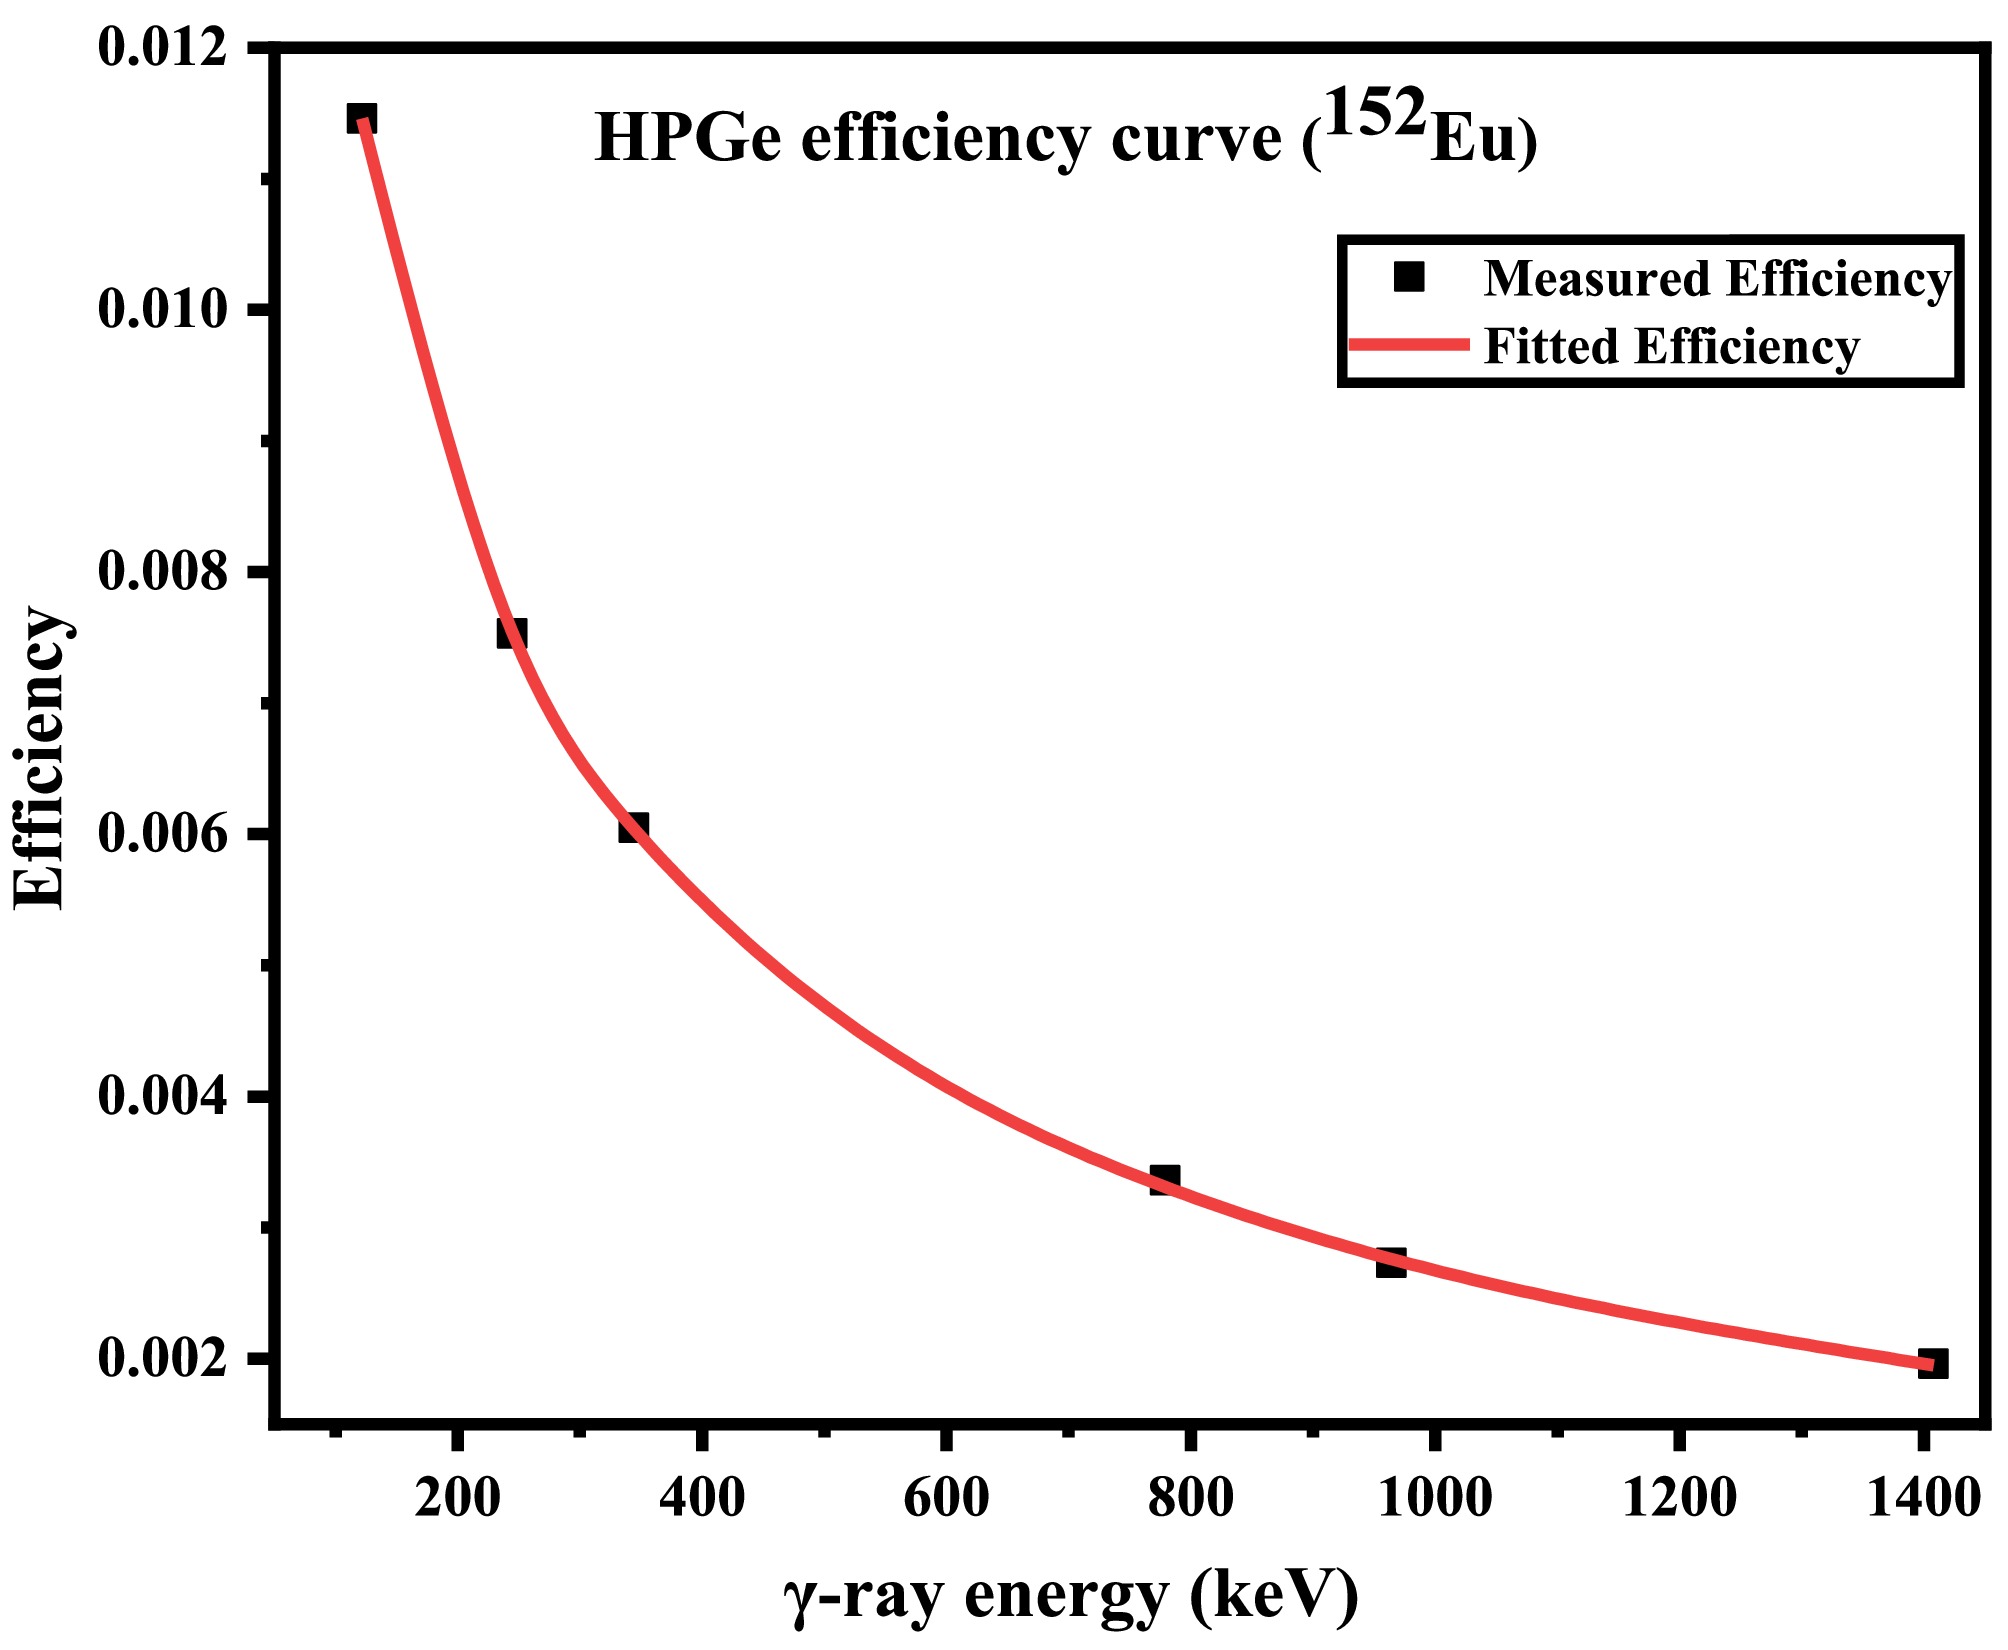
Figure 6. (color online) Fitted efficiency curve of 152Eu γ-ray source.
$\hat{P}=\left({A}^{T}V_{z}^{-1}Z\right){V}_{\hat{P}} .$
(7) Here,
$ {V}_{\hat{P}} $ is the covariance matrix, and matrix VZ is obtained from Eq. (8), as follows:$ {V}_{Z}=\frac{({V}_{\varepsilon }{)}_{ij}}{{\varepsilon }_{i}{\varepsilon }_{j}}.$
(8) The goodness of fit (value of n) is given by the chi-square, as shown in Eq. (9) [13−14].
$ {\chi }^{2}=(Z-AP{)}^{\text{'}}V_{Z}^{-1}\left(Z-AP\right). $
(9) The inferred fitted parameters
$ (\hat{P}) $ are −5.923, −0.879, −0.126, and −0.017; the chi- square value is 5.21, and$ \dfrac{\chi ^2}{6-4} $ ≈ 2.6. The interpolated efficiencies of the residual nuclei 76As, 78As, 81Seg, 75Se, and 77Ge at the characteristic γ-ray are mentioned in Table 4.Reaction Efficiency (e−03) Uncertainty (e−03) Covariance Matrix (e−10) Correlation Matrix 76Se(n, p)76As 4.29 0.023 5.37 1 78Se(n, p)78As 3.63 0.029 6.75 8.86 0.97 1 82Se(n, 2n)81Seg 6.98 0.066 10.08 10.11 44.63 0.65 0.50 1 76Se(n, 2n)75Se 11.50 0.027 2.34 3.15 7.18 7.48 0.36 0.38 0.39 1 80Se(n, α)77Ge 8.26 0.034 3.88 3.54 22.21 4.65 11.78 0.48 0.34 0.96 0.49 1 Table 4. Efficiency, uncertainty, covariance, and correlation matrix of studied reactions.
-
Efficiency calibration of the HPGe detector was performed using a known 152Eu multi γ-ray source (initial activity
$ {N}_{0} $ = 43.7 kBq, half-life = 13.51 yrs, and date of manufacture = 24 February 2009). The detector efficiency (ε) at a distance of 3 cm from the end cap for a point source is given by Eq. (3).$ \varepsilon =\frac{{k}_{c}C}{{N}_{0}{I}_{\gamma }{t}_{c}{{\mathrm{e}}}^{-\lambda t}}\times {\epsilon }_{P} ,$
(3) where
$ C $ denotes the counts under the photopeak,$ {N}_{0} $ is the initial activity of the 152Eu source, kc is the correction factor for the coincidence summing effect calculated from EFFTRAN [10],$ {I}_{\gamma } $ is the intensity of the characteristic γ-ray, λ is the decay constant, tc is the counting time (s), t is the elapsed time, and$ {\epsilon }_{P} $ is the geometry efficiency of the detector, which is calculated using Eq. (4), as follows:$ {\epsilon }_{p}=\frac{\omega }{4\pi }=\dfrac{2\pi \left[1-\dfrac{p}{\sqrt{{p}^{2}+{b}^{2}}}\right]}{4\pi }. $
(4) $ {\epsilon }_{p} $ includes the solid angle ($ \omega ) $ , p is the distance from the source to detector, and b is the radius of the detector.From Eq. (3), the efficiency is a function of four variables (C,
$ {I}_{\gamma } $ ,$ {N}_{0} $ , λ), and the uncertainty in the efficiency of the detector can be estimated using Eq. (5) [11], as follows:$ \left(\frac{\Delta {\varepsilon }_{i}}{{\varepsilon }_{i}}\right)=\sqrt{{\left(\frac{\Delta {C}_{i}}{{C}_{i}}\right)}^{2}+{\left(\frac{\Delta {{{I}_{\gamma }}}_{i}}{{{{I}_{\gamma }}}_{i}}\right)}^{2}+{\left(\frac{\Delta {N}_{o}}{{N}_{o}}\right)}^{2}+(t\Delta \lambda {)}^{2}}. $
(5) The interpolated efficiency of the detector was estimated using a linear parametric function (Eq. 6) by Geraldo et al. [12] as
$ \ln \left(\varepsilon_m\right)=\sum_{k=1}^n P_k\left[\ln \left(E_m\right)\right]^{k-1}, \quad 1<m<6,1<n<4 . $
(6) The fitted efficiency curve of the HPGe detector is depicted in Fig. 6. In the aforementioned equation,
$ {\varepsilon }_{m} $ is the corresponding efficiency of the characteristic γ-ray ($ {E}_{m} $ ), and$ {P}_{k} $ denotes the fitting parameters given by Eq. (7).
Figure 6. (color online) Fitted efficiency curve of 152Eu γ-ray source.
$\hat{P}=\left({A}^{T}V_{z}^{-1}Z\right){V}_{\hat{P}} .$
(7) Here,
$ {V}_{\hat{P}} $ is the covariance matrix, and matrix VZ is obtained from Eq. (8), as follows:$ {V}_{Z}=\frac{({V}_{\varepsilon }{)}_{ij}}{{\varepsilon }_{i}{\varepsilon }_{j}}.$
(8) The goodness of fit (value of n) is given by the chi-square, as shown in Eq. (9) [13−14].
$ {\chi }^{2}=(Z-AP{)}^{\text{'}}V_{Z}^{-1}\left(Z-AP\right). $
(9) The inferred fitted parameters
$ (\hat{P}) $ are −5.923, −0.879, −0.126, and −0.017; the chi- square value is 5.21, and$ \dfrac{\chi ^2}{6-4} $ ≈ 2.6. The interpolated efficiencies of the residual nuclei 76As, 78As, 81Seg, 75Se, and 77Ge at the characteristic γ-ray are mentioned in Table 4.Reaction Efficiency (e−03) Uncertainty (e−03) Covariance Matrix (e−10) Correlation Matrix 76Se(n, p)76As 4.29 0.023 5.37 1 78Se(n, p)78As 3.63 0.029 6.75 8.86 0.97 1 82Se(n, 2n)81Seg 6.98 0.066 10.08 10.11 44.63 0.65 0.50 1 76Se(n, 2n)75Se 11.50 0.027 2.34 3.15 7.18 7.48 0.36 0.38 0.39 1 80Se(n, α)77Ge 8.26 0.034 3.88 3.54 22.21 4.65 11.78 0.48 0.34 0.96 0.49 1 Table 4. Efficiency, uncertainty, covariance, and correlation matrix of studied reactions.
-
Efficiency calibration of the HPGe detector was performed using a known 152Eu multi γ-ray source (initial activity
$ {N}_{0} $ = 43.7 kBq, half-life = 13.51 yrs, and date of manufacture = 24 February 2009). The detector efficiency (ε) at a distance of 3 cm from the end cap for a point source is given by Eq. (3).$ \varepsilon =\frac{{k}_{c}C}{{N}_{0}{I}_{\gamma }{t}_{c}{{\mathrm{e}}}^{-\lambda t}}\times {\epsilon }_{P} ,$
(3) where
$ C $ denotes the counts under the photopeak,$ {N}_{0} $ is the initial activity of the 152Eu source, kc is the correction factor for the coincidence summing effect calculated from EFFTRAN [10],$ {I}_{\gamma } $ is the intensity of the characteristic γ-ray, λ is the decay constant, tc is the counting time (s), t is the elapsed time, and$ {\epsilon }_{P} $ is the geometry efficiency of the detector, which is calculated using Eq. (4), as follows:$ {\epsilon }_{p}=\frac{\omega }{4\pi }=\dfrac{2\pi \left[1-\dfrac{p}{\sqrt{{p}^{2}+{b}^{2}}}\right]}{4\pi }. $
(4) $ {\epsilon }_{p} $ includes the solid angle ($ \omega ) $ , p is the distance from the source to detector, and b is the radius of the detector.From Eq. (3), the efficiency is a function of four variables (C,
$ {I}_{\gamma } $ ,$ {N}_{0} $ , λ), and the uncertainty in the efficiency of the detector can be estimated using Eq. (5) [11], as follows:$ \left(\frac{\Delta {\varepsilon }_{i}}{{\varepsilon }_{i}}\right)=\sqrt{{\left(\frac{\Delta {C}_{i}}{{C}_{i}}\right)}^{2}+{\left(\frac{\Delta {{{I}_{\gamma }}}_{i}}{{{{I}_{\gamma }}}_{i}}\right)}^{2}+{\left(\frac{\Delta {N}_{o}}{{N}_{o}}\right)}^{2}+(t\Delta \lambda {)}^{2}}. $
(5) The interpolated efficiency of the detector was estimated using a linear parametric function (Eq. 6) by Geraldo et al. [12] as
$ \ln \left(\varepsilon_m\right)=\sum_{k=1}^n P_k\left[\ln \left(E_m\right)\right]^{k-1}, \quad 1<m<6,1<n<4 . $
(6) The fitted efficiency curve of the HPGe detector is depicted in Fig. 6. In the aforementioned equation,
$ {\varepsilon }_{m} $ is the corresponding efficiency of the characteristic γ-ray ($ {E}_{m} $ ), and$ {P}_{k} $ denotes the fitting parameters given by Eq. (7).
Figure 6. (color online) Fitted efficiency curve of 152Eu γ-ray source.
$\hat{P}=\left({A}^{T}V_{z}^{-1}Z\right){V}_{\hat{P}} .$
(7) Here,
$ {V}_{\hat{P}} $ is the covariance matrix, and matrix VZ is obtained from Eq. (8), as follows:$ {V}_{Z}=\frac{({V}_{\varepsilon }{)}_{ij}}{{\varepsilon }_{i}{\varepsilon }_{j}}.$
(8) The goodness of fit (value of n) is given by the chi-square, as shown in Eq. (9) [13−14].
$ {\chi }^{2}=(Z-AP{)}^{\text{'}}V_{Z}^{-1}\left(Z-AP\right). $
(9) The inferred fitted parameters
$ (\hat{P}) $ are −5.923, −0.879, −0.126, and −0.017; the chi- square value is 5.21, and$ \dfrac{\chi ^2}{6-4} $ ≈ 2.6. The interpolated efficiencies of the residual nuclei 76As, 78As, 81Seg, 75Se, and 77Ge at the characteristic γ-ray are mentioned in Table 4.Reaction Efficiency (e−03) Uncertainty (e−03) Covariance Matrix (e−10) Correlation Matrix 76Se(n, p)76As 4.29 0.023 5.37 1 78Se(n, p)78As 3.63 0.029 6.75 8.86 0.97 1 82Se(n, 2n)81Seg 6.98 0.066 10.08 10.11 44.63 0.65 0.50 1 76Se(n, 2n)75Se 11.50 0.027 2.34 3.15 7.18 7.48 0.36 0.38 0.39 1 80Se(n, α)77Ge 8.26 0.034 3.88 3.54 22.21 4.65 11.78 0.48 0.34 0.96 0.49 1 Table 4. Efficiency, uncertainty, covariance, and correlation matrix of studied reactions.
-
The cross sections of the Se isotopes were estimated using the ratio method (Eq. (10)) with 27Al(n, α)24Na as the reference monitor reaction [15, 16].
$ \sigma_r=\sigma_m\frac{\left[NI_{\gamma}\varepsilon f\right]_m[C\lambda\dfrac{CL}{LT}]_r}{\left[NI_{\gamma}\varepsilon f\right]_r[C\lambda\dfrac{CL}{LT}]_m}\prod_k^{ }\frac{\left(C_k\right)_r}{\left(C_k\right)_m}, $
(10) where the subscripts r and m denote the studied reactions and monitor reaction, respectively.
The reference monitor reaction cross section (
$ {\sigma }_{m}) $ of 27Al(n, α)24Na is 108.6 ± 1.38 mb, taken from the IRDFF-II evaluated data library [17] at the bounding energy points (14.8 and 15.0 MeV) for 14.96 MeV neutron energy by using the linear interpolation method.In the aforementioned Eq. (10),
$ N $ denotes the number of nuclei (includes the atomic mass (AM), isotopic abundance (a), weight of the sample (W)),$ {I}_{\gamma } $ is the intensity of γ-ray abundance,$ \varepsilon $ is the efficiency at the characteristic γ ray energy (Eγ), f is the time factor,$ C $ denotes the count under the photo-peak,$ \lambda $ is the decay constant, CL is the real time (clock time), LT denotes the live time, and$ {C}_{k} $ denotes the correction factors.$f=\left(1-{{\mathrm{e}}}^{-\lambda T}\right)\left({{\mathrm{e}}}^{-\lambda {{t}_{1}}}\right)\left(1-{{\mathrm{e}}}^{-\lambda {{t}_{2}}}\right), $
(11) In Eq. (11), f is a time factor that includes the irradiation time (T), cooling time (t1), and counting time (t2) in seconds.
Moreover, the correction factor (
$ {C}_{k}) $ mentioned in Eq. (10) is defined as follows:γ-ray self-attenuation correction factor (
$ {\boldsymbol{f}}_{\boldsymbol{s}-\boldsymbol{a}\boldsymbol{t}\boldsymbol{t}}) $ :$ {f}_{s-att}=\frac{\mu td}{1-{{\mathrm{e}}}^{-\mu td}}, $
(12) where
$ \mu $ is the mass attenuation coefficient (cm2 g−1) at the characteristic γ-ray energy taken from XMuDat [18],$ t $ is the thickness of the sample (cm), and$ d $ is the density of the sample (g cm−3) in Eq. (12).Geometry correction factor (
$ {\boldsymbol{f}}_{\boldsymbol{g}}) $ :$ f_g=\frac{(h+\dfrac t 2)^2}{h^2}, $
(13) where h is the distance from the surface of the sample to the detector (cm); t is the thickness of the sample (cm) in Eq. (13).
Neutron fluctuation correction factor (
$ {\boldsymbol{f}}_{{\mathrm{flue}}}) $ :${f}_{{\mathrm{flue}}}=\frac{\displaystyle\sum\limits_{i}^{p}{\varphi }_{i}\left(1-{{\mathrm{e}}}^{-\lambda \Delta {{t}_{i}}}\right){{\mathrm{e}}}^{-\lambda {{T}_{i}}}}{\varphi S}. $
(14) In the aforementioned Eq. (14), p denotes the time intervals into which the irradiation time (T) is divided; ∆ti represents the duration of the ith time interval; Ti is the time elapsed from the end of the ith interval to the completion of irradiation;
$ {\varphi }_{i} $ denotes the average neutron flux over the sample throughout ∆ti; and S is the growth factor of the residual nuclei (S = 1−exp (−λT)) [19−20].The calculated correction factors of the studied reactions are shown in Table 5.
Correction factors 76Se(n, p)76As 78Se(n, p)78As 82Se(n, 2n)81Seg 76Se(n, 2n)75Se 80Se(n, α)77Ge $ {f}_{s-att} $ 1.03 1.02 1.05 1.19 1.07 $ {f}_{g} $ 1.06 1.06 1.06 1.06 1.06 $ {f}_{\rm flue} $ 1.29 1.28 1.29 0.99 0.98 Table 5. List of correction factors for the studied reactions.
The uncertainty in the measured cross section values is evaluated using the quadratic sum formula shown in Eq. (15) [10].
$ \begin{aligned}[b]{\left(\frac{\Delta {\sigma }_{r}}{{\sigma }_{r}}\right)}^{2}=&\sum\limits_{a}{\left(\frac{\Delta {a}_{r}}{{a}_{r}}\right)}^{2}+\sum\limits_{a}{\left(\frac{\Delta {a}_{m}}{{a}_{m}}\right)}^{2}+\sum\limits_{a}{\left(\frac{\Delta {\sigma }_{m}}{{\sigma }_{m}}\right)}^{2},\\& a=a\left(C,N,\varepsilon ,{I}_{\gamma },f,{C}_{k}\right). \end{aligned} $
(15) -
The cross sections of the Se isotopes were estimated using the ratio method (Eq. (10)) with 27Al(n, α)24Na as the reference monitor reaction [15, 16].
$ \sigma_r=\sigma_m\frac{\left[NI_{\gamma}\varepsilon f\right]_m[C\lambda\dfrac{CL}{LT}]_r}{\left[NI_{\gamma}\varepsilon f\right]_r[C\lambda\dfrac{CL}{LT}]_m}\prod_k^{ }\frac{\left(C_k\right)_r}{\left(C_k\right)_m}, $
(10) where the subscripts r and m denote the studied reactions and monitor reaction, respectively.
The reference monitor reaction cross section (
$ {\sigma }_{m}) $ of 27Al(n, α)24Na is 108.6 ± 1.38 mb, taken from the IRDFF-II evaluated data library [17] at the bounding energy points (14.8 and 15.0 MeV) for 14.96 MeV neutron energy by using the linear interpolation method.In the aforementioned Eq. (10),
$ N $ denotes the number of nuclei (includes the atomic mass (AM), isotopic abundance (a), weight of the sample (W)),$ {I}_{\gamma } $ is the intensity of γ-ray abundance,$ \varepsilon $ is the efficiency at the characteristic γ ray energy (Eγ), f is the time factor,$ C $ denotes the count under the photo-peak,$ \lambda $ is the decay constant, CL is the real time (clock time), LT denotes the live time, and$ {C}_{k} $ denotes the correction factors.$f=\left(1-{{\mathrm{e}}}^{-\lambda T}\right)\left({{\mathrm{e}}}^{-\lambda {{t}_{1}}}\right)\left(1-{{\mathrm{e}}}^{-\lambda {{t}_{2}}}\right), $
(11) In Eq. (11), f is a time factor that includes the irradiation time (T), cooling time (t1), and counting time (t2) in seconds.
Moreover, the correction factor (
$ {C}_{k}) $ mentioned in Eq. (10) is defined as follows:γ-ray self-attenuation correction factor (
$ {\boldsymbol{f}}_{\boldsymbol{s}-\boldsymbol{a}\boldsymbol{t}\boldsymbol{t}}) $ :$ {f}_{s-att}=\frac{\mu td}{1-{{\mathrm{e}}}^{-\mu td}}, $
(12) where
$ \mu $ is the mass attenuation coefficient (cm2 g−1) at the characteristic γ-ray energy taken from XMuDat [18],$ t $ is the thickness of the sample (cm), and$ d $ is the density of the sample (g cm−3) in Eq. (12).Geometry correction factor (
$ {\boldsymbol{f}}_{\boldsymbol{g}}) $ :$ f_g=\frac{(h+\dfrac t 2)^2}{h^2}, $
(13) where h is the distance from the surface of the sample to the detector (cm); t is the thickness of the sample (cm) in Eq. (13).
Neutron fluctuation correction factor (
$ {\boldsymbol{f}}_{{\mathrm{flue}}}) $ :${f}_{{\mathrm{flue}}}=\frac{\displaystyle\sum\limits_{i}^{p}{\varphi }_{i}\left(1-{{\mathrm{e}}}^{-\lambda \Delta {{t}_{i}}}\right){{\mathrm{e}}}^{-\lambda {{T}_{i}}}}{\varphi S}. $
(14) In the aforementioned Eq. (14), p denotes the time intervals into which the irradiation time (T) is divided; ∆ti represents the duration of the ith time interval; Ti is the time elapsed from the end of the ith interval to the completion of irradiation;
$ {\varphi }_{i} $ denotes the average neutron flux over the sample throughout ∆ti; and S is the growth factor of the residual nuclei (S = 1−exp (−λT)) [19−20].The calculated correction factors of the studied reactions are shown in Table 5.
Correction factors 76Se(n, p)76As 78Se(n, p)78As 82Se(n, 2n)81Seg 76Se(n, 2n)75Se 80Se(n, α)77Ge $ {f}_{s-att} $ 1.03 1.02 1.05 1.19 1.07 $ {f}_{g} $ 1.06 1.06 1.06 1.06 1.06 $ {f}_{\rm flue} $ 1.29 1.28 1.29 0.99 0.98 Table 5. List of correction factors for the studied reactions.
The uncertainty in the measured cross section values is evaluated using the quadratic sum formula shown in Eq. (15) [10].
$ \begin{aligned}[b]{\left(\frac{\Delta {\sigma }_{r}}{{\sigma }_{r}}\right)}^{2}=&\sum\limits_{a}{\left(\frac{\Delta {a}_{r}}{{a}_{r}}\right)}^{2}+\sum\limits_{a}{\left(\frac{\Delta {a}_{m}}{{a}_{m}}\right)}^{2}+\sum\limits_{a}{\left(\frac{\Delta {\sigma }_{m}}{{\sigma }_{m}}\right)}^{2},\\& a=a\left(C,N,\varepsilon ,{I}_{\gamma },f,{C}_{k}\right). \end{aligned} $
(15) -
The cross sections of the Se isotopes were estimated using the ratio method (Eq. (10)) with 27Al(n, α)24Na as the reference monitor reaction [15, 16].
$ \sigma_r=\sigma_m\frac{\left[NI_{\gamma}\varepsilon f\right]_m[C\lambda\dfrac{CL}{LT}]_r}{\left[NI_{\gamma}\varepsilon f\right]_r[C\lambda\dfrac{CL}{LT}]_m}\prod_k^{ }\frac{\left(C_k\right)_r}{\left(C_k\right)_m}, $
(10) where the subscripts r and m denote the studied reactions and monitor reaction, respectively.
The reference monitor reaction cross section (
$ {\sigma }_{m}) $ of 27Al(n, α)24Na is 108.6 ± 1.38 mb, taken from the IRDFF-II evaluated data library [17] at the bounding energy points (14.8 and 15.0 MeV) for 14.96 MeV neutron energy by using the linear interpolation method.In the aforementioned Eq. (10),
$ N $ denotes the number of nuclei (includes the atomic mass (AM), isotopic abundance (a), weight of the sample (W)),$ {I}_{\gamma } $ is the intensity of γ-ray abundance,$ \varepsilon $ is the efficiency at the characteristic γ ray energy (Eγ), f is the time factor,$ C $ denotes the count under the photo-peak,$ \lambda $ is the decay constant, CL is the real time (clock time), LT denotes the live time, and$ {C}_{k} $ denotes the correction factors.$f=\left(1-{{\mathrm{e}}}^{-\lambda T}\right)\left({{\mathrm{e}}}^{-\lambda {{t}_{1}}}\right)\left(1-{{\mathrm{e}}}^{-\lambda {{t}_{2}}}\right), $
(11) In Eq. (11), f is a time factor that includes the irradiation time (T), cooling time (t1), and counting time (t2) in seconds.
Moreover, the correction factor (
$ {C}_{k}) $ mentioned in Eq. (10) is defined as follows:γ-ray self-attenuation correction factor (
$ {\boldsymbol{f}}_{\boldsymbol{s}-\boldsymbol{a}\boldsymbol{t}\boldsymbol{t}}) $ :$ {f}_{s-att}=\frac{\mu td}{1-{{\mathrm{e}}}^{-\mu td}}, $
(12) where
$ \mu $ is the mass attenuation coefficient (cm2 g−1) at the characteristic γ-ray energy taken from XMuDat [18],$ t $ is the thickness of the sample (cm), and$ d $ is the density of the sample (g cm−3) in Eq. (12).Geometry correction factor (
$ {\boldsymbol{f}}_{\boldsymbol{g}}) $ :$ f_g=\frac{(h+\dfrac t 2)^2}{h^2}, $
(13) where h is the distance from the surface of the sample to the detector (cm); t is the thickness of the sample (cm) in Eq. (13).
Neutron fluctuation correction factor (
$ {\boldsymbol{f}}_{{\mathrm{flue}}}) $ :${f}_{{\mathrm{flue}}}=\frac{\displaystyle\sum\limits_{i}^{p}{\varphi }_{i}\left(1-{{\mathrm{e}}}^{-\lambda \Delta {{t}_{i}}}\right){{\mathrm{e}}}^{-\lambda {{T}_{i}}}}{\varphi S}. $
(14) In the aforementioned Eq. (14), p denotes the time intervals into which the irradiation time (T) is divided; ∆ti represents the duration of the ith time interval; Ti is the time elapsed from the end of the ith interval to the completion of irradiation;
$ {\varphi }_{i} $ denotes the average neutron flux over the sample throughout ∆ti; and S is the growth factor of the residual nuclei (S = 1−exp (−λT)) [19−20].The calculated correction factors of the studied reactions are shown in Table 5.
Correction factors 76Se(n, p)76As 78Se(n, p)78As 82Se(n, 2n)81Seg 76Se(n, 2n)75Se 80Se(n, α)77Ge $ {f}_{s-att} $ 1.03 1.02 1.05 1.19 1.07 $ {f}_{g} $ 1.06 1.06 1.06 1.06 1.06 $ {f}_{\rm flue} $ 1.29 1.28 1.29 0.99 0.98 Table 5. List of correction factors for the studied reactions.
The uncertainty in the measured cross section values is evaluated using the quadratic sum formula shown in Eq. (15) [10].
$ \begin{aligned}[b]{\left(\frac{\Delta {\sigma }_{r}}{{\sigma }_{r}}\right)}^{2}=&\sum\limits_{a}{\left(\frac{\Delta {a}_{r}}{{a}_{r}}\right)}^{2}+\sum\limits_{a}{\left(\frac{\Delta {a}_{m}}{{a}_{m}}\right)}^{2}+\sum\limits_{a}{\left(\frac{\Delta {\sigma }_{m}}{{\sigma }_{m}}\right)}^{2},\\& a=a\left(C,N,\varepsilon ,{I}_{\gamma },f,{C}_{k}\right). \end{aligned} $
(15) -
The contribution of the competing reaction channel may be from the same residual nuclei yield from the parent nuclei and identical characteristic γ-ray emission from different residual nuclei. In this study, the residual nuclei 81Seg emits the identical characteristic γ-ray energy from its metastable state ( 81Sem) [21]. Therefore, the contribution of the competing reaction is reduced using Eq. (16).
$ R=\frac{{C}_{{{obs}_{r1}}}}{{C}_{{{obs}_{r2}}}}=\frac{{a}_{r1}{\sigma }_{r1}{\tau }_{{{1/2}_{r1}}}}{{a}_{r2}{\sigma }_{r2}{\tau }_{{{1/2}_{r2}}}}. $
(16) In Eq. (16), r1 and r2 are the reactions, a is the isotopic abundance,
$ \sigma $ is the cross section taken from the TENDL-2025 library, and$ {\tau }_{1/2} $ is the half- life (s).Specifically, r1 is the 82Se(n, 2n)81Seg reaction, and r2 is the 82Se(n, 2n)81Sem reaction.
$ {\sigma }_{r1} $ is 471.33 mb and$ {\sigma }_{r2} $ is 874.88 mb.$ {\tau }_{{{1/2}_{r1}}} $ is 1107 s and$ {\tau }_{{{1/2}_{r2}}} $ is 3436.8 s.The ratios of the cross-section of the ground state to that of the isomeric state for the reaction 82Se(n, 2n)81Se are approximately equal for both the evaluated nuclear data libraries (JEFF-4.0 and TENDL-2025). This indicates a negligible effect of the choice of the evaluated nuclear data library on the final cross section value. However, TENDL-2025 was selected, as it is a TALYS-based evaluated nuclear data library incorporating both default and adjusted parameters and other codes wrapped into a Total Monte Carlo loop for uncertainty quantification. Hence, it provides theoretically consistent predictions for the separation of the contribution of the metastable state from that of the ground state.
-
The contribution of the competing reaction channel may be from the same residual nuclei yield from the parent nuclei and identical characteristic γ-ray emission from different residual nuclei. In this study, the residual nuclei 81Seg emits the identical characteristic γ-ray energy from its metastable state ( 81Sem) [21]. Therefore, the contribution of the competing reaction is reduced using Eq. (16).
$ R=\frac{{C}_{{{obs}_{r1}}}}{{C}_{{{obs}_{r2}}}}=\frac{{a}_{r1}{\sigma }_{r1}{\tau }_{{{1/2}_{r1}}}}{{a}_{r2}{\sigma }_{r2}{\tau }_{{{1/2}_{r2}}}}. $
(16) In Eq. (16), r1 and r2 are the reactions, a is the isotopic abundance,
$ \sigma $ is the cross section taken from the TENDL-2025 library, and$ {\tau }_{1/2} $ is the half- life (s).Specifically, r1 is the 82Se(n, 2n)81Seg reaction, and r2 is the 82Se(n, 2n)81Sem reaction.
$ {\sigma }_{r1} $ is 471.33 mb and$ {\sigma }_{r2} $ is 874.88 mb.$ {\tau }_{{{1/2}_{r1}}} $ is 1107 s and$ {\tau }_{{{1/2}_{r2}}} $ is 3436.8 s.The ratios of the cross-section of the ground state to that of the isomeric state for the reaction 82Se(n, 2n)81Se are approximately equal for both the evaluated nuclear data libraries (JEFF-4.0 and TENDL-2025). This indicates a negligible effect of the choice of the evaluated nuclear data library on the final cross section value. However, TENDL-2025 was selected, as it is a TALYS-based evaluated nuclear data library incorporating both default and adjusted parameters and other codes wrapped into a Total Monte Carlo loop for uncertainty quantification. Hence, it provides theoretically consistent predictions for the separation of the contribution of the metastable state from that of the ground state.
-
The contribution of the competing reaction channel may be from the same residual nuclei yield from the parent nuclei and identical characteristic γ-ray emission from different residual nuclei. In this study, the residual nuclei 81Seg emits the identical characteristic γ-ray energy from its metastable state ( 81Sem) [21]. Therefore, the contribution of the competing reaction is reduced using Eq. (16).
$ R=\frac{{C}_{{{obs}_{r1}}}}{{C}_{{{obs}_{r2}}}}=\frac{{a}_{r1}{\sigma }_{r1}{\tau }_{{{1/2}_{r1}}}}{{a}_{r2}{\sigma }_{r2}{\tau }_{{{1/2}_{r2}}}}. $
(16) In Eq. (16), r1 and r2 are the reactions, a is the isotopic abundance,
$ \sigma $ is the cross section taken from the TENDL-2025 library, and$ {\tau }_{1/2} $ is the half- life (s).Specifically, r1 is the 82Se(n, 2n)81Seg reaction, and r2 is the 82Se(n, 2n)81Sem reaction.
$ {\sigma }_{r1} $ is 471.33 mb and$ {\sigma }_{r2} $ is 874.88 mb.$ {\tau }_{{{1/2}_{r1}}} $ is 1107 s and$ {\tau }_{{{1/2}_{r2}}} $ is 3436.8 s.The ratios of the cross-section of the ground state to that of the isomeric state for the reaction 82Se(n, 2n)81Se are approximately equal for both the evaluated nuclear data libraries (JEFF-4.0 and TENDL-2025). This indicates a negligible effect of the choice of the evaluated nuclear data library on the final cross section value. However, TENDL-2025 was selected, as it is a TALYS-based evaluated nuclear data library incorporating both default and adjusted parameters and other codes wrapped into a Total Monte Carlo loop for uncertainty quantification. Hence, it provides theoretically consistent predictions for the separation of the contribution of the metastable state from that of the ground state.
-
Covariance analysis is a statistical approach implemented to describe and evaluate the degree of correlation between various parameters of the studied reactions. The covariance (correlations) between the parameters must be considered to neglect the underestimation or overestimation of the uncertainty in the value of the cross section. Consequently, the uncertainty associated with different parameters were considered to evaluate the uncertainties in the cross sections and covariance matrices of the Se reactions. Moreover, the correlation coefficient between any two parameters is represented in three ways: if two parameters (x1 and x2) are independent of each other, they are uncorrelated (Cor (x1, x2) = 0); if the parameters are governed by comparable common factors, they are correlated (Cor (x1, x2) = 1); and if the parameters are partially related to each other, they are considered to be partially correlated (0 < Cor (x1, x2) < 1) [11]. The correlations between the various studied Se reactions (“cross- correlation”) were estimated, as shown in Table 6.
Attributes Cor
(p, q)Cor
(p, r)Cor
(p, s)Cor
(p, t)Cor
(q, r)Cor
(q, s)Cor
(q, t)Cor
(r, s)Cor
(r, t)Cor
(s, t)$ {\sigma }_{m} $ 1 1 1 1 1 1 1 1 1 1 Cm 0 1 0 0 0 0 0 0 0 0 Cr 0 0 0 0 0 0 0 0 0 0 $ {\lambda }_{m} $ 1 1 1 1 1 1 1 1 1 1 $ {\lambda }_{r} $ 0 0 0 0 0 0 0 0 0 0 $ {I}_{\gamma m} $ 1 1 1 1 1 1 1 1 1 1 $ {I}_{\gamma r} $ 0 0 0 0 0 0 0 0 0 0 $ {AM}_{m} $ 1 1 1 1 1 1 1 1 1 1 $ {AM}_{r} $ 0 0 1 0 0 0 0 0 0 0 $ {W}_{m} $ 1 1 0 0 1 0 0 0 0 1 $ {W}_{r} $ 1 1 0 0 1 0 0 0 0 1 $ {a}_{m} $ 1 1 1 1 1 1 1 1 1 1 $ {\varepsilon }_{m} $ 1 1 1 1 1 1 1 1 1 1 $ {\varepsilon }_{r} $ 0.97 0.65 0.36 0.48 0.50 0.38 0.34 0.39 0.96 0.49 $ {f}_{{{s-att}_{m}}} $ 1 1 0 0 1 0 0 0 0 1 $ {f}_{{{s-att}_{r}}} $ 0 0 0 0 0 0 0 0 0 0 $ {f}_{{{g}_{m}}} $ 1 1 1 1 1 1 1 1 1 1 $ {f}_{{{g}_{r}}} $ 1 1 0 0 1 0 0 0 0 1 * p = 76Se(n, p)76As, q = 78Se(n, p)78As, r = 82Se(n, 2n)81Seg, s = 76Se(n, 2n)75Se, and t = 80Se(n, α)77Ge. Table 6. Correlation coefficient of the studied reactions with respect to the various parameters.
The efficiencies are partially correlated with each other, as they are derived from the common calibrated curve (Fig. 6). Therefore, the correlation coefficients corresponding to the efficiencies are calculated by Eq. (17).
$ \mathrm{Corr}\left({\text{ε}}_{\text{i}},{\text{ε}}_{\text{j}}\right)=\frac{\text{Cov}\left({\text{ε}}_{\text{i}},{\text{ε}}_{\text{j}}\right)}{\sqrt{\text{var}\left({\text{ε}}_{\text{i}}\right)}\sqrt{\text{var}\left({\text{ε}}_{\text{j}}\right)}} ,$
(17) where
$ \mathrm{Cov}({\varepsilon }_{\mathrm{i}},{\varepsilon }_{\mathrm{j}}) $ is the covariance matrix presented in Table 4.The partial uncertainty matrices and micro-correlation matrices are used to construct the covariance matrix for the investigated reactions using the below expression (Eq. 18) [13].
$ {(V}_{\sigma }{)}_{ij}=\sum\limits_{m}{e}_{im}{S}_{ijm}{e}_{jm} .$
(18) where
$ {e}_{im} $ and$ {e}_{jm} $ are the partial uncertainty matrices for the ith and jth parameters, and$ {S}_{ijm} $ is the micro-correlation matrix for the various parameters. All parameters with their uncertainties are used to construct the covariance matrix. The calculated cross section with fractional uncertainty, covariance, and correlation matrix for the 76Se(n, p)76As, 78Se(n, p)78As, 82Se(n, 2n)81Seg, 76Se(n, 2n)75Se, and 80Se(n, α)77Ge reactions are depicted in Table 7.Reaction σ /mb ∆ σ /mb Covariance Matrix Correlation Matrix 76Se(n, p)76As 55.30 4.09 16.71 1 78Se(n, p)78As 18.77 1.12 2.19 1.18 0.49 1 82Se(n, 2n)81Seg 529.78 51.23 65.13 20.97 2613.05 0.31 0.37 1 76Se(n, 2n)75Se 903.98 55.99 102.15 33.63 980.59 3134.89 0.44 0.55 0.34 1 80Se(n, α)77Ge 2.01 0.12 0.22 0.07 2.21 3.77 0.01 0.46 0.57 0.36 0.56 1 Table 7. Measured cross section, uncertainty, covariance, and correlation matrix of the studied reactions.
-
Covariance analysis is a statistical approach implemented to describe and evaluate the degree of correlation between various parameters of the studied reactions. The covariance (correlations) between the parameters must be considered to neglect the underestimation or overestimation of the uncertainty in the value of the cross section. Consequently, the uncertainty associated with different parameters were considered to evaluate the uncertainties in the cross sections and covariance matrices of the Se reactions. Moreover, the correlation coefficient between any two parameters is represented in three ways: if two parameters (x1 and x2) are independent of each other, they are uncorrelated (Cor (x1, x2) = 0); if the parameters are governed by comparable common factors, they are correlated (Cor (x1, x2) = 1); and if the parameters are partially related to each other, they are considered to be partially correlated (0 < Cor (x1, x2) < 1) [11]. The correlations between the various studied Se reactions (“cross- correlation”) were estimated, as shown in Table 6.
Attributes Cor
(p, q)Cor
(p, r)Cor
(p, s)Cor
(p, t)Cor
(q, r)Cor
(q, s)Cor
(q, t)Cor
(r, s)Cor
(r, t)Cor
(s, t)$ {\sigma }_{m} $ 1 1 1 1 1 1 1 1 1 1 Cm 0 1 0 0 0 0 0 0 0 0 Cr 0 0 0 0 0 0 0 0 0 0 $ {\lambda }_{m} $ 1 1 1 1 1 1 1 1 1 1 $ {\lambda }_{r} $ 0 0 0 0 0 0 0 0 0 0 $ {I}_{\gamma m} $ 1 1 1 1 1 1 1 1 1 1 $ {I}_{\gamma r} $ 0 0 0 0 0 0 0 0 0 0 $ {AM}_{m} $ 1 1 1 1 1 1 1 1 1 1 $ {AM}_{r} $ 0 0 1 0 0 0 0 0 0 0 $ {W}_{m} $ 1 1 0 0 1 0 0 0 0 1 $ {W}_{r} $ 1 1 0 0 1 0 0 0 0 1 $ {a}_{m} $ 1 1 1 1 1 1 1 1 1 1 $ {\varepsilon }_{m} $ 1 1 1 1 1 1 1 1 1 1 $ {\varepsilon }_{r} $ 0.97 0.65 0.36 0.48 0.50 0.38 0.34 0.39 0.96 0.49 $ {f}_{{{s-att}_{m}}} $ 1 1 0 0 1 0 0 0 0 1 $ {f}_{{{s-att}_{r}}} $ 0 0 0 0 0 0 0 0 0 0 $ {f}_{{{g}_{m}}} $ 1 1 1 1 1 1 1 1 1 1 $ {f}_{{{g}_{r}}} $ 1 1 0 0 1 0 0 0 0 1 * p = 76Se(n, p)76As, q = 78Se(n, p)78As, r = 82Se(n, 2n)81Seg, s = 76Se(n, 2n)75Se, and t = 80Se(n, α)77Ge. Table 6. Correlation coefficient of the studied reactions with respect to the various parameters.
The efficiencies are partially correlated with each other, as they are derived from the common calibrated curve (Fig. 6). Therefore, the correlation coefficients corresponding to the efficiencies are calculated by Eq. (17).
$ \mathrm{Corr}\left({\text{ε}}_{\text{i}},{\text{ε}}_{\text{j}}\right)=\frac{\text{Cov}\left({\text{ε}}_{\text{i}},{\text{ε}}_{\text{j}}\right)}{\sqrt{\text{var}\left({\text{ε}}_{\text{i}}\right)}\sqrt{\text{var}\left({\text{ε}}_{\text{j}}\right)}} ,$
(17) where
$ \mathrm{Cov}({\varepsilon }_{\mathrm{i}},{\varepsilon }_{\mathrm{j}}) $ is the covariance matrix presented in Table 4.The partial uncertainty matrices and micro-correlation matrices are used to construct the covariance matrix for the investigated reactions using the below expression (Eq. 18) [13].
$ {(V}_{\sigma }{)}_{ij}=\sum\limits_{m}{e}_{im}{S}_{ijm}{e}_{jm} .$
(18) where
$ {e}_{im} $ and$ {e}_{jm} $ are the partial uncertainty matrices for the ith and jth parameters, and$ {S}_{ijm} $ is the micro-correlation matrix for the various parameters. All parameters with their uncertainties are used to construct the covariance matrix. The calculated cross section with fractional uncertainty, covariance, and correlation matrix for the 76Se(n, p)76As, 78Se(n, p)78As, 82Se(n, 2n)81Seg, 76Se(n, 2n)75Se, and 80Se(n, α)77Ge reactions are depicted in Table 7.Reaction σ /mb ∆ σ /mb Covariance Matrix Correlation Matrix 76Se(n, p)76As 55.30 4.09 16.71 1 78Se(n, p)78As 18.77 1.12 2.19 1.18 0.49 1 82Se(n, 2n)81Seg 529.78 51.23 65.13 20.97 2613.05 0.31 0.37 1 76Se(n, 2n)75Se 903.98 55.99 102.15 33.63 980.59 3134.89 0.44 0.55 0.34 1 80Se(n, α)77Ge 2.01 0.12 0.22 0.07 2.21 3.77 0.01 0.46 0.57 0.36 0.56 1 Table 7. Measured cross section, uncertainty, covariance, and correlation matrix of the studied reactions.
-
Covariance analysis is a statistical approach implemented to describe and evaluate the degree of correlation between various parameters of the studied reactions. The covariance (correlations) between the parameters must be considered to neglect the underestimation or overestimation of the uncertainty in the value of the cross section. Consequently, the uncertainty associated with different parameters were considered to evaluate the uncertainties in the cross sections and covariance matrices of the Se reactions. Moreover, the correlation coefficient between any two parameters is represented in three ways: if two parameters (x1 and x2) are independent of each other, they are uncorrelated (Cor (x1, x2) = 0); if the parameters are governed by comparable common factors, they are correlated (Cor (x1, x2) = 1); and if the parameters are partially related to each other, they are considered to be partially correlated (0 < Cor (x1, x2) < 1) [11]. The correlations between the various studied Se reactions (“cross- correlation”) were estimated, as shown in Table 6.
Attributes Cor
(p, q)Cor
(p, r)Cor
(p, s)Cor
(p, t)Cor
(q, r)Cor
(q, s)Cor
(q, t)Cor
(r, s)Cor
(r, t)Cor
(s, t)$ {\sigma }_{m} $ 1 1 1 1 1 1 1 1 1 1 Cm 0 1 0 0 0 0 0 0 0 0 Cr 0 0 0 0 0 0 0 0 0 0 $ {\lambda }_{m} $ 1 1 1 1 1 1 1 1 1 1 $ {\lambda }_{r} $ 0 0 0 0 0 0 0 0 0 0 $ {I}_{\gamma m} $ 1 1 1 1 1 1 1 1 1 1 $ {I}_{\gamma r} $ 0 0 0 0 0 0 0 0 0 0 $ {AM}_{m} $ 1 1 1 1 1 1 1 1 1 1 $ {AM}_{r} $ 0 0 1 0 0 0 0 0 0 0 $ {W}_{m} $ 1 1 0 0 1 0 0 0 0 1 $ {W}_{r} $ 1 1 0 0 1 0 0 0 0 1 $ {a}_{m} $ 1 1 1 1 1 1 1 1 1 1 $ {\varepsilon }_{m} $ 1 1 1 1 1 1 1 1 1 1 $ {\varepsilon }_{r} $ 0.97 0.65 0.36 0.48 0.50 0.38 0.34 0.39 0.96 0.49 $ {f}_{{{s-att}_{m}}} $ 1 1 0 0 1 0 0 0 0 1 $ {f}_{{{s-att}_{r}}} $ 0 0 0 0 0 0 0 0 0 0 $ {f}_{{{g}_{m}}} $ 1 1 1 1 1 1 1 1 1 1 $ {f}_{{{g}_{r}}} $ 1 1 0 0 1 0 0 0 0 1 * p = 76Se(n, p)76As, q = 78Se(n, p)78As, r = 82Se(n, 2n)81Seg, s = 76Se(n, 2n)75Se, and t = 80Se(n, α)77Ge. Table 6. Correlation coefficient of the studied reactions with respect to the various parameters.
The efficiencies are partially correlated with each other, as they are derived from the common calibrated curve (Fig. 6). Therefore, the correlation coefficients corresponding to the efficiencies are calculated by Eq. (17).
$ \mathrm{Corr}\left({\text{ε}}_{\text{i}},{\text{ε}}_{\text{j}}\right)=\frac{\text{Cov}\left({\text{ε}}_{\text{i}},{\text{ε}}_{\text{j}}\right)}{\sqrt{\text{var}\left({\text{ε}}_{\text{i}}\right)}\sqrt{\text{var}\left({\text{ε}}_{\text{j}}\right)}} ,$
(17) where
$ \mathrm{Cov}({\varepsilon }_{\mathrm{i}},{\varepsilon }_{\mathrm{j}}) $ is the covariance matrix presented in Table 4.The partial uncertainty matrices and micro-correlation matrices are used to construct the covariance matrix for the investigated reactions using the below expression (Eq. 18) [13].
$ {(V}_{\sigma }{)}_{ij}=\sum\limits_{m}{e}_{im}{S}_{ijm}{e}_{jm} .$
(18) where
$ {e}_{im} $ and$ {e}_{jm} $ are the partial uncertainty matrices for the ith and jth parameters, and$ {S}_{ijm} $ is the micro-correlation matrix for the various parameters. All parameters with their uncertainties are used to construct the covariance matrix. The calculated cross section with fractional uncertainty, covariance, and correlation matrix for the 76Se(n, p)76As, 78Se(n, p)78As, 82Se(n, 2n)81Seg, 76Se(n, 2n)75Se, and 80Se(n, α)77Ge reactions are depicted in Table 7.Reaction σ /mb ∆ σ /mb Covariance Matrix Correlation Matrix 76Se(n, p)76As 55.30 4.09 16.71 1 78Se(n, p)78As 18.77 1.12 2.19 1.18 0.49 1 82Se(n, 2n)81Seg 529.78 51.23 65.13 20.97 2613.05 0.31 0.37 1 76Se(n, 2n)75Se 903.98 55.99 102.15 33.63 980.59 3134.89 0.44 0.55 0.34 1 80Se(n, α)77Ge 2.01 0.12 0.22 0.07 2.21 3.77 0.01 0.46 0.57 0.36 0.56 1 Table 7. Measured cross section, uncertainty, covariance, and correlation matrix of the studied reactions.
-
The measured cross section of the 76Se(n, p)76As reaction leading to the residual nucleus of 76As is 55.30 ± 4.09 mb with a fractional uncertainty of 7.40 % at the neutron energy of 14.96 ± 0.22 MeV (Table 7). The measured cross section exceeds the value reported by T. S. Ganesapandy et al. by 15 % [22] at the neutron energy of 14.77 MeV. This difference is attributed to the use of a powder as the target material, which resulted in the geometry correction factor being neglected in the measurement of the reaction cross section (Fig. 7). The cross section reported by A. A. Filatenkov et al. [23] is 54.4 mb at the neutron energy of 14.8 MeV with 93Nb(n, 2n)92Nbm as the monitor reaction. Moreover, the cross section reported by A. A. Filatenkov et al. does not incorporate the geometry correction factor. However, the error bar of the measured cross section values is consistent with the JEFF-4.0 evaluated data library [24]. The measured cross section of the 76Se(n, p)76As reaction deviated by 2.80 % from the results of the CENDL-3.2 nuclear data library, as shown in Table 8 [25].
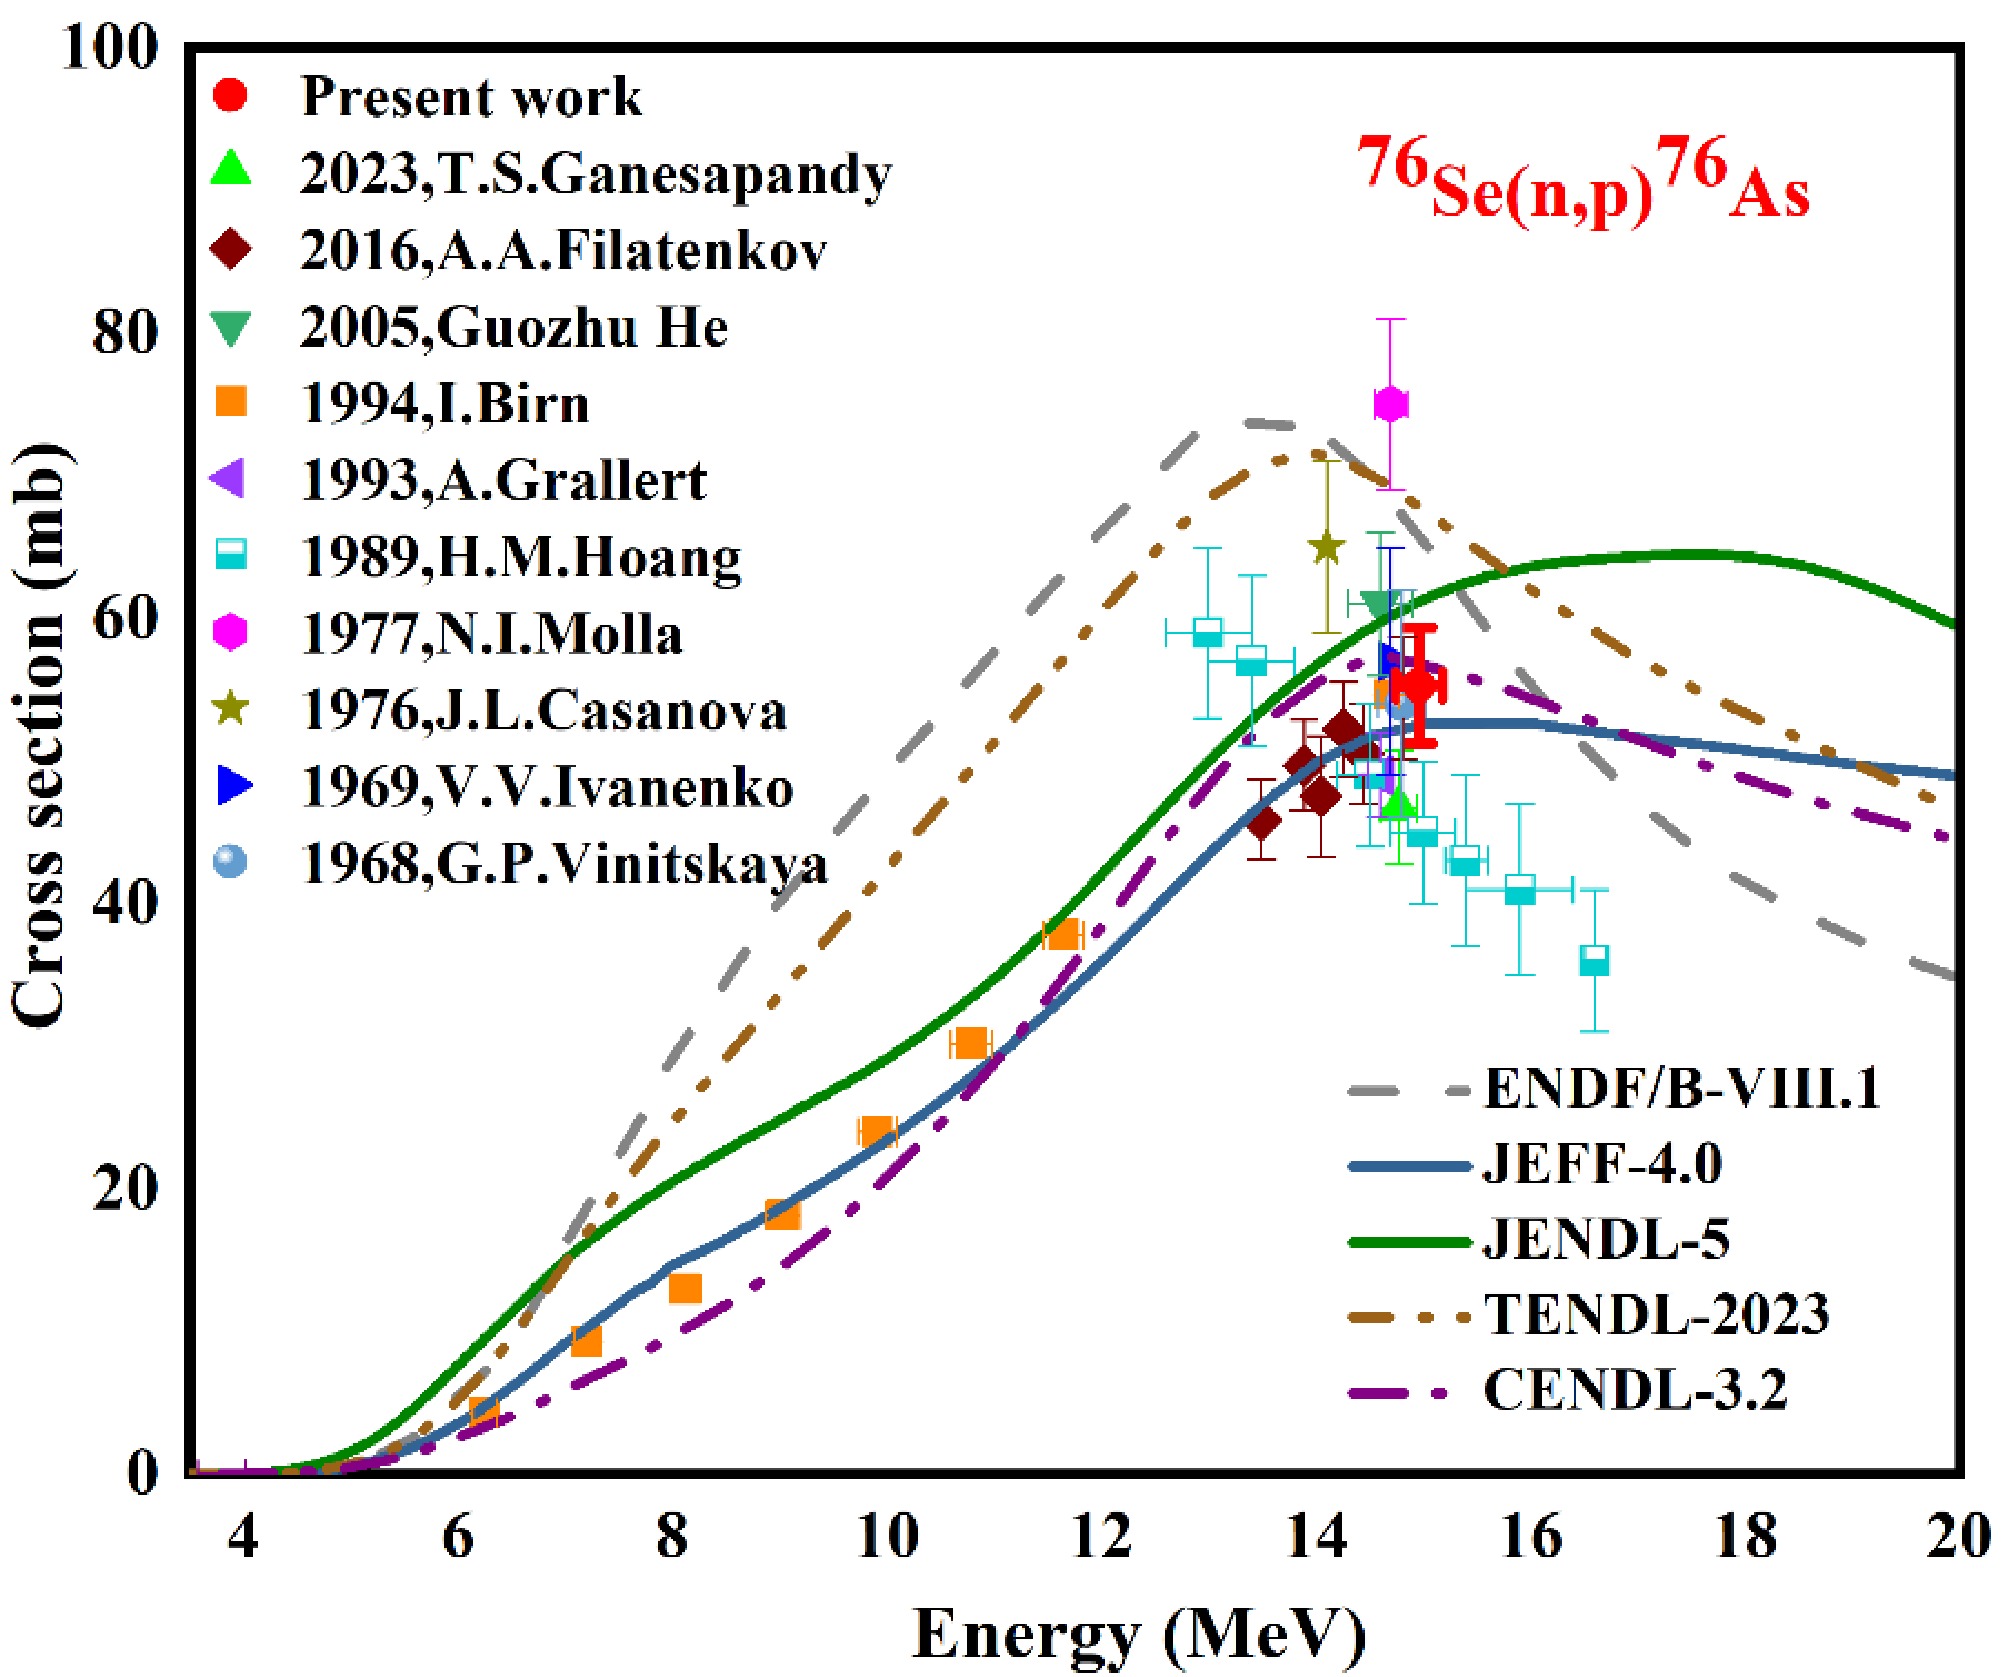
Figure 7. (color online) Comparison between the measured, previously reported, ENDF/B-VIII.1, JEFF-4.0, JENDL-5, TENDL-2023, and CENDL-3.2 library cross section data for the 76Se(n, p)76As reaction.
Reaction Percentage Deviation of cross section ENDF/B-VIII.1 JEFF-4.0 JENDL-5 TENDL-2023 CENDL-3.2 76Se(n, p)76As 18.97 −5.05 11.25 22.68 2.80 78Se(n, p)78As 11.51 7.25 11.51 90.41 −3.46 82Se(n, 2n)81Seg - −11.07 - −38.97 - 76Se(n, 2n)75Se 5.09 7.15 4.56 −16.86 −10.99 80Se(n, α)77Ge 929.80 59.91 9.98 135.27 159.05 Table 8. Percentage deviation (%) of the measured cross section from the data in various evaluated libraries for the studied reactions.
-
The measured cross section of the 76Se(n, p)76As reaction leading to the residual nucleus of 76As is 55.30 ± 4.09 mb with a fractional uncertainty of 7.40 % at the neutron energy of 14.96 ± 0.22 MeV (Table 7). The measured cross section exceeds the value reported by T. S. Ganesapandy et al. by 15 % [22] at the neutron energy of 14.77 MeV. This difference is attributed to the use of a powder as the target material, which resulted in the geometry correction factor being neglected in the measurement of the reaction cross section (Fig. 7). The cross section reported by A. A. Filatenkov et al. [23] is 54.4 mb at the neutron energy of 14.8 MeV with 93Nb(n, 2n)92Nbm as the monitor reaction. Moreover, the cross section reported by A. A. Filatenkov et al. does not incorporate the geometry correction factor. However, the error bar of the measured cross section values is consistent with the JEFF-4.0 evaluated data library [24]. The measured cross section of the 76Se(n, p)76As reaction deviated by 2.80 % from the results of the CENDL-3.2 nuclear data library, as shown in Table 8 [25].
Figure 7. (color online) Comparison between the measured, previously reported, ENDF/B-VIII.1, JEFF-4.0, JENDL-5, TENDL-2023, and CENDL-3.2 library cross section data for the 76Se(n, p)76As reaction.
Reaction Percentage Deviation of cross section ENDF/B-VIII.1 JEFF-4.0 JENDL-5 TENDL-2023 CENDL-3.2 76Se(n, p)76As 18.97 −5.05 11.25 22.68 2.80 78Se(n, p)78As 11.51 7.25 11.51 90.41 −3.46 82Se(n, 2n)81Seg - −11.07 - −38.97 - 76Se(n, 2n)75Se 5.09 7.15 4.56 −16.86 −10.99 80Se(n, α)77Ge 929.80 59.91 9.98 135.27 159.05 Table 8. Percentage deviation (%) of the measured cross section from the data in various evaluated libraries for the studied reactions.
-
The measured cross section of the 76Se(n, p)76As reaction leading to the residual nucleus of 76As is 55.30 ± 4.09 mb with a fractional uncertainty of 7.40 % at the neutron energy of 14.96 ± 0.22 MeV (Table 7). The measured cross section exceeds the value reported by T. S. Ganesapandy et al. by 15 % [22] at the neutron energy of 14.77 MeV. This difference is attributed to the use of a powder as the target material, which resulted in the geometry correction factor being neglected in the measurement of the reaction cross section (Fig. 7). The cross section reported by A. A. Filatenkov et al. [23] is 54.4 mb at the neutron energy of 14.8 MeV with 93Nb(n, 2n)92Nbm as the monitor reaction. Moreover, the cross section reported by A. A. Filatenkov et al. does not incorporate the geometry correction factor. However, the error bar of the measured cross section values is consistent with the JEFF-4.0 evaluated data library [24]. The measured cross section of the 76Se(n, p)76As reaction deviated by 2.80 % from the results of the CENDL-3.2 nuclear data library, as shown in Table 8 [25].
Figure 7. (color online) Comparison between the measured, previously reported, ENDF/B-VIII.1, JEFF-4.0, JENDL-5, TENDL-2023, and CENDL-3.2 library cross section data for the 76Se(n, p)76As reaction.
Reaction Percentage Deviation of cross section ENDF/B-VIII.1 JEFF-4.0 JENDL-5 TENDL-2023 CENDL-3.2 76Se(n, p)76As 18.97 −5.05 11.25 22.68 2.80 78Se(n, p)78As 11.51 7.25 11.51 90.41 −3.46 82Se(n, 2n)81Seg - −11.07 - −38.97 - 76Se(n, 2n)75Se 5.09 7.15 4.56 −16.86 −10.99 80Se(n, α)77Ge 929.80 59.91 9.98 135.27 159.05 Table 8. Percentage deviation (%) of the measured cross section from the data in various evaluated libraries for the studied reactions.
-
The measured cross section of the 78Se(n, p)78As reaction leading to the residual nuclei of 78As is 18.77 ± 1.12 mb, associated with an uncertainty of 5.98 % at the neutron energy of 14.96 MeV. The measured cross section is consistent with the previously reported data. However, the cross section uncertainty (13.1 %) reported by T. S. Ganesapandy et al. [22] is significantly higher than the measured cross section uncertainty (5.98 %). The cross section reported by A. A. Filatenkov et al. is 21.2 ± 2.3 mb at the neutron energy of 14.81 MeV [23], surpassing the measured cross section value in this study by approximately 11.4 % (Fig. 8). Moreover, the measured cross section lies within the uncertainty range and shows deviations of 7.25 % and −3.46 % from the JEFF-4.0 [24] and CENDL-3.2 [25] evaluated nuclear data libraries, respectively (Table 8).
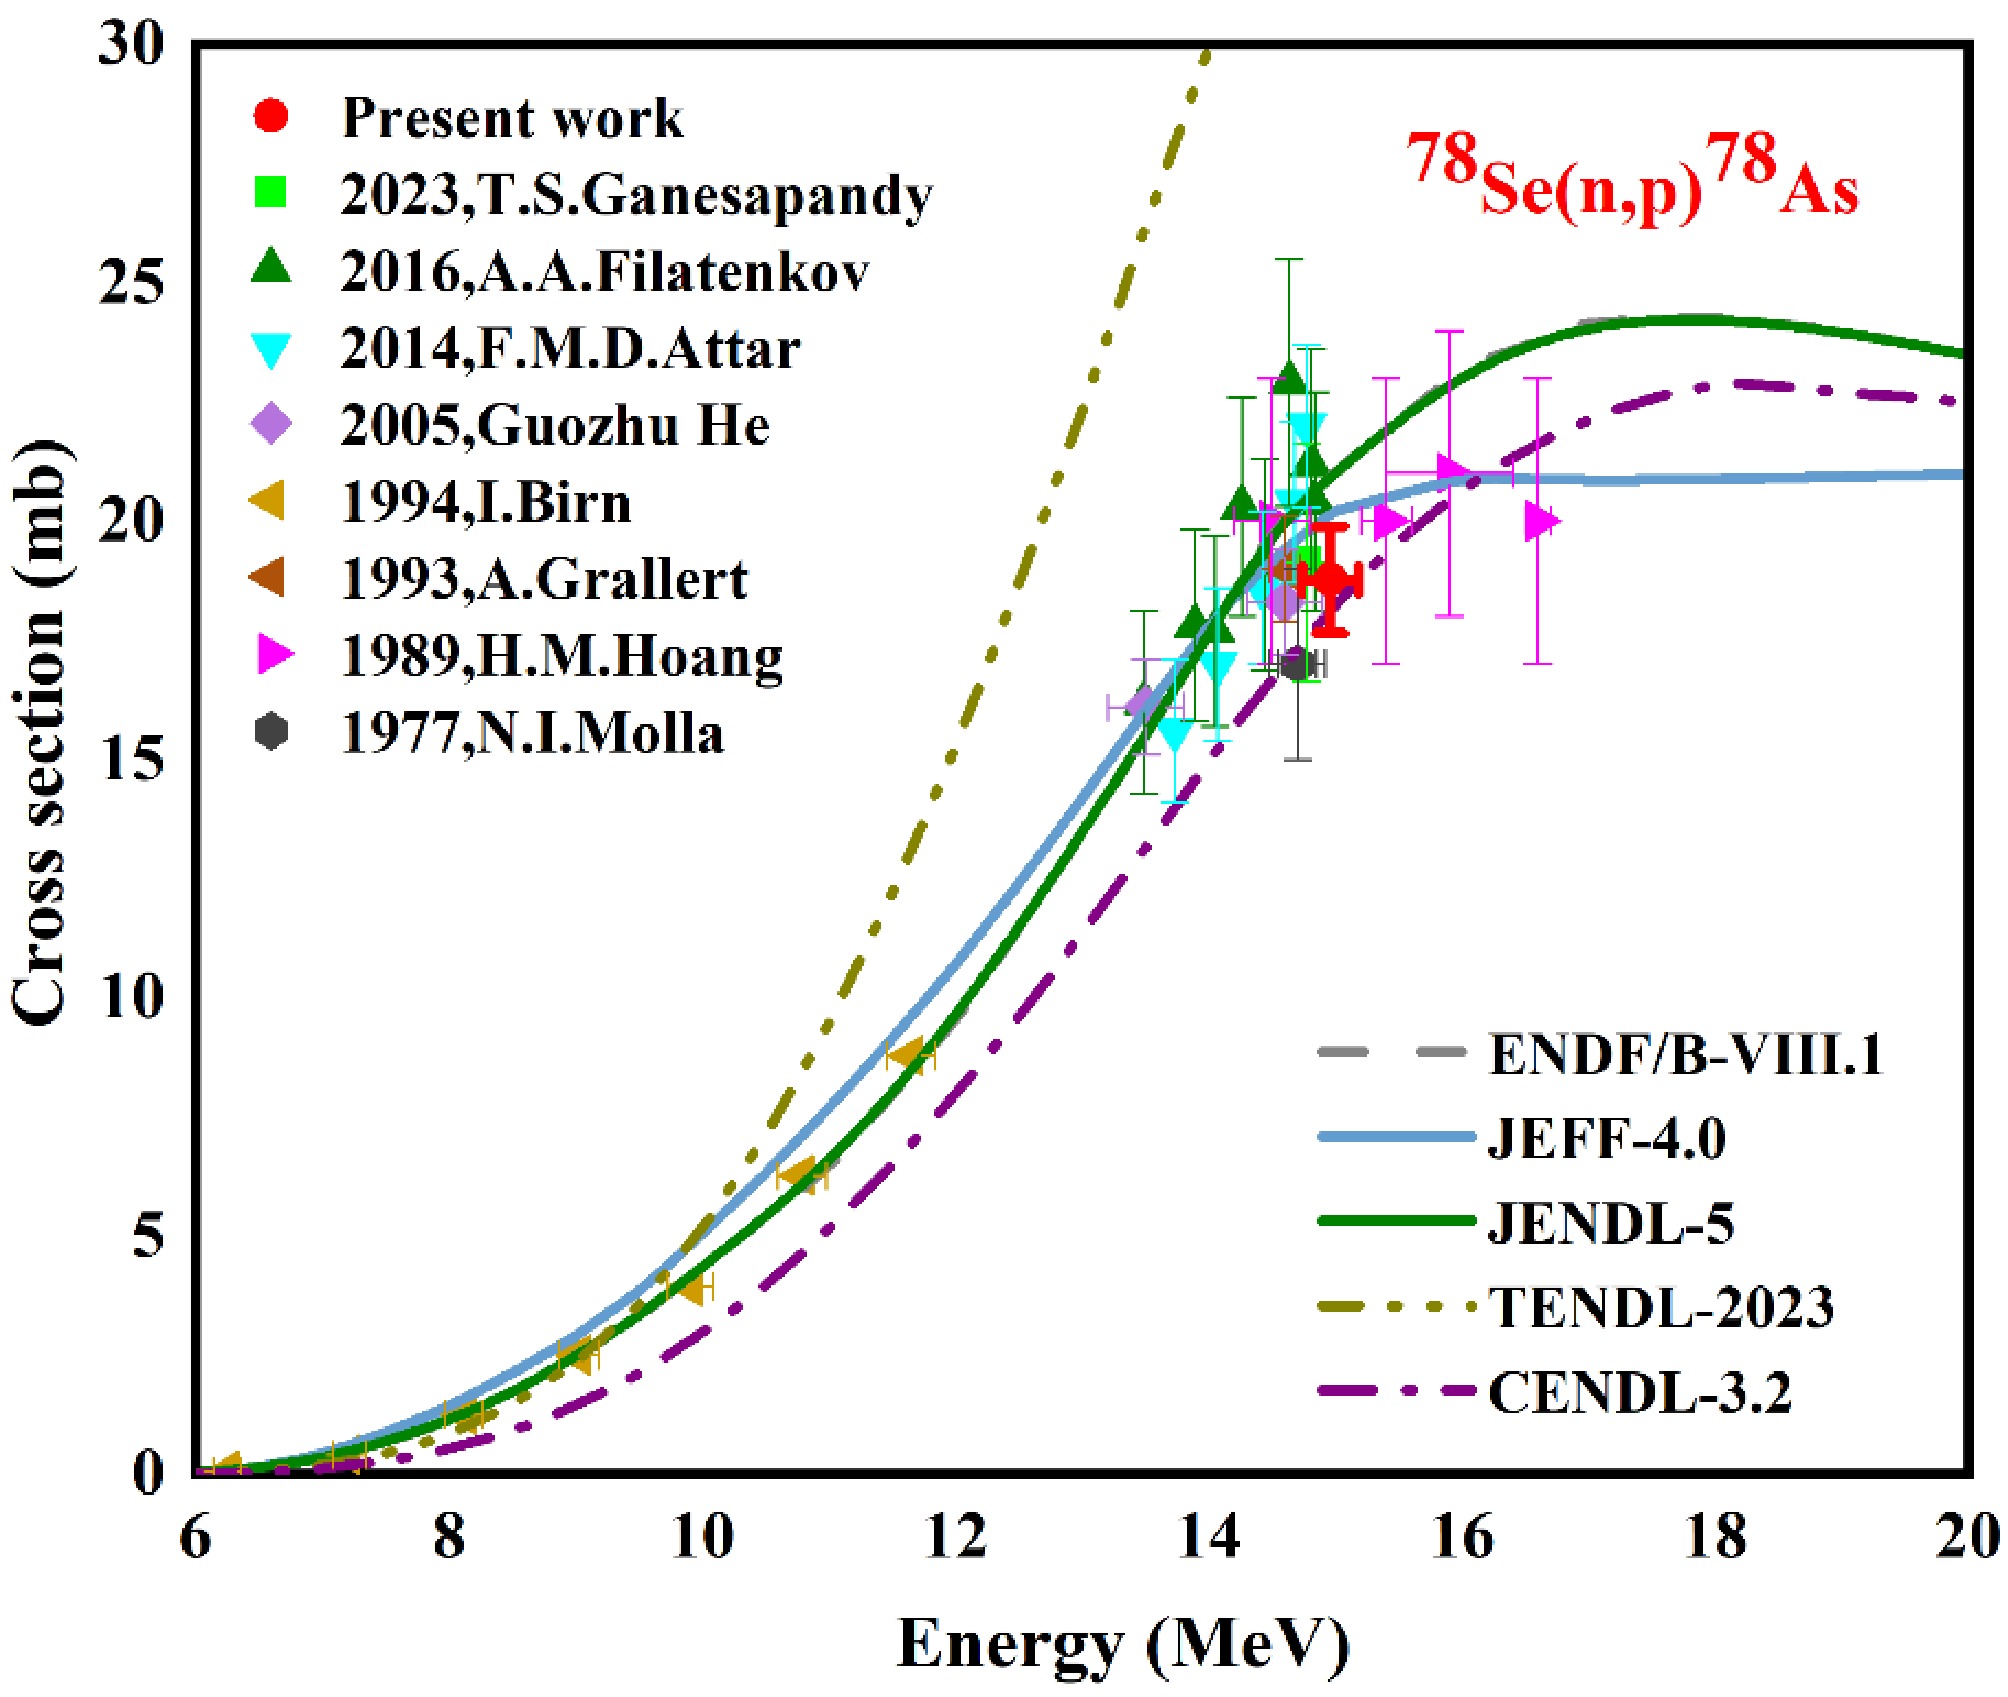
Figure 8. (color online) Comparison of the data of this study with the previously reported, ENDF/B-VIII.1, JEFF-4.0, JENDL-5, TENDL-2023, and CENDL-3.2 library cross section data for the 78Se(n, p)78As reaction.
-
The measured cross section of the 78Se(n, p)78As reaction leading to the residual nuclei of 78As is 18.77 ± 1.12 mb, associated with an uncertainty of 5.98 % at the neutron energy of 14.96 MeV. The measured cross section is consistent with the previously reported data. However, the cross section uncertainty (13.1 %) reported by T. S. Ganesapandy et al. [22] is significantly higher than the measured cross section uncertainty (5.98 %). The cross section reported by A. A. Filatenkov et al. is 21.2 ± 2.3 mb at the neutron energy of 14.81 MeV [23], surpassing the measured cross section value in this study by approximately 11.4 % (Fig. 8). Moreover, the measured cross section lies within the uncertainty range and shows deviations of 7.25 % and −3.46 % from the JEFF-4.0 [24] and CENDL-3.2 [25] evaluated nuclear data libraries, respectively (Table 8).
Figure 8. (color online) Comparison of the data of this study with the previously reported, ENDF/B-VIII.1, JEFF-4.0, JENDL-5, TENDL-2023, and CENDL-3.2 library cross section data for the 78Se(n, p)78As reaction.
-
The measured cross section of the 78Se(n, p)78As reaction leading to the residual nuclei of 78As is 18.77 ± 1.12 mb, associated with an uncertainty of 5.98 % at the neutron energy of 14.96 MeV. The measured cross section is consistent with the previously reported data. However, the cross section uncertainty (13.1 %) reported by T. S. Ganesapandy et al. [22] is significantly higher than the measured cross section uncertainty (5.98 %). The cross section reported by A. A. Filatenkov et al. is 21.2 ± 2.3 mb at the neutron energy of 14.81 MeV [23], surpassing the measured cross section value in this study by approximately 11.4 % (Fig. 8). Moreover, the measured cross section lies within the uncertainty range and shows deviations of 7.25 % and −3.46 % from the JEFF-4.0 [24] and CENDL-3.2 [25] evaluated nuclear data libraries, respectively (Table 8).
Figure 8. (color online) Comparison of the data of this study with the previously reported, ENDF/B-VIII.1, JEFF-4.0, JENDL-5, TENDL-2023, and CENDL-3.2 library cross section data for the 78Se(n, p)78As reaction.
-
The measured cross section of the 82Se(n, 2n)81Seg reaction is 529.78 ± 51.23 mb with a fractional uncertainty of 9.67 % (Fig. 9). The measured cross section is significantly higher than the previously reported data. A. A. Filatenkov et al. [23] reported the cross section at the neutron energy of 14.84 MeV, corresponding to the characteristics γ-ray energy of 290.0 keV with an uncertainty of 26.3 %. Moreover, the ground state cross section reported by Junhua Luo et al. [26] using the characteristic γ-ray energy of 275.93 keV was 22.9 % lower than the measured value. This difference is attributed to the subtraction of the contribution arising from the metastable state (81Sem) corresponding to 103.01 keV and 93Nb(n, 2n)92Nbm as the monitor reaction. Furthermore, the measured cross section is within the uncertainty range of the JEFF-4.0 library (Fig. 9).
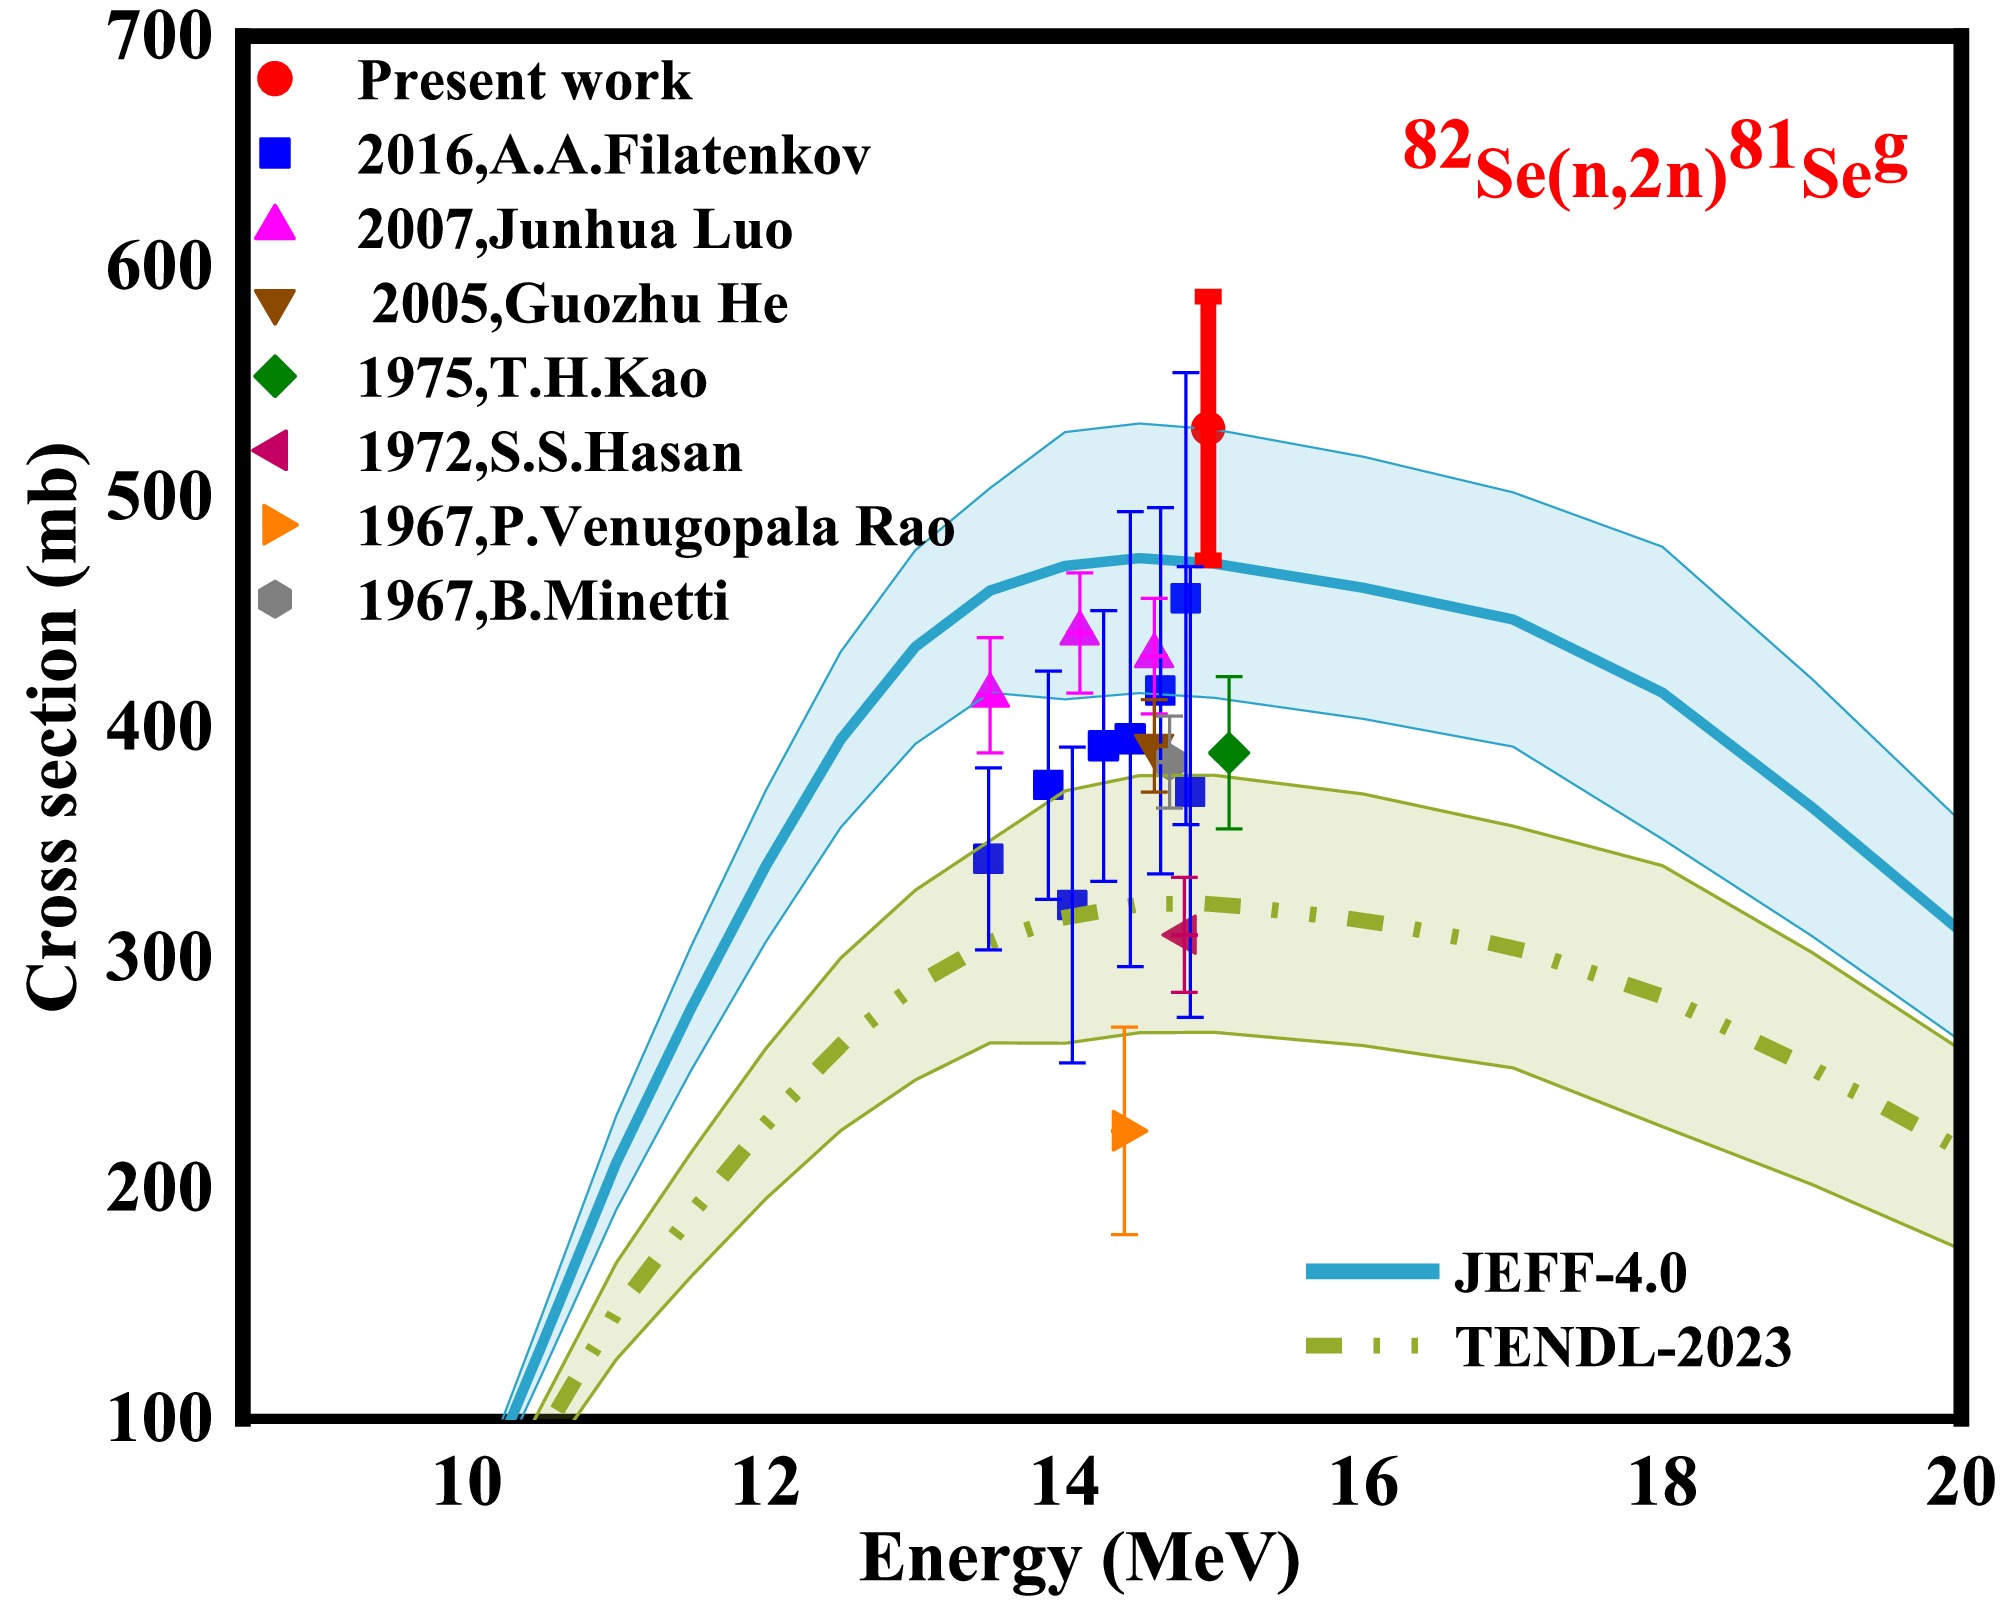
Figure 9. (color online) Comparison of the present, previous reported, JEFF-4.0, and TENDL-2023 library cross section data of the 82Se(n, 2n)81Seg reaction.
-
The measured cross section of the 82Se(n, 2n)81Seg reaction is 529.78 ± 51.23 mb with a fractional uncertainty of 9.67 % (Fig. 9). The measured cross section is significantly higher than the previously reported data. A. A. Filatenkov et al. [23] reported the cross section at the neutron energy of 14.84 MeV, corresponding to the characteristics γ-ray energy of 290.0 keV with an uncertainty of 26.3 %. Moreover, the ground state cross section reported by Junhua Luo et al. [26] using the characteristic γ-ray energy of 275.93 keV was 22.9 % lower than the measured value. This difference is attributed to the subtraction of the contribution arising from the metastable state (81Sem) corresponding to 103.01 keV and 93Nb(n, 2n)92Nbm as the monitor reaction. Furthermore, the measured cross section is within the uncertainty range of the JEFF-4.0 library (Fig. 9).
Figure 9. (color online) Comparison of the present, previous reported, JEFF-4.0, and TENDL-2023 library cross section data of the 82Se(n, 2n)81Seg reaction.
-
The measured cross section of the 82Se(n, 2n)81Seg reaction is 529.78 ± 51.23 mb with a fractional uncertainty of 9.67 % (Fig. 9). The measured cross section is significantly higher than the previously reported data. A. A. Filatenkov et al. [23] reported the cross section at the neutron energy of 14.84 MeV, corresponding to the characteristics γ-ray energy of 290.0 keV with an uncertainty of 26.3 %. Moreover, the ground state cross section reported by Junhua Luo et al. [26] using the characteristic γ-ray energy of 275.93 keV was 22.9 % lower than the measured value. This difference is attributed to the subtraction of the contribution arising from the metastable state (81Sem) corresponding to 103.01 keV and 93Nb(n, 2n)92Nbm as the monitor reaction. Furthermore, the measured cross section is within the uncertainty range of the JEFF-4.0 library (Fig. 9).
Figure 9. (color online) Comparison of the present, previous reported, JEFF-4.0, and TENDL-2023 library cross section data of the 82Se(n, 2n)81Seg reaction.
-
The measured cross section of the 76Se(n, 2n)75Se reaction leading to the residual nuclei 75Se is 903.98 ± 55.99 mb with an uncertainty of 6.19 % (Fig. 10). The measured cross section is consistent with the latest reported data of T. S. Ganesapandy et al. [22] at the neutron energy of 14.77 MeV. At the neutron energy of 15 MeV, the cross section reported by H. M. Hoang et al. [27] exhibits a slightly higher uncertainty than that of the measured cross section. Moreover, the measured cross section is slightly above the excitation curve of the TENDL-2023 evaluated data library [28]. Furthermore, the measured cross section shows better agreement with the CENDL-3.2 nuclear data library, as depicted in Fig. 10.
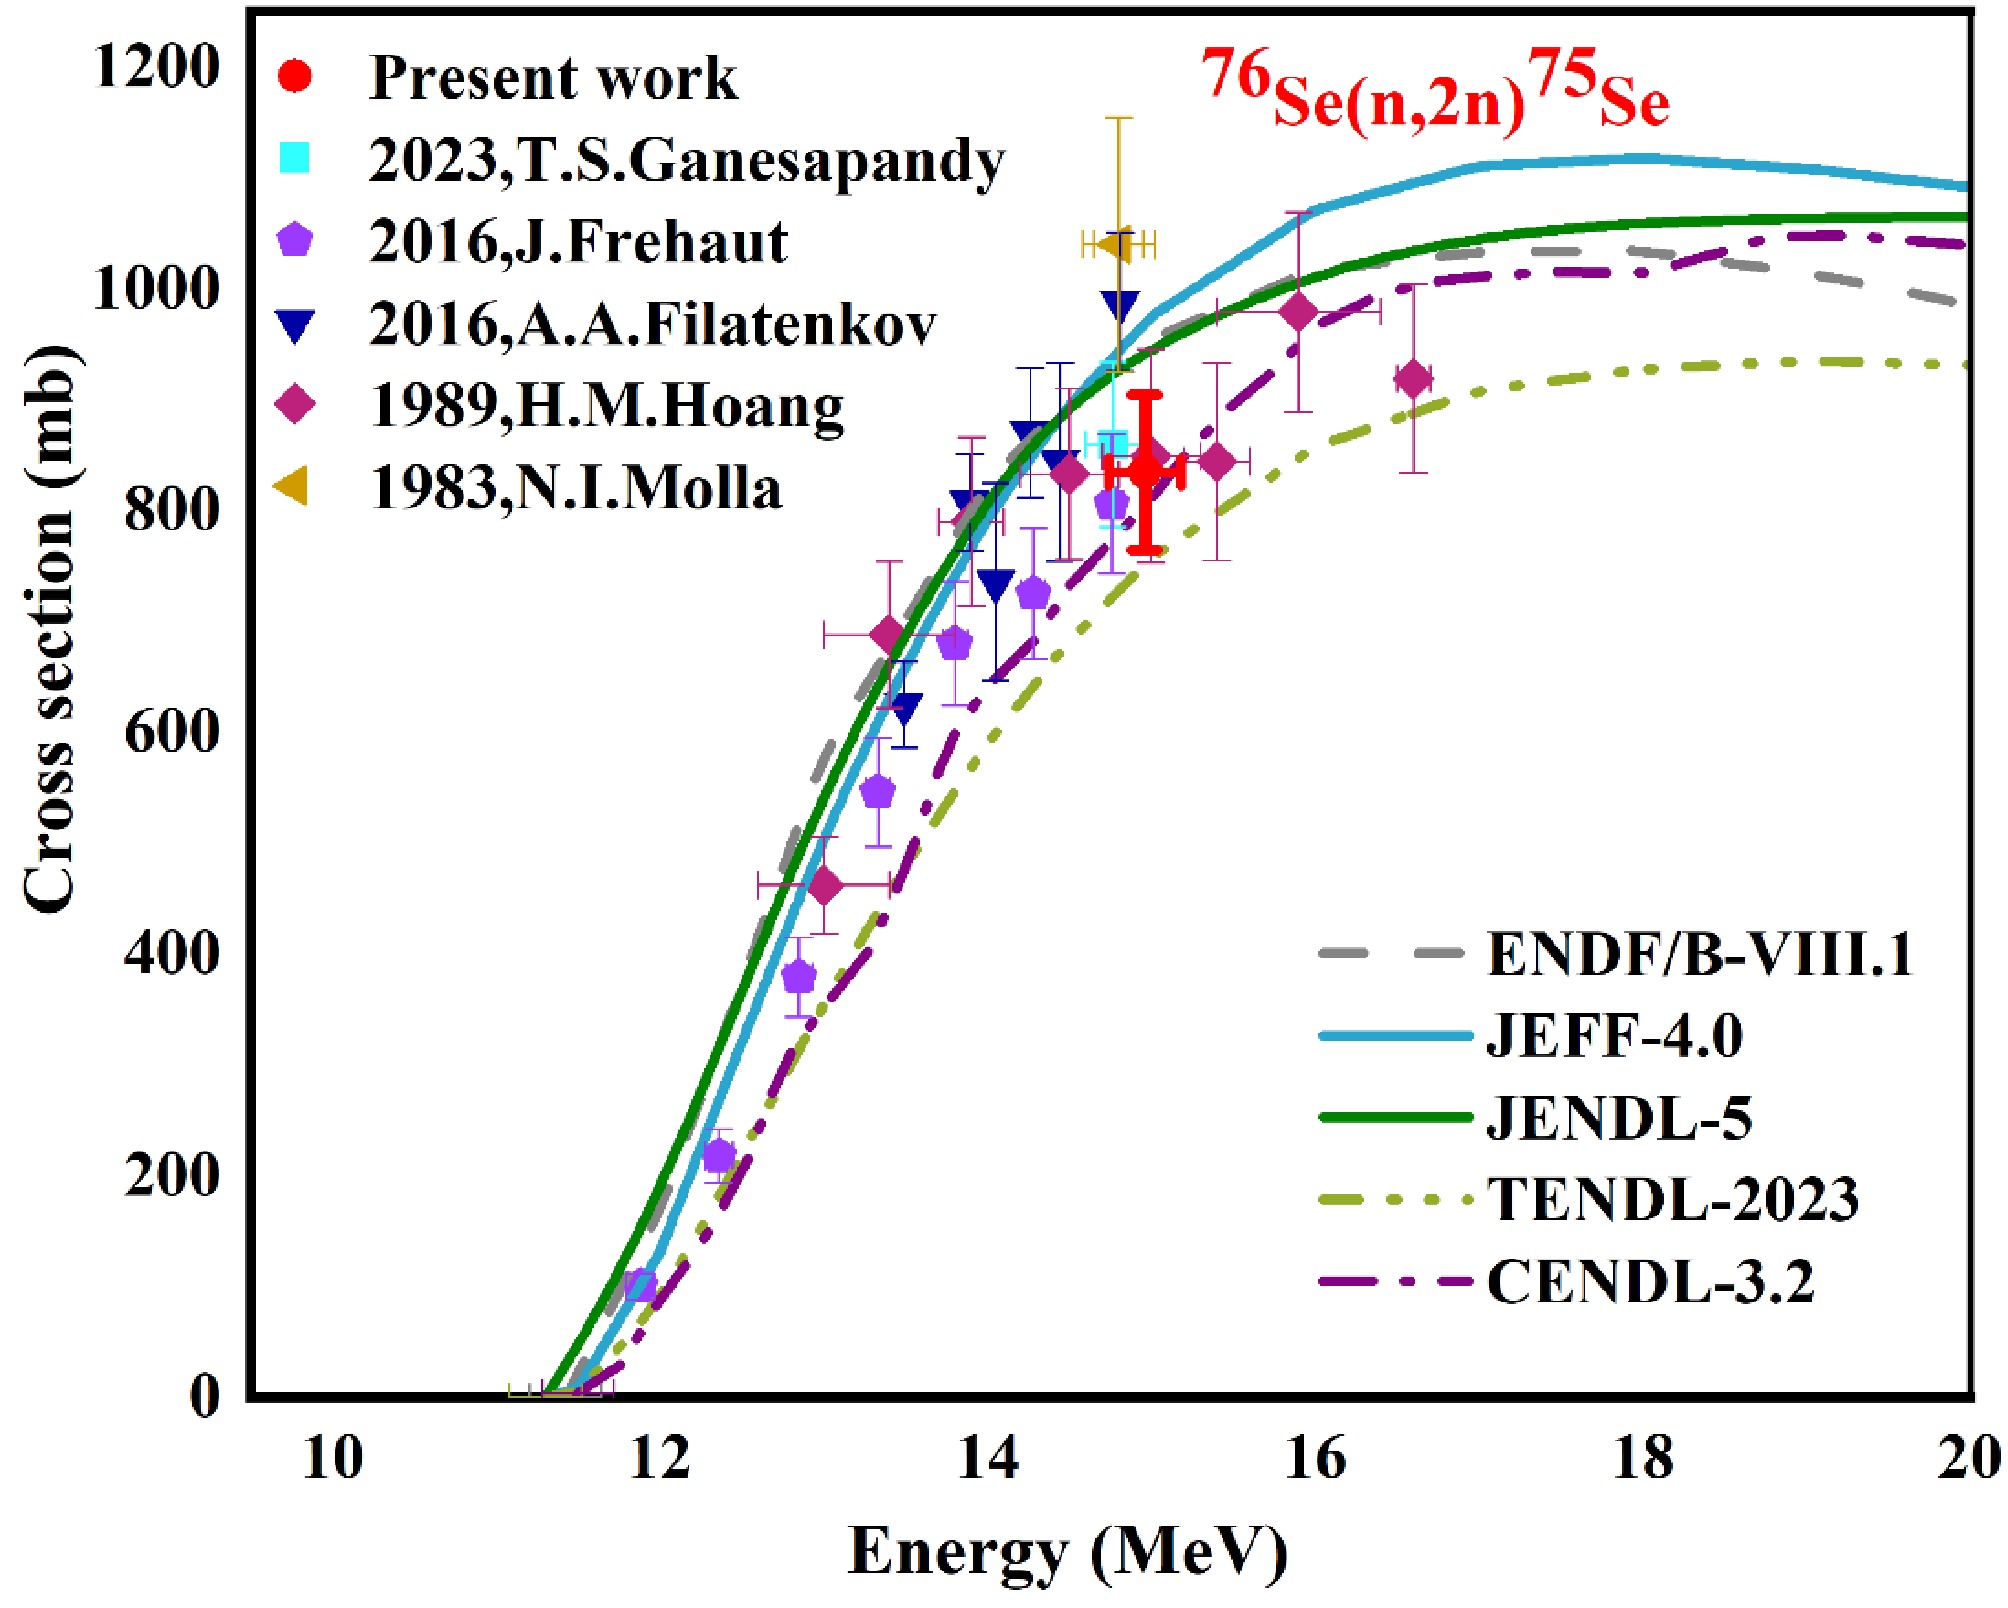
Figure 10. (color online) Comparison of the data of this study with the previously reported data and ENDF/B-VIII.1, JEFF-4.0, JENDL-5, TENDL-2023, and CENDL-3.2 library cross section data for the 76Se(n, 2n)75Se reaction.
-
The measured cross section of the 76Se(n, 2n)75Se reaction leading to the residual nuclei 75Se is 903.98 ± 55.99 mb with an uncertainty of 6.19 % (Fig. 10). The measured cross section is consistent with the latest reported data of T. S. Ganesapandy et al. [22] at the neutron energy of 14.77 MeV. At the neutron energy of 15 MeV, the cross section reported by H. M. Hoang et al. [27] exhibits a slightly higher uncertainty than that of the measured cross section. Moreover, the measured cross section is slightly above the excitation curve of the TENDL-2023 evaluated data library [28]. Furthermore, the measured cross section shows better agreement with the CENDL-3.2 nuclear data library, as depicted in Fig. 10.
Figure 10. (color online) Comparison of the data of this study with the previously reported data and ENDF/B-VIII.1, JEFF-4.0, JENDL-5, TENDL-2023, and CENDL-3.2 library cross section data for the 76Se(n, 2n)75Se reaction.
-
The measured cross section of the 76Se(n, 2n)75Se reaction leading to the residual nuclei 75Se is 903.98 ± 55.99 mb with an uncertainty of 6.19 % (Fig. 10). The measured cross section is consistent with the latest reported data of T. S. Ganesapandy et al. [22] at the neutron energy of 14.77 MeV. At the neutron energy of 15 MeV, the cross section reported by H. M. Hoang et al. [27] exhibits a slightly higher uncertainty than that of the measured cross section. Moreover, the measured cross section is slightly above the excitation curve of the TENDL-2023 evaluated data library [28]. Furthermore, the measured cross section shows better agreement with the CENDL-3.2 nuclear data library, as depicted in Fig. 10.
Figure 10. (color online) Comparison of the data of this study with the previously reported data and ENDF/B-VIII.1, JEFF-4.0, JENDL-5, TENDL-2023, and CENDL-3.2 library cross section data for the 76Se(n, 2n)75Se reaction.
-
The measured cross section of the 80 Se(n, α)77Ge reaction is 2.01 ± 0.12 mb with an uncertainty of 5.96 % (Fig. 11). Experimental studies have not been conducted for over two decades within the neutron energy region of 14.9 MeV. Therefore, the measurement in this study was compared with the neighboring neutron energies. In the EXFOR data, a large discrepancy was found in the reaction cross section uncertainty, which varied from 8% to 34%. At the neutron energy of 15 MeV, the cross section reported by Guozhu He et al. [29] was estimated using the 56Fe(n, p)56Mn monitor reaction with an uncertainty of 14.3 %. Furthermore, the measured cross section is consistent with the JENDL-5 library (2.25 mb) [30].
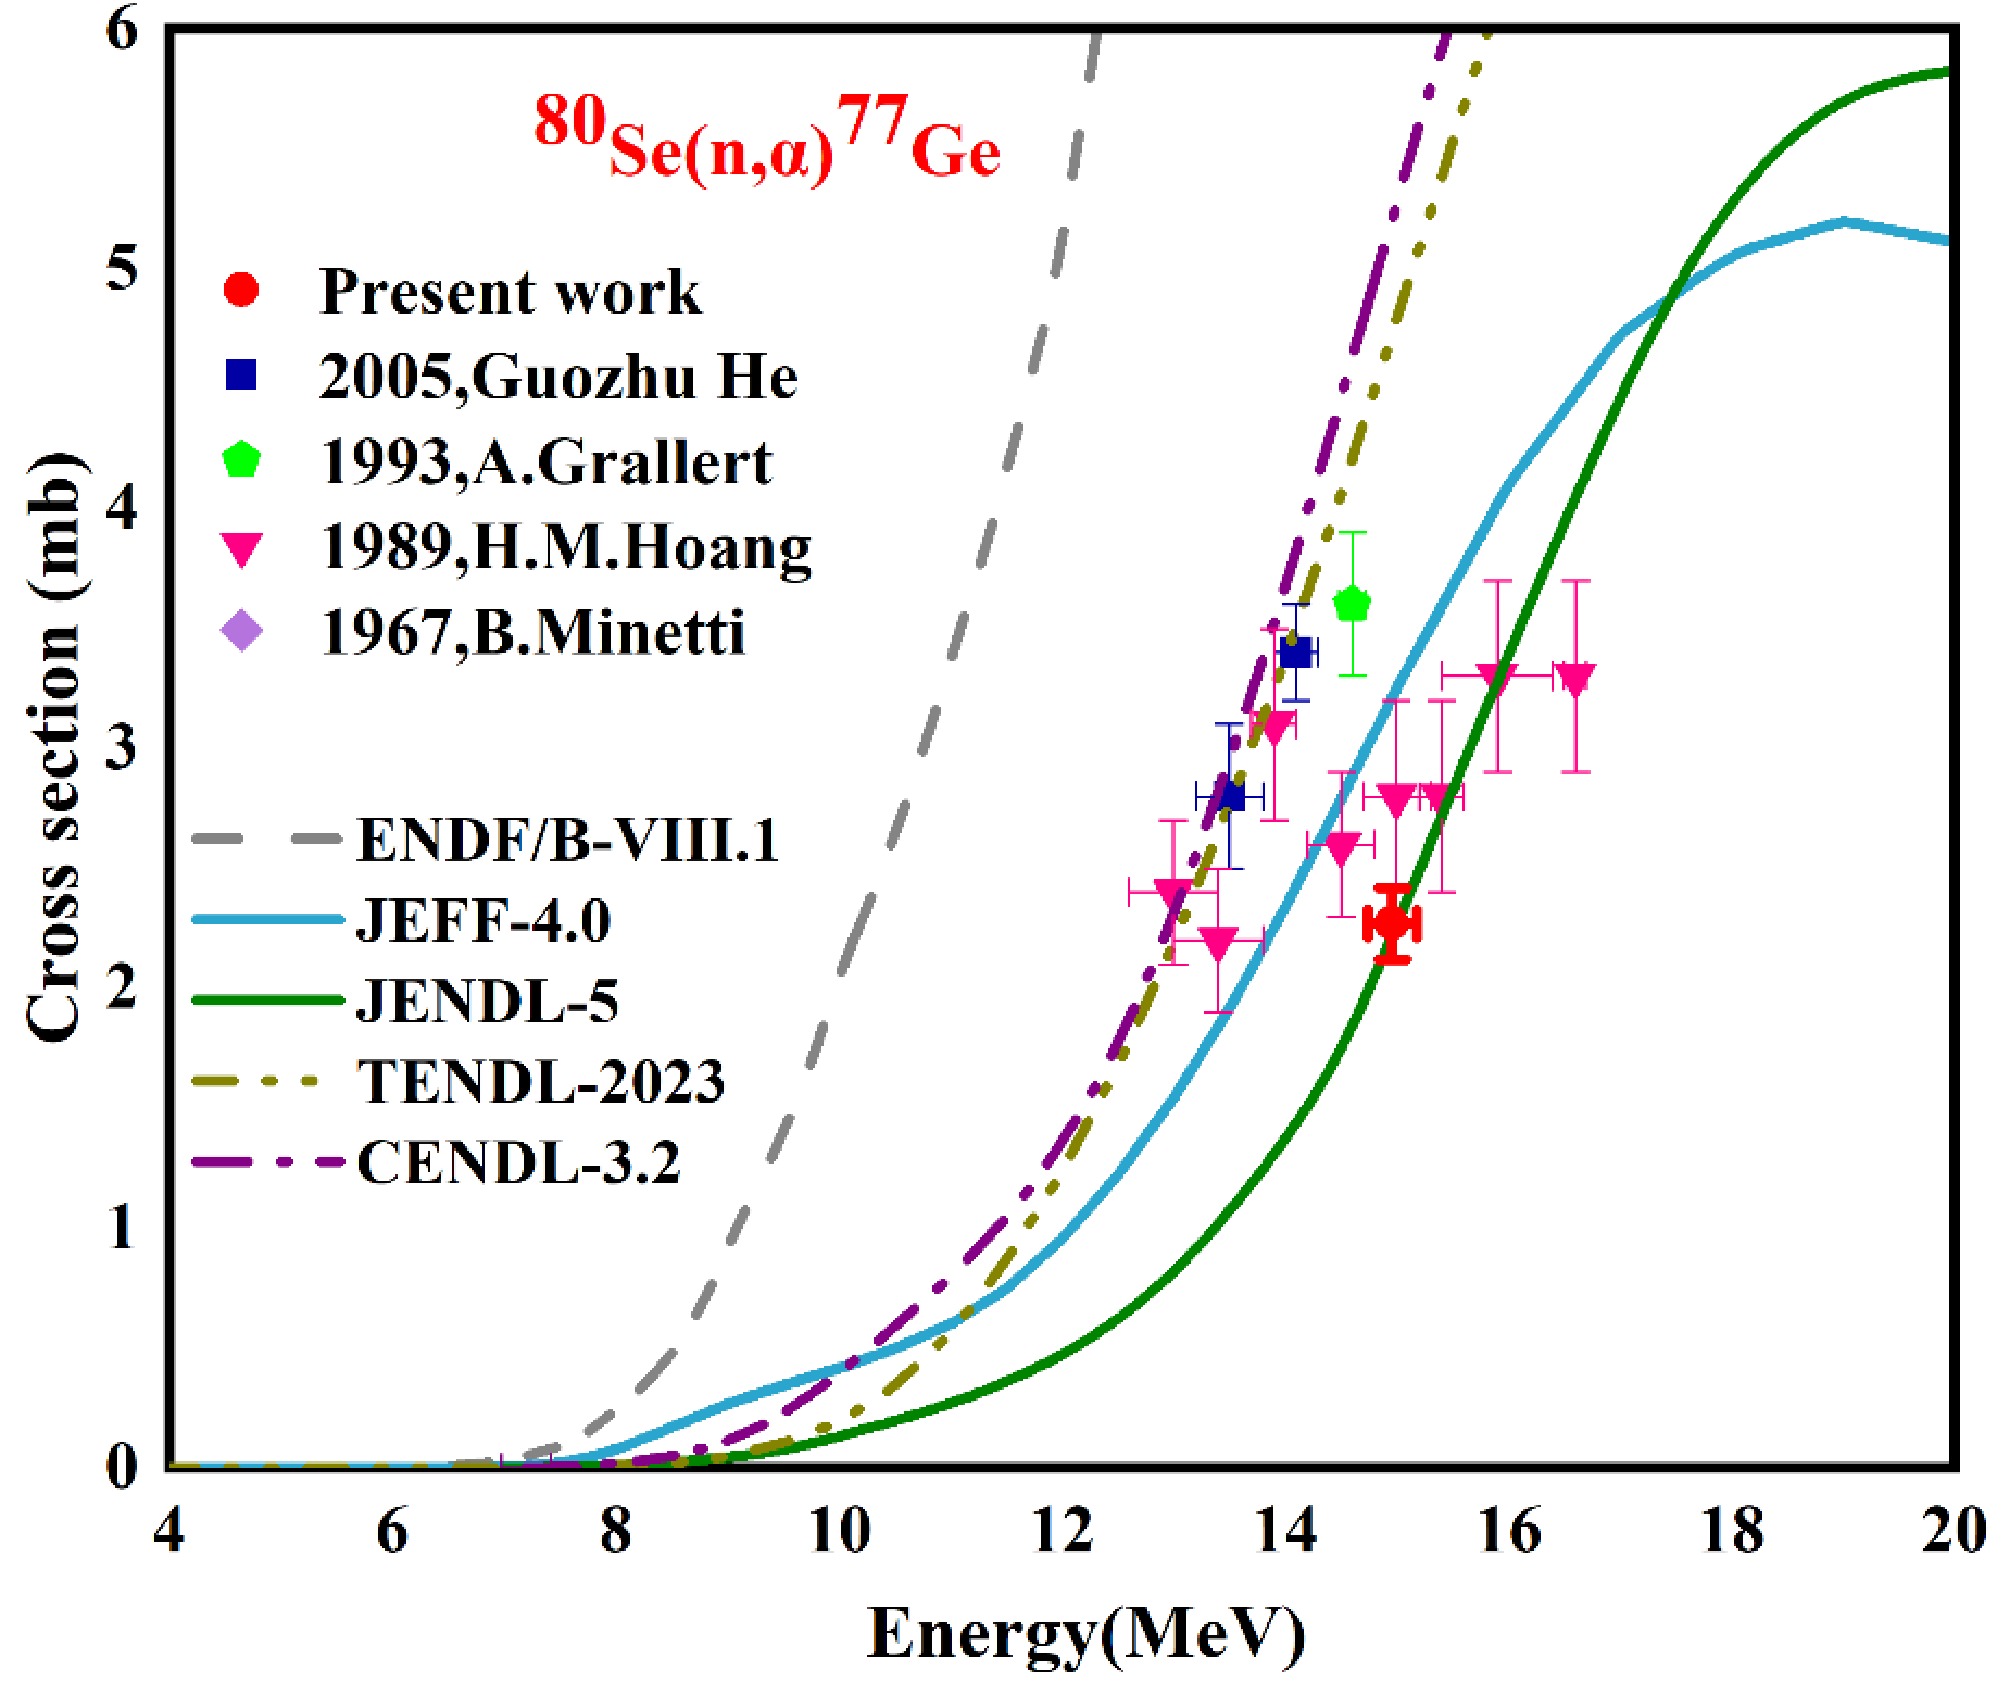
Figure 11. (color online) Comparison of the data of this study with the previously reported data and ENDF/B-VIII.1, JEFF-4.0, JENDL-5, TENDL-2023, and CENDL-3.2 library cross section data for the 80Se(n, α)77Ge reaction.
-
The measured cross section of the 80 Se(n, α)77Ge reaction is 2.01 ± 0.12 mb with an uncertainty of 5.96 % (Fig. 11). Experimental studies have not been conducted for over two decades within the neutron energy region of 14.9 MeV. Therefore, the measurement in this study was compared with the neighboring neutron energies. In the EXFOR data, a large discrepancy was found in the reaction cross section uncertainty, which varied from 8% to 34%. At the neutron energy of 15 MeV, the cross section reported by Guozhu He et al. [29] was estimated using the 56Fe(n, p)56Mn monitor reaction with an uncertainty of 14.3 %. Furthermore, the measured cross section is consistent with the JENDL-5 library (2.25 mb) [30].
Figure 11. (color online) Comparison of the data of this study with the previously reported data and ENDF/B-VIII.1, JEFF-4.0, JENDL-5, TENDL-2023, and CENDL-3.2 library cross section data for the 80Se(n, α)77Ge reaction.
-
The measured cross section of the 80 Se(n, α)77Ge reaction is 2.01 ± 0.12 mb with an uncertainty of 5.96 % (Fig. 11). Experimental studies have not been conducted for over two decades within the neutron energy region of 14.9 MeV. Therefore, the measurement in this study was compared with the neighboring neutron energies. In the EXFOR data, a large discrepancy was found in the reaction cross section uncertainty, which varied from 8% to 34%. At the neutron energy of 15 MeV, the cross section reported by Guozhu He et al. [29] was estimated using the 56Fe(n, p)56Mn monitor reaction with an uncertainty of 14.3 %. Furthermore, the measured cross section is consistent with the JENDL-5 library (2.25 mb) [30].
Figure 11. (color online) Comparison of the data of this study with the previously reported data and ENDF/B-VIII.1, JEFF-4.0, JENDL-5, TENDL-2023, and CENDL-3.2 library cross section data for the 80Se(n, α)77Ge reaction.
-
A comprehensive theoretical analysis was performed to reproduce the cross section using the TALYS-2.0 code by employing different nuclear level density (NLD) models (Table 9) and a combination of other relevant parameters. For a quantitative evaluation of the measured and theoretically reproduced cross sections using various level density models (ldmodel) and adjusted parameters, the chi-square (
$ {\chi }^{2}) $ was calculated using Eq. (19) by J. Luo et al. for each reaction, as shown in (Tables 10, 11) [31].Reaction Level density models ldmodel 1 ldmodel 2 ldmodel 3 ldmodel 4 ldmodel 5 ldmodel 6 76Se(n, p)76As 38.00 52.21 53.90 52.57 41.85 44.63 78Se(n, p)78As 26.36 24.10 26.88 35.71 21.70 22.48 82Se(n, 2n)81Seg 515.49 473.24 447.48 457.55 488.96 467.27 76Se(n, 2n)75Se 971.89 854.55 763.79 855.55 946.51 626.46 80Se(n, α)77Ge 0.96 3.15 1.32 1.47 1.99 1.32 Table 9. Cross sections (mb) of the reactions using different level density models of TALYS 2.0.
Reaction $ {\chi }^{2} $ (k = 2, confidence level = 95 %)ldmodel 1 ldmodel 2 ldmodel 3 ldmodel 4 ldmodel 5 ldmodel 6 76Se(n, p)76As 3.37 0.71 0.65 0.69 2.25 1.63 78Se(n, p)78As 5.32 2.64 6.08 26.82 0.86 1.31 82Se(n, 2n)81Seg 6.30 3.22 1.94 2.39 4.22 2.88 76Se(n, 2n)75Se 0.53 0.35 1.15 0.35 0.37 3.91 80Se(n, α)77Ge 9.05 4.77 5.48 4.33 1.84 5.48 Table 10. Chi square (
$ {\chi }^{2} $ ) for the calculated cross section using level density models of the studied reactions.Reaction Adjusted parameters Theoretical calculated cross section *σ/mb level density model optical potential model pre-equilibrium model γ ray SFM WFM *σ/mb $ {\chi }^{2} $ Direct/mb pre-equilibrium/mb Compound nucleus/mb 76Se(n, p)76As ldmodel 2 jlmomp preeqmode 3 strength 9 widthmode 1 54.23 0.65 0.00 12.94 41.29 78Se(n, p)78As ldmodel 2 dispersion preeqmode 3 strength 9 widthmode 1 17.27 0.47 0.86 4.53 13.61 82Se(n, 2n)81Seg ldmodel 1 localomp y preeqmode 3 strength 1 widthmode 1 537.22 8.36 0.00 0.00 537.22 76Se(n, 2n)75Se ldmodel 2 localomp y preeqmode 3 strength 2 widthmode 1 926.30 0.30 0.00 0.00 926.30 80Se(n, α)77Ge ldmodel 5 localomp y preeqmode 1 strength 9 widthmode 1 1.97 4.45 0.13 0.66 1.43 *σ (mb) = cross section (mb). Table 11. Total cross section (σ) and contributions of the reaction mechanism using the adjusted parameters of TALYS 2.0 code.
$ {\chi }^{2}=\frac{\displaystyle\sum\limits_{i=1}^{N}[(\sigma _{i}^{{\mathrm{Cal}}}-\sigma _{i}^{{\mathrm{exp}}})/(k\Delta \sigma _{i}^{{\mathrm{exp}}}){]}^{2}}{N}, $
(19) where
$ \sigma _{i}^{\rm Cal} $ denotes the theoretical calculated cross section,$ \sigma _{i}^{\rm exp} $ is the experimentally measured cross section,$ \Delta \sigma _{i}^{\rm exp} $ is the error (uncertainty) in the experimentally measured cross section, k is the coverage factor (k = 2), and N is the number of experimental data including those measured in this study and those in the EXFOR database. N takes the values 8, 7, 7, 6, and 5 for the 76Se(n, p)76As, 78Se(n, p)78As, 82Se(n, 2n)81Seg, 76Se(n, 2n)75Se, and 80Se(n, α)77Ge reactions, respectively.In this study, the cross sections of the 76Se(n, p)76As, 78Se(n, p)78As, 82Se(n, 2n)81Seg, 76Se(n, 2n)75Se, and 80Se(n, α)77Ge reactions were additionally reproduced with a set of adjusted parameters, as shown in Table 11 [32−34]. Furthermore, the contributions of various reaction mechanisms, namely, compound nucleus, pre-equilibrium, and direct, to the total cross section of the aforementioned reactions were examined (Table 11).
-
A comprehensive theoretical analysis was performed to reproduce the cross section using the TALYS-2.0 code by employing different nuclear level density (NLD) models (Table 9) and a combination of other relevant parameters. For a quantitative evaluation of the measured and theoretically reproduced cross sections using various level density models (ldmodel) and adjusted parameters, the chi-square (
$ {\chi }^{2}) $ was calculated using Eq. (19) by J. Luo et al. for each reaction, as shown in (Tables 10, 11) [31].Reaction Level density models ldmodel 1 ldmodel 2 ldmodel 3 ldmodel 4 ldmodel 5 ldmodel 6 76Se(n, p)76As 38.00 52.21 53.90 52.57 41.85 44.63 78Se(n, p)78As 26.36 24.10 26.88 35.71 21.70 22.48 82Se(n, 2n)81Seg 515.49 473.24 447.48 457.55 488.96 467.27 76Se(n, 2n)75Se 971.89 854.55 763.79 855.55 946.51 626.46 80Se(n, α)77Ge 0.96 3.15 1.32 1.47 1.99 1.32 Table 9. Cross sections (mb) of the reactions using different level density models of TALYS 2.0.
Reaction $ {\chi }^{2} $ (k = 2, confidence level = 95 %)ldmodel 1 ldmodel 2 ldmodel 3 ldmodel 4 ldmodel 5 ldmodel 6 76Se(n, p)76As 3.37 0.71 0.65 0.69 2.25 1.63 78Se(n, p)78As 5.32 2.64 6.08 26.82 0.86 1.31 82Se(n, 2n)81Seg 6.30 3.22 1.94 2.39 4.22 2.88 76Se(n, 2n)75Se 0.53 0.35 1.15 0.35 0.37 3.91 80Se(n, α)77Ge 9.05 4.77 5.48 4.33 1.84 5.48 Table 10. Chi square (
$ {\chi }^{2} $ ) for the calculated cross section using level density models of the studied reactions.Reaction Adjusted parameters Theoretical calculated cross section *σ/mb level density model optical potential model pre-equilibrium model γ ray SFM WFM *σ/mb $ {\chi }^{2} $ Direct/mb pre-equilibrium/mb Compound nucleus/mb 76Se(n, p)76As ldmodel 2 jlmomp preeqmode 3 strength 9 widthmode 1 54.23 0.65 0.00 12.94 41.29 78Se(n, p)78As ldmodel 2 dispersion preeqmode 3 strength 9 widthmode 1 17.27 0.47 0.86 4.53 13.61 82Se(n, 2n)81Seg ldmodel 1 localomp y preeqmode 3 strength 1 widthmode 1 537.22 8.36 0.00 0.00 537.22 76Se(n, 2n)75Se ldmodel 2 localomp y preeqmode 3 strength 2 widthmode 1 926.30 0.30 0.00 0.00 926.30 80Se(n, α)77Ge ldmodel 5 localomp y preeqmode 1 strength 9 widthmode 1 1.97 4.45 0.13 0.66 1.43 *σ (mb) = cross section (mb). Table 11. Total cross section (σ) and contributions of the reaction mechanism using the adjusted parameters of TALYS 2.0 code.
$ {\chi }^{2}=\frac{\displaystyle\sum\limits_{i=1}^{N}[(\sigma _{i}^{{\mathrm{Cal}}}-\sigma _{i}^{{\mathrm{exp}}})/(k\Delta \sigma _{i}^{{\mathrm{exp}}}){]}^{2}}{N}, $
(19) where
$ \sigma _{i}^{\rm Cal} $ denotes the theoretical calculated cross section,$ \sigma _{i}^{\rm exp} $ is the experimentally measured cross section,$ \Delta \sigma _{i}^{\rm exp} $ is the error (uncertainty) in the experimentally measured cross section, k is the coverage factor (k = 2), and N is the number of experimental data including those measured in this study and those in the EXFOR database. N takes the values 8, 7, 7, 6, and 5 for the 76Se(n, p)76As, 78Se(n, p)78As, 82Se(n, 2n)81Seg, 76Se(n, 2n)75Se, and 80Se(n, α)77Ge reactions, respectively.In this study, the cross sections of the 76Se(n, p)76As, 78Se(n, p)78As, 82Se(n, 2n)81Seg, 76Se(n, 2n)75Se, and 80Se(n, α)77Ge reactions were additionally reproduced with a set of adjusted parameters, as shown in Table 11 [32−34]. Furthermore, the contributions of various reaction mechanisms, namely, compound nucleus, pre-equilibrium, and direct, to the total cross section of the aforementioned reactions were examined (Table 11).
-
A comprehensive theoretical analysis was performed to reproduce the cross section using the TALYS-2.0 code by employing different nuclear level density (NLD) models (Table 9) and a combination of other relevant parameters. For a quantitative evaluation of the measured and theoretically reproduced cross sections using various level density models (ldmodel) and adjusted parameters, the chi-square (
$ {\chi }^{2}) $ was calculated using Eq. (19) by J. Luo et al. for each reaction, as shown in (Tables 10, 11) [31].Reaction Level density models ldmodel 1 ldmodel 2 ldmodel 3 ldmodel 4 ldmodel 5 ldmodel 6 76Se(n, p)76As 38.00 52.21 53.90 52.57 41.85 44.63 78Se(n, p)78As 26.36 24.10 26.88 35.71 21.70 22.48 82Se(n, 2n)81Seg 515.49 473.24 447.48 457.55 488.96 467.27 76Se(n, 2n)75Se 971.89 854.55 763.79 855.55 946.51 626.46 80Se(n, α)77Ge 0.96 3.15 1.32 1.47 1.99 1.32 Table 9. Cross sections (mb) of the reactions using different level density models of TALYS 2.0.
Reaction $ {\chi }^{2} $ (k = 2, confidence level = 95 %)ldmodel 1 ldmodel 2 ldmodel 3 ldmodel 4 ldmodel 5 ldmodel 6 76Se(n, p)76As 3.37 0.71 0.65 0.69 2.25 1.63 78Se(n, p)78As 5.32 2.64 6.08 26.82 0.86 1.31 82Se(n, 2n)81Seg 6.30 3.22 1.94 2.39 4.22 2.88 76Se(n, 2n)75Se 0.53 0.35 1.15 0.35 0.37 3.91 80Se(n, α)77Ge 9.05 4.77 5.48 4.33 1.84 5.48 Table 10. Chi square (
$ {\chi }^{2} $ ) for the calculated cross section using level density models of the studied reactions.Reaction Adjusted parameters Theoretical calculated cross section *σ/mb level density model optical potential model pre-equilibrium model γ ray SFM WFM *σ/mb $ {\chi }^{2} $ Direct/mb pre-equilibrium/mb Compound nucleus/mb 76Se(n, p)76As ldmodel 2 jlmomp preeqmode 3 strength 9 widthmode 1 54.23 0.65 0.00 12.94 41.29 78Se(n, p)78As ldmodel 2 dispersion preeqmode 3 strength 9 widthmode 1 17.27 0.47 0.86 4.53 13.61 82Se(n, 2n)81Seg ldmodel 1 localomp y preeqmode 3 strength 1 widthmode 1 537.22 8.36 0.00 0.00 537.22 76Se(n, 2n)75Se ldmodel 2 localomp y preeqmode 3 strength 2 widthmode 1 926.30 0.30 0.00 0.00 926.30 80Se(n, α)77Ge ldmodel 5 localomp y preeqmode 1 strength 9 widthmode 1 1.97 4.45 0.13 0.66 1.43 *σ (mb) = cross section (mb). Table 11. Total cross section (σ) and contributions of the reaction mechanism using the adjusted parameters of TALYS 2.0 code.
$ {\chi }^{2}=\frac{\displaystyle\sum\limits_{i=1}^{N}[(\sigma _{i}^{{\mathrm{Cal}}}-\sigma _{i}^{{\mathrm{exp}}})/(k\Delta \sigma _{i}^{{\mathrm{exp}}}){]}^{2}}{N}, $
(19) where
$ \sigma _{i}^{\rm Cal} $ denotes the theoretical calculated cross section,$ \sigma _{i}^{\rm exp} $ is the experimentally measured cross section,$ \Delta \sigma _{i}^{\rm exp} $ is the error (uncertainty) in the experimentally measured cross section, k is the coverage factor (k = 2), and N is the number of experimental data including those measured in this study and those in the EXFOR database. N takes the values 8, 7, 7, 6, and 5 for the 76Se(n, p)76As, 78Se(n, p)78As, 82Se(n, 2n)81Seg, 76Se(n, 2n)75Se, and 80Se(n, α)77Ge reactions, respectively.In this study, the cross sections of the 76Se(n, p)76As, 78Se(n, p)78As, 82Se(n, 2n)81Seg, 76Se(n, 2n)75Se, and 80Se(n, α)77Ge reactions were additionally reproduced with a set of adjusted parameters, as shown in Table 11 [32−34]. Furthermore, the contributions of various reaction mechanisms, namely, compound nucleus, pre-equilibrium, and direct, to the total cross section of the aforementioned reactions were examined (Table 11).
-
The measured cross sections of the 76Se(n, p)76As, and 78Se(n, p)78As, 82Se(n, 2n)81Seg, 76Se(n, 2n)75Se, and 80Se(n, α)77Ge reactions were compared with those of all six nuclear level density models of TALYS code. For the 76Se(n, p)76As reaction, the cross section reproduced through ldmodel 3 (Generalized Superfluid model) [35−38] with the default optical model, pre-equilibrium, width fluctuation correction model, and γ strength function model [39] shows better agreement with the measured cross section, as depicted in Fig. 12 (a). Moreover, the measured cross section (55.30 mb) exceeds the value calculated using ldmodel 3 (53.90 mb) by approximately 2.5 %. Furthermore, the cross sections estimated with ldmodel 2 (Back-Shifted Fermi Gas model) [40] and ldmodel 4 (S. Goriely microscopic model) [41] lie in the error bar of the measured cross section.
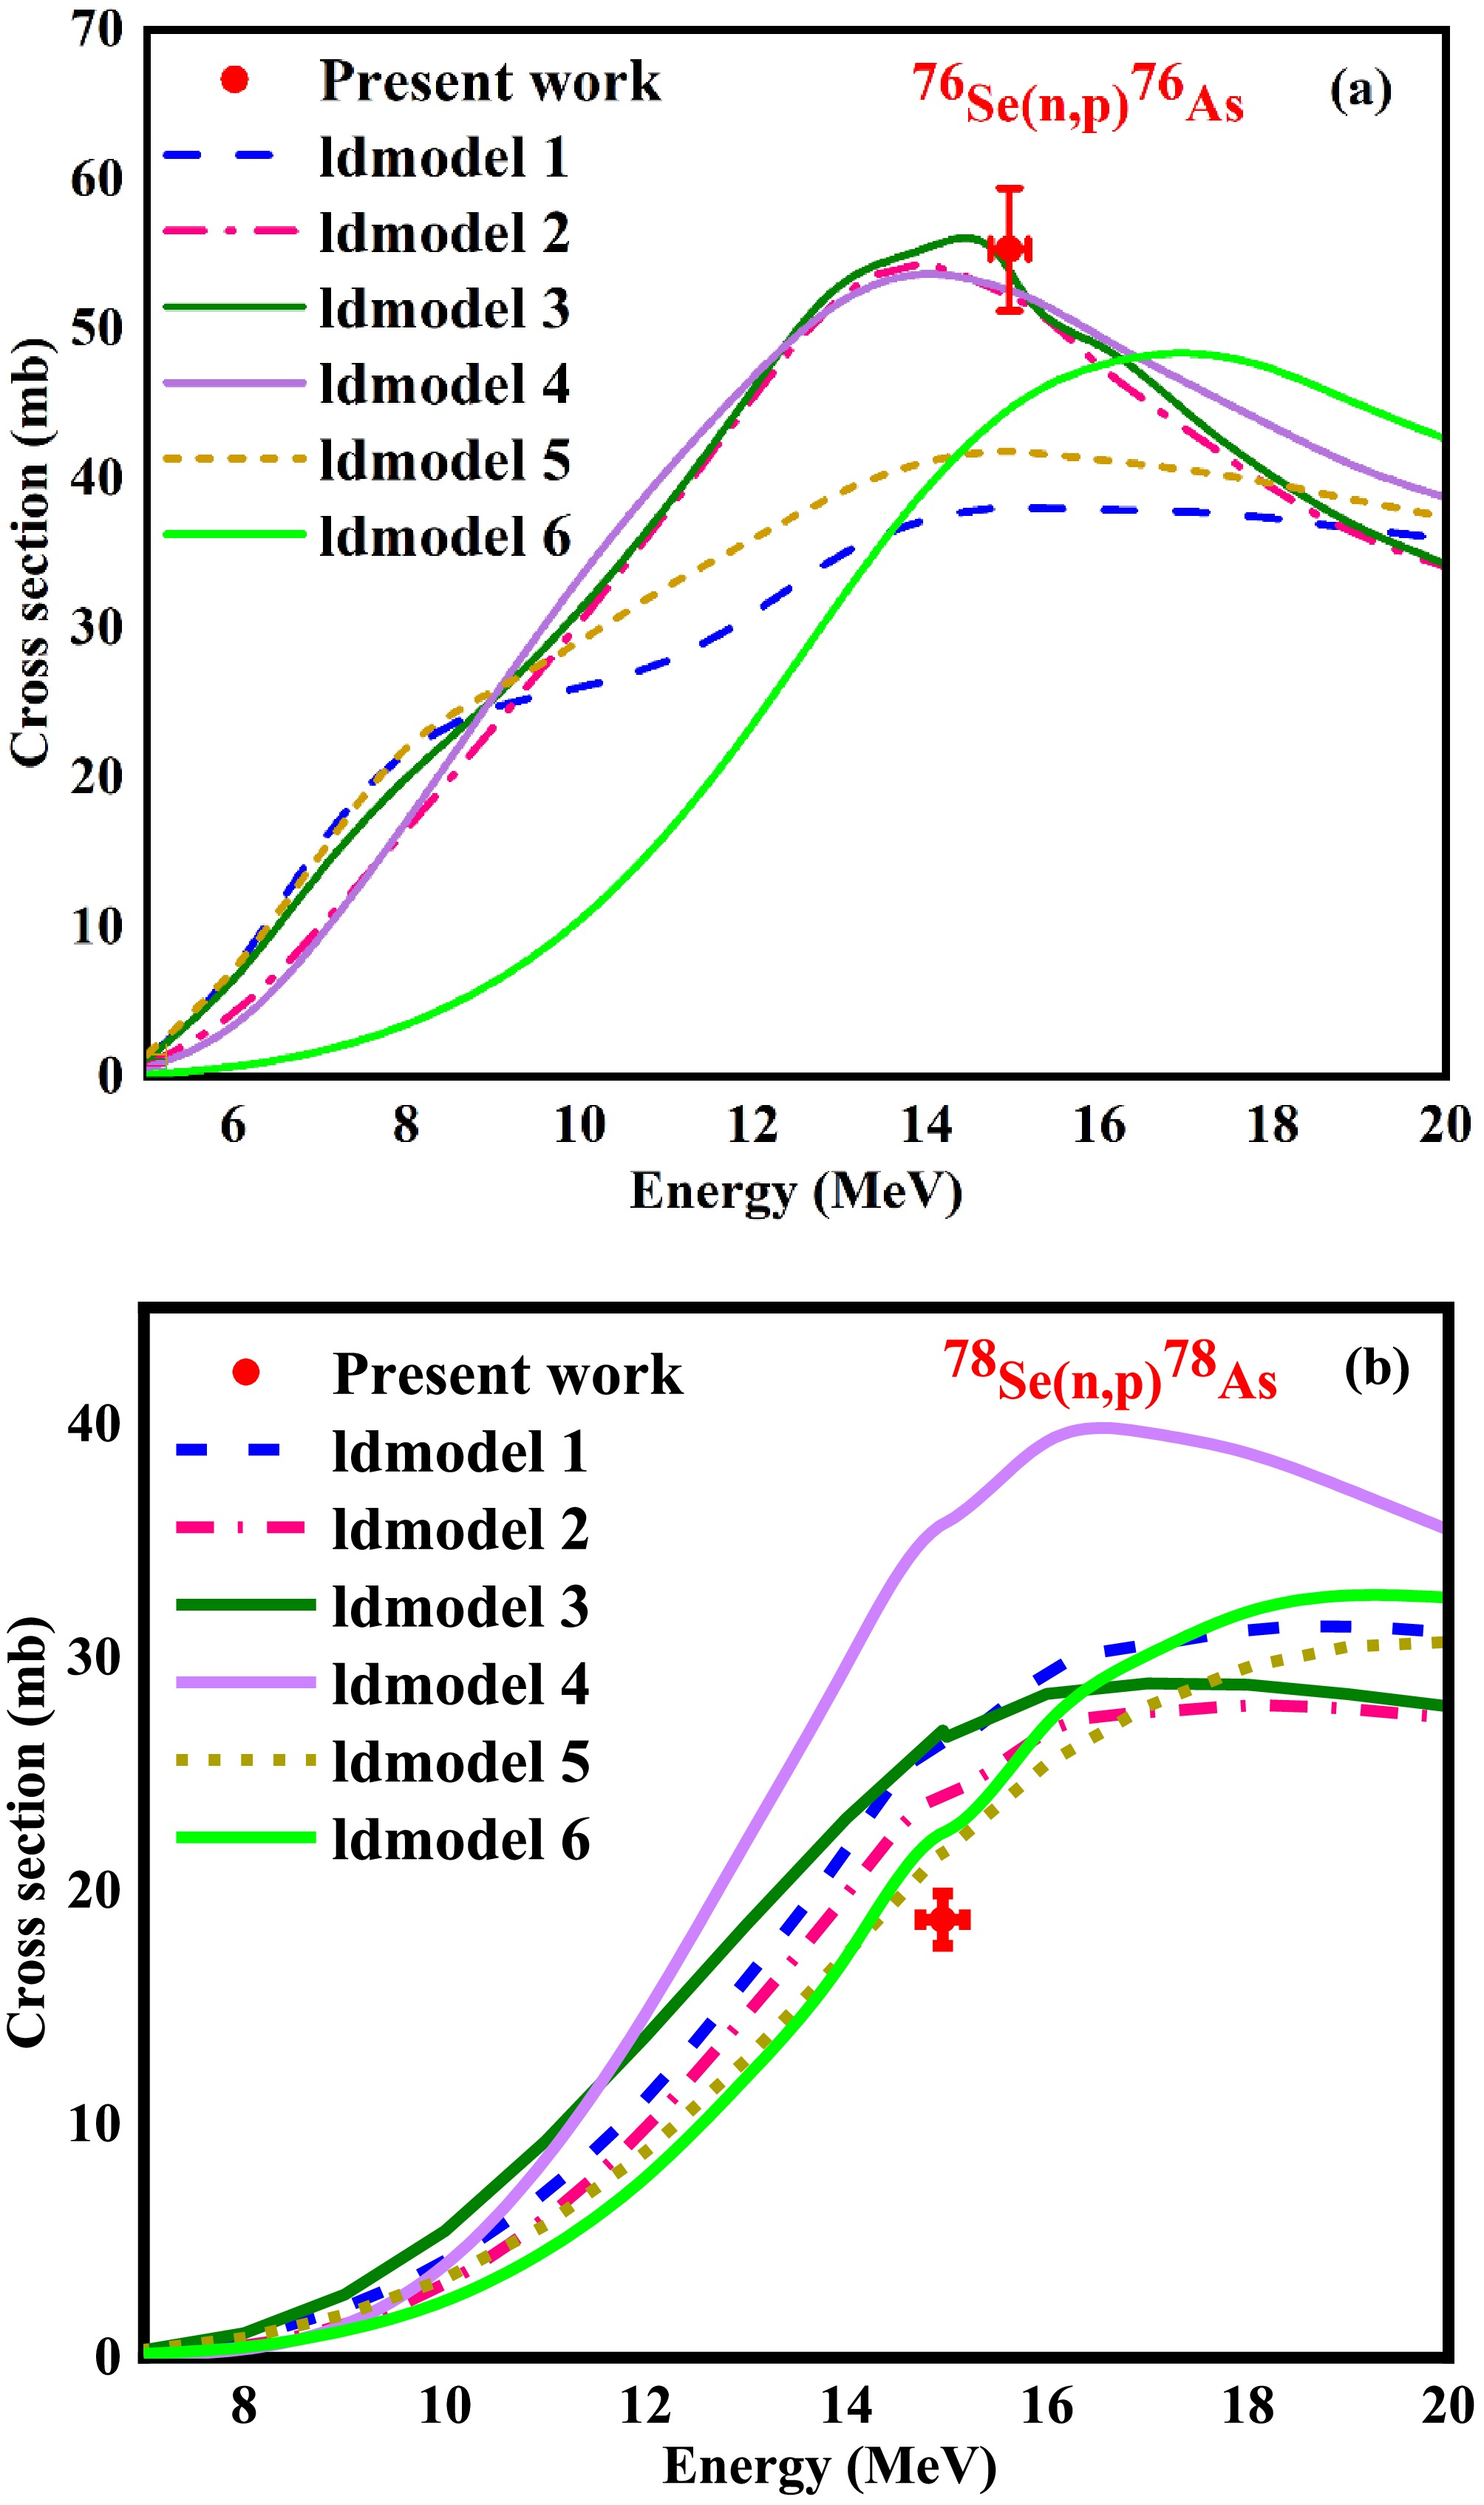
Figure 12. (color online) Comparison of the measured cross section and theoretically reproduced cross section value using various nuclear level density models for 76Se(n, p)76As and 78Se(n, p)78As reactions.
For the 78Se(n, p)78As reaction, the cross section simulated from the nuclear level density models for the 78Se(n, p)78As reaction varies from 21.70 to 35.71 mb (Fig. 12 (b)). The cross section obtained via ldmodel 5 (S. Hilarie microscopic model) is the nearest to the measured value [42]. However, the theoretical cross sections obtained using the other microscopic level density models, i.e., ldmodel 4 and ldmodel 6, exceed the measured cross section by approximately 46 % and 15 %, respectively.
The theoretical reproduced cross sections of the 82Se(n, 2n)81Seg reaction using ldmodel 1, ldmodel 2, ldmodel 3, ldmodel 4, ldmodel 5, and ldmodel 6 are 515.49, 473.24, 447.48, 457.55, 488.96, and 467.27 mb, respectively (Fig. 13 (a)). In comparison with the other NLD models, Constant Temperature nuclear level density model (ldmodel 1) of TALYS reproduces a better cross section value for the 82Se(n, 2n)81Seg reaction.
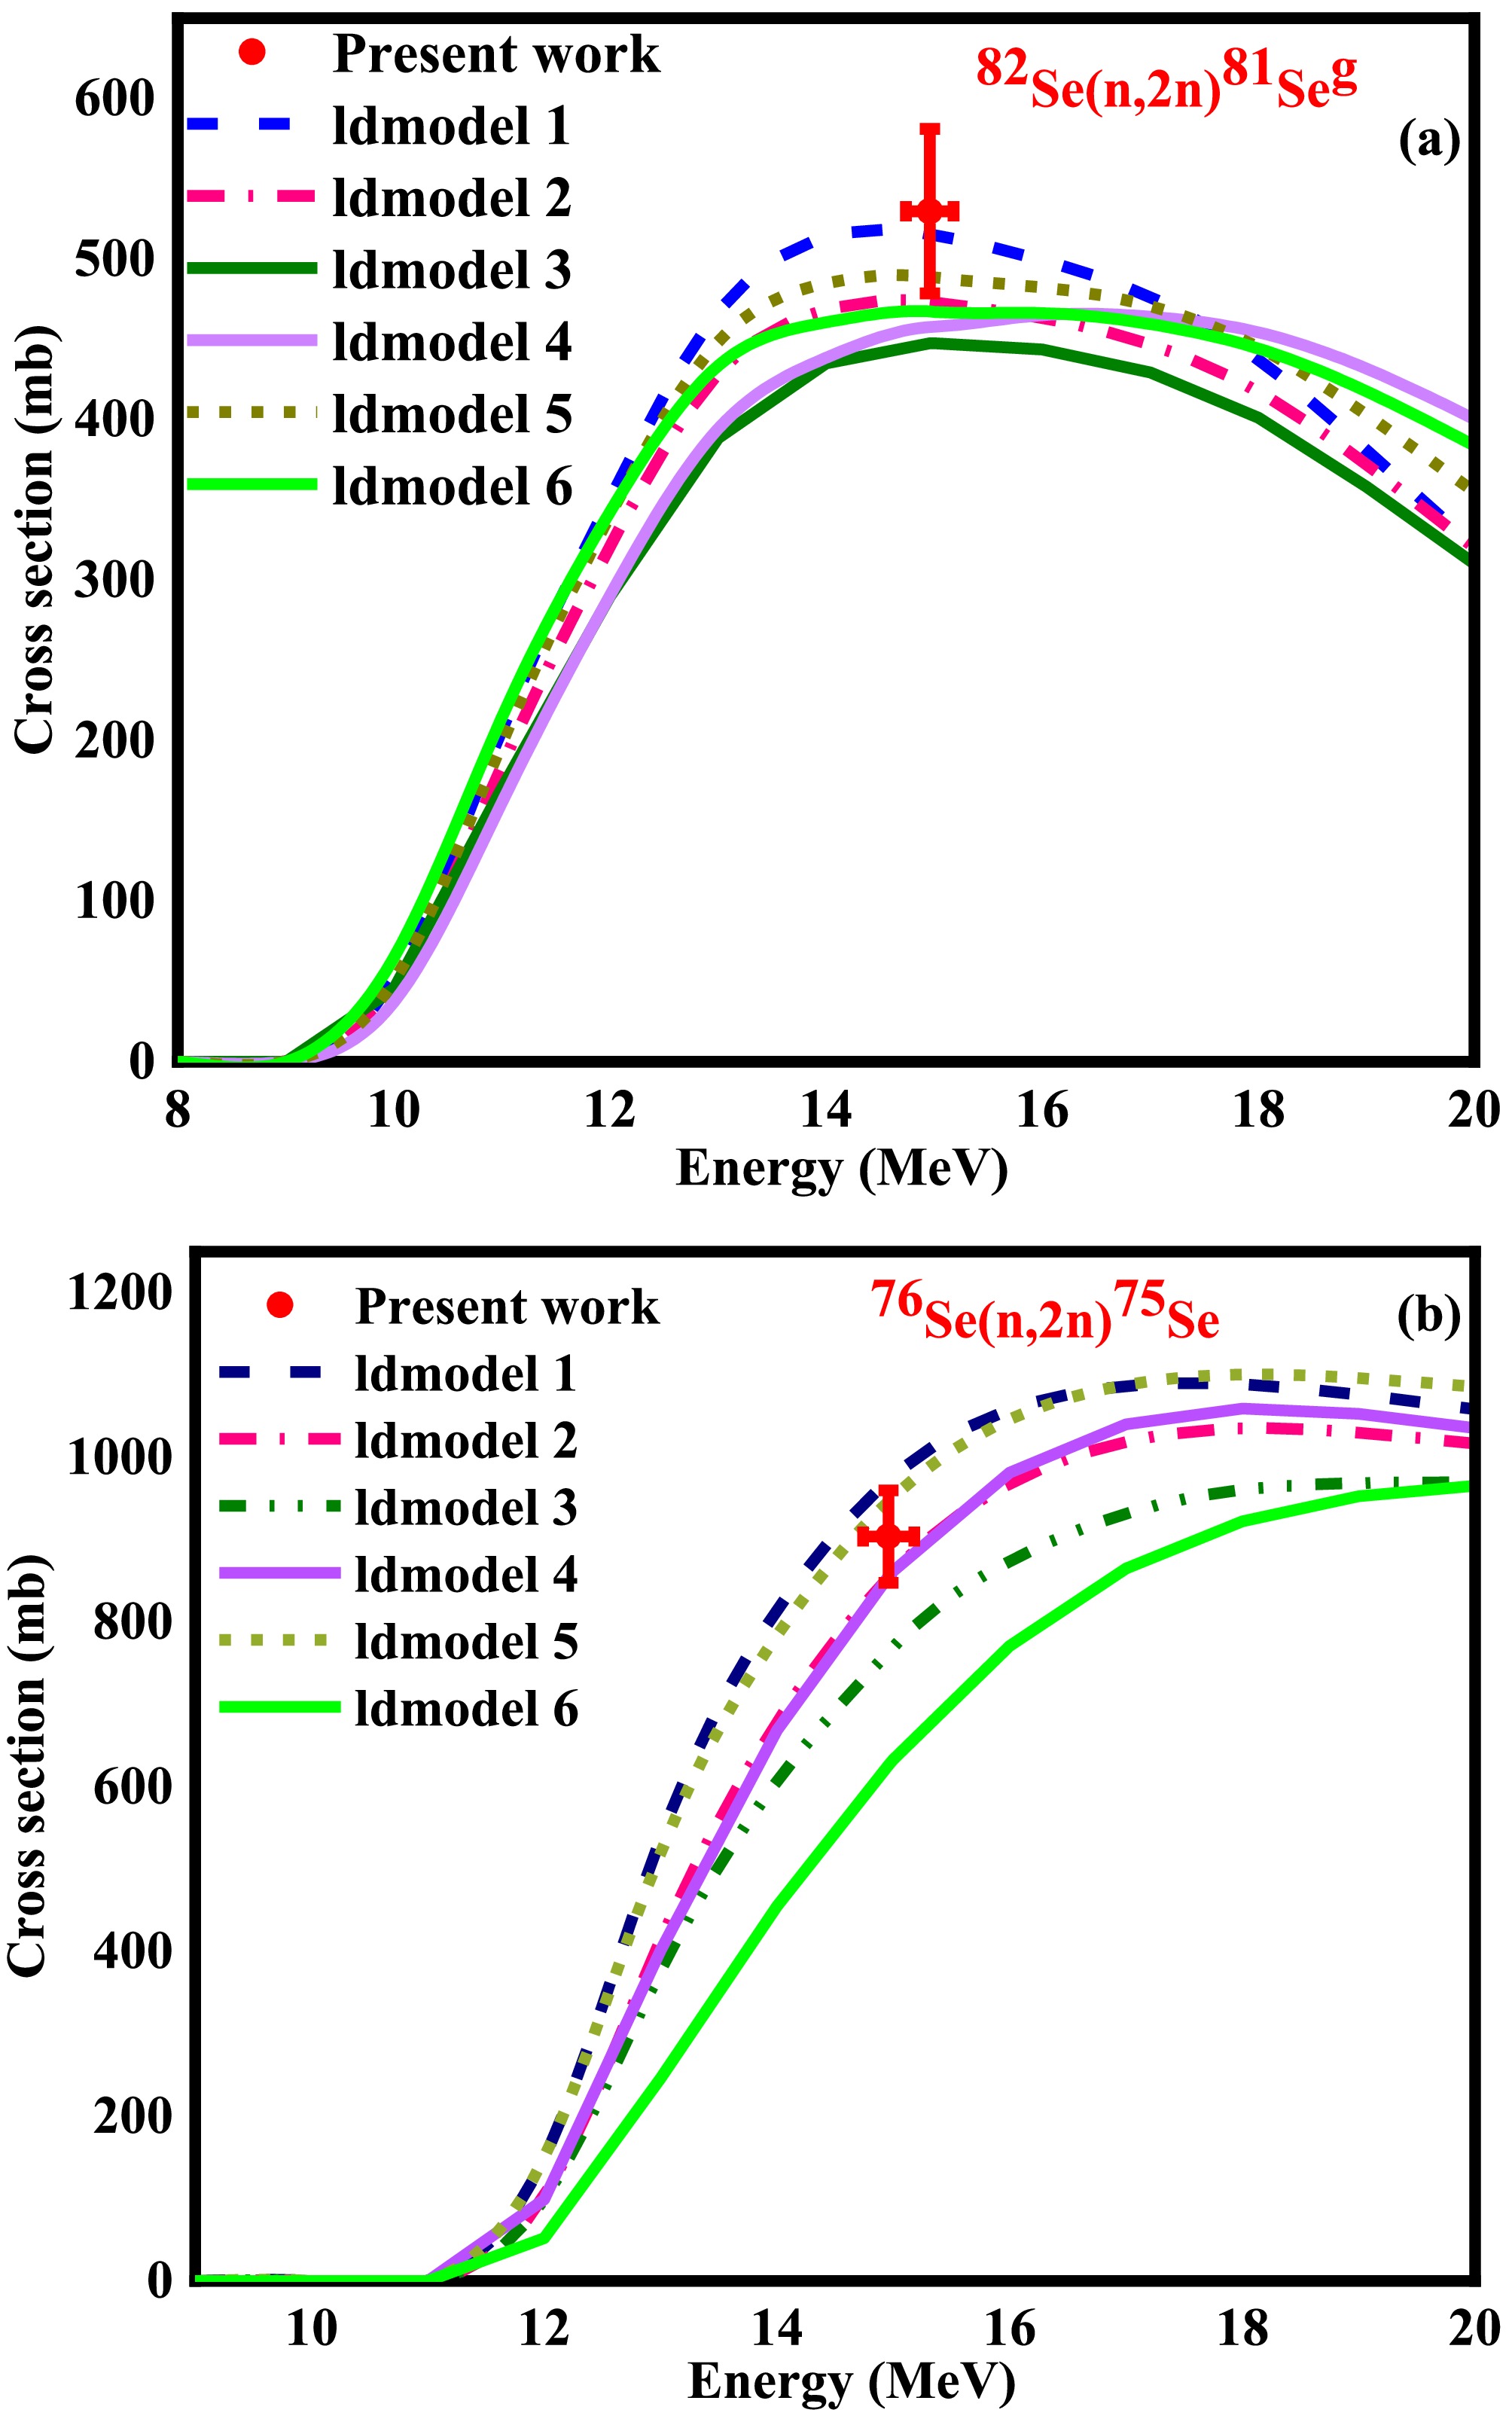
Figure 13. (color online) Comparison of the measured and theoretically reproduced cross sections using various nuclear level density models for the 82Se(n, 2n)81Seg and 76Se(n, 2n)75Se reactions.
For the 76Se(n, 2n)75Se reaction, the cross sections obtained from ldmodel 1, ldmodel 2, ldmodel 3, ldmodel 4, ldmodel 5, and ldmodel 6 are 971.89, 854.55, 763.79, 855.55, 946.51, and 626.46 mb, respectively (Fig 13 (b)). The cross sections of the 76Se(n, 2n)75Se reaction using ldmodel 2 (854.55 mb) and ldmodel 4 (855.55 mb) exceed the measured value by approximately 5.46 % and 5.35 %, respectively. Among all the NLD models, the Hartree-Fock- Bogoliubov (ldmodel 6) microscopic model shows the minimum cross section for the 76Se(n, 2n)75Se reaction (Fig. 13 (b)).
The theoretical estimated cross sections of the 80Se(n, α)77Ge reaction, reproduced from ldmodel 1, ldmodel 2, ldmodel 3, ldmodel 4, ldmodel 5, and ldmodel 6, are 0.96, 3.15, 1.32, 1.47, 1.99, and 1.32 mb, respectively. The cross section using ldmodel 5 (S. Hilarie microscopic) level density model with other default parameters exhibits better consistency with the measured cross section, as revealed in Fig. 14. The measured cross section exceeds the theoretically obtained cross section using ldmodel 5 by approximately 0.99 %. However, ldmodel 3 and ldmodel 6 reproduce similar trends of the cross section up to 18 MeV neutron energy for the 80Se(n, α)77Ge reaction.
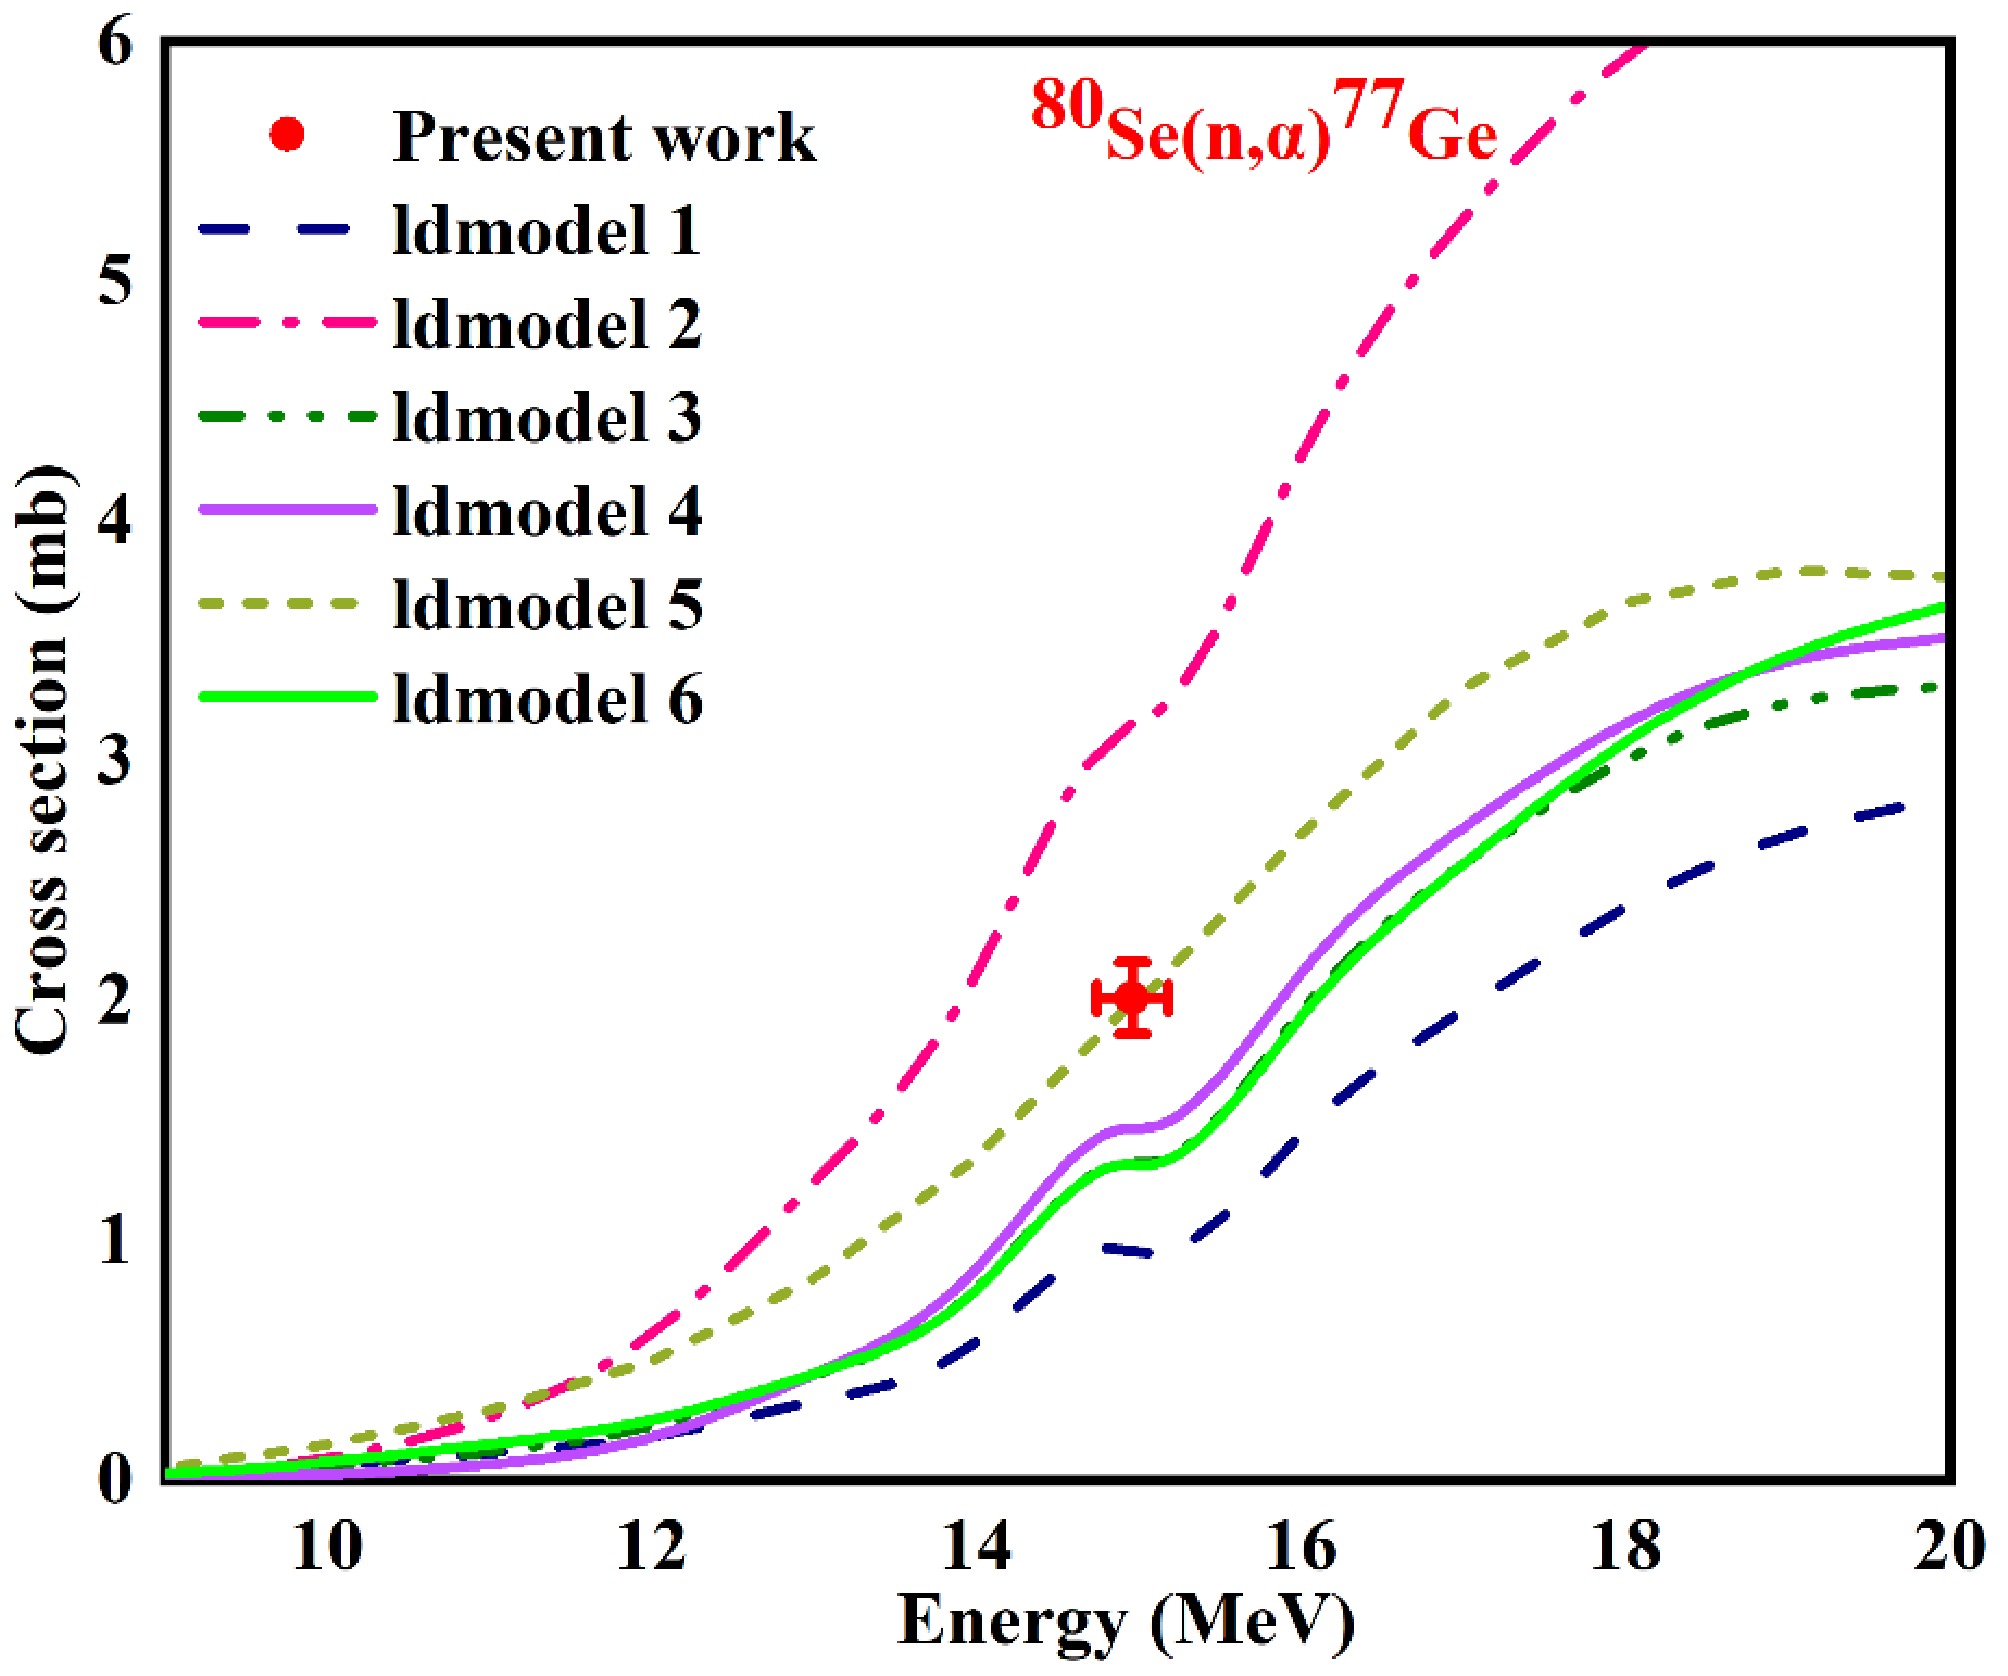
Figure 14. (color online) Comparison of the measured cross section and theoretically reproduced cross section using various nuclear level density models for the 80Se(n, α)77Ge reaction.
As can be interpreted from Table 10, the selection of the best fit level density model for each reaction is validated by the smallest chi-square (χ2) value calculated using Eq. (19). However, in the case of the 82Se(n, 2n)81Seg reaction, the χ2 value is observed to be the lowest for ldmodel 3, rather than for ldmodel 1, despite predicting a better agreement with the measured result. This could be attributed to the fact that ldmodel 3 was successfully validated on EXFOR in all previous studies [23, 26]. Despite this, the present cross section is well validated by ldmodel 3 rather than ldmodel 1, as it is higher than the values in previous studies.
-
The measured cross sections of the 76Se(n, p)76As, and 78Se(n, p)78As, 82Se(n, 2n)81Seg, 76Se(n, 2n)75Se, and 80Se(n, α)77Ge reactions were compared with those of all six nuclear level density models of TALYS code. For the 76Se(n, p)76As reaction, the cross section reproduced through ldmodel 3 (Generalized Superfluid model) [35−38] with the default optical model, pre-equilibrium, width fluctuation correction model, and γ strength function model [39] shows better agreement with the measured cross section, as depicted in Fig. 12 (a). Moreover, the measured cross section (55.30 mb) exceeds the value calculated using ldmodel 3 (53.90 mb) by approximately 2.5 %. Furthermore, the cross sections estimated with ldmodel 2 (Back-Shifted Fermi Gas model) [40] and ldmodel 4 (S. Goriely microscopic model) [41] lie in the error bar of the measured cross section.
Figure 12. (color online) Comparison of the measured cross section and theoretically reproduced cross section value using various nuclear level density models for 76Se(n, p)76As and 78Se(n, p)78As reactions.
For the 78Se(n, p)78As reaction, the cross section simulated from the nuclear level density models for the 78Se(n, p)78As reaction varies from 21.70 to 35.71 mb (Fig. 12 (b)). The cross section obtained via ldmodel 5 (S. Hilarie microscopic model) is the nearest to the measured value [42]. However, the theoretical cross sections obtained using the other microscopic level density models, i.e., ldmodel 4 and ldmodel 6, exceed the measured cross section by approximately 46 % and 15 %, respectively.
The theoretical reproduced cross sections of the 82Se(n, 2n)81Seg reaction using ldmodel 1, ldmodel 2, ldmodel 3, ldmodel 4, ldmodel 5, and ldmodel 6 are 515.49, 473.24, 447.48, 457.55, 488.96, and 467.27 mb, respectively (Fig. 13 (a)). In comparison with the other NLD models, Constant Temperature nuclear level density model (ldmodel 1) of TALYS reproduces a better cross section value for the 82Se(n, 2n)81Seg reaction.
Figure 13. (color online) Comparison of the measured and theoretically reproduced cross sections using various nuclear level density models for the 82Se(n, 2n)81Seg and 76Se(n, 2n)75Se reactions.
For the 76Se(n, 2n)75Se reaction, the cross sections obtained from ldmodel 1, ldmodel 2, ldmodel 3, ldmodel 4, ldmodel 5, and ldmodel 6 are 971.89, 854.55, 763.79, 855.55, 946.51, and 626.46 mb, respectively (Fig 13 (b)). The cross sections of the 76Se(n, 2n)75Se reaction using ldmodel 2 (854.55 mb) and ldmodel 4 (855.55 mb) exceed the measured value by approximately 5.46 % and 5.35 %, respectively. Among all the NLD models, the Hartree-Fock- Bogoliubov (ldmodel 6) microscopic model shows the minimum cross section for the 76Se(n, 2n)75Se reaction (Fig. 13 (b)).
The theoretical estimated cross sections of the 80Se(n, α)77Ge reaction, reproduced from ldmodel 1, ldmodel 2, ldmodel 3, ldmodel 4, ldmodel 5, and ldmodel 6, are 0.96, 3.15, 1.32, 1.47, 1.99, and 1.32 mb, respectively. The cross section using ldmodel 5 (S. Hilarie microscopic) level density model with other default parameters exhibits better consistency with the measured cross section, as revealed in Fig. 14. The measured cross section exceeds the theoretically obtained cross section using ldmodel 5 by approximately 0.99 %. However, ldmodel 3 and ldmodel 6 reproduce similar trends of the cross section up to 18 MeV neutron energy for the 80Se(n, α)77Ge reaction.
Figure 14. (color online) Comparison of the measured cross section and theoretically reproduced cross section using various nuclear level density models for the 80Se(n, α)77Ge reaction.
As can be interpreted from Table 10, the selection of the best fit level density model for each reaction is validated by the smallest chi-square (χ2) value calculated using Eq. (19). However, in the case of the 82Se(n, 2n)81Seg reaction, the χ2 value is observed to be the lowest for ldmodel 3, rather than for ldmodel 1, despite predicting a better agreement with the measured result. This could be attributed to the fact that ldmodel 3 was successfully validated on EXFOR in all previous studies [23, 26]. Despite this, the present cross section is well validated by ldmodel 3 rather than ldmodel 1, as it is higher than the values in previous studies.
-
The measured cross sections of the 76Se(n, p)76As, and 78Se(n, p)78As, 82Se(n, 2n)81Seg, 76Se(n, 2n)75Se, and 80Se(n, α)77Ge reactions were compared with those of all six nuclear level density models of TALYS code. For the 76Se(n, p)76As reaction, the cross section reproduced through ldmodel 3 (Generalized Superfluid model) [35−38] with the default optical model, pre-equilibrium, width fluctuation correction model, and γ strength function model [39] shows better agreement with the measured cross section, as depicted in Fig. 12 (a). Moreover, the measured cross section (55.30 mb) exceeds the value calculated using ldmodel 3 (53.90 mb) by approximately 2.5 %. Furthermore, the cross sections estimated with ldmodel 2 (Back-Shifted Fermi Gas model) [40] and ldmodel 4 (S. Goriely microscopic model) [41] lie in the error bar of the measured cross section.
Figure 12. (color online) Comparison of the measured cross section and theoretically reproduced cross section value using various nuclear level density models for 76Se(n, p)76As and 78Se(n, p)78As reactions.
For the 78Se(n, p)78As reaction, the cross section simulated from the nuclear level density models for the 78Se(n, p)78As reaction varies from 21.70 to 35.71 mb (Fig. 12 (b)). The cross section obtained via ldmodel 5 (S. Hilarie microscopic model) is the nearest to the measured value [42]. However, the theoretical cross sections obtained using the other microscopic level density models, i.e., ldmodel 4 and ldmodel 6, exceed the measured cross section by approximately 46 % and 15 %, respectively.
The theoretical reproduced cross sections of the 82Se(n, 2n)81Seg reaction using ldmodel 1, ldmodel 2, ldmodel 3, ldmodel 4, ldmodel 5, and ldmodel 6 are 515.49, 473.24, 447.48, 457.55, 488.96, and 467.27 mb, respectively (Fig. 13 (a)). In comparison with the other NLD models, Constant Temperature nuclear level density model (ldmodel 1) of TALYS reproduces a better cross section value for the 82Se(n, 2n)81Seg reaction.
Figure 13. (color online) Comparison of the measured and theoretically reproduced cross sections using various nuclear level density models for the 82Se(n, 2n)81Seg and 76Se(n, 2n)75Se reactions.
For the 76Se(n, 2n)75Se reaction, the cross sections obtained from ldmodel 1, ldmodel 2, ldmodel 3, ldmodel 4, ldmodel 5, and ldmodel 6 are 971.89, 854.55, 763.79, 855.55, 946.51, and 626.46 mb, respectively (Fig 13 (b)). The cross sections of the 76Se(n, 2n)75Se reaction using ldmodel 2 (854.55 mb) and ldmodel 4 (855.55 mb) exceed the measured value by approximately 5.46 % and 5.35 %, respectively. Among all the NLD models, the Hartree-Fock- Bogoliubov (ldmodel 6) microscopic model shows the minimum cross section for the 76Se(n, 2n)75Se reaction (Fig. 13 (b)).
The theoretical estimated cross sections of the 80Se(n, α)77Ge reaction, reproduced from ldmodel 1, ldmodel 2, ldmodel 3, ldmodel 4, ldmodel 5, and ldmodel 6, are 0.96, 3.15, 1.32, 1.47, 1.99, and 1.32 mb, respectively. The cross section using ldmodel 5 (S. Hilarie microscopic) level density model with other default parameters exhibits better consistency with the measured cross section, as revealed in Fig. 14. The measured cross section exceeds the theoretically obtained cross section using ldmodel 5 by approximately 0.99 %. However, ldmodel 3 and ldmodel 6 reproduce similar trends of the cross section up to 18 MeV neutron energy for the 80Se(n, α)77Ge reaction.
Figure 14. (color online) Comparison of the measured cross section and theoretically reproduced cross section using various nuclear level density models for the 80Se(n, α)77Ge reaction.
As can be interpreted from Table 10, the selection of the best fit level density model for each reaction is validated by the smallest chi-square (χ2) value calculated using Eq. (19). However, in the case of the 82Se(n, 2n)81Seg reaction, the χ2 value is observed to be the lowest for ldmodel 3, rather than for ldmodel 1, despite predicting a better agreement with the measured result. This could be attributed to the fact that ldmodel 3 was successfully validated on EXFOR in all previous studies [23, 26]. Despite this, the present cross section is well validated by ldmodel 3 rather than ldmodel 1, as it is higher than the values in previous studies.
-
For the 76Se(n, p)76As reaction, the adjusted set of parameters (ldmodel 2, jlmomp, preeqmode 3, strength 9, and widthmode 1) reproduced the cross section of 54.23 mb at the neutron energy of 14.96 MeV. The cross section obtained using the adjusted parameters for the 76Se(n, p)76As reaction is in close agreement with the measured value in this study (55.30 mb), as depicted in Fig. 15. The Back Shifted Fermi Gas model (“ldmodel 2”) provides a realistic excitation energy dependence of the level density for the residual nucleus. Moreover, the JLM optical model has been optimized and validated for the spherical and quasi-spherical nuclei by using JLM implementation. Furthermore, the inclusion of “preeqmode 3” enhances the exciton based multistep pre-equilibrium emission. Therefore, the aforementioned parameters are adopted as an adjusted set of parameters to reproduce the 76Se(n, p)76As reaction cross section. At 14.96 MeV, the reaction is predominantly governed by a compound nucleus mechanism contributing 76.13 % of the total cross section, whereas the remaining 23.87 % arises from the pre-equilibrium mechanism (Table 11). The contribution of the pre-equilibrium mechanism increases with the elevation in the neutron energy. However, the compound nucleus mechanism decreases at higher energies. The calculated excitation curve for the 76Se(n, p)76As reaction shows a dominant contribution of the compound nucleus reaction mechanism in a low-energy range (< 12 MeV). However, the contribution of the pre-equilibrium reaction mechanism increases from the mid-range neutron energy (~15 MeV), and a negligible contribution can be seen for the compound nucleus reaction mechanism beyond the neutron energy of 20 MeV (Fig. 15).
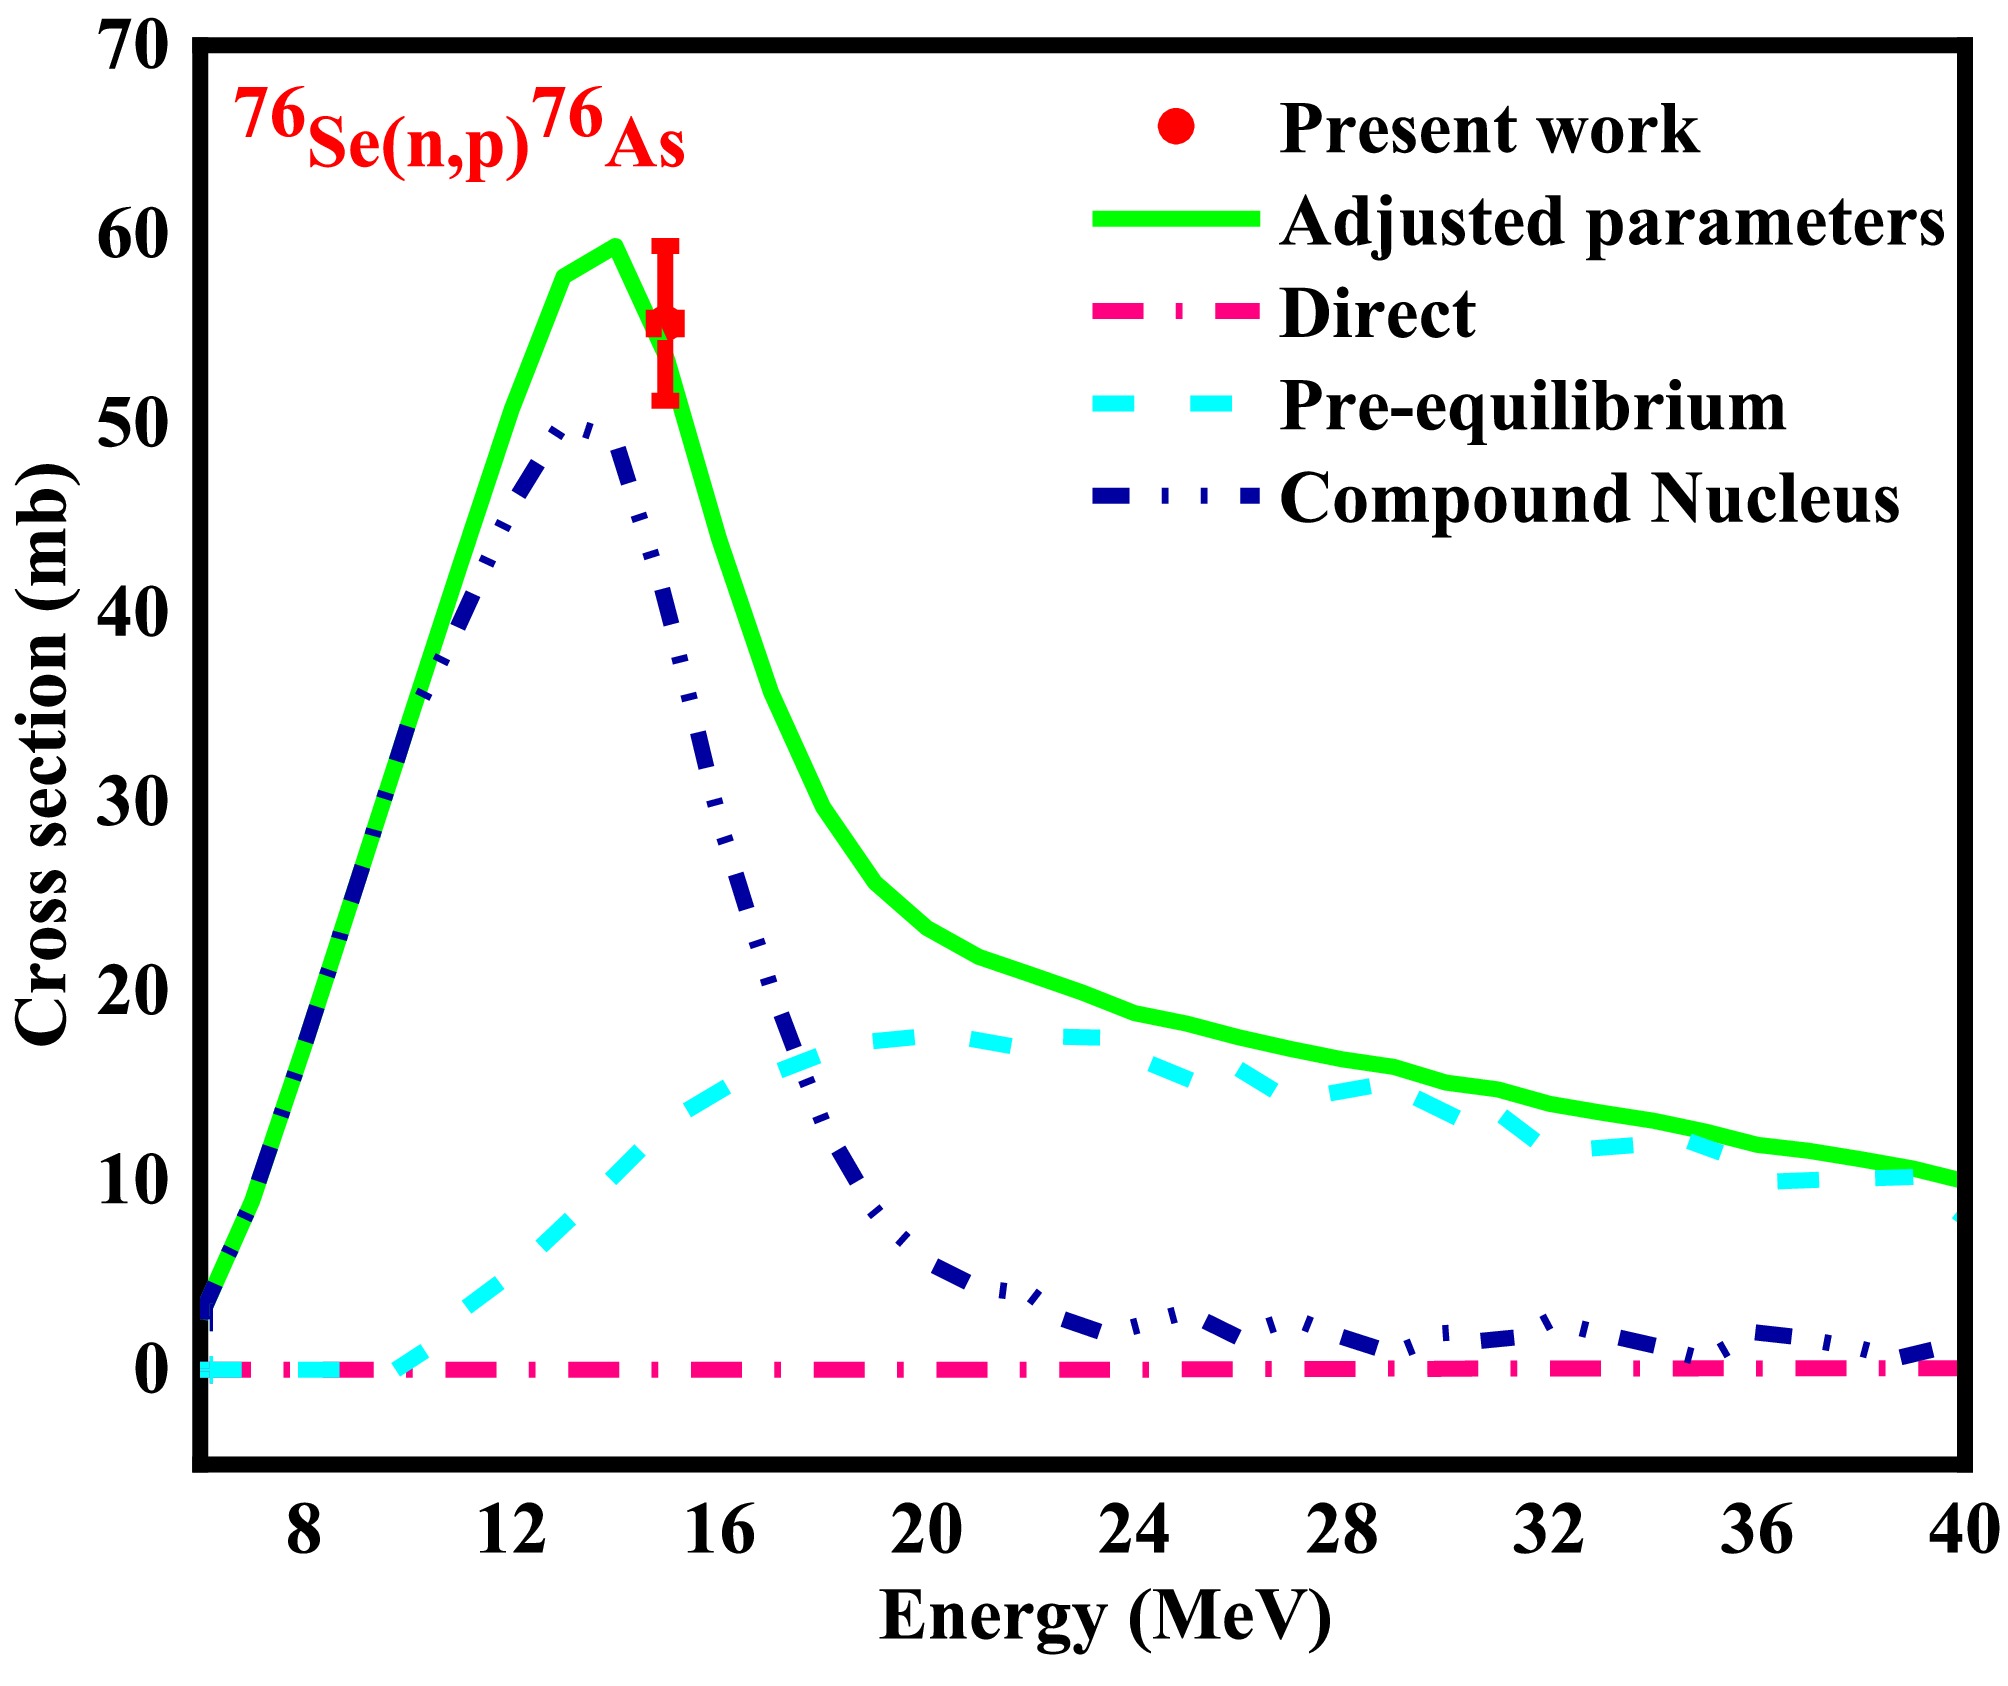
Figure 15. (color online) Comparison of the measured cross section using the adjusted parameters of TALYS and contribution to the cross section from various reaction mechanisms for the 76Se(n, p)76As reaction.
The cross section estimated using the adjusted set of parameters of TALYS for the 78Se(n, p)78As reaction is slightly lower than the measured value (Fig. 16). “ldmodel 2” accounts for the pairing effect and level density enhancement in the odd-odd residual nucleus. Dispersive OMP uses a dispersion relation to connect the real and imaginary parts of the potential. A validated cross section suggests that the model accurately describes the shell-model potential and energies of the bound single-particle states of the target nucleus. Furthermore, “preeqmode 3” enables the estimation of the pre-equilibrium proton emission close to the neutron energy of 14 MeV. The contribution to the reaction cross section from the compound nucleus mechanism is more than three-fold that of the pre-equilibrium reaction mechanism. Moreover, it can be inferred that the compound reaction mechanism is dominant by 78.80 % over the pre-equilibrium (26.23 %) and direct reaction (4.97 %) mechanisms for the 78Se(n, p)78As reaction. However, the contributions of the pre-equilibrium reaction mechanism and compound reaction mechanism show contradictory trends for neutron energy (En) > 15 MeV. The pre-equilibrium contribution gradually increases whereas the contribution of the compound nucleus mechanism reduces after 15 MeV for the 78Se(n, p)78As reaction, as depicted in Fig 16.
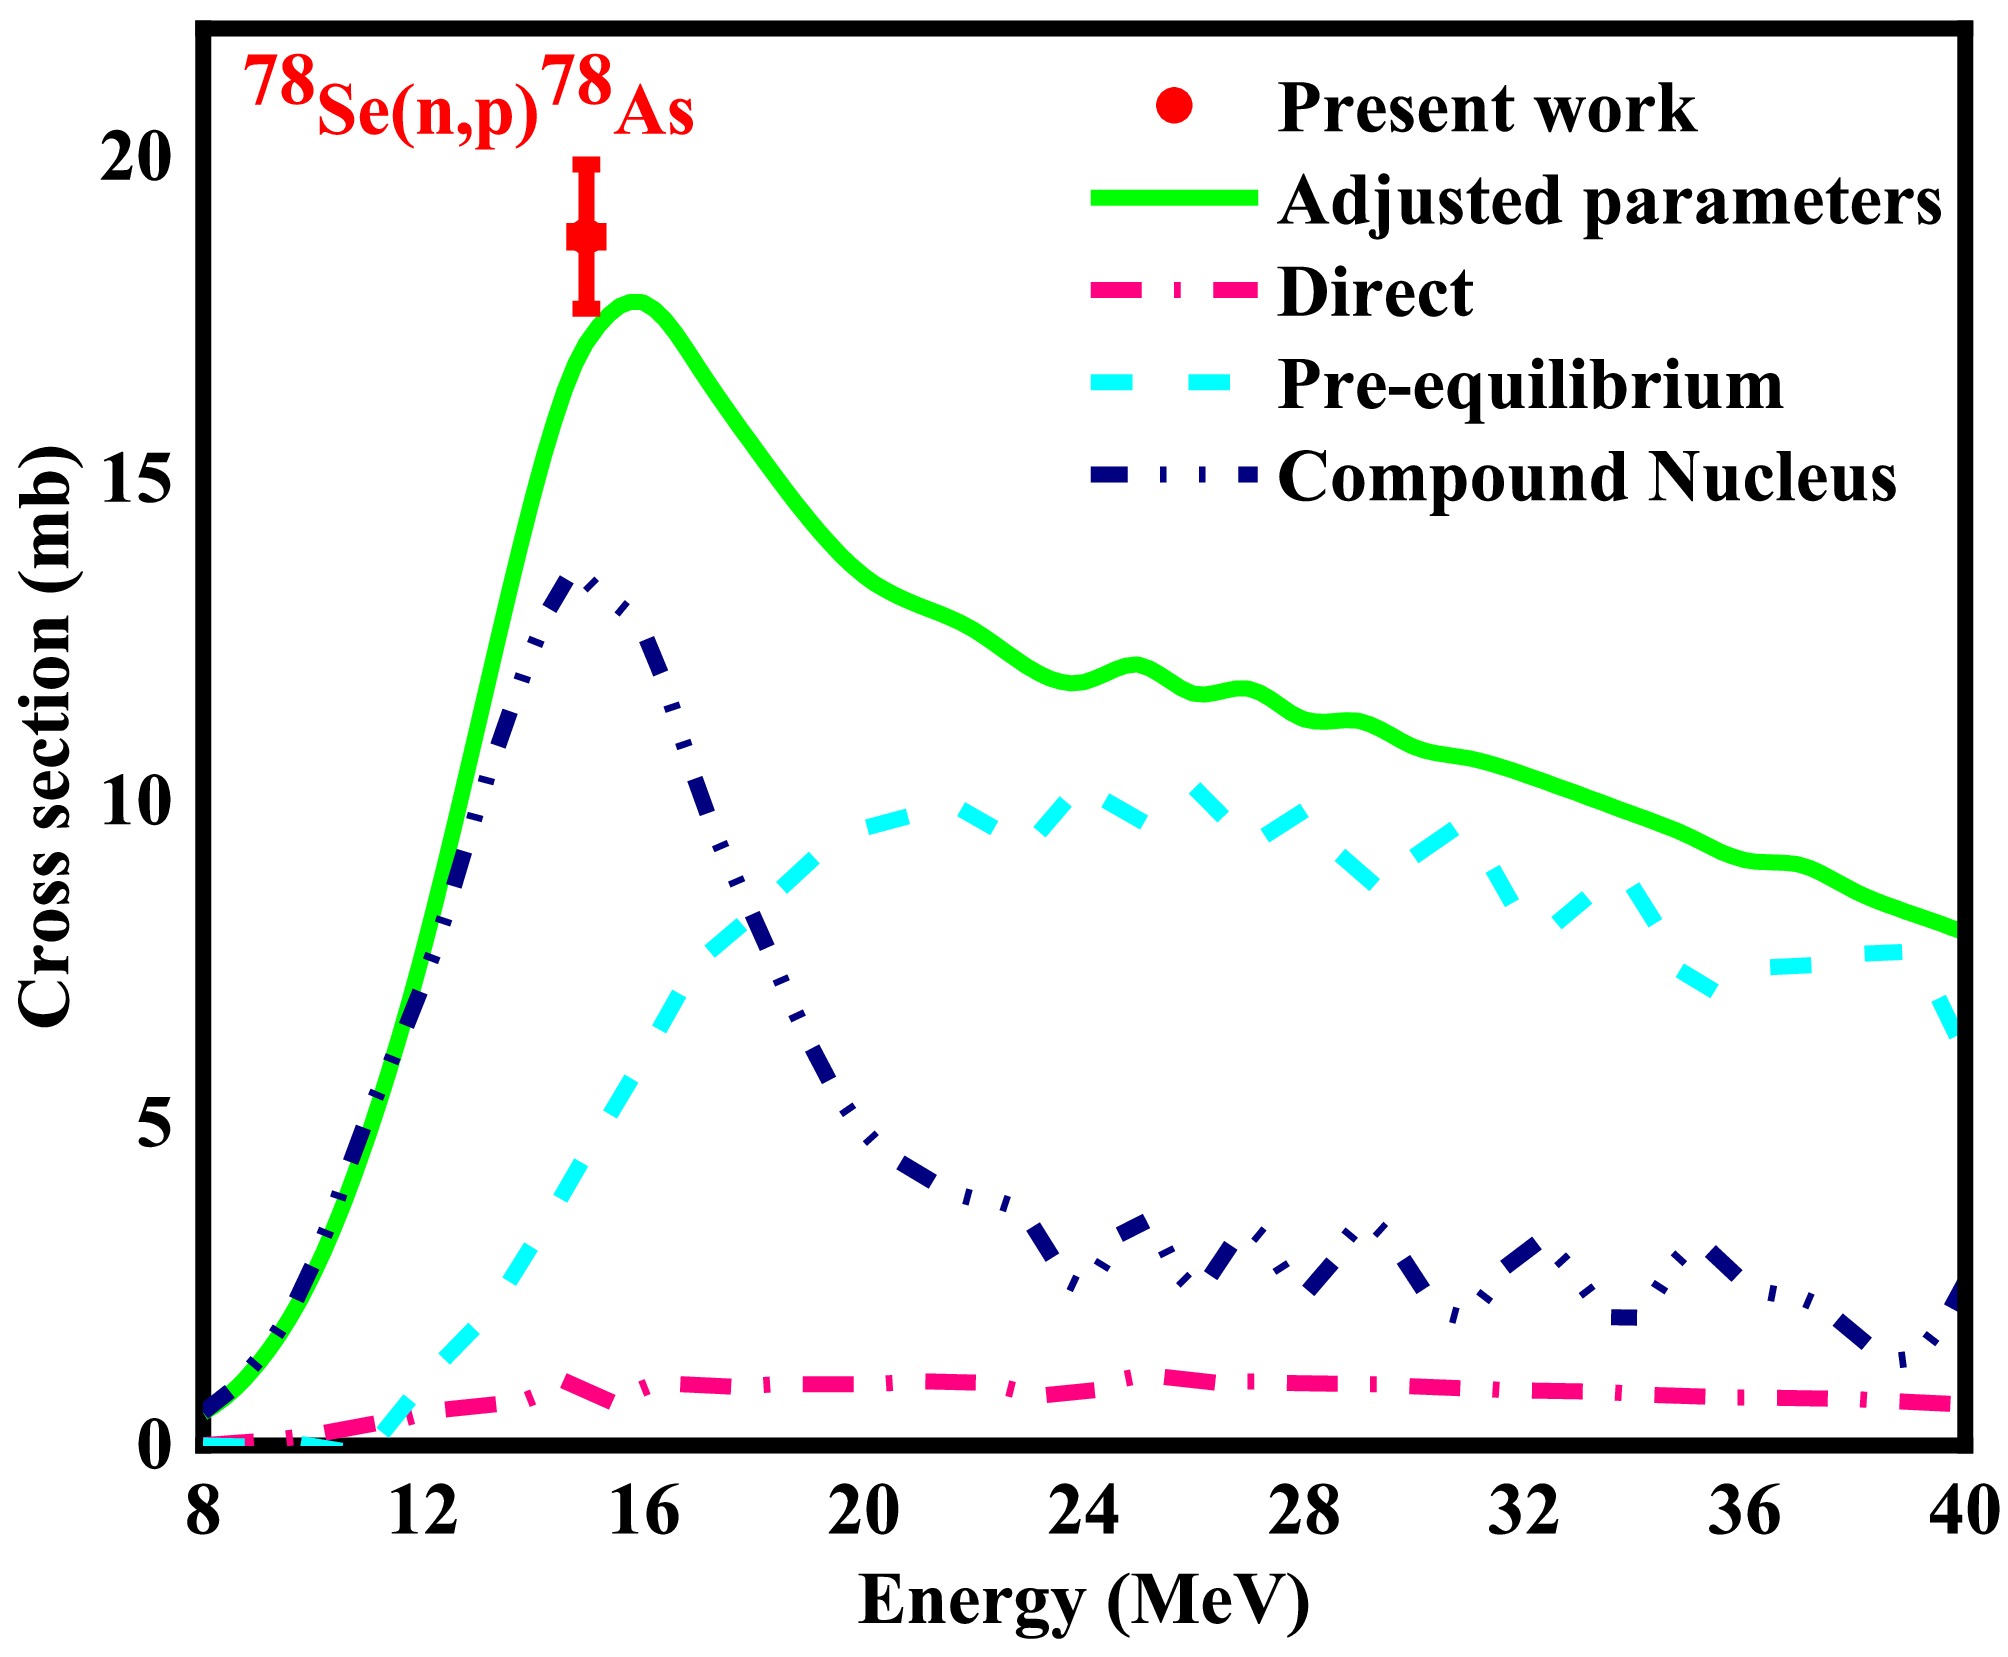
Figure 16. (color online) Comparison of measured cross section using the adjusted parameters of TALYS and contributions to the cross section from various reaction mechanisms for the 78Se(n, p)78As reaction.
The cross section obtained using the adjusted set of parameters for the 82Se(n, 2n)81Seg reaction shows better agreement with the measured cross section, as depicted in Fig. 17. For the 82Se(n, 2n)81Seg reaction channel, “ldmodel 1” (Constant temperature model) provides a more realistic description of the level density near the neutron separation energy in neutron rich isotopes (82Se). Furthermore, the local Koning-Delaroche OMP (“localomp y”) improves the neutron transmission coefficients and normalizes the calculated cross section. The total reaction cross section is dominated by the compound nucleus mechanism, which contributes 100 % at the neutron energy of 14.96 MeV (Table 11). The contribution of the compound nucleus mechanism rises sharply immediately after the threshold energy, and then decreases with increasing neutron energy. However, the direct and pre-equilibrium reaction mechanisms have no contributions to the total cross section for the 82Se(n, 2n)81Seg reaction. Hence, the theoretical excitation curve reveals only the contribution of the compound reaction mechanism in the low and intermediate-energy region. At a higher energy (>24 MeV), the contribution of the pre-equilibrium mechanism gradually increases whereas that of the compound nucleus correspondingly decreases, as depicted in Fig. 17.
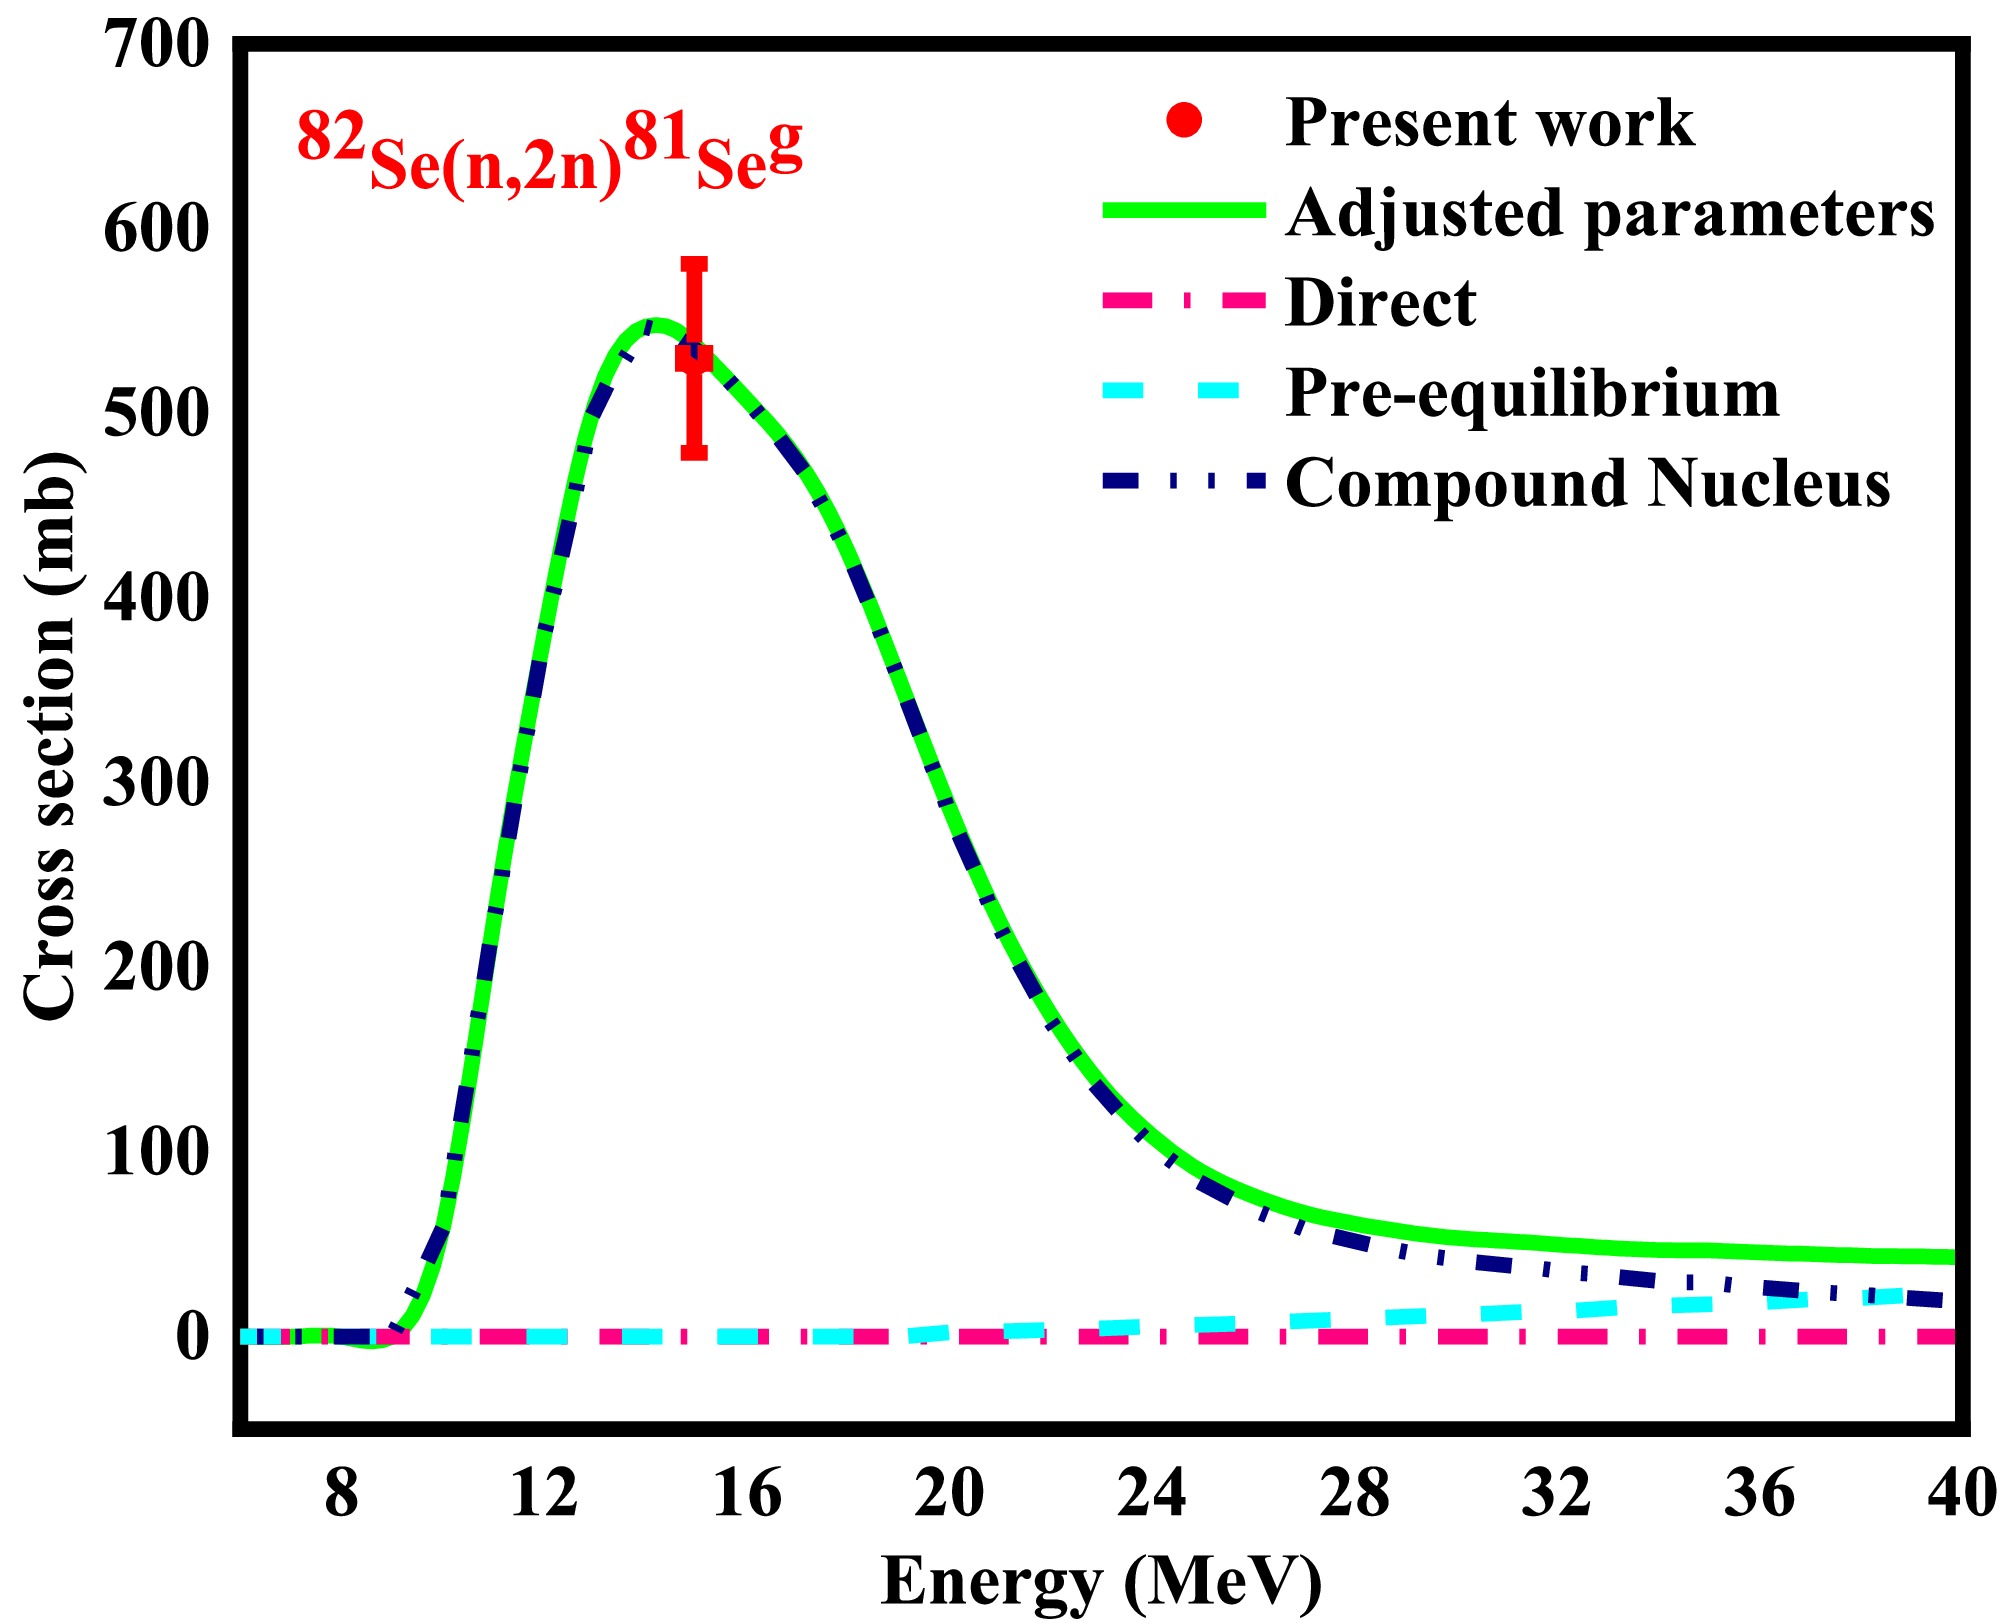
Figure 17. (color online) Comparison of the measured cross section using the adjusted parameters of TALYS and contribution to the cross section from various reaction mechanisms for the 82Se(n, 2n)81Seg reaction.
For the 76Se(n, 2n)75Se reaction, the cross section using the adjusted set of parameters is closely aligned with the measured cross section at the neutron energy of 14.96 MeV. Back-Shifted Fermi Gas model (“ldmodel 2”) ensures accurate modeling of the neutron emission probability and incorporates the pairing and shell effects. This suggests that the residual nucleus (75Se) exhibits a statistical compound nucleus behavior with a high density of the excited state. “localomp y” optical model potential optimizes the neutron transmission coefficients, and “preeqmode 3” enhances the description of the pre-equilibrium contributions at higher neutron energies. The theoretical excitation curve representing the contributions of the various reaction mechanisms of the 76Se(n, 2n)75Se reaction is depicted in Fig. 18. At 14.96 MeV, the compound reaction mechanism contributes 100 % to the total cross section, whereas owing to rapid statistical evaporation, the pre-equilibrium and direct reaction mechanisms have zero contributions, as mentioned in Table 11. Furthermore, in the low and intermediate energy regions, the contribution of the compound reaction mechanism is pre-dominant in the 76Se(n, 2n)75Se reaction. However, the pre-equilibrium mechanism fraction starts to increase beyond the neutron energy of 24 MeV (Fig. 18).
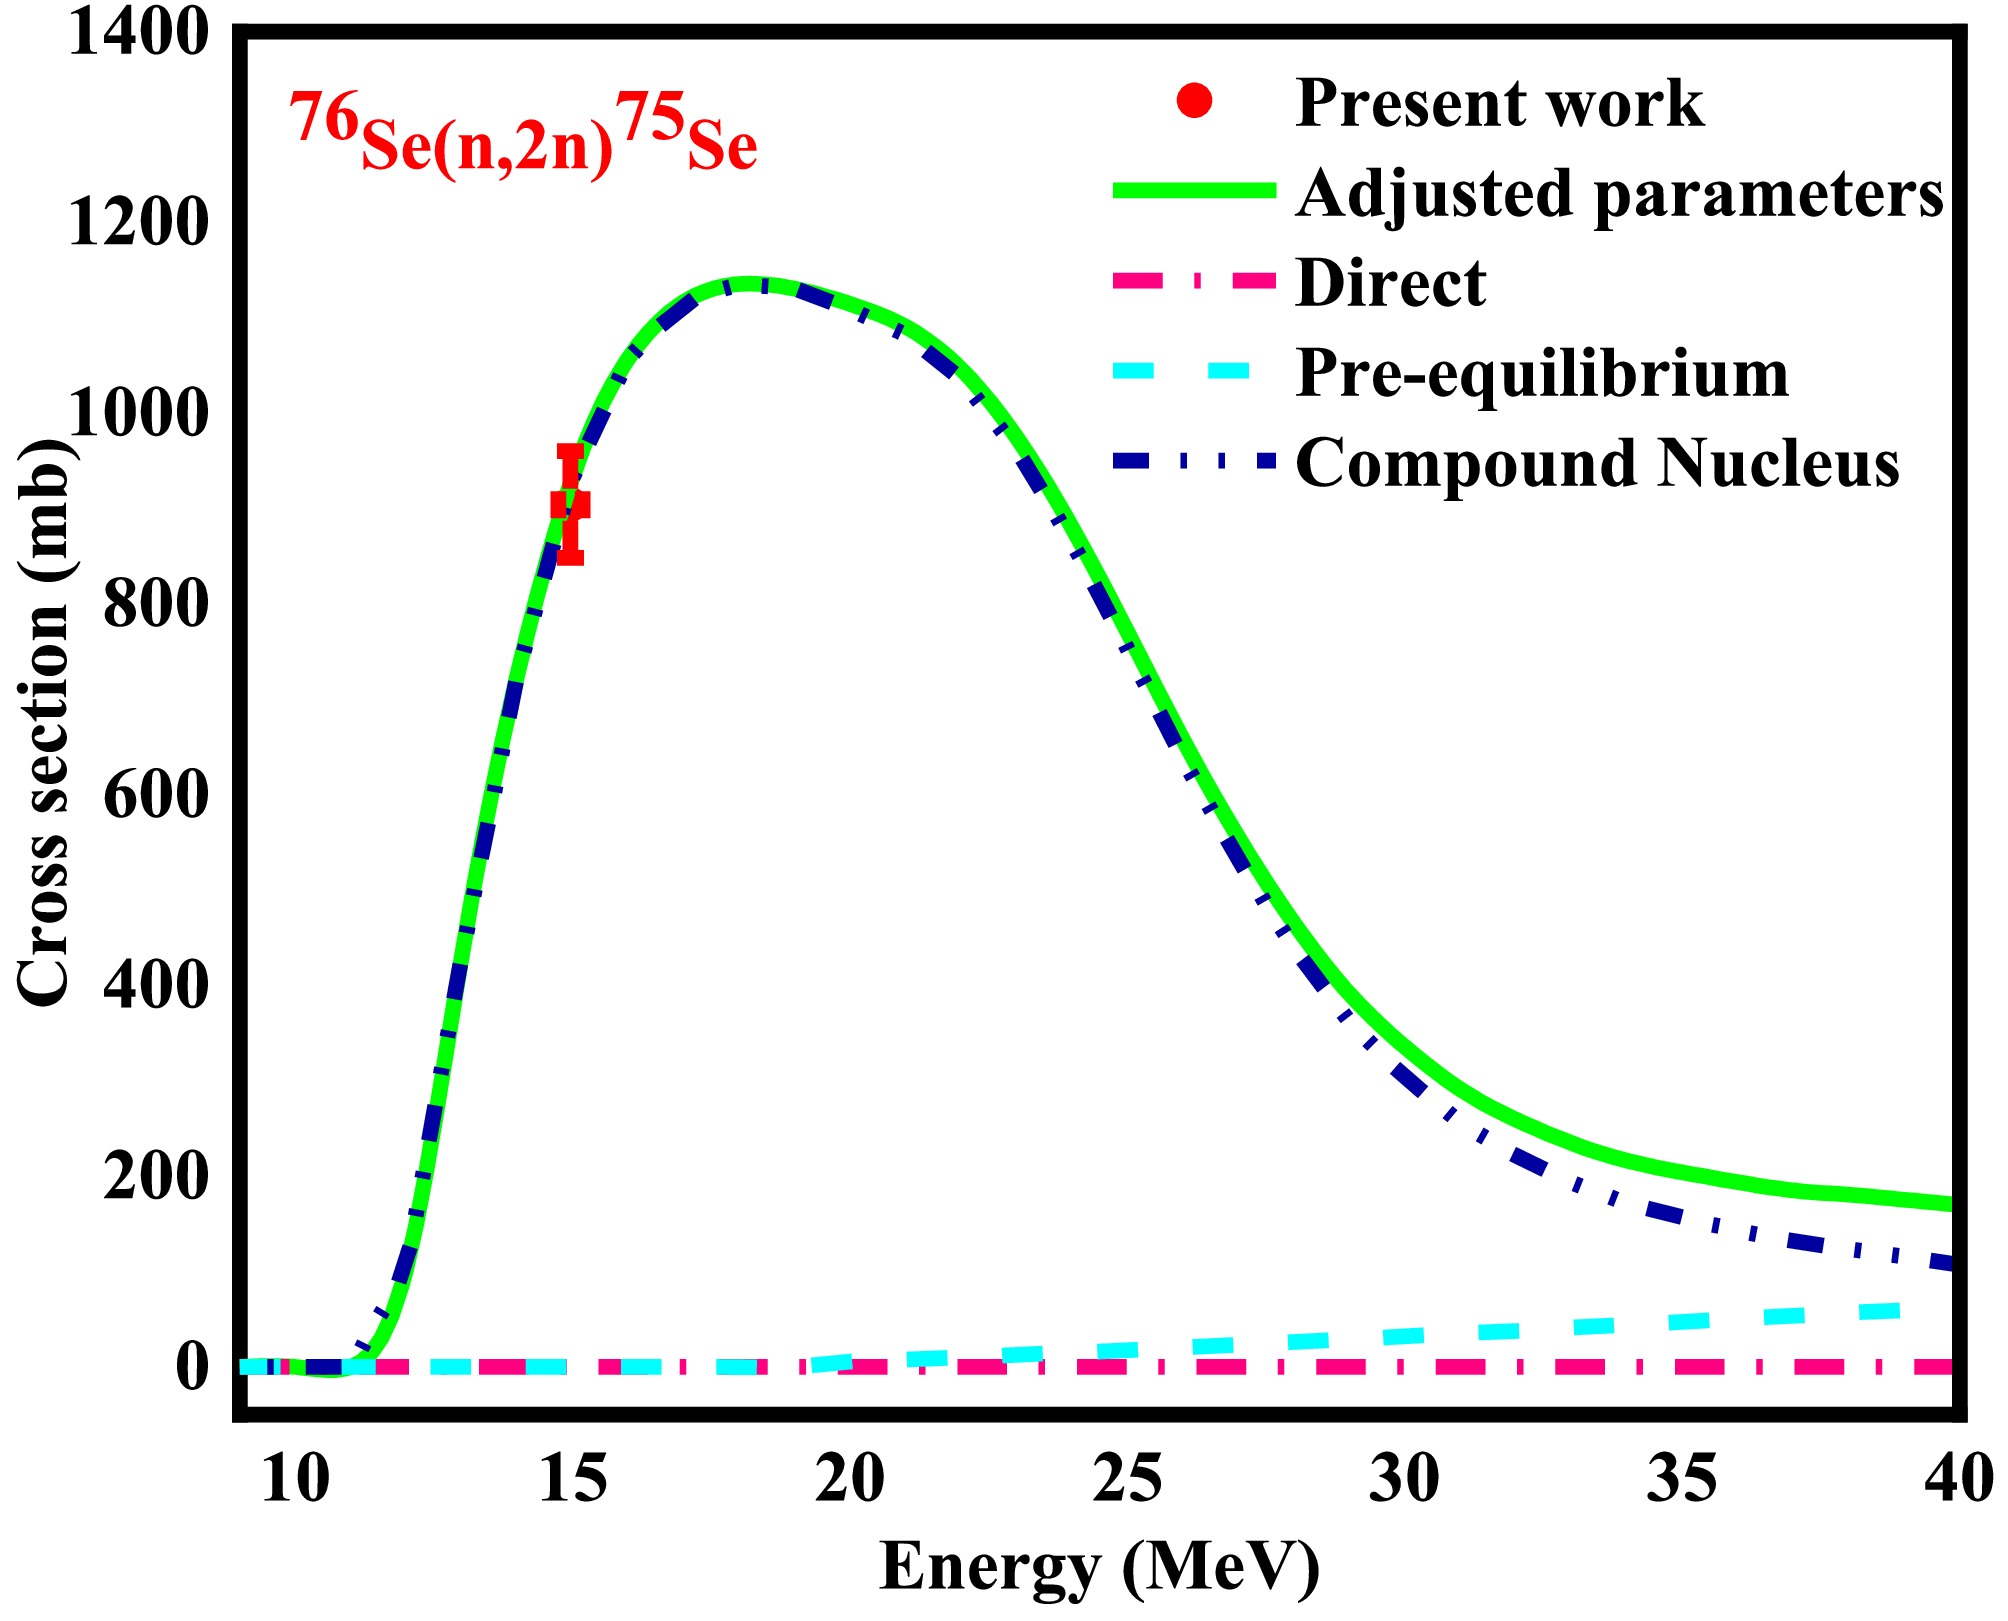
Figure 18. (color online) Comparison of the measured cross section using the adjusted parameters of TALYS and contribution to the cross section from various reaction mechanisms for the 76Se(n, 2n)75Se reaction.
The best agreement with the measured cross section is obtained through the adjusted parameters (ldmodel 5, localomp y, preeqmode 1, strength 9, and widthmode 1) for the 80Se(n, α)77Ge reaction. As can be seen in Fig. 19, the cross section obtained using the adjusted parameters increases with increase in the neutron energy up to 15 MeV. The inclusion of “ldmodel 5” provides the description of the spin parity distribution and nuclear structure of the residual nuclei (77Ge) in comparison with the other level density models. Furthermore, “localomp y” refines the neutron entrance and α exit channel transmission coefficients. The excitation curve of the 80Se(n, α)77Ge reaction in the low energy region shows the contribution of the compound nucleus reaction mechanism. The total cross section is predominantly governed by the compound nucleus mechanism (1.43 mb), and is 75.8 % of the total cross section at 14.96 MeV neutron energy. However, the contribution to the total cross section increases for compound nucleus in the higher energy region (beyond 34 MeV). As the neutron energy reaches the intermediate region (~15 MeV), the pre-equilibrium reaction mechanism becomes dominant in the total cross section for the 80Se(n, α)77Ge reaction. Moreover, the contribution of the pre-equilibrium mechanism is approximately 30 % of the total cross section at 14.96 MeV. In contrast, direct reaction has a negligible contribution to the cross section of the 80Se(n, α)77Ge reaction in comparison with those of the other reaction mechanisms from the threshold to 40 MeV neutron energy.
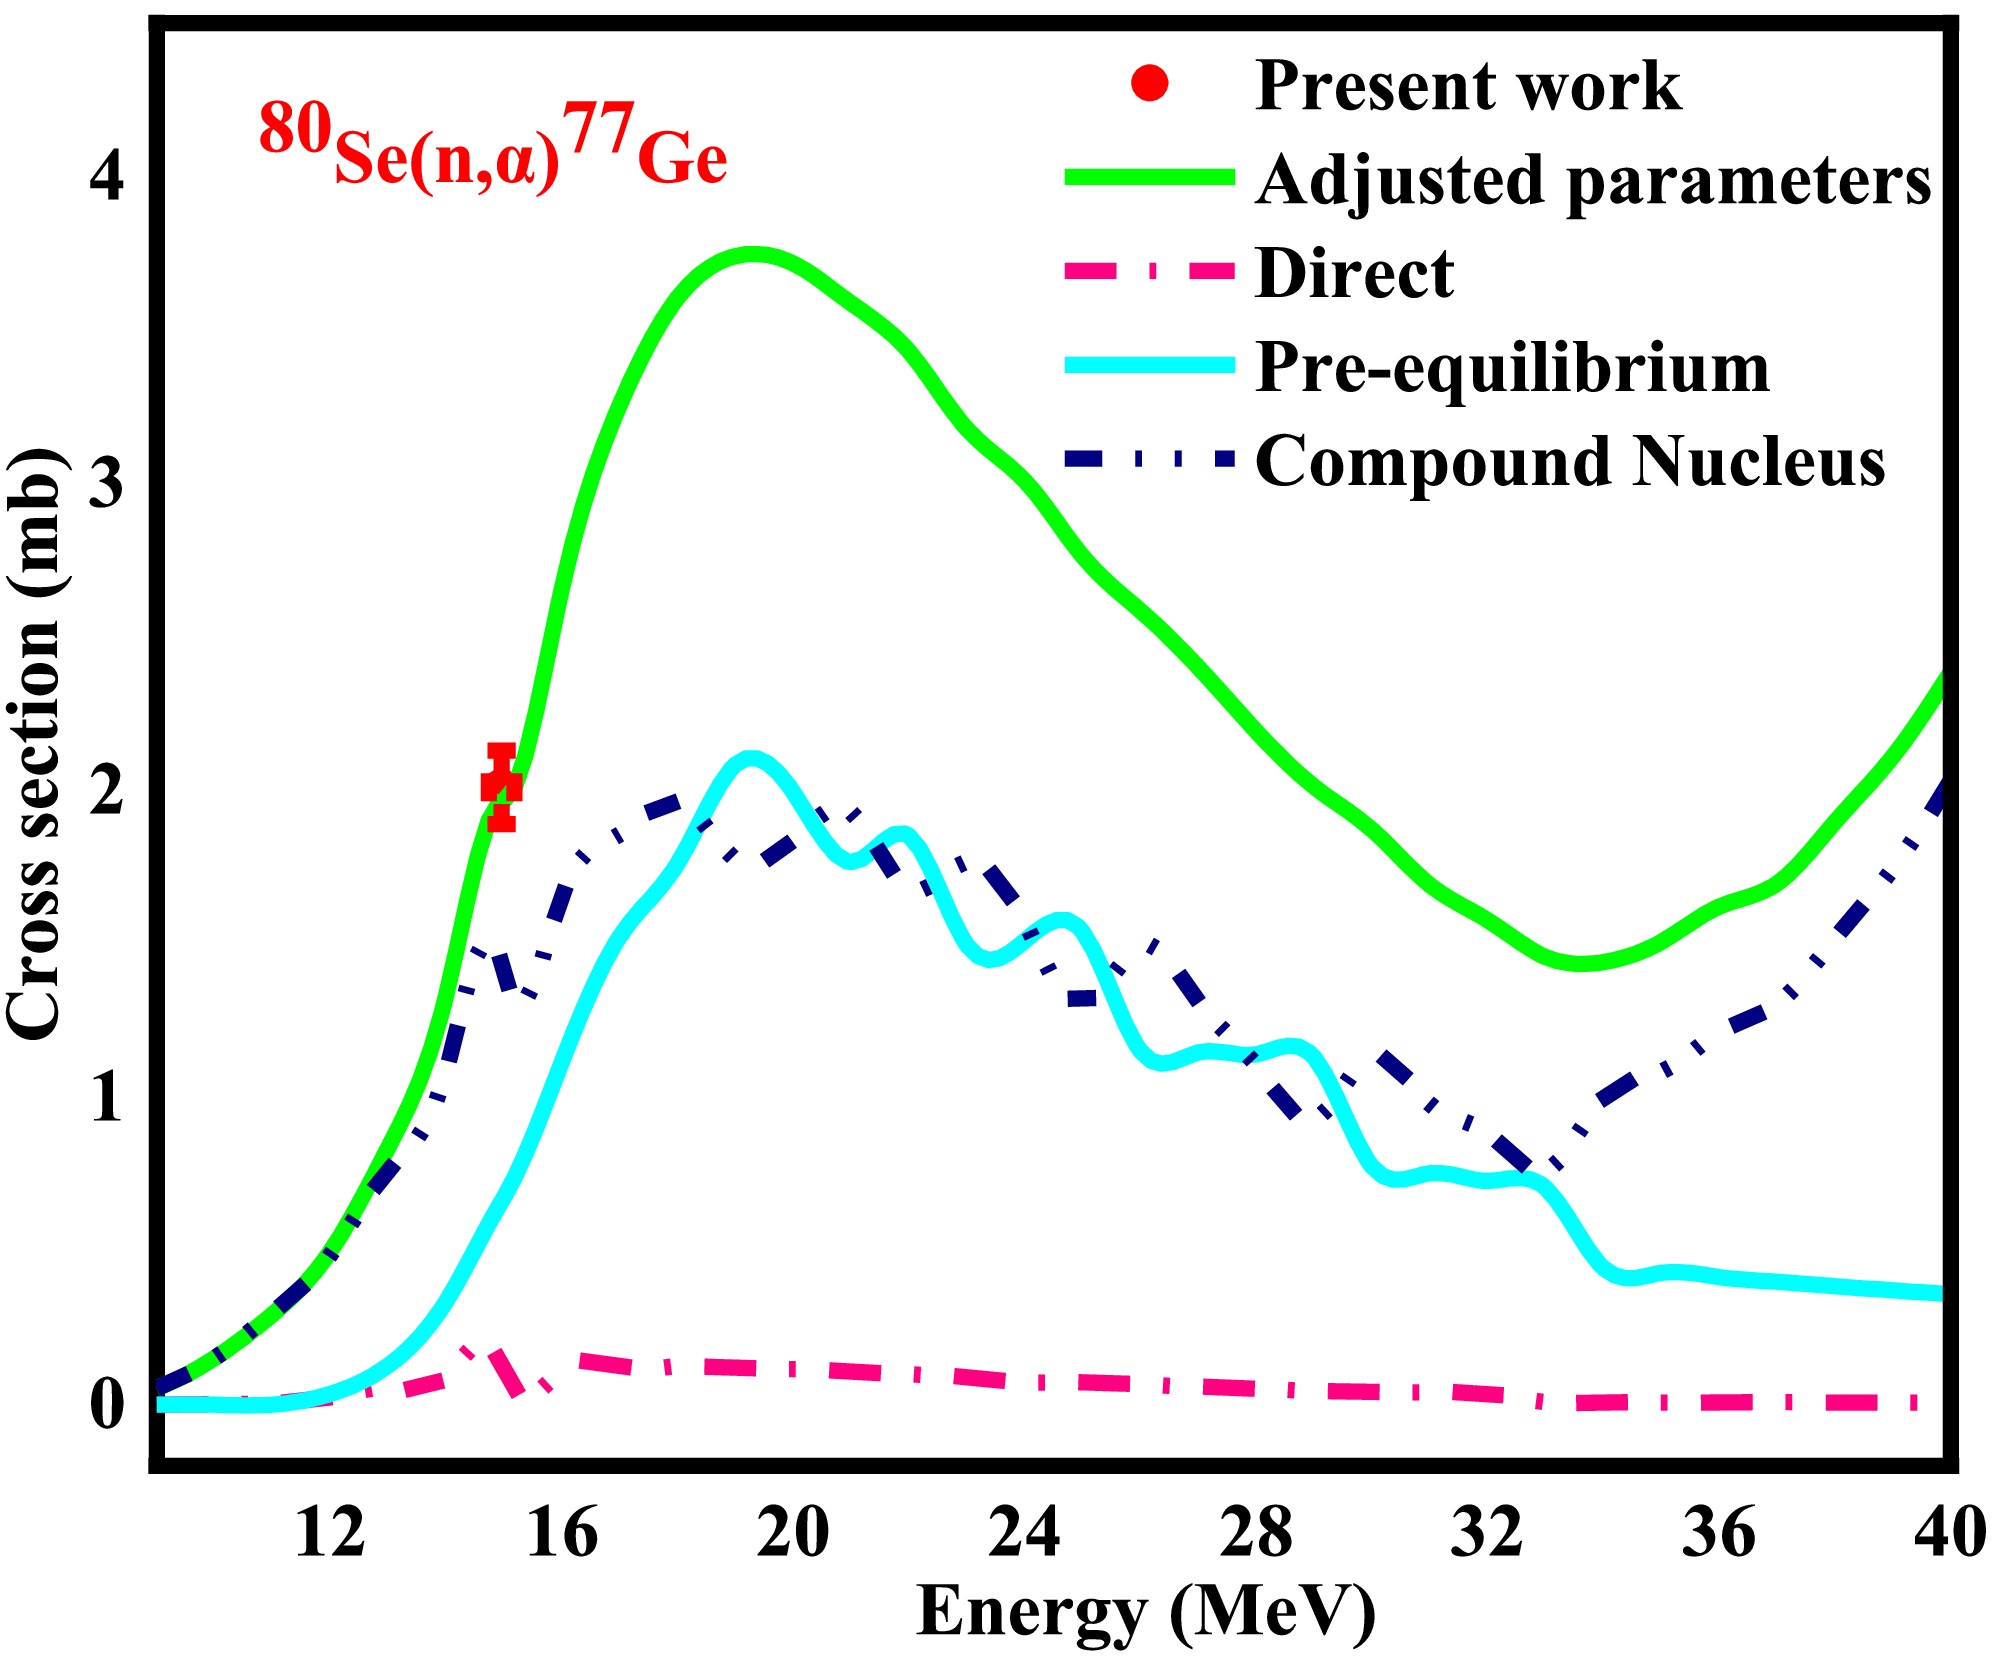
Figure 19. (color online) Comparison of the measured cross section using the adjusted parameters of TALYS and contribution to the cross section from various reaction mechanisms for the 80Se(n, α)77Ge reaction.
-
For the 76Se(n, p)76As reaction, the adjusted set of parameters (ldmodel 2, jlmomp, preeqmode 3, strength 9, and widthmode 1) reproduced the cross section of 54.23 mb at the neutron energy of 14.96 MeV. The cross section obtained using the adjusted parameters for the 76Se(n, p)76As reaction is in close agreement with the measured value in this study (55.30 mb), as depicted in Fig. 15. The Back Shifted Fermi Gas model (“ldmodel 2”) provides a realistic excitation energy dependence of the level density for the residual nucleus. Moreover, the JLM optical model has been optimized and validated for the spherical and quasi-spherical nuclei by using JLM implementation. Furthermore, the inclusion of “preeqmode 3” enhances the exciton based multistep pre-equilibrium emission. Therefore, the aforementioned parameters are adopted as an adjusted set of parameters to reproduce the 76Se(n, p)76As reaction cross section. At 14.96 MeV, the reaction is predominantly governed by a compound nucleus mechanism contributing 76.13 % of the total cross section, whereas the remaining 23.87 % arises from the pre-equilibrium mechanism (Table 11). The contribution of the pre-equilibrium mechanism increases with the elevation in the neutron energy. However, the compound nucleus mechanism decreases at higher energies. The calculated excitation curve for the 76Se(n, p)76As reaction shows a dominant contribution of the compound nucleus reaction mechanism in a low-energy range (< 12 MeV). However, the contribution of the pre-equilibrium reaction mechanism increases from the mid-range neutron energy (~15 MeV), and a negligible contribution can be seen for the compound nucleus reaction mechanism beyond the neutron energy of 20 MeV (Fig. 15).
Figure 15. (color online) Comparison of the measured cross section using the adjusted parameters of TALYS and contribution to the cross section from various reaction mechanisms for the 76Se(n, p)76As reaction.
The cross section estimated using the adjusted set of parameters of TALYS for the 78Se(n, p)78As reaction is slightly lower than the measured value (Fig. 16). “ldmodel 2” accounts for the pairing effect and level density enhancement in the odd-odd residual nucleus. Dispersive OMP uses a dispersion relation to connect the real and imaginary parts of the potential. A validated cross section suggests that the model accurately describes the shell-model potential and energies of the bound single-particle states of the target nucleus. Furthermore, “preeqmode 3” enables the estimation of the pre-equilibrium proton emission close to the neutron energy of 14 MeV. The contribution to the reaction cross section from the compound nucleus mechanism is more than three-fold that of the pre-equilibrium reaction mechanism. Moreover, it can be inferred that the compound reaction mechanism is dominant by 78.80 % over the pre-equilibrium (26.23 %) and direct reaction (4.97 %) mechanisms for the 78Se(n, p)78As reaction. However, the contributions of the pre-equilibrium reaction mechanism and compound reaction mechanism show contradictory trends for neutron energy (En) > 15 MeV. The pre-equilibrium contribution gradually increases whereas the contribution of the compound nucleus mechanism reduces after 15 MeV for the 78Se(n, p)78As reaction, as depicted in Fig 16.
Figure 16. (color online) Comparison of measured cross section using the adjusted parameters of TALYS and contributions to the cross section from various reaction mechanisms for the 78Se(n, p)78As reaction.
The cross section obtained using the adjusted set of parameters for the 82Se(n, 2n)81Seg reaction shows better agreement with the measured cross section, as depicted in Fig. 17. For the 82Se(n, 2n)81Seg reaction channel, “ldmodel 1” (Constant temperature model) provides a more realistic description of the level density near the neutron separation energy in neutron rich isotopes (82Se). Furthermore, the local Koning-Delaroche OMP (“localomp y”) improves the neutron transmission coefficients and normalizes the calculated cross section. The total reaction cross section is dominated by the compound nucleus mechanism, which contributes 100 % at the neutron energy of 14.96 MeV (Table 11). The contribution of the compound nucleus mechanism rises sharply immediately after the threshold energy, and then decreases with increasing neutron energy. However, the direct and pre-equilibrium reaction mechanisms have no contributions to the total cross section for the 82Se(n, 2n)81Seg reaction. Hence, the theoretical excitation curve reveals only the contribution of the compound reaction mechanism in the low and intermediate-energy region. At a higher energy (>24 MeV), the contribution of the pre-equilibrium mechanism gradually increases whereas that of the compound nucleus correspondingly decreases, as depicted in Fig. 17.
Figure 17. (color online) Comparison of the measured cross section using the adjusted parameters of TALYS and contribution to the cross section from various reaction mechanisms for the 82Se(n, 2n)81Seg reaction.
For the 76Se(n, 2n)75Se reaction, the cross section using the adjusted set of parameters is closely aligned with the measured cross section at the neutron energy of 14.96 MeV. Back-Shifted Fermi Gas model (“ldmodel 2”) ensures accurate modeling of the neutron emission probability and incorporates the pairing and shell effects. This suggests that the residual nucleus (75Se) exhibits a statistical compound nucleus behavior with a high density of the excited state. “localomp y” optical model potential optimizes the neutron transmission coefficients, and “preeqmode 3” enhances the description of the pre-equilibrium contributions at higher neutron energies. The theoretical excitation curve representing the contributions of the various reaction mechanisms of the 76Se(n, 2n)75Se reaction is depicted in Fig. 18. At 14.96 MeV, the compound reaction mechanism contributes 100 % to the total cross section, whereas owing to rapid statistical evaporation, the pre-equilibrium and direct reaction mechanisms have zero contributions, as mentioned in Table 11. Furthermore, in the low and intermediate energy regions, the contribution of the compound reaction mechanism is pre-dominant in the 76Se(n, 2n)75Se reaction. However, the pre-equilibrium mechanism fraction starts to increase beyond the neutron energy of 24 MeV (Fig. 18).
Figure 18. (color online) Comparison of the measured cross section using the adjusted parameters of TALYS and contribution to the cross section from various reaction mechanisms for the 76Se(n, 2n)75Se reaction.
The best agreement with the measured cross section is obtained through the adjusted parameters (ldmodel 5, localomp y, preeqmode 1, strength 9, and widthmode 1) for the 80Se(n, α)77Ge reaction. As can be seen in Fig. 19, the cross section obtained using the adjusted parameters increases with increase in the neutron energy up to 15 MeV. The inclusion of “ldmodel 5” provides the description of the spin parity distribution and nuclear structure of the residual nuclei (77Ge) in comparison with the other level density models. Furthermore, “localomp y” refines the neutron entrance and α exit channel transmission coefficients. The excitation curve of the 80Se(n, α)77Ge reaction in the low energy region shows the contribution of the compound nucleus reaction mechanism. The total cross section is predominantly governed by the compound nucleus mechanism (1.43 mb), and is 75.8 % of the total cross section at 14.96 MeV neutron energy. However, the contribution to the total cross section increases for compound nucleus in the higher energy region (beyond 34 MeV). As the neutron energy reaches the intermediate region (~15 MeV), the pre-equilibrium reaction mechanism becomes dominant in the total cross section for the 80Se(n, α)77Ge reaction. Moreover, the contribution of the pre-equilibrium mechanism is approximately 30 % of the total cross section at 14.96 MeV. In contrast, direct reaction has a negligible contribution to the cross section of the 80Se(n, α)77Ge reaction in comparison with those of the other reaction mechanisms from the threshold to 40 MeV neutron energy.
Figure 19. (color online) Comparison of the measured cross section using the adjusted parameters of TALYS and contribution to the cross section from various reaction mechanisms for the 80Se(n, α)77Ge reaction.
-
For the 76Se(n, p)76As reaction, the adjusted set of parameters (ldmodel 2, jlmomp, preeqmode 3, strength 9, and widthmode 1) reproduced the cross section of 54.23 mb at the neutron energy of 14.96 MeV. The cross section obtained using the adjusted parameters for the 76Se(n, p)76As reaction is in close agreement with the measured value in this study (55.30 mb), as depicted in Fig. 15. The Back Shifted Fermi Gas model (“ldmodel 2”) provides a realistic excitation energy dependence of the level density for the residual nucleus. Moreover, the JLM optical model has been optimized and validated for the spherical and quasi-spherical nuclei by using JLM implementation. Furthermore, the inclusion of “preeqmode 3” enhances the exciton based multistep pre-equilibrium emission. Therefore, the aforementioned parameters are adopted as an adjusted set of parameters to reproduce the 76Se(n, p)76As reaction cross section. At 14.96 MeV, the reaction is predominantly governed by a compound nucleus mechanism contributing 76.13 % of the total cross section, whereas the remaining 23.87 % arises from the pre-equilibrium mechanism (Table 11). The contribution of the pre-equilibrium mechanism increases with the elevation in the neutron energy. However, the compound nucleus mechanism decreases at higher energies. The calculated excitation curve for the 76Se(n, p)76As reaction shows a dominant contribution of the compound nucleus reaction mechanism in a low-energy range (< 12 MeV). However, the contribution of the pre-equilibrium reaction mechanism increases from the mid-range neutron energy (~15 MeV), and a negligible contribution can be seen for the compound nucleus reaction mechanism beyond the neutron energy of 20 MeV (Fig. 15).
Figure 15. (color online) Comparison of the measured cross section using the adjusted parameters of TALYS and contribution to the cross section from various reaction mechanisms for the 76Se(n, p)76As reaction.
The cross section estimated using the adjusted set of parameters of TALYS for the 78Se(n, p)78As reaction is slightly lower than the measured value (Fig. 16). “ldmodel 2” accounts for the pairing effect and level density enhancement in the odd-odd residual nucleus. Dispersive OMP uses a dispersion relation to connect the real and imaginary parts of the potential. A validated cross section suggests that the model accurately describes the shell-model potential and energies of the bound single-particle states of the target nucleus. Furthermore, “preeqmode 3” enables the estimation of the pre-equilibrium proton emission close to the neutron energy of 14 MeV. The contribution to the reaction cross section from the compound nucleus mechanism is more than three-fold that of the pre-equilibrium reaction mechanism. Moreover, it can be inferred that the compound reaction mechanism is dominant by 78.80 % over the pre-equilibrium (26.23 %) and direct reaction (4.97 %) mechanisms for the 78Se(n, p)78As reaction. However, the contributions of the pre-equilibrium reaction mechanism and compound reaction mechanism show contradictory trends for neutron energy (En) > 15 MeV. The pre-equilibrium contribution gradually increases whereas the contribution of the compound nucleus mechanism reduces after 15 MeV for the 78Se(n, p)78As reaction, as depicted in Fig 16.
Figure 16. (color online) Comparison of measured cross section using the adjusted parameters of TALYS and contributions to the cross section from various reaction mechanisms for the 78Se(n, p)78As reaction.
The cross section obtained using the adjusted set of parameters for the 82Se(n, 2n)81Seg reaction shows better agreement with the measured cross section, as depicted in Fig. 17. For the 82Se(n, 2n)81Seg reaction channel, “ldmodel 1” (Constant temperature model) provides a more realistic description of the level density near the neutron separation energy in neutron rich isotopes (82Se). Furthermore, the local Koning-Delaroche OMP (“localomp y”) improves the neutron transmission coefficients and normalizes the calculated cross section. The total reaction cross section is dominated by the compound nucleus mechanism, which contributes 100 % at the neutron energy of 14.96 MeV (Table 11). The contribution of the compound nucleus mechanism rises sharply immediately after the threshold energy, and then decreases with increasing neutron energy. However, the direct and pre-equilibrium reaction mechanisms have no contributions to the total cross section for the 82Se(n, 2n)81Seg reaction. Hence, the theoretical excitation curve reveals only the contribution of the compound reaction mechanism in the low and intermediate-energy region. At a higher energy (>24 MeV), the contribution of the pre-equilibrium mechanism gradually increases whereas that of the compound nucleus correspondingly decreases, as depicted in Fig. 17.
Figure 17. (color online) Comparison of the measured cross section using the adjusted parameters of TALYS and contribution to the cross section from various reaction mechanisms for the 82Se(n, 2n)81Seg reaction.
For the 76Se(n, 2n)75Se reaction, the cross section using the adjusted set of parameters is closely aligned with the measured cross section at the neutron energy of 14.96 MeV. Back-Shifted Fermi Gas model (“ldmodel 2”) ensures accurate modeling of the neutron emission probability and incorporates the pairing and shell effects. This suggests that the residual nucleus (75Se) exhibits a statistical compound nucleus behavior with a high density of the excited state. “localomp y” optical model potential optimizes the neutron transmission coefficients, and “preeqmode 3” enhances the description of the pre-equilibrium contributions at higher neutron energies. The theoretical excitation curve representing the contributions of the various reaction mechanisms of the 76Se(n, 2n)75Se reaction is depicted in Fig. 18. At 14.96 MeV, the compound reaction mechanism contributes 100 % to the total cross section, whereas owing to rapid statistical evaporation, the pre-equilibrium and direct reaction mechanisms have zero contributions, as mentioned in Table 11. Furthermore, in the low and intermediate energy regions, the contribution of the compound reaction mechanism is pre-dominant in the 76Se(n, 2n)75Se reaction. However, the pre-equilibrium mechanism fraction starts to increase beyond the neutron energy of 24 MeV (Fig. 18).
Figure 18. (color online) Comparison of the measured cross section using the adjusted parameters of TALYS and contribution to the cross section from various reaction mechanisms for the 76Se(n, 2n)75Se reaction.
The best agreement with the measured cross section is obtained through the adjusted parameters (ldmodel 5, localomp y, preeqmode 1, strength 9, and widthmode 1) for the 80Se(n, α)77Ge reaction. As can be seen in Fig. 19, the cross section obtained using the adjusted parameters increases with increase in the neutron energy up to 15 MeV. The inclusion of “ldmodel 5” provides the description of the spin parity distribution and nuclear structure of the residual nuclei (77Ge) in comparison with the other level density models. Furthermore, “localomp y” refines the neutron entrance and α exit channel transmission coefficients. The excitation curve of the 80Se(n, α)77Ge reaction in the low energy region shows the contribution of the compound nucleus reaction mechanism. The total cross section is predominantly governed by the compound nucleus mechanism (1.43 mb), and is 75.8 % of the total cross section at 14.96 MeV neutron energy. However, the contribution to the total cross section increases for compound nucleus in the higher energy region (beyond 34 MeV). As the neutron energy reaches the intermediate region (~15 MeV), the pre-equilibrium reaction mechanism becomes dominant in the total cross section for the 80Se(n, α)77Ge reaction. Moreover, the contribution of the pre-equilibrium mechanism is approximately 30 % of the total cross section at 14.96 MeV. In contrast, direct reaction has a negligible contribution to the cross section of the 80Se(n, α)77Ge reaction in comparison with those of the other reaction mechanisms from the threshold to 40 MeV neutron energy.
Figure 19. (color online) Comparison of the measured cross section using the adjusted parameters of TALYS and contribution to the cross section from various reaction mechanisms for the 80Se(n, α)77Ge reaction.
-
The semi empirical approach assesses the neutron – induced reaction cross sections using an exponential function, which includes the number of nucleons of the target nucleus. Such a formulation offers a more realistic description of the reaction mechanism, as it comprises both the equilibrium and non – preequilibrium reaction dynamics in the neutron energy range of 13.5−15 MeV [43]. In this study, the established formulae were applied to calculate the (n, p), (n, 2n), and (n, α) reaction cross sections for the Se isotopes, as shown in Tables 12, 13, and 14. Furthermore, a normalized deviation analysis was performed to identify the systematic formulae that best reproduce the experimental data. The measured cross sections of the 76Se(n, p)76As and 78Se(n, p)78As reactions are in concordance with the cross sections estimated by Doczi et al. and Levkovski et al. by using the systematic formula, respectively. In addition, the measured cross section of the 82Se(n, 2n)81Seg reaction is approximately half the cross section estimated using the empirical systematic formulae. This deviation originates from the mid-shell mass region of the Se isotope. In addition, the semi-empirical formulae rely on the global (N, Z, and A) parameters and do not account for the isomeric and structural properties of the residual nucleus (81Seg). Furthermore, the measured cross section of the 76Se(n, 2n)75Se reaction is aligned with the cross section calculated using the systematic formula of Bychkov et al. The cross section of the 80Se(n, α)77Ge reaction, obtained using the systematic formula of Luo et al., exceeds the measured value by approximately 37 %, as shown in Table 14.
Authors Formulae Mass-region 76Se(n, p)76As 78Se(n, p)78As *σ/mb §ND *σ/mb §ND Luo [44] σ(n, p) = 62.98 (A1/3 + 1)2 exp $ \left(-34.45\dfrac{(N-Z)}{A}\right) $ 46 ≤ A ≤ 196 45.94 −2.2 21.14 2.1 Forrest [45] σ(n, p) = 900 (A1/3 + 1)2 exp(-49.27 $ \dfrac{(N-Z)}{A} $
+ 197.1$ \dfrac{(N-Z{)}^{2}}{{A}^{2}} $ – 0.45A1/2)40 ≤ A ≤ 187 24.24 −7.5 21.67 2.5 Habbani [46] σ(n, p) = 60.34 (A1/3 + 1)2 exp $ \left(\dfrac{-34.44~(N-Z+1)}{A}\right) $ 28 ≤ A ≤ 208 44.07 −2.7 20.28 1.3 Doczi [47] σ(n, p) = 18.12 (A1/3 + 1)2 exp $ \left(\dfrac{-19.61\left(N-Z\right)}{A}+\dfrac{(N-Z{)}^{2}}{{A}^{2}}\right) $ 28 ≤ A ≤ 209 63.74 2.06 41.44 20.2 Kasugai [48] σ(n, p) = 1264 (N-Z+1) exp $ \left(\dfrac{-46.63~(N-Z+1)}{A}\right) $ 28 ≤ A ≤ 187 45.74 −2.4 19.37 0.5 Konno [49] σ(n, p) = 31.42 (A1/3 + 1)2 exp $ \left(\dfrac{-29.07~(N-Z)}{A}\right) $ 40 ≤ A ≤ 209 40.38 −3.6 21.02 2.0 Ait-Tahar [50] σ(n, p) = 90.68 (A1/3 + 1)2 exp $ \left(\dfrac{-34.48~(N-Z+1)}{A}\right) $ 40 ≤ A ≤ 187 41.89 −3.2 19.48 0.64 Levkovski [51] σ(n, p) = 50.21 (A1/3 + 1)2 exp $ \left(\dfrac{-33.8~(N-Z)}{A}\right) $ 40 ≤ A ≤ 209 39.22 −3.9 18.31 −0.4 *Cross section σ (in mb).
§ND denotes the normalized deviation.Table 12. Cross sections and normalized deviations using the systematic formulae for the (n, p) reaction cross section, reported by various authors for neutron energies of 13.5−15 MeV.
Authors Formulae Mass-region 82Se(n, 2n)81Seg 76Se(n, 2n)75Se *σ/mb §ND *σ/mb §ND Luo [44] σ(n, 2n) = 0.0226 (A1/3 + 1)2 exp $ \left(\dfrac{133.86~(N-Z)}{A}-\dfrac{779.47~(N-Z{)}^{2}}{{A}^{2}}+\dfrac{1500.51~(N-Z{)}^{3}}{{A}^{3}}\right) $ 23 ≤ A ≤ 209 1300.79 14.8 833.05 -1.2 Habbani [46] σ(n, 2n) = 20.82 (A1/3 + 1)2 exp $ \left(\dfrac{3.76~(N-Z+1)}{A}\right) $ 48 ≤ A ≤ 238
A- Even1183.04 12.7 890.89 -0.2 Chatterjee [52] σ(n, 2n) = 31.39 (A1/3 + 1)2 exp $ \left(\dfrac{1.706~(N-Z)}{A}\right) $ 45 ≤ A ≤ 238 1199.77 13.0 1029.79 2.2 Lu and Fink [53] σ(n, 2n) = 45.46 (A1/3 + 1)2 $ \left[1-\text{7.372 exp} \left(\dfrac{-32.21~(N-Z+1)}{A}\right)\right] $ 28 ≤ Z ≤ 82 1300.79 15.0 1050.52 2.6 Bychkov [54] σ(n, 2n) = 8.7 (A + 100) $ \left[1-\text{0.88 exp} \left(\dfrac{-7.95~(N-Z)}{A}\right)\right] $ 45 ≤ A ≤ 238 1547.54 19.8 947.64 0.7 *Cross section σ (in mb).
§ND denotes the normalized deviation.Table 13. Cross sections and normalized deviations using the systematic formulae for the (n, 2n) reaction cross section, reported by various authors for the neutron energies of 13.5−15 MeV.
Authors Formulae Mass-region 80Se(n, α)77Ge *σ/mb §ND Luo [44] σ(n, α) = 0.0226 (A1/3 + 1)2 exp $ \left(\dfrac{133.86~(N-Z)}{A}-\dfrac{779.47~(N-Z{)}^{2}}{{A}^{2}}+\dfrac{1500.51~(N-Z{)}^{3}}{{A}^{3}}\right) $ 23 ≤ A ≤ 209 3.23 10.2 Forrest [45] σ(n, α) = 24.71 (A1/3 + 1)2 exp(-19.77 $ \dfrac{(N-Z)}{A} $ + 13.82$ \dfrac{(N-Z{)}^{2}}{{A}^{2}} $ – 0.0248 A)20 ≤ Z ≤ 50 6.73 39.3 Habbani [46] σ(n, α) = 3.6 (A1/3 + 1)2 exp $ \left(\dfrac{-25~(N-Z-3)}{A}\right) $ 26 ≤ A ≤ 238
A- Even6.09 34.0 Kasugai [48] σ(n, α) = 227.86 exp $ \left(\dfrac{-24.66~(N-Z)}{A}\right) $ 19 ≤ A ≤ 202 5.63 30.2 Ait-Tahar [50] σ(n, α) = 45.46 (A1/3 + 1)2 exp $ \left(\dfrac{-32.75~(N-Z+1)}{A}\right) $ 40 ≤ A ≤ 188 4.35 19.5 Levkovski [51] σ(n, α) = 16.55 (A1/3 + 1)2 exp $ \left(\dfrac{-31.26~(N-Z)}{A}\right) $ 31 ≤ A ≤ 202 4.28 18.9 Csikai [55] σ(n, α) = 15.07 (A1/3 + 1)2 exp $ \left(\dfrac{-25.98~(N-Z)}{A}+\dfrac{(N-Z{)}^{2}}{{A}^{2}}\right) $ 19 ≤ A ≤ 202 8.81 56.7 *Cross section σ (in mb).
§ND denotes the normalized deviation.Table 14. Cross sections and normalized deviations using the systematic formulae for the (n, α) reaction cross section, reported by various authors for neutron energies of 13.5−15 MeV.
-
The semi empirical approach assesses the neutron – induced reaction cross sections using an exponential function, which includes the number of nucleons of the target nucleus. Such a formulation offers a more realistic description of the reaction mechanism, as it comprises both the equilibrium and non – preequilibrium reaction dynamics in the neutron energy range of 13.5−15 MeV [43]. In this study, the established formulae were applied to calculate the (n, p), (n, 2n), and (n, α) reaction cross sections for the Se isotopes, as shown in Tables 12, 13, and 14. Furthermore, a normalized deviation analysis was performed to identify the systematic formulae that best reproduce the experimental data. The measured cross sections of the 76Se(n, p)76As and 78Se(n, p)78As reactions are in concordance with the cross sections estimated by Doczi et al. and Levkovski et al. by using the systematic formula, respectively. In addition, the measured cross section of the 82Se(n, 2n)81Seg reaction is approximately half the cross section estimated using the empirical systematic formulae. This deviation originates from the mid-shell mass region of the Se isotope. In addition, the semi-empirical formulae rely on the global (N, Z, and A) parameters and do not account for the isomeric and structural properties of the residual nucleus (81Seg). Furthermore, the measured cross section of the 76Se(n, 2n)75Se reaction is aligned with the cross section calculated using the systematic formula of Bychkov et al. The cross section of the 80Se(n, α)77Ge reaction, obtained using the systematic formula of Luo et al., exceeds the measured value by approximately 37 %, as shown in Table 14.
Authors Formulae Mass-region 76Se(n, p)76As 78Se(n, p)78As *σ/mb §ND *σ/mb §ND Luo [44] σ(n, p) = 62.98 (A1/3 + 1)2 exp $ \left(-34.45\dfrac{(N-Z)}{A}\right) $ 46 ≤ A ≤ 196 45.94 −2.2 21.14 2.1 Forrest [45] σ(n, p) = 900 (A1/3 + 1)2 exp(-49.27 $ \dfrac{(N-Z)}{A} $
+ 197.1$ \dfrac{(N-Z{)}^{2}}{{A}^{2}} $ – 0.45A1/2)40 ≤ A ≤ 187 24.24 −7.5 21.67 2.5 Habbani [46] σ(n, p) = 60.34 (A1/3 + 1)2 exp $ \left(\dfrac{-34.44~(N-Z+1)}{A}\right) $ 28 ≤ A ≤ 208 44.07 −2.7 20.28 1.3 Doczi [47] σ(n, p) = 18.12 (A1/3 + 1)2 exp $ \left(\dfrac{-19.61\left(N-Z\right)}{A}+\dfrac{(N-Z{)}^{2}}{{A}^{2}}\right) $ 28 ≤ A ≤ 209 63.74 2.06 41.44 20.2 Kasugai [48] σ(n, p) = 1264 (N-Z+1) exp $ \left(\dfrac{-46.63~(N-Z+1)}{A}\right) $ 28 ≤ A ≤ 187 45.74 −2.4 19.37 0.5 Konno [49] σ(n, p) = 31.42 (A1/3 + 1)2 exp $ \left(\dfrac{-29.07~(N-Z)}{A}\right) $ 40 ≤ A ≤ 209 40.38 −3.6 21.02 2.0 Ait-Tahar [50] σ(n, p) = 90.68 (A1/3 + 1)2 exp $ \left(\dfrac{-34.48~(N-Z+1)}{A}\right) $ 40 ≤ A ≤ 187 41.89 −3.2 19.48 0.64 Levkovski [51] σ(n, p) = 50.21 (A1/3 + 1)2 exp $ \left(\dfrac{-33.8~(N-Z)}{A}\right) $ 40 ≤ A ≤ 209 39.22 −3.9 18.31 −0.4 *Cross section σ (in mb).
§ND denotes the normalized deviation.Table 12. Cross sections and normalized deviations using the systematic formulae for the (n, p) reaction cross section, reported by various authors for neutron energies of 13.5−15 MeV.
Authors Formulae Mass-region 82Se(n, 2n)81Seg 76Se(n, 2n)75Se *σ/mb §ND *σ/mb §ND Luo [44] σ(n, 2n) = 0.0226 (A1/3 + 1)2 exp $ \left(\dfrac{133.86~(N-Z)}{A}-\dfrac{779.47~(N-Z{)}^{2}}{{A}^{2}}+\dfrac{1500.51~(N-Z{)}^{3}}{{A}^{3}}\right) $ 23 ≤ A ≤ 209 1300.79 14.8 833.05 -1.2 Habbani [46] σ(n, 2n) = 20.82 (A1/3 + 1)2 exp $ \left(\dfrac{3.76~(N-Z+1)}{A}\right) $ 48 ≤ A ≤ 238
A- Even1183.04 12.7 890.89 -0.2 Chatterjee [52] σ(n, 2n) = 31.39 (A1/3 + 1)2 exp $ \left(\dfrac{1.706~(N-Z)}{A}\right) $ 45 ≤ A ≤ 238 1199.77 13.0 1029.79 2.2 Lu and Fink [53] σ(n, 2n) = 45.46 (A1/3 + 1)2 $ \left[1-\text{7.372 exp} \left(\dfrac{-32.21~(N-Z+1)}{A}\right)\right] $ 28 ≤ Z ≤ 82 1300.79 15.0 1050.52 2.6 Bychkov [54] σ(n, 2n) = 8.7 (A + 100) $ \left[1-\text{0.88 exp} \left(\dfrac{-7.95~(N-Z)}{A}\right)\right] $ 45 ≤ A ≤ 238 1547.54 19.8 947.64 0.7 *Cross section σ (in mb).
§ND denotes the normalized deviation.Table 13. Cross sections and normalized deviations using the systematic formulae for the (n, 2n) reaction cross section, reported by various authors for the neutron energies of 13.5−15 MeV.
Authors Formulae Mass-region 80Se(n, α)77Ge *σ/mb §ND Luo [44] σ(n, α) = 0.0226 (A1/3 + 1)2 exp $ \left(\dfrac{133.86~(N-Z)}{A}-\dfrac{779.47~(N-Z{)}^{2}}{{A}^{2}}+\dfrac{1500.51~(N-Z{)}^{3}}{{A}^{3}}\right) $ 23 ≤ A ≤ 209 3.23 10.2 Forrest [45] σ(n, α) = 24.71 (A1/3 + 1)2 exp(-19.77 $ \dfrac{(N-Z)}{A} $ + 13.82$ \dfrac{(N-Z{)}^{2}}{{A}^{2}} $ – 0.0248 A)20 ≤ Z ≤ 50 6.73 39.3 Habbani [46] σ(n, α) = 3.6 (A1/3 + 1)2 exp $ \left(\dfrac{-25~(N-Z-3)}{A}\right) $ 26 ≤ A ≤ 238
A- Even6.09 34.0 Kasugai [48] σ(n, α) = 227.86 exp $ \left(\dfrac{-24.66~(N-Z)}{A}\right) $ 19 ≤ A ≤ 202 5.63 30.2 Ait-Tahar [50] σ(n, α) = 45.46 (A1/3 + 1)2 exp $ \left(\dfrac{-32.75~(N-Z+1)}{A}\right) $ 40 ≤ A ≤ 188 4.35 19.5 Levkovski [51] σ(n, α) = 16.55 (A1/3 + 1)2 exp $ \left(\dfrac{-31.26~(N-Z)}{A}\right) $ 31 ≤ A ≤ 202 4.28 18.9 Csikai [55] σ(n, α) = 15.07 (A1/3 + 1)2 exp $ \left(\dfrac{-25.98~(N-Z)}{A}+\dfrac{(N-Z{)}^{2}}{{A}^{2}}\right) $ 19 ≤ A ≤ 202 8.81 56.7 *Cross section σ (in mb).
§ND denotes the normalized deviation.Table 14. Cross sections and normalized deviations using the systematic formulae for the (n, α) reaction cross section, reported by various authors for neutron energies of 13.5−15 MeV.
-
The semi empirical approach assesses the neutron – induced reaction cross sections using an exponential function, which includes the number of nucleons of the target nucleus. Such a formulation offers a more realistic description of the reaction mechanism, as it comprises both the equilibrium and non – preequilibrium reaction dynamics in the neutron energy range of 13.5−15 MeV [43]. In this study, the established formulae were applied to calculate the (n, p), (n, 2n), and (n, α) reaction cross sections for the Se isotopes, as shown in Tables 12, 13, and 14. Furthermore, a normalized deviation analysis was performed to identify the systematic formulae that best reproduce the experimental data. The measured cross sections of the 76Se(n, p)76As and 78Se(n, p)78As reactions are in concordance with the cross sections estimated by Doczi et al. and Levkovski et al. by using the systematic formula, respectively. In addition, the measured cross section of the 82Se(n, 2n)81Seg reaction is approximately half the cross section estimated using the empirical systematic formulae. This deviation originates from the mid-shell mass region of the Se isotope. In addition, the semi-empirical formulae rely on the global (N, Z, and A) parameters and do not account for the isomeric and structural properties of the residual nucleus (81Seg). Furthermore, the measured cross section of the 76Se(n, 2n)75Se reaction is aligned with the cross section calculated using the systematic formula of Bychkov et al. The cross section of the 80Se(n, α)77Ge reaction, obtained using the systematic formula of Luo et al., exceeds the measured value by approximately 37 %, as shown in Table 14.
Authors Formulae Mass-region 76Se(n, p)76As 78Se(n, p)78As *σ/mb §ND *σ/mb §ND Luo [44] σ(n, p) = 62.98 (A1/3 + 1)2 exp $ \left(-34.45\dfrac{(N-Z)}{A}\right) $ 46 ≤ A ≤ 196 45.94 −2.2 21.14 2.1 Forrest [45] σ(n, p) = 900 (A1/3 + 1)2 exp(-49.27 $ \dfrac{(N-Z)}{A} $
+ 197.1$ \dfrac{(N-Z{)}^{2}}{{A}^{2}} $ – 0.45A1/2)40 ≤ A ≤ 187 24.24 −7.5 21.67 2.5 Habbani [46] σ(n, p) = 60.34 (A1/3 + 1)2 exp $ \left(\dfrac{-34.44~(N-Z+1)}{A}\right) $ 28 ≤ A ≤ 208 44.07 −2.7 20.28 1.3 Doczi [47] σ(n, p) = 18.12 (A1/3 + 1)2 exp $ \left(\dfrac{-19.61\left(N-Z\right)}{A}+\dfrac{(N-Z{)}^{2}}{{A}^{2}}\right) $ 28 ≤ A ≤ 209 63.74 2.06 41.44 20.2 Kasugai [48] σ(n, p) = 1264 (N-Z+1) exp $ \left(\dfrac{-46.63~(N-Z+1)}{A}\right) $ 28 ≤ A ≤ 187 45.74 −2.4 19.37 0.5 Konno [49] σ(n, p) = 31.42 (A1/3 + 1)2 exp $ \left(\dfrac{-29.07~(N-Z)}{A}\right) $ 40 ≤ A ≤ 209 40.38 −3.6 21.02 2.0 Ait-Tahar [50] σ(n, p) = 90.68 (A1/3 + 1)2 exp $ \left(\dfrac{-34.48~(N-Z+1)}{A}\right) $ 40 ≤ A ≤ 187 41.89 −3.2 19.48 0.64 Levkovski [51] σ(n, p) = 50.21 (A1/3 + 1)2 exp $ \left(\dfrac{-33.8~(N-Z)}{A}\right) $ 40 ≤ A ≤ 209 39.22 −3.9 18.31 −0.4 *Cross section σ (in mb).
§ND denotes the normalized deviation.Table 12. Cross sections and normalized deviations using the systematic formulae for the (n, p) reaction cross section, reported by various authors for neutron energies of 13.5−15 MeV.
Authors Formulae Mass-region 82Se(n, 2n)81Seg 76Se(n, 2n)75Se *σ/mb §ND *σ/mb §ND Luo [44] σ(n, 2n) = 0.0226 (A1/3 + 1)2 exp $ \left(\dfrac{133.86~(N-Z)}{A}-\dfrac{779.47~(N-Z{)}^{2}}{{A}^{2}}+\dfrac{1500.51~(N-Z{)}^{3}}{{A}^{3}}\right) $ 23 ≤ A ≤ 209 1300.79 14.8 833.05 -1.2 Habbani [46] σ(n, 2n) = 20.82 (A1/3 + 1)2 exp $ \left(\dfrac{3.76~(N-Z+1)}{A}\right) $ 48 ≤ A ≤ 238
A- Even1183.04 12.7 890.89 -0.2 Chatterjee [52] σ(n, 2n) = 31.39 (A1/3 + 1)2 exp $ \left(\dfrac{1.706~(N-Z)}{A}\right) $ 45 ≤ A ≤ 238 1199.77 13.0 1029.79 2.2 Lu and Fink [53] σ(n, 2n) = 45.46 (A1/3 + 1)2 $ \left[1-\text{7.372 exp} \left(\dfrac{-32.21~(N-Z+1)}{A}\right)\right] $ 28 ≤ Z ≤ 82 1300.79 15.0 1050.52 2.6 Bychkov [54] σ(n, 2n) = 8.7 (A + 100) $ \left[1-\text{0.88 exp} \left(\dfrac{-7.95~(N-Z)}{A}\right)\right] $ 45 ≤ A ≤ 238 1547.54 19.8 947.64 0.7 *Cross section σ (in mb).
§ND denotes the normalized deviation.Table 13. Cross sections and normalized deviations using the systematic formulae for the (n, 2n) reaction cross section, reported by various authors for the neutron energies of 13.5−15 MeV.
Authors Formulae Mass-region 80Se(n, α)77Ge *σ/mb §ND Luo [44] σ(n, α) = 0.0226 (A1/3 + 1)2 exp $ \left(\dfrac{133.86~(N-Z)}{A}-\dfrac{779.47~(N-Z{)}^{2}}{{A}^{2}}+\dfrac{1500.51~(N-Z{)}^{3}}{{A}^{3}}\right) $ 23 ≤ A ≤ 209 3.23 10.2 Forrest [45] σ(n, α) = 24.71 (A1/3 + 1)2 exp(-19.77 $ \dfrac{(N-Z)}{A} $ + 13.82$ \dfrac{(N-Z{)}^{2}}{{A}^{2}} $ – 0.0248 A)20 ≤ Z ≤ 50 6.73 39.3 Habbani [46] σ(n, α) = 3.6 (A1/3 + 1)2 exp $ \left(\dfrac{-25~(N-Z-3)}{A}\right) $ 26 ≤ A ≤ 238
A- Even6.09 34.0 Kasugai [48] σ(n, α) = 227.86 exp $ \left(\dfrac{-24.66~(N-Z)}{A}\right) $ 19 ≤ A ≤ 202 5.63 30.2 Ait-Tahar [50] σ(n, α) = 45.46 (A1/3 + 1)2 exp $ \left(\dfrac{-32.75~(N-Z+1)}{A}\right) $ 40 ≤ A ≤ 188 4.35 19.5 Levkovski [51] σ(n, α) = 16.55 (A1/3 + 1)2 exp $ \left(\dfrac{-31.26~(N-Z)}{A}\right) $ 31 ≤ A ≤ 202 4.28 18.9 Csikai [55] σ(n, α) = 15.07 (A1/3 + 1)2 exp $ \left(\dfrac{-25.98~(N-Z)}{A}+\dfrac{(N-Z{)}^{2}}{{A}^{2}}\right) $ 19 ≤ A ≤ 202 8.81 56.7 *Cross section σ (in mb).
§ND denotes the normalized deviation.Table 14. Cross sections and normalized deviations using the systematic formulae for the (n, α) reaction cross section, reported by various authors for neutron energies of 13.5−15 MeV.
-
The measured cross sections of the 76Se(n, p)76As, 78Se(n, p)78As, 82Se(n, 2n)81Seg, 76Se(n, 2n)75Se, and 80Se(n, α)77Ge reactions are 55.30 ± 4.09 mb, 18.77 ± 1.12 mb, 529.78 ± 51.23 mb, 903.98 ± 55.99 mb, and 2.01 ± 0.12 mb, respectively. The measured cross sections with minimum statistical uncertainty are consistent with the previously reported data (EXFOR). However, the cross section of the 82Se(n, 2n)81Seg reaction exceeds the latest reported data of A. A. Filatenkov et al. by approximately 29.7 %. The measured cross sections are consistent with the excitation curve of the evaluated library data. Across all level density models, the (n, 2n) reaction cross sections are significantly higher than those of the other reaction channels at the neutron energy of 14.96 MeV. Furthermore, most of the studied reaction channels were adequately reproduced using the adjusted (optimal) set of parameters, except for the 78Se(n, p)78As reaction. In addition, the γ ray SFM, i.e., strength 1 and strength 2, employed for the 82Se(n, 2n)81Seg and 76Se(n, 2n)75Se reactions, respectively, were modified. Despite this, only the measured cross section for the 80Se(n, α)77Ge reaction is in concordance with that obtained using the semi- empirical systematic formulae of Luo et al. Therefore, the precise measurements of the cross sections for the selected isotopes of Se could significantly enhance the accuracy of the calculations using the statistical model and semi- empirical systematic formulae, thus contributing to more robust future evaluations.
-
The measured cross sections of the 76Se(n, p)76As, 78Se(n, p)78As, 82Se(n, 2n)81Seg, 76Se(n, 2n)75Se, and 80Se(n, α)77Ge reactions are 55.30 ± 4.09 mb, 18.77 ± 1.12 mb, 529.78 ± 51.23 mb, 903.98 ± 55.99 mb, and 2.01 ± 0.12 mb, respectively. The measured cross sections with minimum statistical uncertainty are consistent with the previously reported data (EXFOR). However, the cross section of the 82Se(n, 2n)81Seg reaction exceeds the latest reported data of A. A. Filatenkov et al. by approximately 29.7 %. The measured cross sections are consistent with the excitation curve of the evaluated library data. Across all level density models, the (n, 2n) reaction cross sections are significantly higher than those of the other reaction channels at the neutron energy of 14.96 MeV. Furthermore, most of the studied reaction channels were adequately reproduced using the adjusted (optimal) set of parameters, except for the 78Se(n, p)78As reaction. In addition, the γ ray SFM, i.e., strength 1 and strength 2, employed for the 82Se(n, 2n)81Seg and 76Se(n, 2n)75Se reactions, respectively, were modified. Despite this, only the measured cross section for the 80Se(n, α)77Ge reaction is in concordance with that obtained using the semi- empirical systematic formulae of Luo et al. Therefore, the precise measurements of the cross sections for the selected isotopes of Se could significantly enhance the accuracy of the calculations using the statistical model and semi- empirical systematic formulae, thus contributing to more robust future evaluations.
-
The measured cross sections of the 76Se(n, p)76As, 78Se(n, p)78As, 82Se(n, 2n)81Seg, 76Se(n, 2n)75Se, and 80Se(n, α)77Ge reactions are 55.30 ± 4.09 mb, 18.77 ± 1.12 mb, 529.78 ± 51.23 mb, 903.98 ± 55.99 mb, and 2.01 ± 0.12 mb, respectively. The measured cross sections with minimum statistical uncertainty are consistent with the previously reported data (EXFOR). However, the cross section of the 82Se(n, 2n)81Seg reaction exceeds the latest reported data of A. A. Filatenkov et al. by approximately 29.7 %. The measured cross sections are consistent with the excitation curve of the evaluated library data. Across all level density models, the (n, 2n) reaction cross sections are significantly higher than those of the other reaction channels at the neutron energy of 14.96 MeV. Furthermore, most of the studied reaction channels were adequately reproduced using the adjusted (optimal) set of parameters, except for the 78Se(n, p)78As reaction. In addition, the γ ray SFM, i.e., strength 1 and strength 2, employed for the 82Se(n, 2n)81Seg and 76Se(n, 2n)75Se reactions, respectively, were modified. Despite this, only the measured cross section for the 80Se(n, α)77Ge reaction is in concordance with that obtained using the semi- empirical systematic formulae of Luo et al. Therefore, the precise measurements of the cross sections for the selected isotopes of Se could significantly enhance the accuracy of the calculations using the statistical model and semi- empirical systematic formulae, thus contributing to more robust future evaluations.
Neutron-induced reaction cross sections of selenium isotopes at 14−15 MeV: Activation measurements and covariance analysis
- Received Date: 2025-12-03
- Available Online: 2026-10-15
Abstract: Neutron-induced reaction cross sections of Se isotopes were investigated using the activation technique via 3H(D, n)4He (D-T) fusion reaction at the Neutron and Ion Irradiation Facility (NIIF) of the Institute for Plasma Research (IPR), India. The emitted gamma (γ) ray from a radioactive sample (Se) was examined using a High Purity Germanium (HPGe) detector. The measured cross sections of 76Se(n, p)76As, 78Se(n, p)78As, 82Se(n, 2n)81Seg, 76Se(n, 2n)75Se, and 80Se(n, α)77Ge are 55.30 ± 4.09 mb, 18.77 ± 1.12 mb, 529.78 ± 51.23 mb, 903.98 ± 55.99 mb, and 2.01 ± 0.12 mb, respectively, at the neutron energy of 14.96 ± 0.22 MeV. The detailed uncertainty propagation from the various parameters and cross-correlation of the aforementioned reactions was estimated using covariance analysis. Furthermore, the measured cross sections were compared with the EXFOR database and evaluated nuclear libraries (ENDF/B-VIII.1, JEFF-4.0, JENDL-5, TENDL-2023 and CENDL-3.2). The cross sections were also reproduced theoretically using TALYS 2.0 code with an adjusted (optimized) set of parameters, and the contributions of various nuclear reaction mechanisms to the cross section were systematically analyzed and discussed. In addition, the measured reaction cross sections were quantified using various established semi-empirical systematic formulae. This study also performed statistical validation via chi-square minimization to identify the theoretical models and semi-empirical formulae that accurately reproduce the best measured cross section.



 DownLoad: