


 Abstract
 HTML
HTML Reference
 Related
 PDF
PDF


-
With the continuous development of the global economy and the sustained growth of the population, energy demand is also rising steadily. Although traditional fossil fuels currently dominate the energy supply, their reserves are limited. Global climate change is one of the major challenges facing humanity today. The extensive combustion of fossil fuels emits large quantities of greenhouse gases and pollutants, leading to a series of environmental issues. To address climate change, countries around the world have begun to increase the development and utilization of clean energy. Renewable energy sources such as wind and solar power are significantly affected by weather and seasons, exhibiting intermittency and instability. Nuclear energy, unaffected by weather or time constraints, can ensure the continuity of energy supply. Simultaneously, nuclear power not only has a high energy density but also does not produce greenhouse gases or other pollutants during operation, thereby attracting significant attention.
Nuclear data, which serve as a bridge between fundamental nuclear physics and its applications in nuclear engineering and technology, play a crucial role in the utilization and development of nuclear energy [1]. Among these, fission product yield (FPY) is one of the fundamental nuclear data sets in nuclear energy, science, and engineering research. It is indispensable in fields such as basic nuclear physics studies, reactor design and operation, spent fuel treatment, nuclear waste management, and nuclear material safeguards. 238U is a fertile material for breeding 239Pu, the primary fissile fuel in Gen-IV reactors, while also constituting an essential component of the fuel assemblies. The FPYs of 238U are important for advanced nuclear energy systems, particularly Fast Breeder Reactors (FBRs) and Accelerator Driven Subcritical Systems (ADSs) [2]. These yield data serve as a critical benchmark for applied reactor physics, including burnup calculations, decay heat estimation, and fuel breeding assessment, as well as for validating fundamental fission models, such as the multi-channel fission model and Monte Carlo simulations. Furthermore, analysis of the yield distribution provides critical insights into the fission mechanism of heavy nuclei and the associated shell effects and dynamics during fragment formation [3].
In the study of fission yields, neutron-induced fission is the most common and significant type. A variety of methods are employed to determine neutron-induced FPYs. While both radiochemistry and mass spectrometry can measure nearly all such products, each technique faces distinct challenges [4]. A major limitation of radiochemistry is its time-consuming nature and the complex procedural workflow. Although mass spectrometry achieves high accuracy in fission product measurement, its application is limited by the half-lives of the fission products [5]. Advances in detection technology, have enabled high-resolution semiconductor detectors to measure γ-ray spectra from samples directly. Consequently, direct γ-ray spectrometry has progressively become the mainstream method for studying FPYs [6].
The study of the induced fission yield of 238U at 3 MeV neutrons was first reported in 1951 by Engelkemeir et al. [7]. In 1954, Keller et al. reported yields of 15 fission products from 238U induced at an average neutron energy of 2.8 MeV, and essentially determined the shape of the chain-yield curve [8]. In 1961, Levy et al. reported the fission yields for twelve mass chains at a neutron energy of 2.5 MeV [9]. In 1975, Harvey et al. measured the absolute fission yields of 32 nuclides in the range of A=83−151 using β counting, and observed the fine structure of the yield curve at A=134 [10]. In 1977, Crouch summarized and compiled the fission yield results of bombarding Th, U, Pu, and other fissile nuclei with thermal neutrons, fast neutrons, 1.1, 3, 11, and 14 MeV neutrons [11]. In 1984, the fission yield group of the CIAE used the radiochemical method to measure the fission yield of several 238U nuclides at 5 MeV [12]. In 2001, using an Am-Be neutron source, I. Celenk obtained the yield data for 34 fission products from 238U at approximately 5 MeV [13]. In 2013, to investigate the effect of excitation energy on nuclear structure effects, H. Naik studied the yields of various fission products in the 3.72, 5.42, 7.75, and 10.09 MeV quasi-monoenergetic neutron-induced fission of 238U [14]. In 2016, Gooden et al. employed a Tandem Van de Graaff accelerator to generate 0.5−14.8 MeV monoenergetic neutrons for investigating the energy dependence of FPYs from 235U, 238U, and 239Pu [4]. In 2025, Tonchev et al. comprehensively and systematically summarized all of the high-yield FPY data obtained for 235U, 238U, and 239Pu isotopes using quasi-monoenergetic neutron beams at 11 incident energies ranging from 0.5−14.8 MeV [15].
A survey of the fission yield data for 238U reveals a significant data gap in the 2−3 MeV neutron energy region. Although physicists have conducted experimental measurements of some FPYs, the existing data in this region are notably scarce, inconsistent, and subject to large uncertainties. This limitation hinders the establishment of a comprehensive and reliable yield database. Consequently, more precise measurements of fission yield in this specific energy range are imperative. Furthermore, for the energy dependence of fission yields, it is essential to measure as many different energy points as possible to validate the correlation between FPYs and incident neutron energy rigorously. To address the lack of FPY issue of 238U in the 2−3 MeV energy range, this work employed a High-Purity Germanium (HPGe) detector to measure the activities of fission products from 238U. Through careful calculation and analysis of the experimental data, high-precision cumulative yields for seven fission products at a neutron energy of 2.9 MeV were determined.
-
With the continuous development of the global economy and the sustained growth of the population, energy demand is also rising steadily. Although traditional fossil fuels currently dominate the energy supply, their reserves are limited. Global climate change is one of the major challenges facing humanity today. The extensive combustion of fossil fuels emits large quantities of greenhouse gases and pollutants, leading to a series of environmental issues. To address climate change, countries around the world have begun to increase the development and utilization of clean energy. Renewable energy sources such as wind and solar power are significantly affected by weather and seasons, exhibiting intermittency and instability. Nuclear energy, unaffected by weather or time constraints, can ensure the continuity of energy supply. Simultaneously, nuclear power not only has a high energy density but also does not produce greenhouse gases or other pollutants during operation, thereby attracting significant attention.
Nuclear data, which serve as a bridge between fundamental nuclear physics and its applications in nuclear engineering and technology, play a crucial role in the utilization and development of nuclear energy [1]. Among these, fission product yield (FPY) is one of the fundamental nuclear data sets in nuclear energy, science, and engineering research. It is indispensable in fields such as basic nuclear physics studies, reactor design and operation, spent fuel treatment, nuclear waste management, and nuclear material safeguards. 238U is a fertile material for breeding 239Pu, the primary fissile fuel in Gen-IV reactors, while also constituting an essential component of the fuel assemblies. The FPYs of 238U are important for advanced nuclear energy systems, particularly Fast Breeder Reactors (FBRs) and Accelerator Driven Subcritical Systems (ADSs) [2]. These yield data serve as a critical benchmark for applied reactor physics, including burnup calculations, decay heat estimation, and fuel breeding assessment, as well as for validating fundamental fission models, such as the multi-channel fission model and Monte Carlo simulations. Furthermore, analysis of the yield distribution provides critical insights into the fission mechanism of heavy nuclei and the associated shell effects and dynamics during fragment formation [3].
In the study of fission yields, neutron-induced fission is the most common and significant type. A variety of methods are employed to determine neutron-induced FPYs. While both radiochemistry and mass spectrometry can measure nearly all such products, each technique faces distinct challenges [4]. A major limitation of radiochemistry is its time-consuming nature and the complex procedural workflow. Although mass spectrometry achieves high accuracy in fission product measurement, its application is limited by the half-lives of the fission products [5]. Advances in detection technology, have enabled high-resolution semiconductor detectors to measure γ-ray spectra from samples directly. Consequently, direct γ-ray spectrometry has progressively become the mainstream method for studying FPYs [6].
The study of the induced fission yield of 238U at 3 MeV neutrons was first reported in 1951 by Engelkemeir et al. [7]. In 1954, Keller et al. reported yields of 15 fission products from 238U induced at an average neutron energy of 2.8 MeV, and essentially determined the shape of the chain-yield curve [8]. In 1961, Levy et al. reported the fission yields for twelve mass chains at a neutron energy of 2.5 MeV [9]. In 1975, Harvey et al. measured the absolute fission yields of 32 nuclides in the range of A=83−151 using β counting, and observed the fine structure of the yield curve at A=134 [10]. In 1977, Crouch summarized and compiled the fission yield results of bombarding Th, U, Pu, and other fissile nuclei with thermal neutrons, fast neutrons, 1.1, 3, 11, and 14 MeV neutrons [11]. In 1984, the fission yield group of the CIAE used the radiochemical method to measure the fission yield of several 238U nuclides at 5 MeV [12]. In 2001, using an Am-Be neutron source, I. Celenk obtained the yield data for 34 fission products from 238U at approximately 5 MeV [13]. In 2013, to investigate the effect of excitation energy on nuclear structure effects, H. Naik studied the yields of various fission products in the 3.72, 5.42, 7.75, and 10.09 MeV quasi-monoenergetic neutron-induced fission of 238U [14]. In 2016, Gooden et al. employed a Tandem Van de Graaff accelerator to generate 0.5−14.8 MeV monoenergetic neutrons for investigating the energy dependence of FPYs from 235U, 238U, and 239Pu [4]. In 2025, Tonchev et al. comprehensively and systematically summarized all of the high-yield FPY data obtained for 235U, 238U, and 239Pu isotopes using quasi-monoenergetic neutron beams at 11 incident energies ranging from 0.5−14.8 MeV [15].
A survey of the fission yield data for 238U reveals a significant data gap in the 2−3 MeV neutron energy region. Although physicists have conducted experimental measurements of some FPYs, the existing data in this region are notably scarce, inconsistent, and subject to large uncertainties. This limitation hinders the establishment of a comprehensive and reliable yield database. Consequently, more precise measurements of fission yield in this specific energy range are imperative. Furthermore, for the energy dependence of fission yields, it is essential to measure as many different energy points as possible to validate the correlation between FPYs and incident neutron energy rigorously. To address the lack of FPY issue of 238U in the 2−3 MeV energy range, this work employed a High-Purity Germanium (HPGe) detector to measure the activities of fission products from 238U. Through careful calculation and analysis of the experimental data, high-precision cumulative yields for seven fission products at a neutron energy of 2.9 MeV were determined.
-
With the continuous development of the global economy and the sustained growth of the population, energy demand is also rising steadily. Although traditional fossil fuels currently dominate the energy supply, their reserves are limited. Global climate change is one of the major challenges facing humanity today. The extensive combustion of fossil fuels emits large quantities of greenhouse gases and pollutants, leading to a series of environmental issues. To address climate change, countries around the world have begun to increase the development and utilization of clean energy. Renewable energy sources such as wind and solar power are significantly affected by weather and seasons, exhibiting intermittency and instability. Nuclear energy, unaffected by weather or time constraints, can ensure the continuity of energy supply. Simultaneously, nuclear power not only has a high energy density but also does not produce greenhouse gases or other pollutants during operation, thereby attracting significant attention.
Nuclear data, which serve as a bridge between fundamental nuclear physics and its applications in nuclear engineering and technology, play a crucial role in the utilization and development of nuclear energy [1]. Among these, fission product yield (FPY) is one of the fundamental nuclear data sets in nuclear energy, science, and engineering research. It is indispensable in fields such as basic nuclear physics studies, reactor design and operation, spent fuel treatment, nuclear waste management, and nuclear material safeguards. 238U is a fertile material for breeding 239Pu, the primary fissile fuel in Gen-IV reactors, while also constituting an essential component of the fuel assemblies. The FPYs of 238U are important for advanced nuclear energy systems, particularly Fast Breeder Reactors (FBRs) and Accelerator Driven Subcritical Systems (ADSs) [2]. These yield data serve as a critical benchmark for applied reactor physics, including burnup calculations, decay heat estimation, and fuel breeding assessment, as well as for validating fundamental fission models, such as the multi-channel fission model and Monte Carlo simulations. Furthermore, analysis of the yield distribution provides critical insights into the fission mechanism of heavy nuclei and the associated shell effects and dynamics during fragment formation [3].
In the study of fission yields, neutron-induced fission is the most common and significant type. A variety of methods are employed to determine neutron-induced FPYs. While both radiochemistry and mass spectrometry can measure nearly all such products, each technique faces distinct challenges [4]. A major limitation of radiochemistry is its time-consuming nature and the complex procedural workflow. Although mass spectrometry achieves high accuracy in fission product measurement, its application is limited by the half-lives of the fission products [5]. Advances in detection technology, have enabled high-resolution semiconductor detectors to measure γ-ray spectra from samples directly. Consequently, direct γ-ray spectrometry has progressively become the mainstream method for studying FPYs [6].
The study of the induced fission yield of 238U at 3 MeV neutrons was first reported in 1951 by Engelkemeir et al. [7]. In 1954, Keller et al. reported yields of 15 fission products from 238U induced at an average neutron energy of 2.8 MeV, and essentially determined the shape of the chain-yield curve [8]. In 1961, Levy et al. reported the fission yields for twelve mass chains at a neutron energy of 2.5 MeV [9]. In 1975, Harvey et al. measured the absolute fission yields of 32 nuclides in the range of A=83−151 using β counting, and observed the fine structure of the yield curve at A=134 [10]. In 1977, Crouch summarized and compiled the fission yield results of bombarding Th, U, Pu, and other fissile nuclei with thermal neutrons, fast neutrons, 1.1, 3, 11, and 14 MeV neutrons [11]. In 1984, the fission yield group of the CIAE used the radiochemical method to measure the fission yield of several 238U nuclides at 5 MeV [12]. In 2001, using an Am-Be neutron source, I. Celenk obtained the yield data for 34 fission products from 238U at approximately 5 MeV [13]. In 2013, to investigate the effect of excitation energy on nuclear structure effects, H. Naik studied the yields of various fission products in the 3.72, 5.42, 7.75, and 10.09 MeV quasi-monoenergetic neutron-induced fission of 238U [14]. In 2016, Gooden et al. employed a Tandem Van de Graaff accelerator to generate 0.5−14.8 MeV monoenergetic neutrons for investigating the energy dependence of FPYs from 235U, 238U, and 239Pu [4]. In 2025, Tonchev et al. comprehensively and systematically summarized all of the high-yield FPY data obtained for 235U, 238U, and 239Pu isotopes using quasi-monoenergetic neutron beams at 11 incident energies ranging from 0.5−14.8 MeV [15].
A survey of the fission yield data for 238U reveals a significant data gap in the 2−3 MeV neutron energy region. Although physicists have conducted experimental measurements of some FPYs, the existing data in this region are notably scarce, inconsistent, and subject to large uncertainties. This limitation hinders the establishment of a comprehensive and reliable yield database. Consequently, more precise measurements of fission yield in this specific energy range are imperative. Furthermore, for the energy dependence of fission yields, it is essential to measure as many different energy points as possible to validate the correlation between FPYs and incident neutron energy rigorously. To address the lack of FPY issue of 238U in the 2−3 MeV energy range, this work employed a High-Purity Germanium (HPGe) detector to measure the activities of fission products from 238U. Through careful calculation and analysis of the experimental data, high-precision cumulative yields for seven fission products at a neutron energy of 2.9 MeV were determined.
-
With the continuous development of the global economy and the sustained growth of the population, energy demand is also rising steadily. Although traditional fossil fuels currently dominate the energy supply, their reserves are limited. Global climate change is one of the major challenges facing humanity today. The extensive combustion of fossil fuels emits large quantities of greenhouse gases and pollutants, leading to a series of environmental issues. To address climate change, countries around the world have begun to increase the development and utilization of clean energy. Renewable energy sources such as wind and solar power are significantly affected by weather and seasons, exhibiting intermittency and instability. Nuclear energy, unaffected by weather or time constraints, can ensure the continuity of energy supply. Simultaneously, nuclear power not only has a high energy density but also does not produce greenhouse gases or other pollutants during operation, thereby attracting significant attention.
Nuclear data, which serve as a bridge between fundamental nuclear physics and its applications in nuclear engineering and technology, play a crucial role in the utilization and development of nuclear energy [1]. Among these, fission product yield (FPY) is one of the fundamental nuclear data sets in nuclear energy, science, and engineering research. It is indispensable in fields such as basic nuclear physics studies, reactor design and operation, spent fuel treatment, nuclear waste management, and nuclear material safeguards. 238U is a fertile material for breeding 239Pu, the primary fissile fuel in Gen-IV reactors, while also constituting an essential component of the fuel assemblies. The FPYs of 238U are important for advanced nuclear energy systems, particularly Fast Breeder Reactors (FBRs) and Accelerator Driven Subcritical Systems (ADSs) [2]. These yield data serve as a critical benchmark for applied reactor physics, including burnup calculations, decay heat estimation, and fuel breeding assessment, as well as for validating fundamental fission models, such as the multi-channel fission model and Monte Carlo simulations. Furthermore, analysis of the yield distribution provides critical insights into the fission mechanism of heavy nuclei and the associated shell effects and dynamics during fragment formation [3].
In the study of fission yields, neutron-induced fission is the most common and significant type. A variety of methods are employed to determine neutron-induced FPYs. While both radiochemistry and mass spectrometry can measure nearly all such products, each technique faces distinct challenges [4]. A major limitation of radiochemistry is its time-consuming nature and the complex procedural workflow. Although mass spectrometry achieves high accuracy in fission product measurement, its application is limited by the half-lives of the fission products [5]. Advances in detection technology, have enabled high-resolution semiconductor detectors to measure γ-ray spectra from samples directly. Consequently, direct γ-ray spectrometry has progressively become the mainstream method for studying FPYs [6].
The study of the induced fission yield of 238U at 3 MeV neutrons was first reported in 1951 by Engelkemeir et al. [7]. In 1954, Keller et al. reported yields of 15 fission products from 238U induced at an average neutron energy of 2.8 MeV, and essentially determined the shape of the chain-yield curve [8]. In 1961, Levy et al. reported the fission yields for twelve mass chains at a neutron energy of 2.5 MeV [9]. In 1975, Harvey et al. measured the absolute fission yields of 32 nuclides in the range of A=83−151 using β counting, and observed the fine structure of the yield curve at A=134 [10]. In 1977, Crouch summarized and compiled the fission yield results of bombarding Th, U, Pu, and other fissile nuclei with thermal neutrons, fast neutrons, 1.1, 3, 11, and 14 MeV neutrons [11]. In 1984, the fission yield group of the CIAE used the radiochemical method to measure the fission yield of several 238U nuclides at 5 MeV [12]. In 2001, using an Am-Be neutron source, I. Celenk obtained the yield data for 34 fission products from 238U at approximately 5 MeV [13]. In 2013, to investigate the effect of excitation energy on nuclear structure effects, H. Naik studied the yields of various fission products in the 3.72, 5.42, 7.75, and 10.09 MeV quasi-monoenergetic neutron-induced fission of 238U [14]. In 2016, Gooden et al. employed a Tandem Van de Graaff accelerator to generate 0.5−14.8 MeV monoenergetic neutrons for investigating the energy dependence of FPYs from 235U, 238U, and 239Pu [4]. In 2025, Tonchev et al. comprehensively and systematically summarized all of the high-yield FPY data obtained for 235U, 238U, and 239Pu isotopes using quasi-monoenergetic neutron beams at 11 incident energies ranging from 0.5−14.8 MeV [15].
A survey of the fission yield data for 238U reveals a significant data gap in the 2−3 MeV neutron energy region. Although physicists have conducted experimental measurements of some FPYs, the existing data in this region are notably scarce, inconsistent, and subject to large uncertainties. This limitation hinders the establishment of a comprehensive and reliable yield database. Consequently, more precise measurements of fission yield in this specific energy range are imperative. Furthermore, for the energy dependence of fission yields, it is essential to measure as many different energy points as possible to validate the correlation between FPYs and incident neutron energy rigorously. To address the lack of FPY issue of 238U in the 2−3 MeV energy range, this work employed a High-Purity Germanium (HPGe) detector to measure the activities of fission products from 238U. Through careful calculation and analysis of the experimental data, high-precision cumulative yields for seven fission products at a neutron energy of 2.9 MeV were determined.
-
With the continuous development of the global economy and the sustained growth of the population, energy demand is also rising steadily. Although traditional fossil fuels currently dominate the energy supply, their reserves are limited. Global climate change is one of the major challenges facing humanity today. The extensive combustion of fossil fuels emits large quantities of greenhouse gases and pollutants, leading to a series of environmental issues. To address climate change, countries around the world have begun to increase the development and utilization of clean energy. Renewable energy sources such as wind and solar power are significantly affected by weather and seasons, exhibiting intermittency and instability. Nuclear energy, unaffected by weather or time constraints, can ensure the continuity of energy supply. Simultaneously, nuclear power not only has a high energy density but also does not produce greenhouse gases or other pollutants during operation, thereby attracting significant attention.
Nuclear data, which serve as a bridge between fundamental nuclear physics and its applications in nuclear engineering and technology, play a crucial role in the utilization and development of nuclear energy [1]. Among these, fission product yield (FPY) is one of the fundamental nuclear data sets in nuclear energy, science, and engineering research. It is indispensable in fields such as basic nuclear physics studies, reactor design and operation, spent fuel treatment, nuclear waste management, and nuclear material safeguards. 238U is a fertile material for breeding 239Pu, the primary fissile fuel in Gen-IV reactors, while also constituting an essential component of the fuel assemblies. The FPYs of 238U are important for advanced nuclear energy systems, particularly Fast Breeder Reactors (FBRs) and Accelerator Driven Subcritical Systems (ADSs) [2]. These yield data serve as a critical benchmark for applied reactor physics, including burnup calculations, decay heat estimation, and fuel breeding assessment, as well as for validating fundamental fission models, such as the multi-channel fission model and Monte Carlo simulations. Furthermore, analysis of the yield distribution provides critical insights into the fission mechanism of heavy nuclei and the associated shell effects and dynamics during fragment formation [3].
In the study of fission yields, neutron-induced fission is the most common and significant type. A variety of methods are employed to determine neutron-induced FPYs. While both radiochemistry and mass spectrometry can measure nearly all such products, each technique faces distinct challenges [4]. A major limitation of radiochemistry is its time-consuming nature and the complex procedural workflow. Although mass spectrometry achieves high accuracy in fission product measurement, its application is limited by the half-lives of the fission products [5]. Advances in detection technology, have enabled high-resolution semiconductor detectors to measure γ-ray spectra from samples directly. Consequently, direct γ-ray spectrometry has progressively become the mainstream method for studying FPYs [6].
The study of the induced fission yield of 238U at 3 MeV neutrons was first reported in 1951 by Engelkemeir et al. [7]. In 1954, Keller et al. reported yields of 15 fission products from 238U induced at an average neutron energy of 2.8 MeV, and essentially determined the shape of the chain-yield curve [8]. In 1961, Levy et al. reported the fission yields for twelve mass chains at a neutron energy of 2.5 MeV [9]. In 1975, Harvey et al. measured the absolute fission yields of 32 nuclides in the range of A=83−151 using β counting, and observed the fine structure of the yield curve at A=134 [10]. In 1977, Crouch summarized and compiled the fission yield results of bombarding Th, U, Pu, and other fissile nuclei with thermal neutrons, fast neutrons, 1.1, 3, 11, and 14 MeV neutrons [11]. In 1984, the fission yield group of the CIAE used the radiochemical method to measure the fission yield of several 238U nuclides at 5 MeV [12]. In 2001, using an Am-Be neutron source, I. Celenk obtained the yield data for 34 fission products from 238U at approximately 5 MeV [13]. In 2013, to investigate the effect of excitation energy on nuclear structure effects, H. Naik studied the yields of various fission products in the 3.72, 5.42, 7.75, and 10.09 MeV quasi-monoenergetic neutron-induced fission of 238U [14]. In 2016, Gooden et al. employed a Tandem Van de Graaff accelerator to generate 0.5−14.8 MeV monoenergetic neutrons for investigating the energy dependence of FPYs from 235U, 238U, and 239Pu [4]. In 2025, Tonchev et al. comprehensively and systematically summarized all of the high-yield FPY data obtained for 235U, 238U, and 239Pu isotopes using quasi-monoenergetic neutron beams at 11 incident energies ranging from 0.5−14.8 MeV [15].
A survey of the fission yield data for 238U reveals a significant data gap in the 2−3 MeV neutron energy region. Although physicists have conducted experimental measurements of some FPYs, the existing data in this region are notably scarce, inconsistent, and subject to large uncertainties. This limitation hinders the establishment of a comprehensive and reliable yield database. Consequently, more precise measurements of fission yield in this specific energy range are imperative. Furthermore, for the energy dependence of fission yields, it is essential to measure as many different energy points as possible to validate the correlation between FPYs and incident neutron energy rigorously. To address the lack of FPY issue of 238U in the 2−3 MeV energy range, this work employed a High-Purity Germanium (HPGe) detector to measure the activities of fission products from 238U. Through careful calculation and analysis of the experimental data, high-precision cumulative yields for seven fission products at a neutron energy of 2.9 MeV were determined.
-
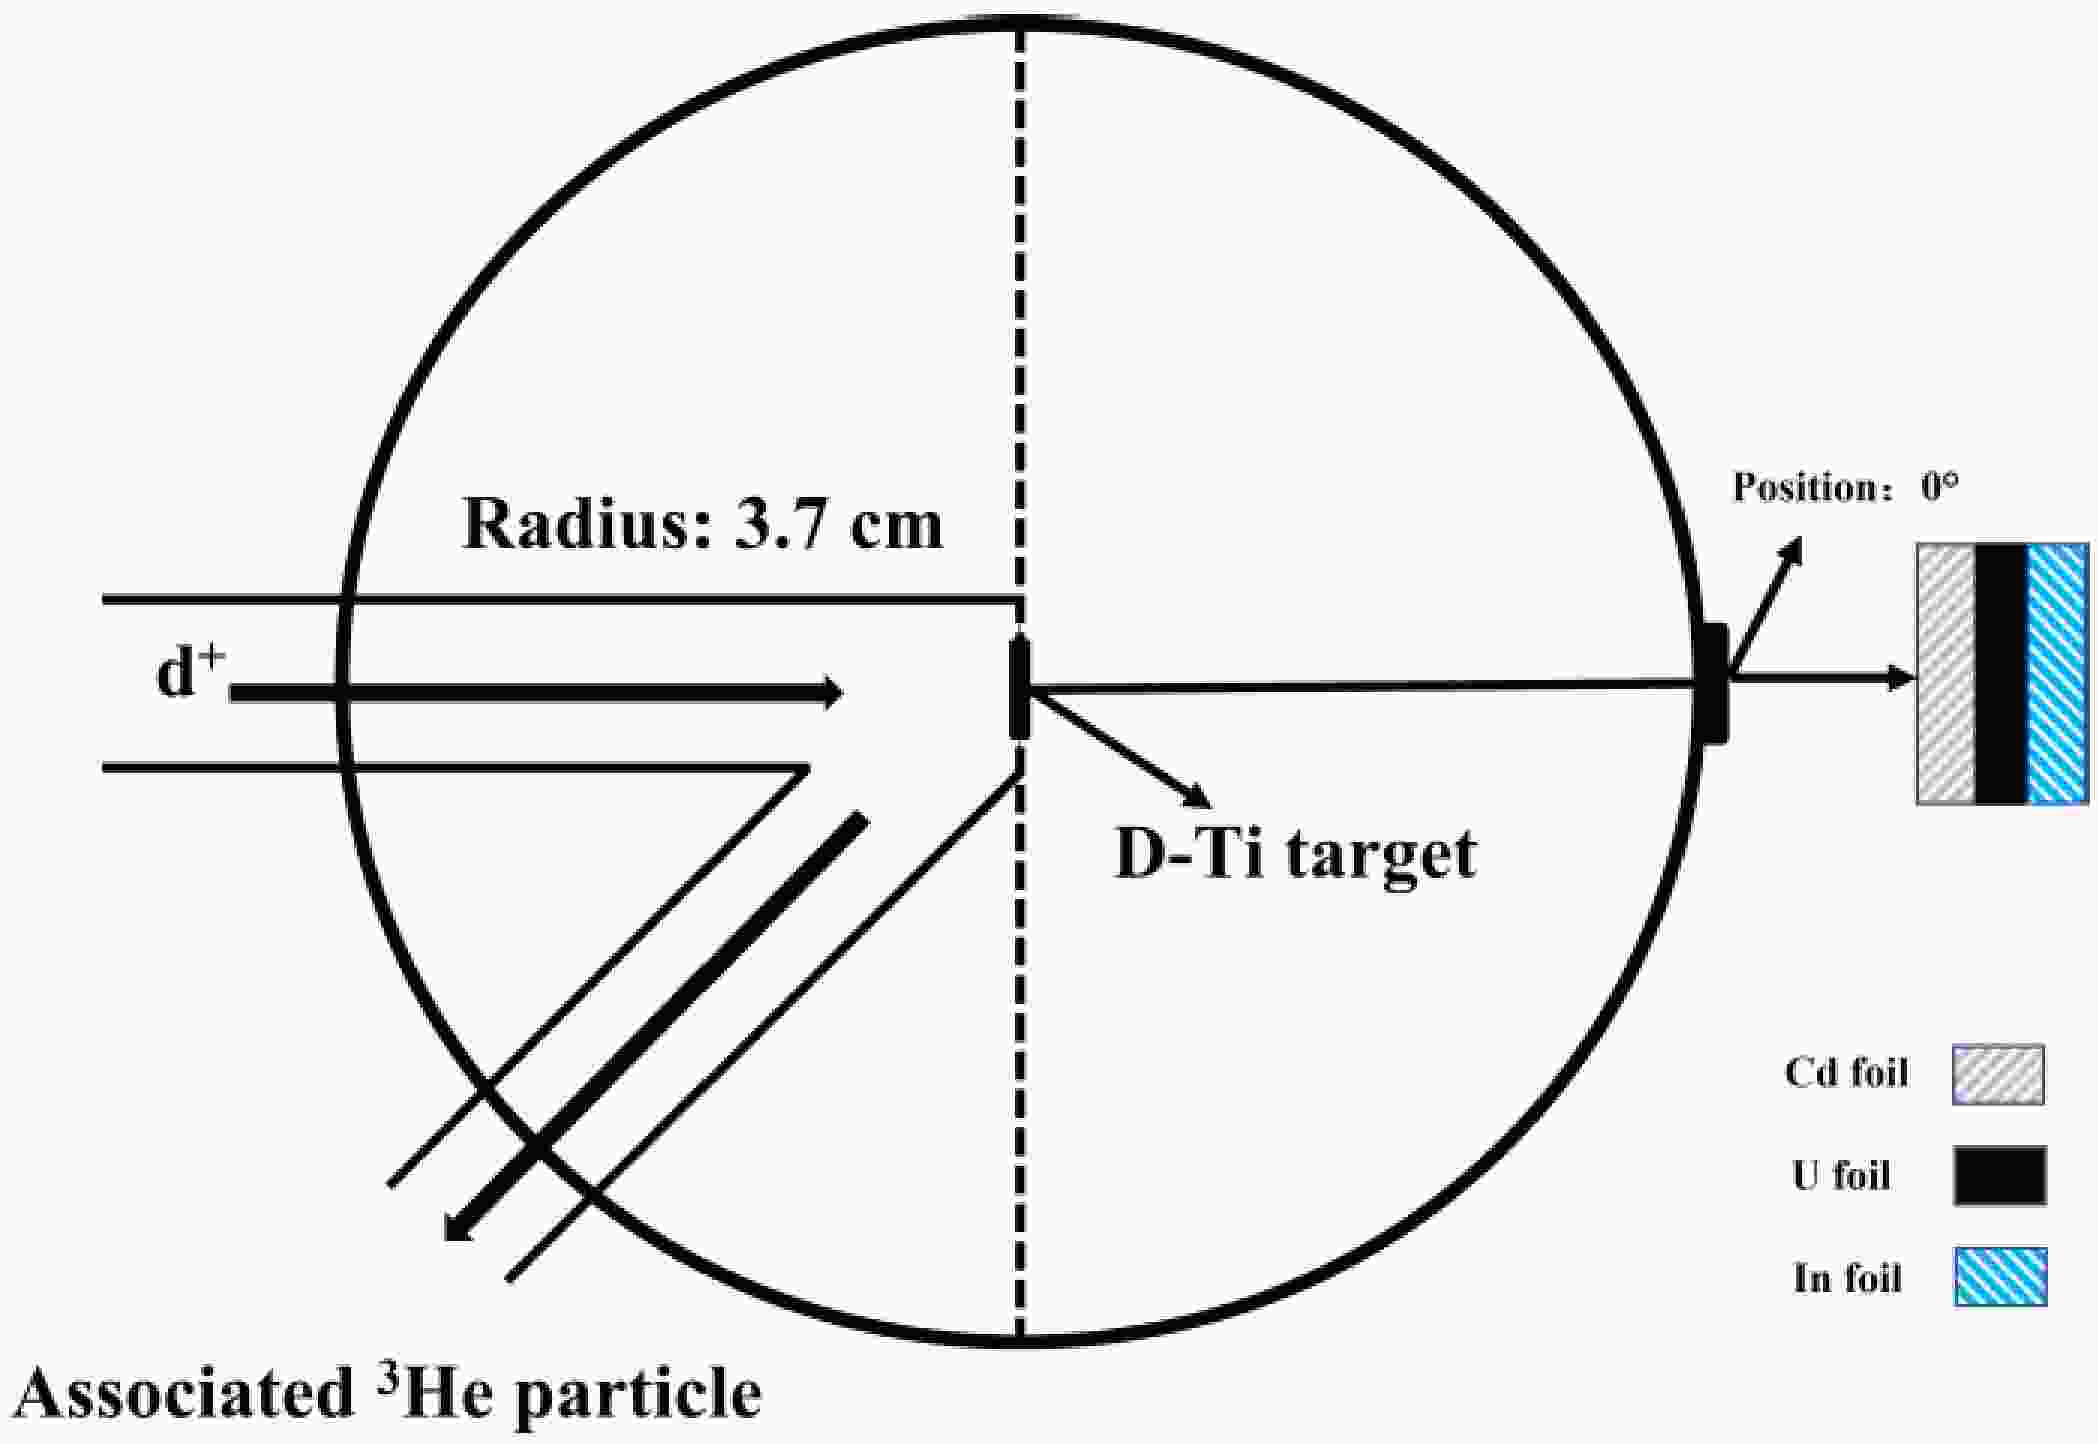
Before conducting the fission experiment on 238U utilizing D-D neutrons, natural triuranium octoxide (U3O8) powder samples with a mass of 1.5891 g were pressed into a round disk of 20 mm diameter with a thickness of 0.53 mm. The U3O8 sample is consistent with the mass division. The isotopic abundances and uncertainties are listed in Table 1 [16]. High-purity (99.99%) Cadmium (Cd) and indium (In) metal foils for the target material, each 0.1 mm thick, were cut into disks of the same diameter. Subsequently, the sample was placed between a Cd sheet and an In foil, as illustrated in Fig. 1.
Isotope Mass Abundance (%) Uncertainty (%) 234U 0.0055 0.01 235U 0.7200 0.01 238U 99.2745 0.01 Table 1. The composition and uncertainty of uranium isotopes.
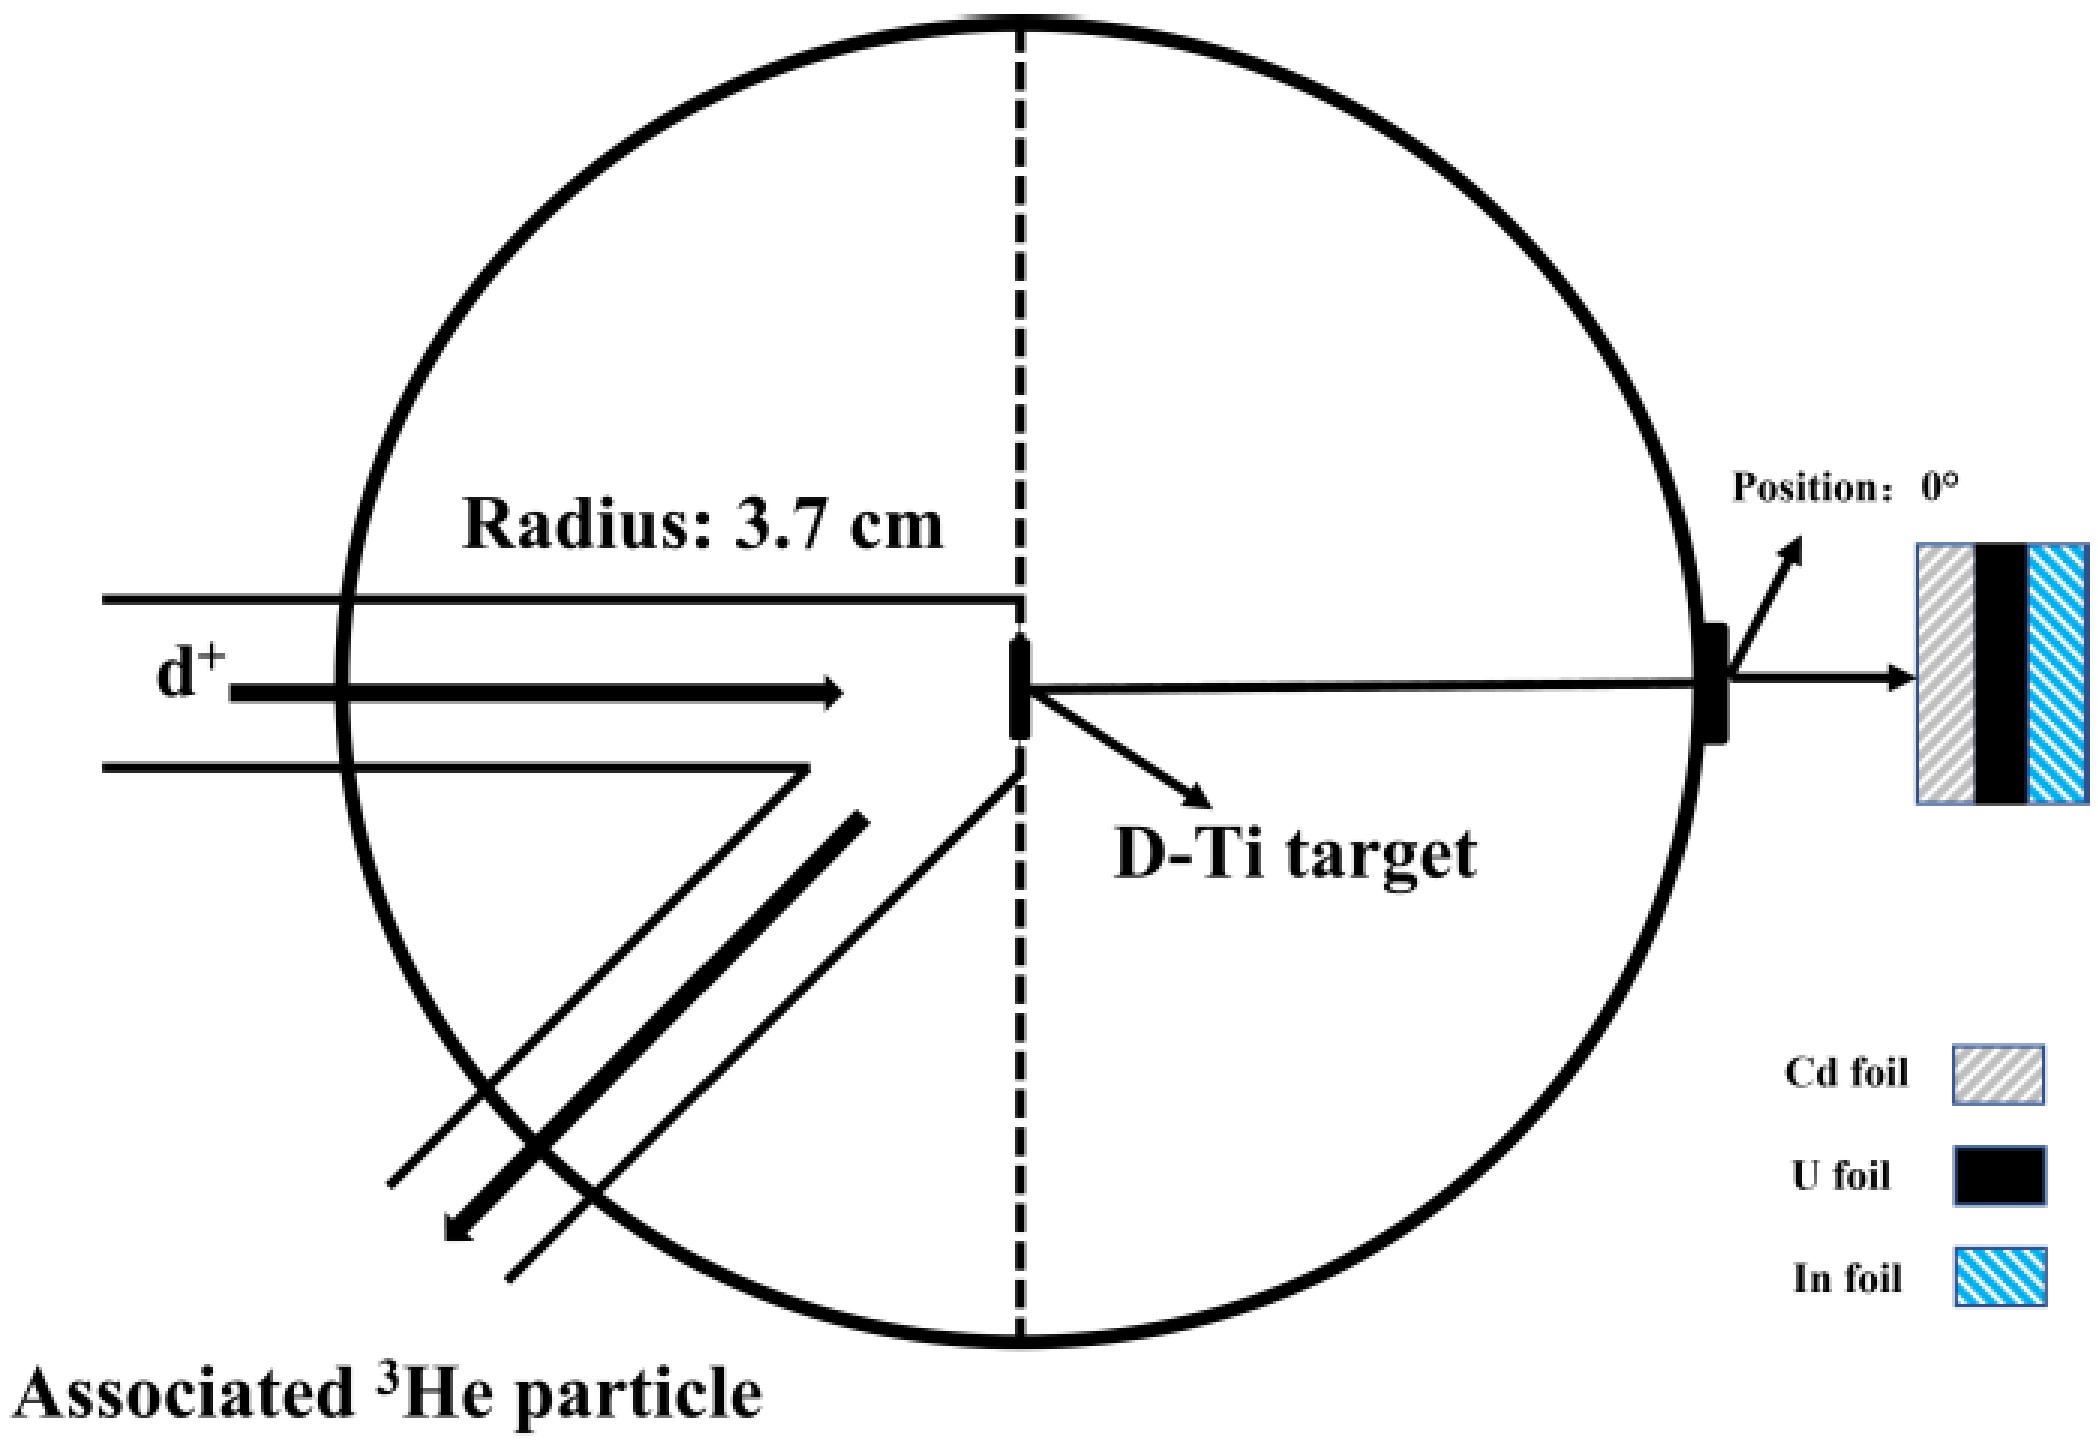
Figure 1. (color online) Schematic diagram of experimental geometry.
The neutron irradiation experiment was conducted using the CPNG-600 neutron generator at the CIAE. The target assembly consisted of a Cd-U-In stacked structure. Between the uranium sample and cadmium and indium foils, there was minimal neutron scattering, and neutron flux was monitored by irradiating the sample. The thermal neutrons were absorbed by the cadmium sheet, suppressing the thermal neutron background; an indium foil was used as a neutron flux monitor. This arrangement provided stable irradiation and precision in measuring fission-product activities.
Furthermore, in combination with Zn metal foil, the Zn and In foils enabled the calculation of neutron energy via the cross-section ratio method (R=σ[64Zn(n, p)64Cu]/σ[115In(n, n')115mIn]) [17]. As shown in Fig. 1, the sample was placed 3.7 cm away from the D-Ti target at 0◦ angles with respect to the deuterium beam emission direction. With a deuteron beam energy of 300 keV, Monoenergetic neutrons were produced with a yield of around 1.26 × 10⁹ n/s via the D(d, n)3He reaction. The target assembly was subjected to controlled irradiation with a neutron beam to ensure a uniform irradiation of the sample. The emission angle was used to determine the neutron energy distribution, which was validated by using the standard calibration procedures. The neutron energy at the angle of 0◦ is 2.9 ± 0.3 MeV [18]. The target was irradiated with a deuteron beam in four separate stages, resulting in a net irradiation time of 13.9 h. During irradiation, the neutron fluence was monitored through 3He-particle detection using an Au-Si surface barrier detector. The detection system's count rate, proportional to the neutron flux, was recorded in real time throughout the irradiation.
-
Before conducting the fission experiment on 238U utilizing D-D neutrons, natural triuranium octoxide (U3O8) powder samples with a mass of 1.5891 g were pressed into a round disk of 20 mm diameter with a thickness of 0.53 mm. The U3O8 sample is consistent with the mass division. The isotopic abundances and uncertainties are listed in Table 1 [16]. High-purity (99.99%) Cadmium (Cd) and indium (In) metal foils for the target material, each 0.1 mm thick, were cut into disks of the same diameter. Subsequently, the sample was placed between a Cd sheet and an In foil, as illustrated in Fig. 1.
Isotope Mass Abundance (%) Uncertainty (%) 234U 0.0055 0.01 235U 0.7200 0.01 238U 99.2745 0.01 Table 1. The composition and uncertainty of uranium isotopes.
Figure 1. (color online) Schematic diagram of experimental geometry.
The neutron irradiation experiment was conducted using the CPNG-600 neutron generator at the CIAE. The target assembly consisted of a Cd-U-In stacked structure. Between the uranium sample and cadmium and indium foils, there was minimal neutron scattering, and neutron flux was monitored by irradiating the sample. The thermal neutrons were absorbed by the cadmium sheet, suppressing the thermal neutron background; an indium foil was used as a neutron flux monitor. This arrangement provided stable irradiation and precision in measuring fission-product activities.
Furthermore, in combination with Zn metal foil, the Zn and In foils enabled the calculation of neutron energy via the cross-section ratio method (R=σ[64Zn(n, p)64Cu]/σ[115In(n, n')115mIn]) [17]. As shown in Fig. 1, the sample was placed 3.7 cm away from the D-Ti target at 0◦ angles with respect to the deuterium beam emission direction. With a deuteron beam energy of 300 keV, Monoenergetic neutrons were produced with a yield of around 1.26 × 10⁹ n/s via the D(d, n)3He reaction. The target assembly was subjected to controlled irradiation with a neutron beam to ensure a uniform irradiation of the sample. The emission angle was used to determine the neutron energy distribution, which was validated by using the standard calibration procedures. The neutron energy at the angle of 0◦ is 2.9 ± 0.3 MeV [18]. The target was irradiated with a deuteron beam in four separate stages, resulting in a net irradiation time of 13.9 h. During irradiation, the neutron fluence was monitored through 3He-particle detection using an Au-Si surface barrier detector. The detection system's count rate, proportional to the neutron flux, was recorded in real time throughout the irradiation.
-
Before conducting the fission experiment on 238U utilizing D-D neutrons, natural triuranium octoxide (U3O8) powder samples with a mass of 1.5891 g were pressed into a round disk of 20 mm diameter with a thickness of 0.53 mm. The U3O8 sample is consistent with the mass division. The isotopic abundances and uncertainties are listed in Table 1 [16]. High-purity (99.99%) Cadmium (Cd) and indium (In) metal foils for the target material, each 0.1 mm thick, were cut into disks of the same diameter. Subsequently, the sample was placed between a Cd sheet and an In foil, as illustrated in Fig. 1.
Isotope Mass Abundance (%) Uncertainty (%) 234U 0.0055 0.01 235U 0.7200 0.01 238U 99.2745 0.01 Table 1. The composition and uncertainty of uranium isotopes.
Figure 1. (color online) Schematic diagram of experimental geometry.
The neutron irradiation experiment was conducted using the CPNG-600 neutron generator at the CIAE. The target assembly consisted of a Cd-U-In stacked structure. Between the uranium sample and cadmium and indium foils, there was minimal neutron scattering, and neutron flux was monitored by irradiating the sample. The thermal neutrons were absorbed by the cadmium sheet, suppressing the thermal neutron background; an indium foil was used as a neutron flux monitor. This arrangement provided stable irradiation and precision in measuring fission-product activities.
Furthermore, in combination with Zn metal foil, the Zn and In foils enabled the calculation of neutron energy via the cross-section ratio method (R=σ[64Zn(n, p)64Cu]/σ[115In(n, n')115mIn]) [17]. As shown in Fig. 1, the sample was placed 3.7 cm away from the D-Ti target at 0◦ angles with respect to the deuterium beam emission direction. With a deuteron beam energy of 300 keV, Monoenergetic neutrons were produced with a yield of around 1.26 × 10⁹ n/s via the D(d, n)3He reaction. The target assembly was subjected to controlled irradiation with a neutron beam to ensure a uniform irradiation of the sample. The emission angle was used to determine the neutron energy distribution, which was validated by using the standard calibration procedures. The neutron energy at the angle of 0◦ is 2.9 ± 0.3 MeV [18]. The target was irradiated with a deuteron beam in four separate stages, resulting in a net irradiation time of 13.9 h. During irradiation, the neutron fluence was monitored through 3He-particle detection using an Au-Si surface barrier detector. The detection system's count rate, proportional to the neutron flux, was recorded in real time throughout the irradiation.
-
Before conducting the fission experiment on 238U utilizing D-D neutrons, natural triuranium octoxide (U3O8) powder samples with a mass of 1.5891 g were pressed into a round disk of 20 mm diameter with a thickness of 0.53 mm. The U3O8 sample is consistent with the mass division. The isotopic abundances and uncertainties are listed in Table 1 [16]. High-purity (99.99%) Cadmium (Cd) and indium (In) metal foils for the target material, each 0.1 mm thick, were cut into disks of the same diameter. Subsequently, the sample was placed between a Cd sheet and an In foil, as illustrated in Fig. 1.
Isotope Mass Abundance (%) Uncertainty (%) 234U 0.0055 0.01 235U 0.7200 0.01 238U 99.2745 0.01 Table 1. The composition and uncertainty of uranium isotopes.
Figure 1. (color online) Schematic diagram of experimental geometry.
The neutron irradiation experiment was conducted using the CPNG-600 neutron generator at the CIAE. The target assembly consisted of a Cd-U-In stacked structure. Between the uranium sample and cadmium and indium foils, there was minimal neutron scattering, and neutron flux was monitored by irradiating the sample. The thermal neutrons were absorbed by the cadmium sheet, suppressing the thermal neutron background; an indium foil was used as a neutron flux monitor. This arrangement provided stable irradiation and precision in measuring fission-product activities.
Furthermore, in combination with Zn metal foil, the Zn and In foils enabled the calculation of neutron energy via the cross-section ratio method (R=σ[64Zn(n, p)64Cu]/σ[115In(n, n')115mIn]) [17]. As shown in Fig. 1, the sample was placed 3.7 cm away from the D-Ti target at 0◦ angles with respect to the deuterium beam emission direction. With a deuteron beam energy of 300 keV, Monoenergetic neutrons were produced with a yield of around 1.26 × 10⁹ n/s via the D(d, n)3He reaction. The target assembly was subjected to controlled irradiation with a neutron beam to ensure a uniform irradiation of the sample. The emission angle was used to determine the neutron energy distribution, which was validated by using the standard calibration procedures. The neutron energy at the angle of 0◦ is 2.9 ± 0.3 MeV [18]. The target was irradiated with a deuteron beam in four separate stages, resulting in a net irradiation time of 13.9 h. During irradiation, the neutron fluence was monitored through 3He-particle detection using an Au-Si surface barrier detector. The detection system's count rate, proportional to the neutron flux, was recorded in real time throughout the irradiation.
-
Before conducting the fission experiment on 238U utilizing D-D neutrons, natural triuranium octoxide (U3O8) powder samples with a mass of 1.5891 g were pressed into a round disk of 20 mm diameter with a thickness of 0.53 mm. The U3O8 sample is consistent with the mass division. The isotopic abundances and uncertainties are listed in Table 1 [16]. High-purity (99.99%) Cadmium (Cd) and indium (In) metal foils for the target material, each 0.1 mm thick, were cut into disks of the same diameter. Subsequently, the sample was placed between a Cd sheet and an In foil, as illustrated in Fig. 1.
Isotope Mass Abundance (%) Uncertainty (%) 234U 0.0055 0.01 235U 0.7200 0.01 238U 99.2745 0.01 Table 1. The composition and uncertainty of uranium isotopes.
Figure 1. (color online) Schematic diagram of experimental geometry.
The neutron irradiation experiment was conducted using the CPNG-600 neutron generator at the CIAE. The target assembly consisted of a Cd-U-In stacked structure. Between the uranium sample and cadmium and indium foils, there was minimal neutron scattering, and neutron flux was monitored by irradiating the sample. The thermal neutrons were absorbed by the cadmium sheet, suppressing the thermal neutron background; an indium foil was used as a neutron flux monitor. This arrangement provided stable irradiation and precision in measuring fission-product activities.
Furthermore, in combination with Zn metal foil, the Zn and In foils enabled the calculation of neutron energy via the cross-section ratio method (R=σ[64Zn(n, p)64Cu]/σ[115In(n, n')115mIn]) [17]. As shown in Fig. 1, the sample was placed 3.7 cm away from the D-Ti target at 0◦ angles with respect to the deuterium beam emission direction. With a deuteron beam energy of 300 keV, Monoenergetic neutrons were produced with a yield of around 1.26 × 10⁹ n/s via the D(d, n)3He reaction. The target assembly was subjected to controlled irradiation with a neutron beam to ensure a uniform irradiation of the sample. The emission angle was used to determine the neutron energy distribution, which was validated by using the standard calibration procedures. The neutron energy at the angle of 0◦ is 2.9 ± 0.3 MeV [18]. The target was irradiated with a deuteron beam in four separate stages, resulting in a net irradiation time of 13.9 h. During irradiation, the neutron fluence was monitored through 3He-particle detection using an Au-Si surface barrier detector. The detection system's count rate, proportional to the neutron flux, was recorded in real time throughout the irradiation.
-
After neutron irradiation and activation, the sample was removed from the irradiation facility (i.e., measured "offline"). Following a designated cooling period, the characteristic γ-rays emitted by the induced radionuclides were measured non-destructively and analyzed with an HPGe γ-ray spectrometer. The measurement of γ-rays can be performed using an HPGe detector system because it offers good energy resolution and detection efficiency. The detector was operated under stable conditions to ensure accurate acquisition of γ-ray spectra. Calibrations of energy and efficiency were performed before measuring all samples to ensure accurate identification and measurement of characteristic γ-ray peaks of fission products. For this experiment, energy and efficiency calibrations were performed using a standard 152Eu radioactive source in the low-background laboratory at CIAE. The 152Eu source is characterized by a broad spectrum of characteristic γ-ray energies, with its typical emission lines illustrated in Fig. 2. The relationship between channel address and energy was established through calibration with the 152Eu source of known energies, with the corresponding energy calibration results presented in Fig. 3. Accurate identification of characteristic γ-ray peaks of nuclides from γ-ray spectra is only achievable with an energy-calibrated detector. Detection efficiency is a critical factor in determining a sample's activity. The energy-efficiency relationship was mathematically described by a spline function ε(Eγ) = 0.81725 × (Eγ)-0.66614. The correlation coefficient R2 for data fitting is 0.9931. A complete fitted efficiency calibration curve at a distance of 5.0 cm is shown in Fig. 4.
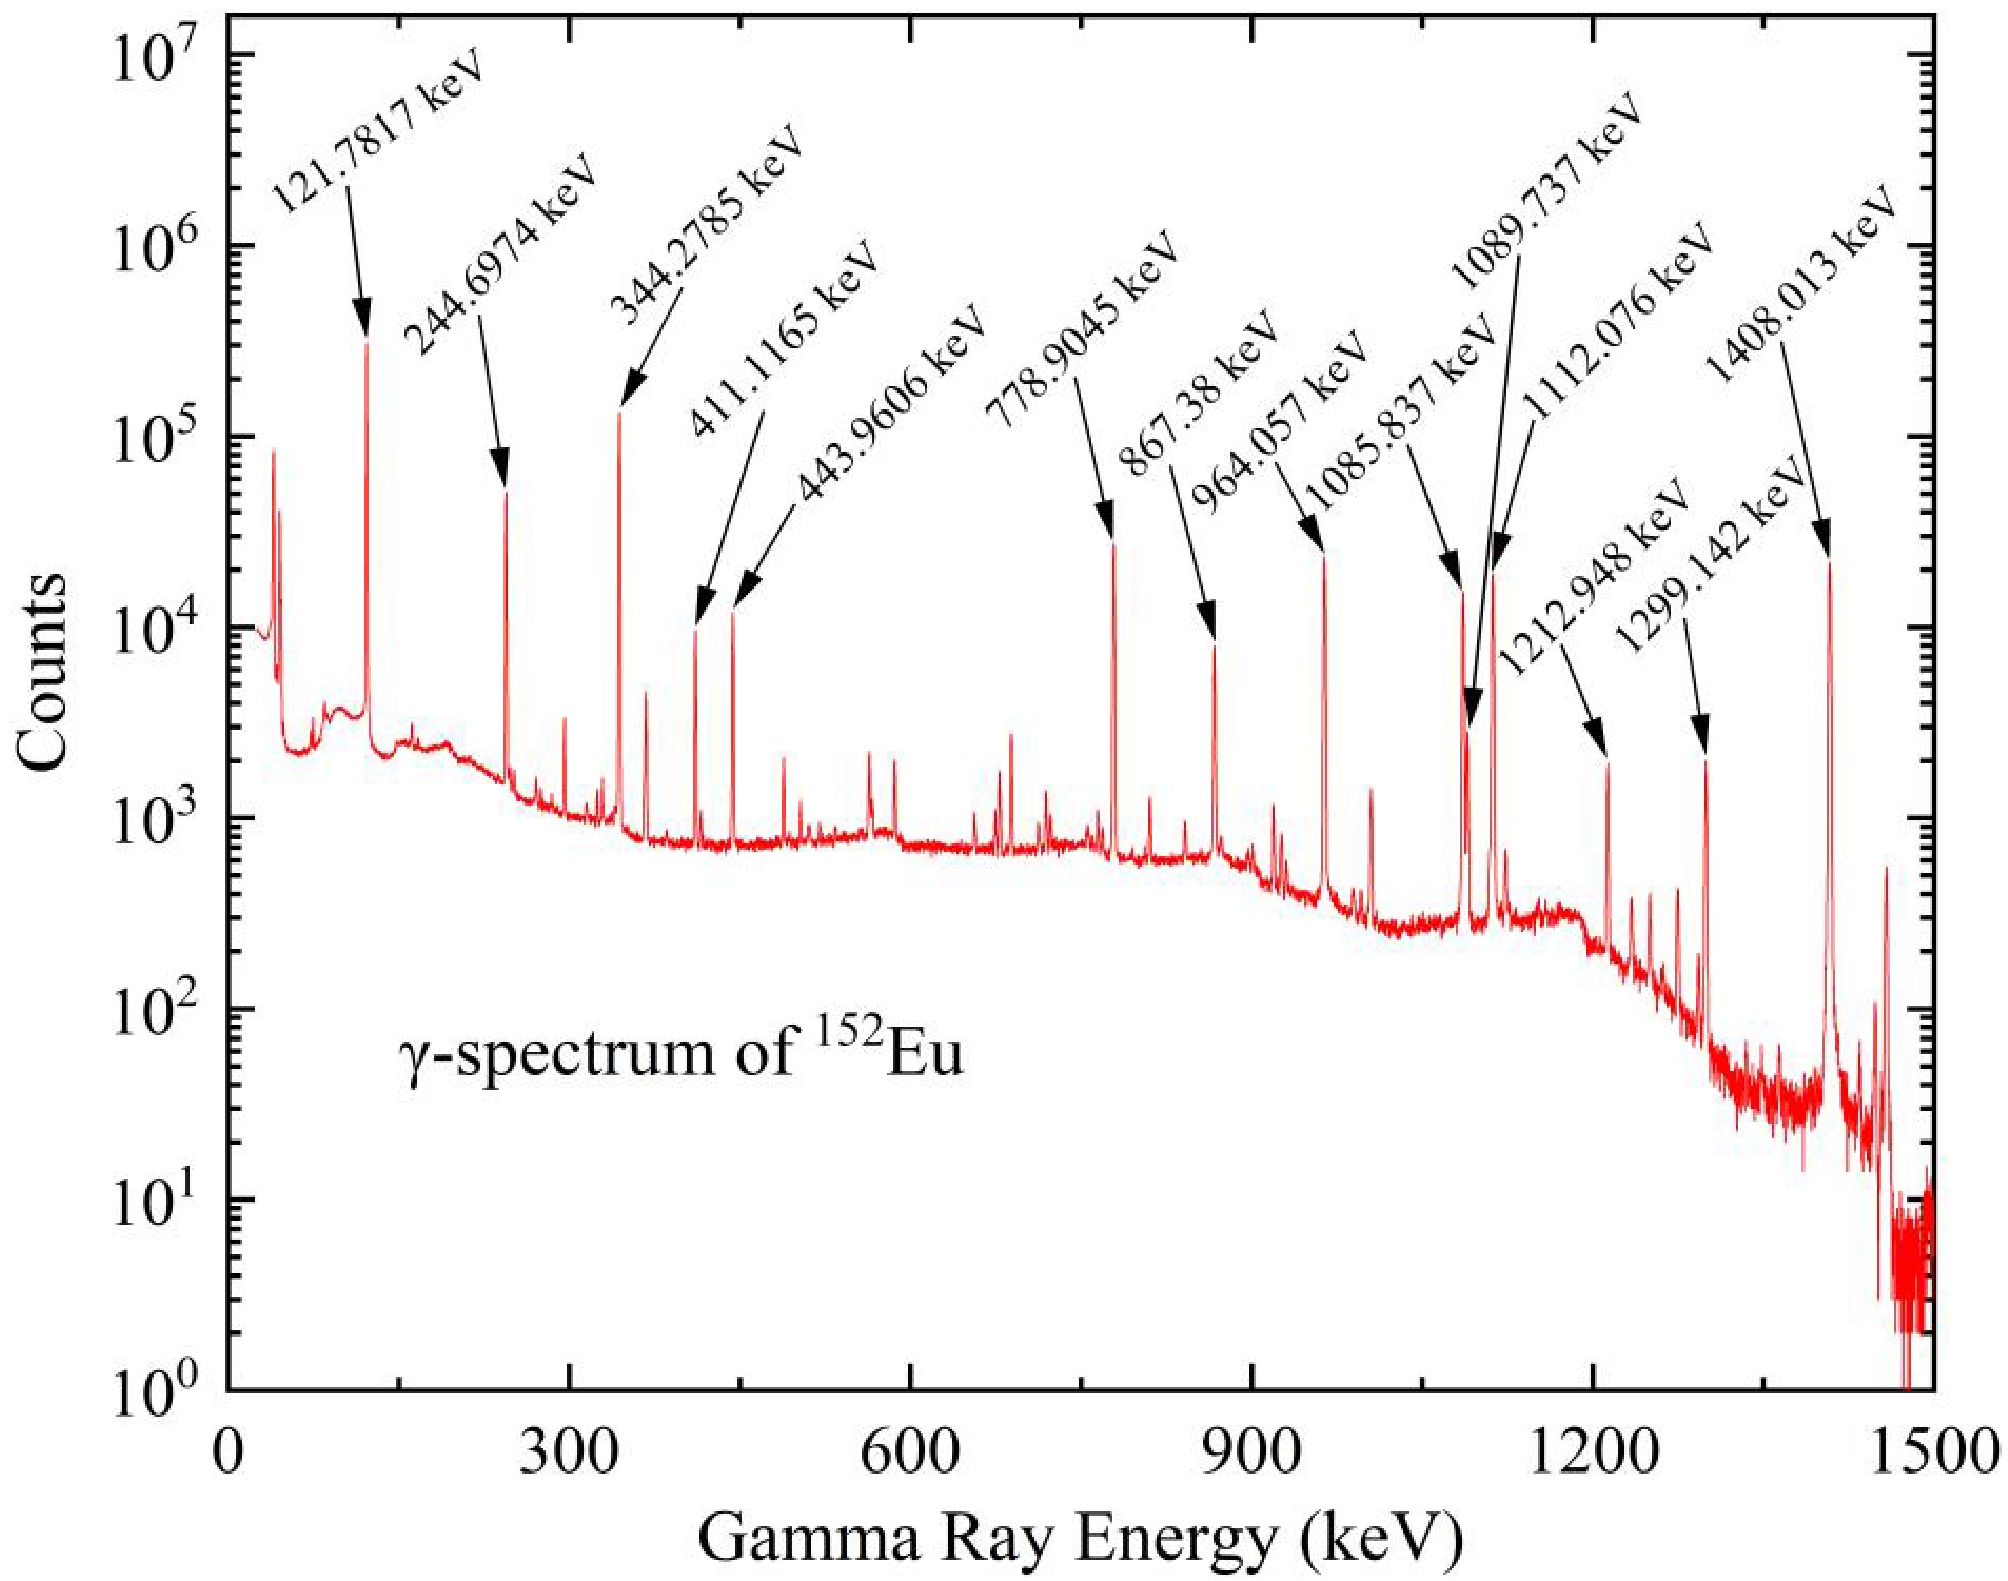
Figure 2. (color online) The typical 152Eu γ-spectrum measured by an HPGe γ-ray spectrometer.
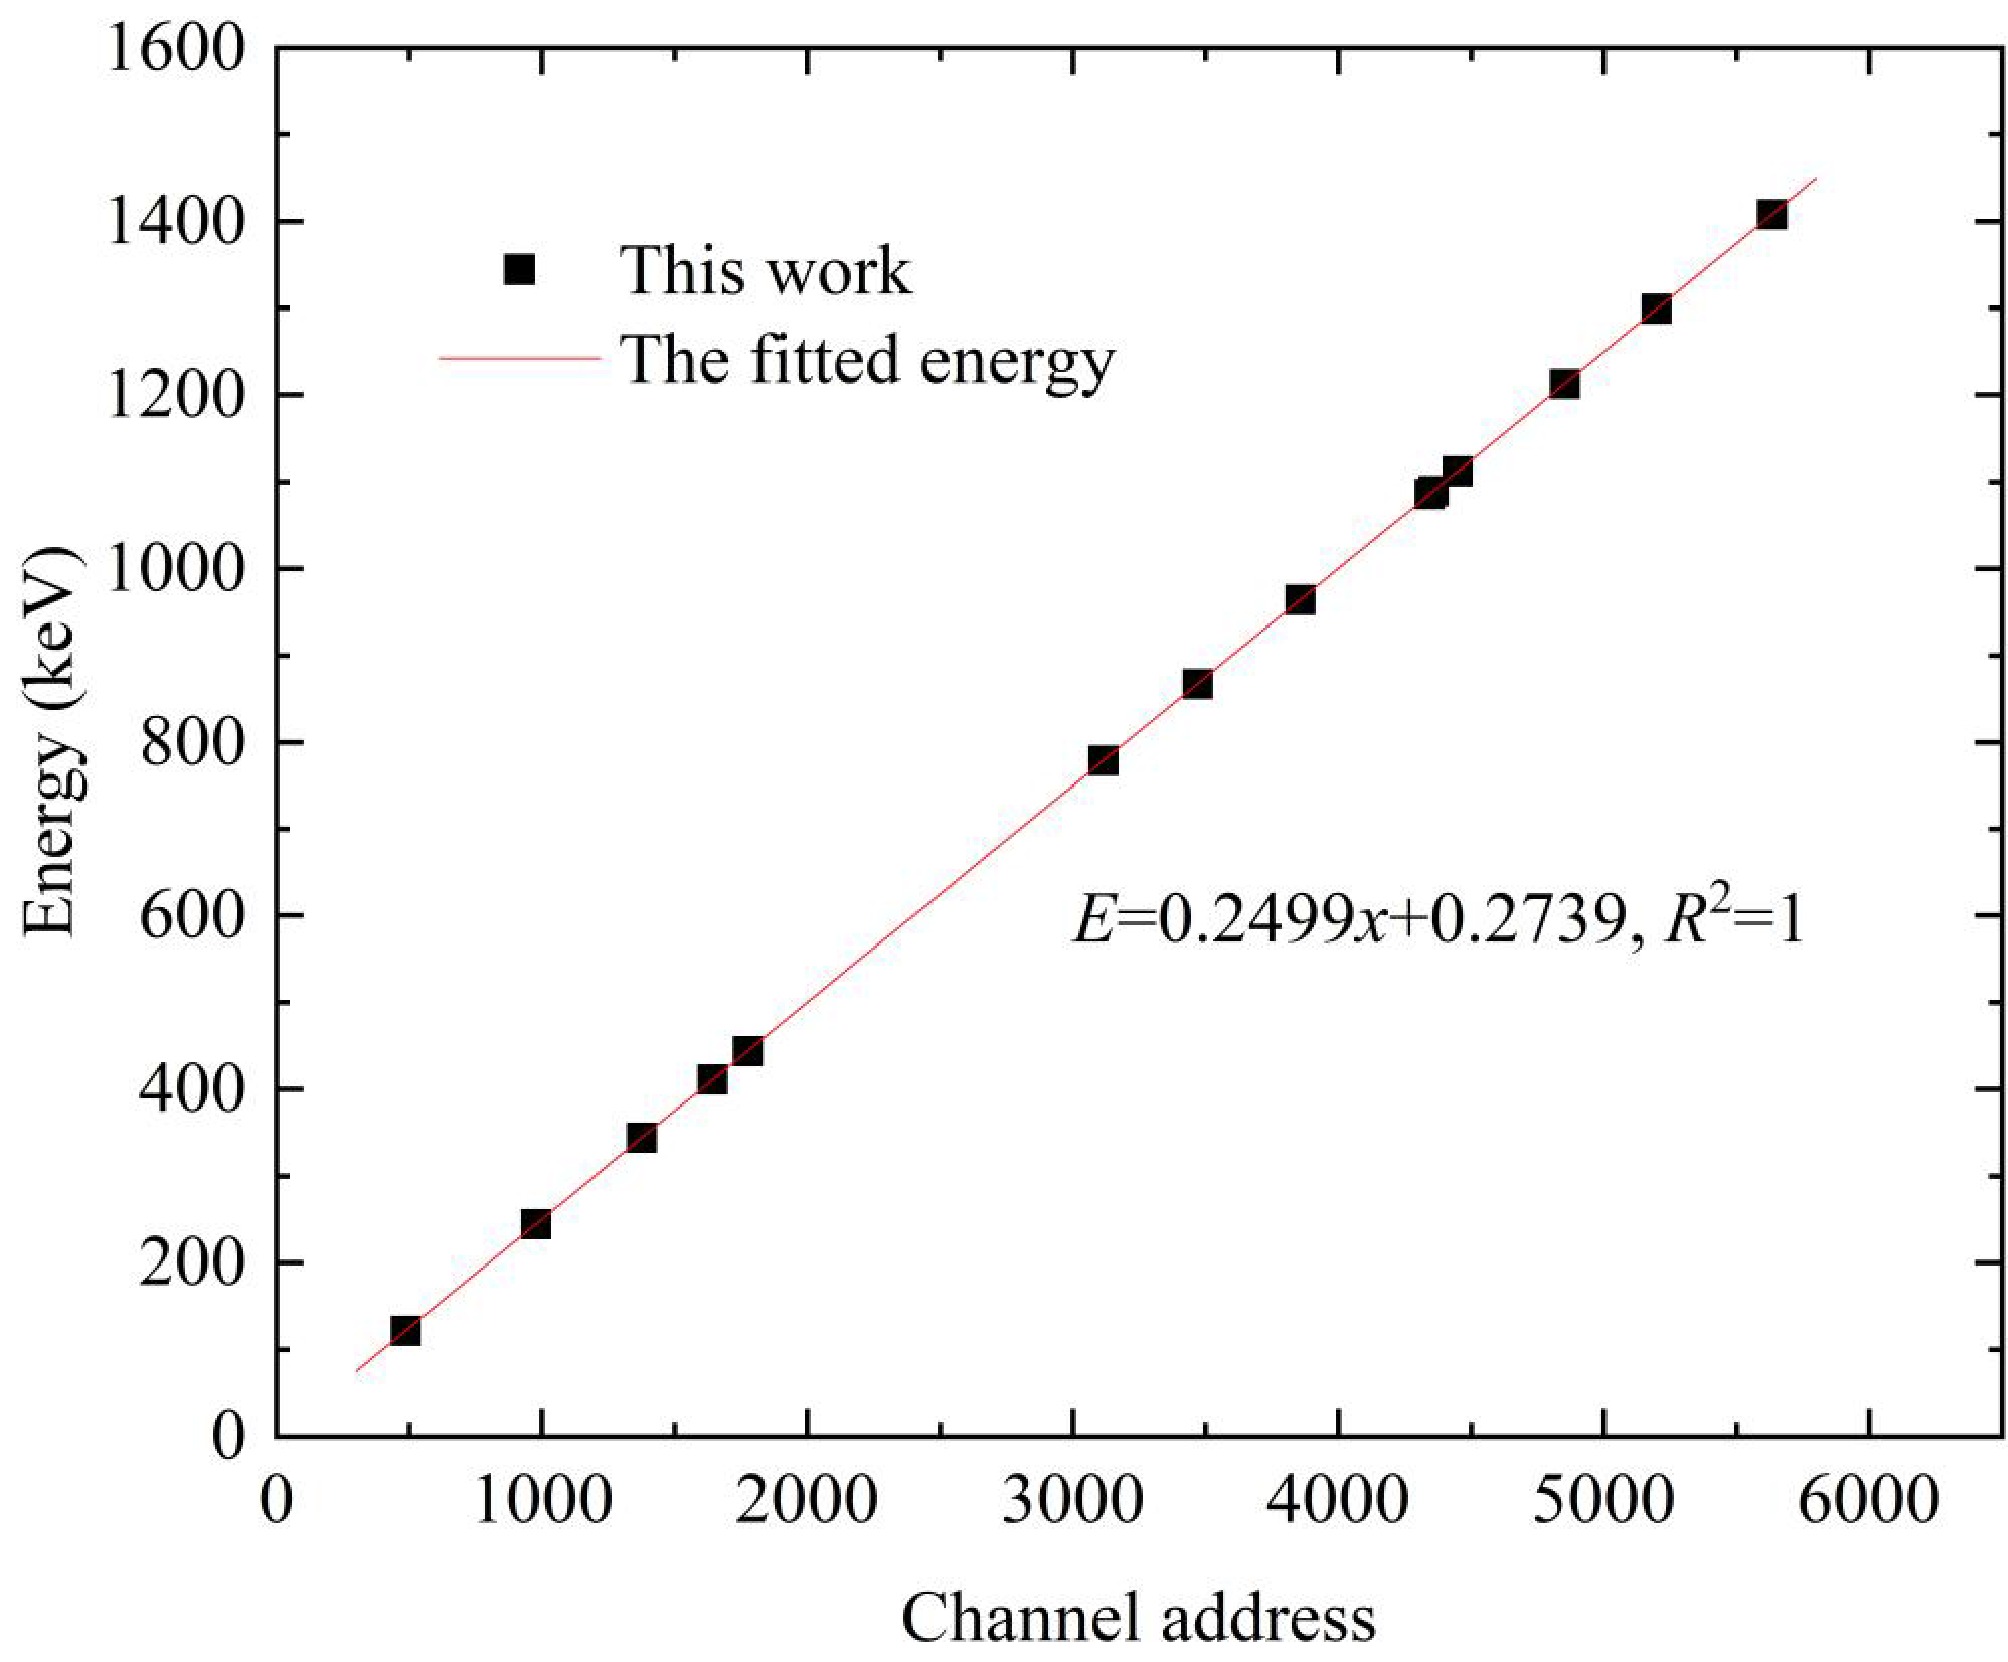
Figure 3. (color online) The fitted energy curve and measured energy data.
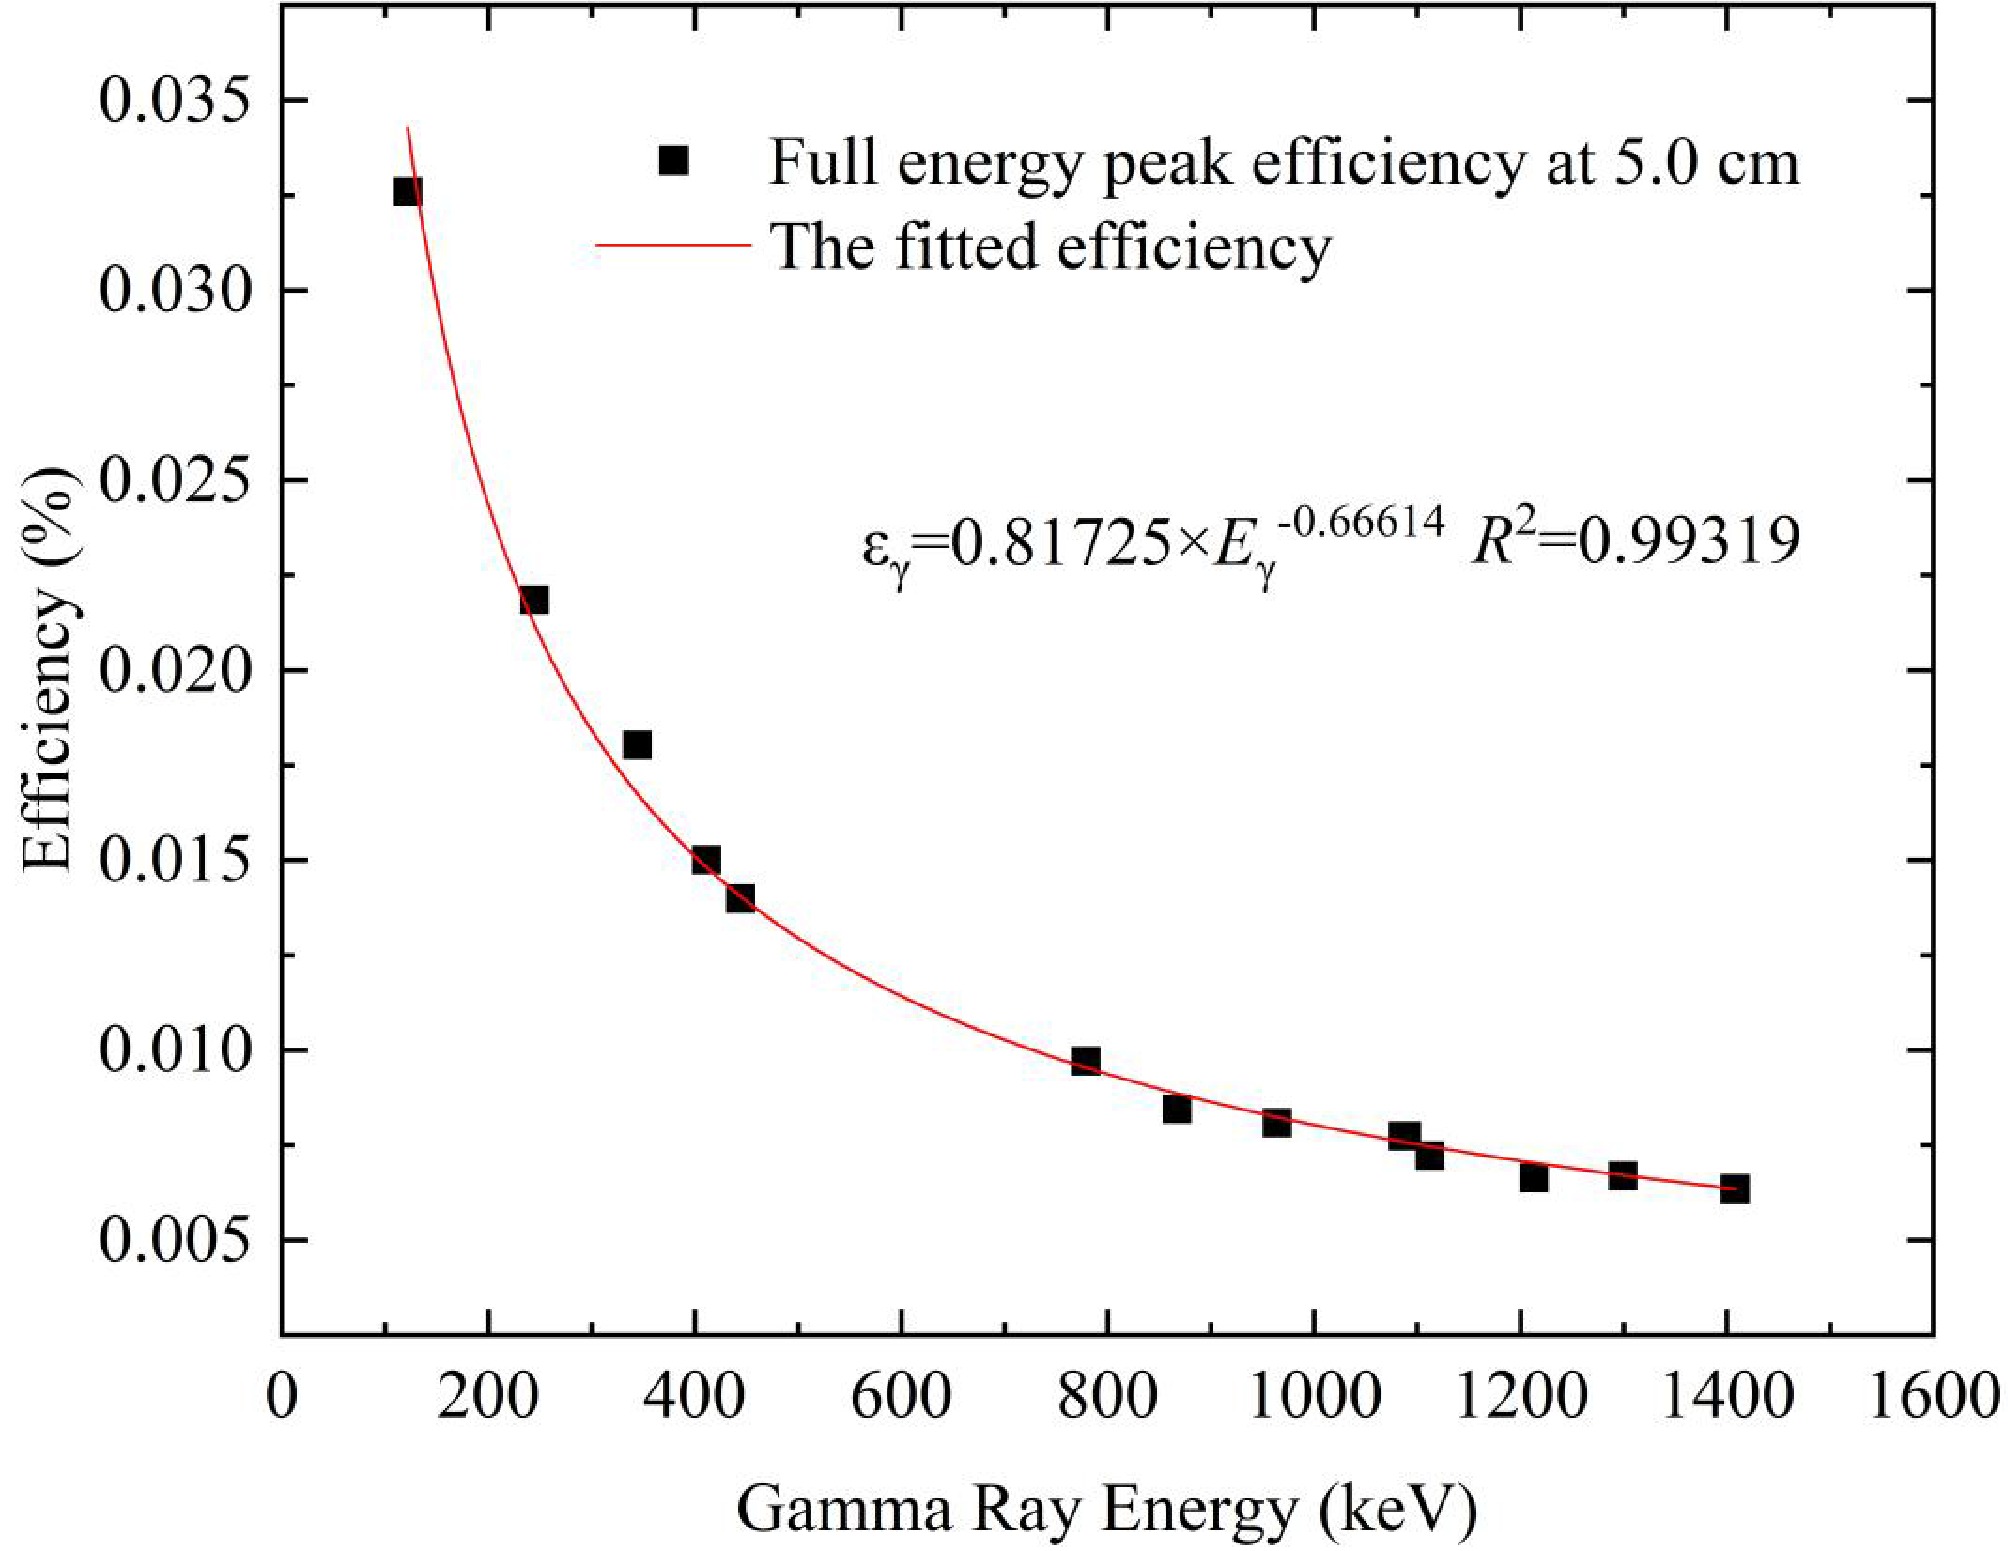
Figure 4. (color online) The fitted efficiency curve and measured efficiency data.
-
After neutron irradiation and activation, the sample was removed from the irradiation facility (i.e., measured "offline"). Following a designated cooling period, the characteristic γ-rays emitted by the induced radionuclides were measured non-destructively and analyzed with an HPGe γ-ray spectrometer. The measurement of γ-rays can be performed using an HPGe detector system because it offers good energy resolution and detection efficiency. The detector was operated under stable conditions to ensure accurate acquisition of γ-ray spectra. Calibrations of energy and efficiency were performed before measuring all samples to ensure accurate identification and measurement of characteristic γ-ray peaks of fission products. For this experiment, energy and efficiency calibrations were performed using a standard 152Eu radioactive source in the low-background laboratory at CIAE. The 152Eu source is characterized by a broad spectrum of characteristic γ-ray energies, with its typical emission lines illustrated in Fig. 2. The relationship between channel address and energy was established through calibration with the 152Eu source of known energies, with the corresponding energy calibration results presented in Fig. 3. Accurate identification of characteristic γ-ray peaks of nuclides from γ-ray spectra is only achievable with an energy-calibrated detector. Detection efficiency is a critical factor in determining a sample's activity. The energy-efficiency relationship was mathematically described by a spline function ε(Eγ) = 0.81725 × (Eγ)-0.66614. The correlation coefficient R2 for data fitting is 0.9931. A complete fitted efficiency calibration curve at a distance of 5.0 cm is shown in Fig. 4.
Figure 2. (color online) The typical 152Eu γ-spectrum measured by an HPGe γ-ray spectrometer.
Figure 3. (color online) The fitted energy curve and measured energy data.
Figure 4. (color online) The fitted efficiency curve and measured efficiency data.
-
After neutron irradiation and activation, the sample was removed from the irradiation facility (i.e., measured "offline"). Following a designated cooling period, the characteristic γ-rays emitted by the induced radionuclides were measured non-destructively and analyzed with an HPGe γ-ray spectrometer. The measurement of γ-rays can be performed using an HPGe detector system because it offers good energy resolution and detection efficiency. The detector was operated under stable conditions to ensure accurate acquisition of γ-ray spectra. Calibrations of energy and efficiency were performed before measuring all samples to ensure accurate identification and measurement of characteristic γ-ray peaks of fission products. For this experiment, energy and efficiency calibrations were performed using a standard 152Eu radioactive source in the low-background laboratory at CIAE. The 152Eu source is characterized by a broad spectrum of characteristic γ-ray energies, with its typical emission lines illustrated in Fig. 2. The relationship between channel address and energy was established through calibration with the 152Eu source of known energies, with the corresponding energy calibration results presented in Fig. 3. Accurate identification of characteristic γ-ray peaks of nuclides from γ-ray spectra is only achievable with an energy-calibrated detector. Detection efficiency is a critical factor in determining a sample's activity. The energy-efficiency relationship was mathematically described by a spline function ε(Eγ) = 0.81725 × (Eγ)-0.66614. The correlation coefficient R2 for data fitting is 0.9931. A complete fitted efficiency calibration curve at a distance of 5.0 cm is shown in Fig. 4.
Figure 2. (color online) The typical 152Eu γ-spectrum measured by an HPGe γ-ray spectrometer.
Figure 3. (color online) The fitted energy curve and measured energy data.
Figure 4. (color online) The fitted efficiency curve and measured efficiency data.
-
After neutron irradiation and activation, the sample was removed from the irradiation facility (i.e., measured "offline"). Following a designated cooling period, the characteristic γ-rays emitted by the induced radionuclides were measured non-destructively and analyzed with an HPGe γ-ray spectrometer. The measurement of γ-rays can be performed using an HPGe detector system because it offers good energy resolution and detection efficiency. The detector was operated under stable conditions to ensure accurate acquisition of γ-ray spectra. Calibrations of energy and efficiency were performed before measuring all samples to ensure accurate identification and measurement of characteristic γ-ray peaks of fission products. For this experiment, energy and efficiency calibrations were performed using a standard 152Eu radioactive source in the low-background laboratory at CIAE. The 152Eu source is characterized by a broad spectrum of characteristic γ-ray energies, with its typical emission lines illustrated in Fig. 2. The relationship between channel address and energy was established through calibration with the 152Eu source of known energies, with the corresponding energy calibration results presented in Fig. 3. Accurate identification of characteristic γ-ray peaks of nuclides from γ-ray spectra is only achievable with an energy-calibrated detector. Detection efficiency is a critical factor in determining a sample's activity. The energy-efficiency relationship was mathematically described by a spline function ε(Eγ) = 0.81725 × (Eγ)-0.66614. The correlation coefficient R2 for data fitting is 0.9931. A complete fitted efficiency calibration curve at a distance of 5.0 cm is shown in Fig. 4.
Figure 2. (color online) The typical 152Eu γ-spectrum measured by an HPGe γ-ray spectrometer.
Figure 3. (color online) The fitted energy curve and measured energy data.
Figure 4. (color online) The fitted efficiency curve and measured efficiency data.
-
After neutron irradiation and activation, the sample was removed from the irradiation facility (i.e., measured "offline"). Following a designated cooling period, the characteristic γ-rays emitted by the induced radionuclides were measured non-destructively and analyzed with an HPGe γ-ray spectrometer. The measurement of γ-rays can be performed using an HPGe detector system because it offers good energy resolution and detection efficiency. The detector was operated under stable conditions to ensure accurate acquisition of γ-ray spectra. Calibrations of energy and efficiency were performed before measuring all samples to ensure accurate identification and measurement of characteristic γ-ray peaks of fission products. For this experiment, energy and efficiency calibrations were performed using a standard 152Eu radioactive source in the low-background laboratory at CIAE. The 152Eu source is characterized by a broad spectrum of characteristic γ-ray energies, with its typical emission lines illustrated in Fig. 2. The relationship between channel address and energy was established through calibration with the 152Eu source of known energies, with the corresponding energy calibration results presented in Fig. 3. Accurate identification of characteristic γ-ray peaks of nuclides from γ-ray spectra is only achievable with an energy-calibrated detector. Detection efficiency is a critical factor in determining a sample's activity. The energy-efficiency relationship was mathematically described by a spline function ε(Eγ) = 0.81725 × (Eγ)-0.66614. The correlation coefficient R2 for data fitting is 0.9931. A complete fitted efficiency calibration curve at a distance of 5.0 cm is shown in Fig. 4.
Figure 2. (color online) The typical 152Eu γ-spectrum measured by an HPGe γ-ray spectrometer.
Figure 3. (color online) The fitted energy curve and measured energy data.
Figure 4. (color online) The fitted efficiency curve and measured efficiency data.
-
Following neutron activation, the irradiated 238U sample was subjected to a cooling time of 19.217 min and 6.225 h, respectively, to capture fission products with distinct half-lives. The 238U sample that underwent the short cooling period (19.217 min) was measured using a pre-calibrated HPGe detector (GEM-50P4) at 20 min intervals, yielding a total of 11 γ-ray spectra. The sample subjected to the long cooling time (6.225 h) was measured at hourly intervals, resulting in 16 spectra. The HPGe detector used in the experiment had a relative efficiency of 50% and an energy resolution of 1.9 keV for the 1.332 MeV γ-ray from 60Co. Offline γ-ray acquisition was performed using ORTEC®MAESTRO-6.01.
The decay constant, obtained from the slope of the fitted curve, was used to calculate the fitted half-life (T1/2). Combined with the characteristic γ-ray energy (Eγ) and γ-ray intensity (Iγ) listed in Table 2, these results enabled the unambiguous identification of the fission product nuclides associated with the observed characteristic γ-ray emissions. Using this method, seven fission products were ultimately determined, and the fitting results for 92Sr, 104Tc, and 105Ru, shown in Fig. 5, serve as three illustrative examples. Based on the fitted decay constants, the half-lives of 92Sr, 104Tc, and 105Ru were determined to be 2.91 ± 0.36 h, 18.21 ± 0.40 min, and 4.32 ± 0.38 h, respectively. The fluctuations observed in the 105Ru data are mainly attributed to counting statistical uncertainties, which become more significant at lower count rates. In addition, uncertainties associated with peak-area determination, potential interference from neighboring γ-ray peaks in the measured spectrum, and background subtraction may also contribute to the observed discrepancies. The results are presented in Fig. 6, which shows the γ-ray spectrum along with the measured nuclides and their characteristic peaks.
Fission Products T1/2 Eγ /keV Iγ (%) 91Sr 9.65±0.06 h 1024.31 33.5±1.1 92Sr 2.61±0.017 h 1383.93 90.0±0.6 97Zr 16.75±0.008 h 743.36 93.1±0.2 104Tc 18.3±0.3 m 358.01 89.0±0.3 105Ru 4.44±0.011 h 724.21 47.9±0.1 135I 6.58±0.03 h 1131.51 22.6±0.7 143Ce 33.04±0.01 h 293.27 42.8±0.4 Table 2. The decay data of identified fission products.
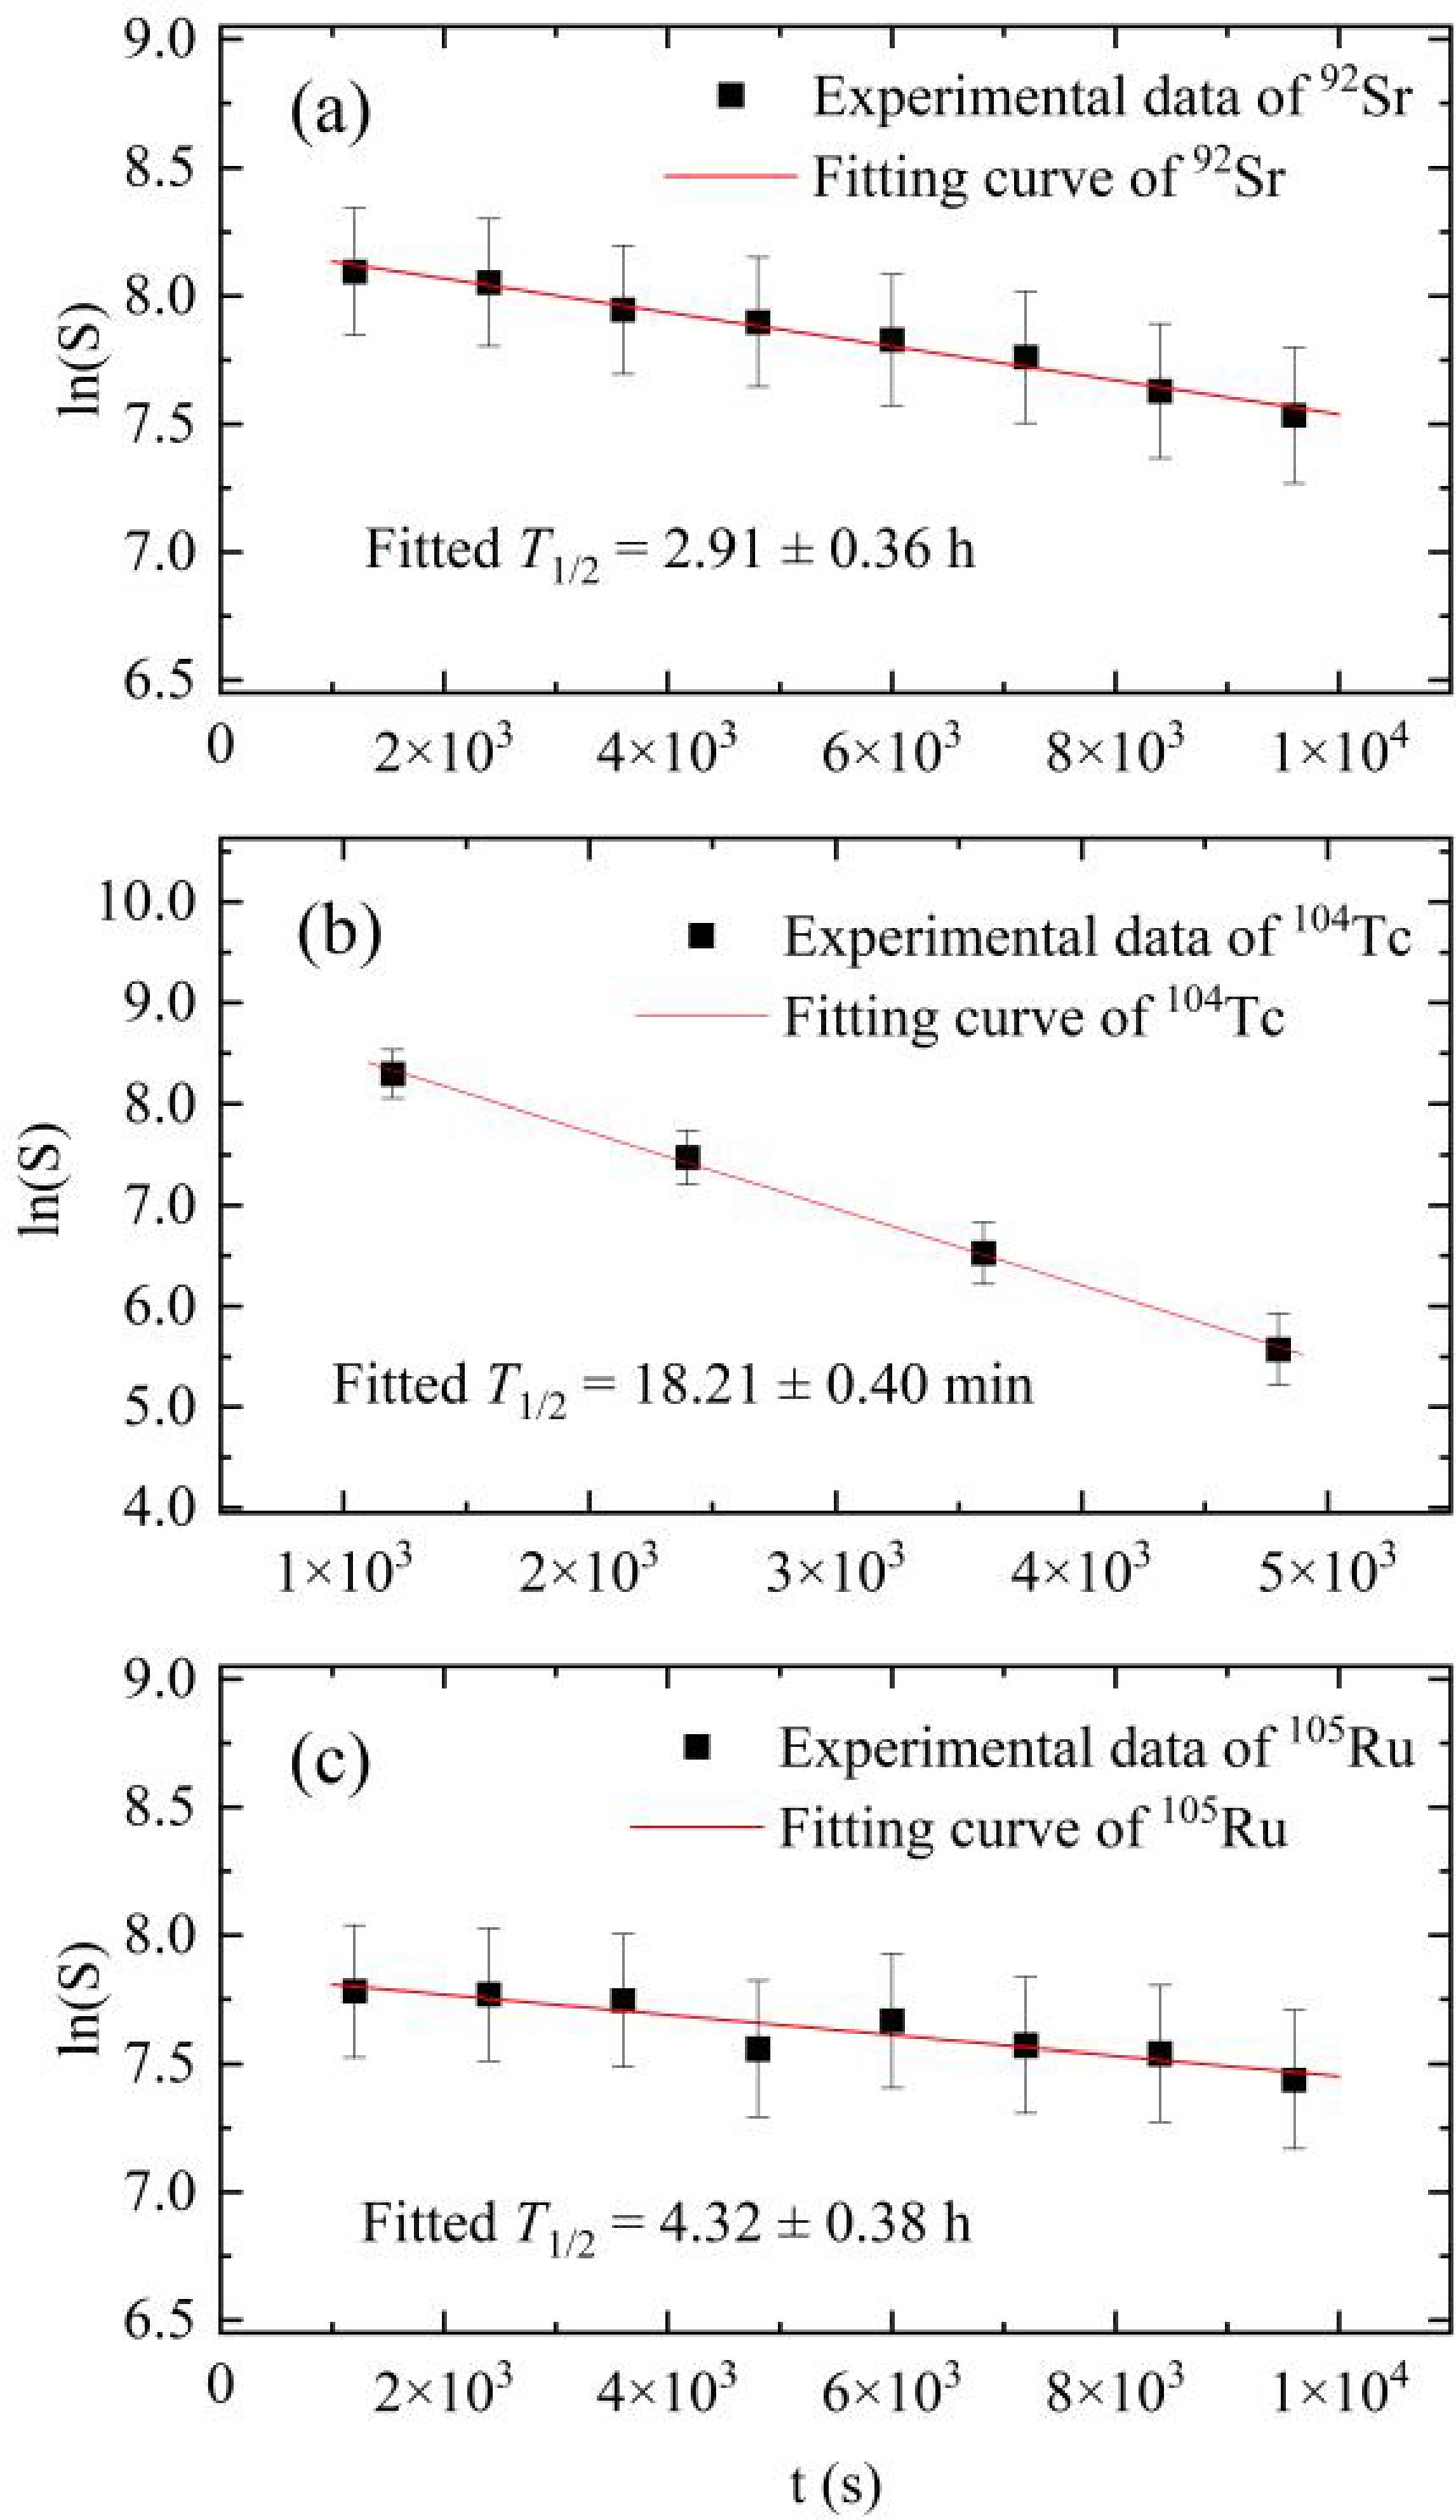
Figure 5. (color online) Relationship between measurement time and the logarithm of characteristic γ-ray peak counts for 92Sr, 104Tc, and 105Ru.
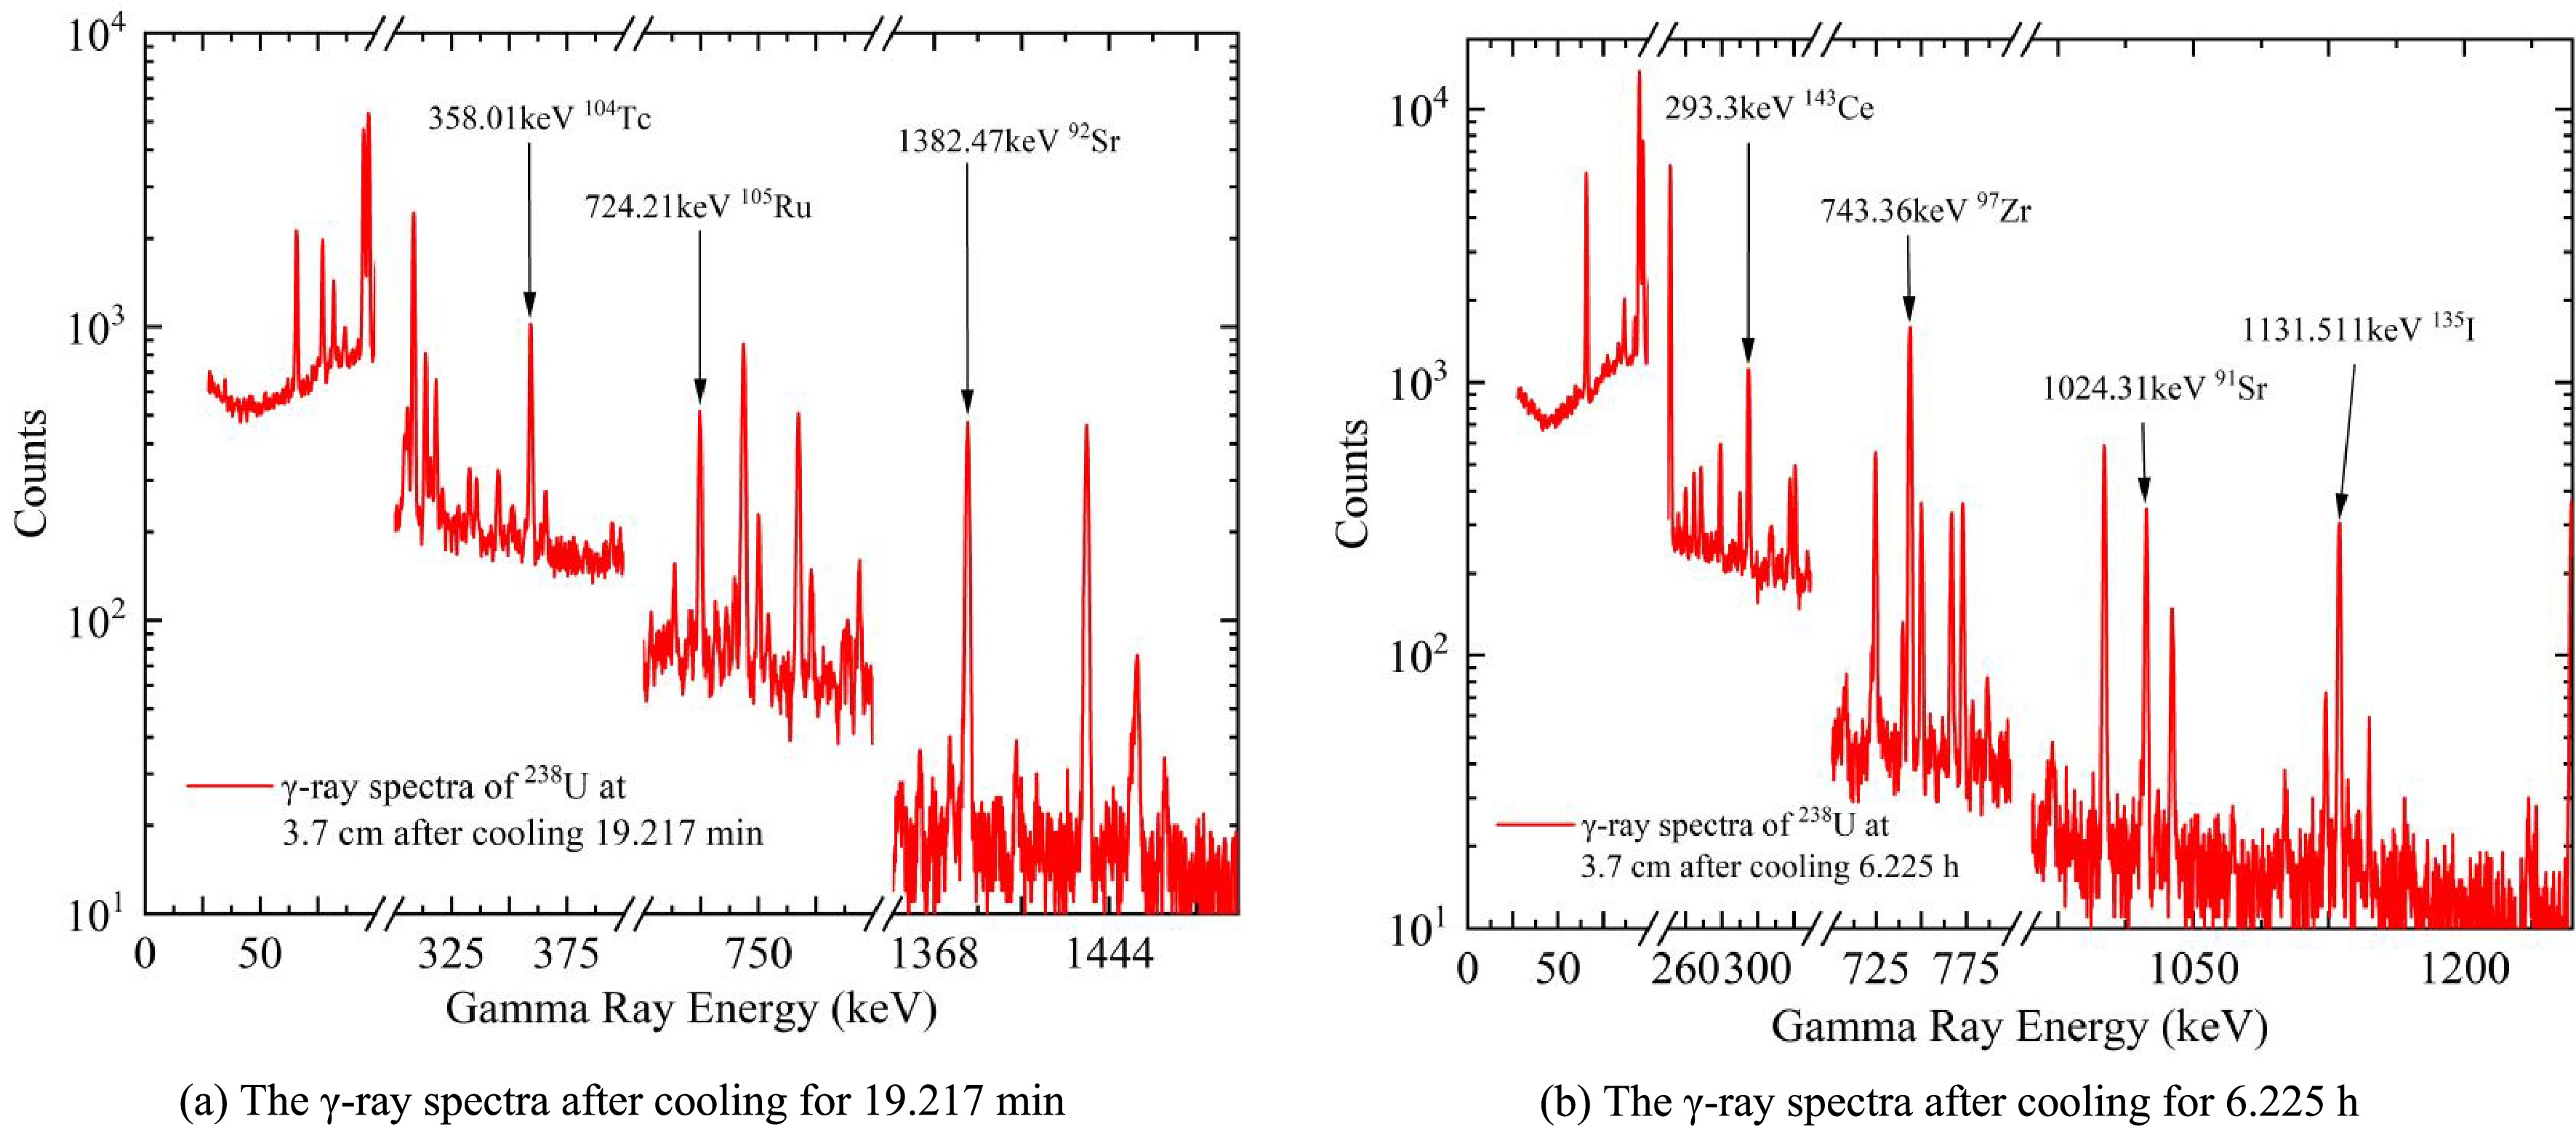
Figure 6. (color online) The background-subtracted γ spectra of different fission products measured by HPGe.
When γ-rays enter the HPGe crystal, they deposit energy primarily through the photoelectric effect, Compton scattering, and pair production. The electron-hole pairs generated within the crystal are collected under a high-voltage electric field, forming weak charge pulses. These pulses are then shaped and linearly amplified with extremely low noise by the preamplifier and main amplifier. The processed signals are subsequently fed into a multichannel analyzer (MCA). Since the amplitude of each pulse is proportional to the energy of the incident γ-ray, the MCA assigns each pulse to its corresponding channel address (the horizontal axis of the energy spectrum) and accumulates the counts. This process is repeated continuously, ultimately generating a γ-ray energy spectrum with energy on the horizontal axis and counts on the vertical axis. Following spectrum acquisition, data processing was performed using professional analysis software (Genie 2000, GammaVision, etc.).
The analysis workflow generally consists of the following steps. First, peak searching is performed to identify all peak positions in the energy spectrum, and the net peak area of each peak is recorded. Subsequently, the fitted T1/2 is obtained by analyzing the relationship between measurement time and net peak area across several consecutive γ-ray spectra. The nuclide corresponding to the peak is then identified by combining the Eγ and the Iγ with the fitted T1/2. Finally, the cumulative yield of the identified nuclides is calculated. Recent studies [19, 20] provide additional perspective. Further exploration along this direction may be pursued in future work.
-
Following neutron activation, the irradiated 238U sample was subjected to a cooling time of 19.217 min and 6.225 h, respectively, to capture fission products with distinct half-lives. The 238U sample that underwent the short cooling period (19.217 min) was measured using a pre-calibrated HPGe detector (GEM-50P4) at 20 min intervals, yielding a total of 11 γ-ray spectra. The sample subjected to the long cooling time (6.225 h) was measured at hourly intervals, resulting in 16 spectra. The HPGe detector used in the experiment had a relative efficiency of 50% and an energy resolution of 1.9 keV for the 1.332 MeV γ-ray from 60Co. Offline γ-ray acquisition was performed using ORTEC®MAESTRO-6.01.
The decay constant, obtained from the slope of the fitted curve, was used to calculate the fitted half-life (T1/2). Combined with the characteristic γ-ray energy (Eγ) and γ-ray intensity (Iγ) listed in Table 2, these results enabled the unambiguous identification of the fission product nuclides associated with the observed characteristic γ-ray emissions. Using this method, seven fission products were ultimately determined, and the fitting results for 92Sr, 104Tc, and 105Ru, shown in Fig. 5, serve as three illustrative examples. Based on the fitted decay constants, the half-lives of 92Sr, 104Tc, and 105Ru were determined to be 2.91 ± 0.36 h, 18.21 ± 0.40 min, and 4.32 ± 0.38 h, respectively. The fluctuations observed in the 105Ru data are mainly attributed to counting statistical uncertainties, which become more significant at lower count rates. In addition, uncertainties associated with peak-area determination, potential interference from neighboring γ-ray peaks in the measured spectrum, and background subtraction may also contribute to the observed discrepancies. The results are presented in Fig. 6, which shows the γ-ray spectrum along with the measured nuclides and their characteristic peaks.
Fission Products T1/2 Eγ /keV Iγ (%) 91Sr 9.65±0.06 h 1024.31 33.5±1.1 92Sr 2.61±0.017 h 1383.93 90.0±0.6 97Zr 16.75±0.008 h 743.36 93.1±0.2 104Tc 18.3±0.3 m 358.01 89.0±0.3 105Ru 4.44±0.011 h 724.21 47.9±0.1 135I 6.58±0.03 h 1131.51 22.6±0.7 143Ce 33.04±0.01 h 293.27 42.8±0.4 Table 2. The decay data of identified fission products.
Figure 5. (color online) Relationship between measurement time and the logarithm of characteristic γ-ray peak counts for 92Sr, 104Tc, and 105Ru.
Figure 6. (color online) The background-subtracted γ spectra of different fission products measured by HPGe.
When γ-rays enter the HPGe crystal, they deposit energy primarily through the photoelectric effect, Compton scattering, and pair production. The electron-hole pairs generated within the crystal are collected under a high-voltage electric field, forming weak charge pulses. These pulses are then shaped and linearly amplified with extremely low noise by the preamplifier and main amplifier. The processed signals are subsequently fed into a multichannel analyzer (MCA). Since the amplitude of each pulse is proportional to the energy of the incident γ-ray, the MCA assigns each pulse to its corresponding channel address (the horizontal axis of the energy spectrum) and accumulates the counts. This process is repeated continuously, ultimately generating a γ-ray energy spectrum with energy on the horizontal axis and counts on the vertical axis. Following spectrum acquisition, data processing was performed using professional analysis software (Genie 2000, GammaVision, etc.).
The analysis workflow generally consists of the following steps. First, peak searching is performed to identify all peak positions in the energy spectrum, and the net peak area of each peak is recorded. Subsequently, the fitted T1/2 is obtained by analyzing the relationship between measurement time and net peak area across several consecutive γ-ray spectra. The nuclide corresponding to the peak is then identified by combining the Eγ and the Iγ with the fitted T1/2. Finally, the cumulative yield of the identified nuclides is calculated. Recent studies [19, 20] provide additional perspective. Further exploration along this direction may be pursued in future work.
-
Following neutron activation, the irradiated 238U sample was subjected to a cooling time of 19.217 min and 6.225 h, respectively, to capture fission products with distinct half-lives. The 238U sample that underwent the short cooling period (19.217 min) was measured using a pre-calibrated HPGe detector (GEM-50P4) at 20 min intervals, yielding a total of 11 γ-ray spectra. The sample subjected to the long cooling time (6.225 h) was measured at hourly intervals, resulting in 16 spectra. The HPGe detector used in the experiment had a relative efficiency of 50% and an energy resolution of 1.9 keV for the 1.332 MeV γ-ray from 60Co. Offline γ-ray acquisition was performed using ORTEC®MAESTRO-6.01.
The decay constant, obtained from the slope of the fitted curve, was used to calculate the fitted half-life (T1/2). Combined with the characteristic γ-ray energy (Eγ) and γ-ray intensity (Iγ) listed in Table 2, these results enabled the unambiguous identification of the fission product nuclides associated with the observed characteristic γ-ray emissions. Using this method, seven fission products were ultimately determined, and the fitting results for 92Sr, 104Tc, and 105Ru, shown in Fig. 5, serve as three illustrative examples. Based on the fitted decay constants, the half-lives of 92Sr, 104Tc, and 105Ru were determined to be 2.91 ± 0.36 h, 18.21 ± 0.40 min, and 4.32 ± 0.38 h, respectively. The fluctuations observed in the 105Ru data are mainly attributed to counting statistical uncertainties, which become more significant at lower count rates. In addition, uncertainties associated with peak-area determination, potential interference from neighboring γ-ray peaks in the measured spectrum, and background subtraction may also contribute to the observed discrepancies. The results are presented in Fig. 6, which shows the γ-ray spectrum along with the measured nuclides and their characteristic peaks.
Fission Products T1/2 Eγ /keV Iγ (%) 91Sr 9.65±0.06 h 1024.31 33.5±1.1 92Sr 2.61±0.017 h 1383.93 90.0±0.6 97Zr 16.75±0.008 h 743.36 93.1±0.2 104Tc 18.3±0.3 m 358.01 89.0±0.3 105Ru 4.44±0.011 h 724.21 47.9±0.1 135I 6.58±0.03 h 1131.51 22.6±0.7 143Ce 33.04±0.01 h 293.27 42.8±0.4 Table 2. The decay data of identified fission products.
Figure 5. (color online) Relationship between measurement time and the logarithm of characteristic γ-ray peak counts for 92Sr, 104Tc, and 105Ru.
Figure 6. (color online) The background-subtracted γ spectra of different fission products measured by HPGe.
When γ-rays enter the HPGe crystal, they deposit energy primarily through the photoelectric effect, Compton scattering, and pair production. The electron-hole pairs generated within the crystal are collected under a high-voltage electric field, forming weak charge pulses. These pulses are then shaped and linearly amplified with extremely low noise by the preamplifier and main amplifier. The processed signals are subsequently fed into a multichannel analyzer (MCA). Since the amplitude of each pulse is proportional to the energy of the incident γ-ray, the MCA assigns each pulse to its corresponding channel address (the horizontal axis of the energy spectrum) and accumulates the counts. This process is repeated continuously, ultimately generating a γ-ray energy spectrum with energy on the horizontal axis and counts on the vertical axis. Following spectrum acquisition, data processing was performed using professional analysis software (Genie 2000, GammaVision, etc.).
The analysis workflow generally consists of the following steps. First, peak searching is performed to identify all peak positions in the energy spectrum, and the net peak area of each peak is recorded. Subsequently, the fitted T1/2 is obtained by analyzing the relationship between measurement time and net peak area across several consecutive γ-ray spectra. The nuclide corresponding to the peak is then identified by combining the Eγ and the Iγ with the fitted T1/2. Finally, the cumulative yield of the identified nuclides is calculated. Recent studies [19, 20] provide additional perspective. Further exploration along this direction may be pursued in future work.
-
Following neutron activation, the irradiated 238U sample was subjected to a cooling time of 19.217 min and 6.225 h, respectively, to capture fission products with distinct half-lives. The 238U sample that underwent the short cooling period (19.217 min) was measured using a pre-calibrated HPGe detector (GEM-50P4) at 20 min intervals, yielding a total of 11 γ-ray spectra. The sample subjected to the long cooling time (6.225 h) was measured at hourly intervals, resulting in 16 spectra. The HPGe detector used in the experiment had a relative efficiency of 50% and an energy resolution of 1.9 keV for the 1.332 MeV γ-ray from 60Co. Offline γ-ray acquisition was performed using ORTEC®MAESTRO-6.01.
The decay constant, obtained from the slope of the fitted curve, was used to calculate the fitted half-life (T1/2). Combined with the characteristic γ-ray energy (Eγ) and γ-ray intensity (Iγ) listed in Table 2, these results enabled the unambiguous identification of the fission product nuclides associated with the observed characteristic γ-ray emissions. Using this method, seven fission products were ultimately determined, and the fitting results for 92Sr, 104Tc, and 105Ru, shown in Fig. 5, serve as three illustrative examples. Based on the fitted decay constants, the half-lives of 92Sr, 104Tc, and 105Ru were determined to be 2.91 ± 0.36 h, 18.21 ± 0.40 min, and 4.32 ± 0.38 h, respectively. The fluctuations observed in the 105Ru data are mainly attributed to counting statistical uncertainties, which become more significant at lower count rates. In addition, uncertainties associated with peak-area determination, potential interference from neighboring γ-ray peaks in the measured spectrum, and background subtraction may also contribute to the observed discrepancies. The results are presented in Fig. 6, which shows the γ-ray spectrum along with the measured nuclides and their characteristic peaks.
Fission Products T1/2 Eγ /keV Iγ (%) 91Sr 9.65±0.06 h 1024.31 33.5±1.1 92Sr 2.61±0.017 h 1383.93 90.0±0.6 97Zr 16.75±0.008 h 743.36 93.1±0.2 104Tc 18.3±0.3 m 358.01 89.0±0.3 105Ru 4.44±0.011 h 724.21 47.9±0.1 135I 6.58±0.03 h 1131.51 22.6±0.7 143Ce 33.04±0.01 h 293.27 42.8±0.4 Table 2. The decay data of identified fission products.
Figure 5. (color online) Relationship between measurement time and the logarithm of characteristic γ-ray peak counts for 92Sr, 104Tc, and 105Ru.
Figure 6. (color online) The background-subtracted γ spectra of different fission products measured by HPGe.
When γ-rays enter the HPGe crystal, they deposit energy primarily through the photoelectric effect, Compton scattering, and pair production. The electron-hole pairs generated within the crystal are collected under a high-voltage electric field, forming weak charge pulses. These pulses are then shaped and linearly amplified with extremely low noise by the preamplifier and main amplifier. The processed signals are subsequently fed into a multichannel analyzer (MCA). Since the amplitude of each pulse is proportional to the energy of the incident γ-ray, the MCA assigns each pulse to its corresponding channel address (the horizontal axis of the energy spectrum) and accumulates the counts. This process is repeated continuously, ultimately generating a γ-ray energy spectrum with energy on the horizontal axis and counts on the vertical axis. Following spectrum acquisition, data processing was performed using professional analysis software (Genie 2000, GammaVision, etc.).
The analysis workflow generally consists of the following steps. First, peak searching is performed to identify all peak positions in the energy spectrum, and the net peak area of each peak is recorded. Subsequently, the fitted T1/2 is obtained by analyzing the relationship between measurement time and net peak area across several consecutive γ-ray spectra. The nuclide corresponding to the peak is then identified by combining the Eγ and the Iγ with the fitted T1/2. Finally, the cumulative yield of the identified nuclides is calculated. Recent studies [19, 20] provide additional perspective. Further exploration along this direction may be pursued in future work.
-
Following neutron activation, the irradiated 238U sample was subjected to a cooling time of 19.217 min and 6.225 h, respectively, to capture fission products with distinct half-lives. The 238U sample that underwent the short cooling period (19.217 min) was measured using a pre-calibrated HPGe detector (GEM-50P4) at 20 min intervals, yielding a total of 11 γ-ray spectra. The sample subjected to the long cooling time (6.225 h) was measured at hourly intervals, resulting in 16 spectra. The HPGe detector used in the experiment had a relative efficiency of 50% and an energy resolution of 1.9 keV for the 1.332 MeV γ-ray from 60Co. Offline γ-ray acquisition was performed using ORTEC®MAESTRO-6.01.
The decay constant, obtained from the slope of the fitted curve, was used to calculate the fitted half-life (T1/2). Combined with the characteristic γ-ray energy (Eγ) and γ-ray intensity (Iγ) listed in Table 2, these results enabled the unambiguous identification of the fission product nuclides associated with the observed characteristic γ-ray emissions. Using this method, seven fission products were ultimately determined, and the fitting results for 92Sr, 104Tc, and 105Ru, shown in Fig. 5, serve as three illustrative examples. Based on the fitted decay constants, the half-lives of 92Sr, 104Tc, and 105Ru were determined to be 2.91 ± 0.36 h, 18.21 ± 0.40 min, and 4.32 ± 0.38 h, respectively. The fluctuations observed in the 105Ru data are mainly attributed to counting statistical uncertainties, which become more significant at lower count rates. In addition, uncertainties associated with peak-area determination, potential interference from neighboring γ-ray peaks in the measured spectrum, and background subtraction may also contribute to the observed discrepancies. The results are presented in Fig. 6, which shows the γ-ray spectrum along with the measured nuclides and their characteristic peaks.
Fission Products T1/2 Eγ /keV Iγ (%) 91Sr 9.65±0.06 h 1024.31 33.5±1.1 92Sr 2.61±0.017 h 1383.93 90.0±0.6 97Zr 16.75±0.008 h 743.36 93.1±0.2 104Tc 18.3±0.3 m 358.01 89.0±0.3 105Ru 4.44±0.011 h 724.21 47.9±0.1 135I 6.58±0.03 h 1131.51 22.6±0.7 143Ce 33.04±0.01 h 293.27 42.8±0.4 Table 2. The decay data of identified fission products.
Figure 5. (color online) Relationship between measurement time and the logarithm of characteristic γ-ray peak counts for 92Sr, 104Tc, and 105Ru.
Figure 6. (color online) The background-subtracted γ spectra of different fission products measured by HPGe.
When γ-rays enter the HPGe crystal, they deposit energy primarily through the photoelectric effect, Compton scattering, and pair production. The electron-hole pairs generated within the crystal are collected under a high-voltage electric field, forming weak charge pulses. These pulses are then shaped and linearly amplified with extremely low noise by the preamplifier and main amplifier. The processed signals are subsequently fed into a multichannel analyzer (MCA). Since the amplitude of each pulse is proportional to the energy of the incident γ-ray, the MCA assigns each pulse to its corresponding channel address (the horizontal axis of the energy spectrum) and accumulates the counts. This process is repeated continuously, ultimately generating a γ-ray energy spectrum with energy on the horizontal axis and counts on the vertical axis. Following spectrum acquisition, data processing was performed using professional analysis software (Genie 2000, GammaVision, etc.).
The analysis workflow generally consists of the following steps. First, peak searching is performed to identify all peak positions in the energy spectrum, and the net peak area of each peak is recorded. Subsequently, the fitted T1/2 is obtained by analyzing the relationship between measurement time and net peak area across several consecutive γ-ray spectra. The nuclide corresponding to the peak is then identified by combining the Eγ and the Iγ with the fitted T1/2. Finally, the cumulative yield of the identified nuclides is calculated. Recent studies [19, 20] provide additional perspective. Further exploration along this direction may be pursued in future work.
-
The derivation of the cumulative FPY formula is closely related to the advancement of nuclear physics, the theory of radioactive decay, and the statistical nature of the fission process. The establishment of this formula has evolved from experimental measurements to theoretical models, and has been continuously refined through experimental validation and the development of databases. The following Eq. (1) can be used to calculate the cumulative FPY of the 238U(n, f) reaction by measuring the characteristic γ-rays produced after β decay [21, 22]. The fission product decay data used in the calculations, obtained from the NNDC (National Nuclear Data Center) [23], are compiled in Table 2.
$ Y=\frac{S\lambda {C}_{s}{F}_{t}{F}_{e}}{\phi \sigma N{I}_{\gamma}{\epsilon }_{\gamma}\exp(-\lambda {t}_{1})\left(1-\exp (-\lambda {t}_{2})\right)\displaystyle \sum \limits_{\mathrm{x}=1}^{n}\exp \left(-\lambda ({T}_{nf}-{T}_{\mathrm{x}f})\right)\left[1-\exp \left(-\lambda ({T}_{xf}-{T}_{xi})\right)\right]}, $
(1) where S is the net count of γ-rays; λ denotes the decay constant; Cs is the self-absorption correction factor of γ-ray; Ft denotes the dead time correction factor; Fe is the other correction factor; ϕ denotes the neutron flux density; σ is fission cross section; N denotes number of nucleons in the sample; Iγ is the absolute intensity of γ-ray; ϵγ denotes the γ-ray detection efficiency; t1 is cooling time; t2 denotes the instrument measurement time; Txi and Txf denote the start time and end time of the x-th irradiation in n times of irradiations.
-
The derivation of the cumulative FPY formula is closely related to the advancement of nuclear physics, the theory of radioactive decay, and the statistical nature of the fission process. The establishment of this formula has evolved from experimental measurements to theoretical models, and has been continuously refined through experimental validation and the development of databases. The following Eq. (1) can be used to calculate the cumulative FPY of the 238U(n, f) reaction by measuring the characteristic γ-rays produced after β decay [21, 22]. The fission product decay data used in the calculations, obtained from the NNDC (National Nuclear Data Center) [23], are compiled in Table 2.
$ Y=\frac{S\lambda {C}_{s}{F}_{t}{F}_{e}}{\phi \sigma N{I}_{\gamma}{\epsilon }_{\gamma}\exp(-\lambda {t}_{1})\left(1-\exp (-\lambda {t}_{2})\right)\displaystyle \sum \limits_{\mathrm{x}=1}^{n}\exp \left(-\lambda ({T}_{nf}-{T}_{\mathrm{x}f})\right)\left[1-\exp \left(-\lambda ({T}_{xf}-{T}_{xi})\right)\right]}, $
(1) where S is the net count of γ-rays; λ denotes the decay constant; Cs is the self-absorption correction factor of γ-ray; Ft denotes the dead time correction factor; Fe is the other correction factor; ϕ denotes the neutron flux density; σ is fission cross section; N denotes number of nucleons in the sample; Iγ is the absolute intensity of γ-ray; ϵγ denotes the γ-ray detection efficiency; t1 is cooling time; t2 denotes the instrument measurement time; Txi and Txf denote the start time and end time of the x-th irradiation in n times of irradiations.
-
The derivation of the cumulative FPY formula is closely related to the advancement of nuclear physics, the theory of radioactive decay, and the statistical nature of the fission process. The establishment of this formula has evolved from experimental measurements to theoretical models, and has been continuously refined through experimental validation and the development of databases. The following Eq. (1) can be used to calculate the cumulative FPY of the 238U(n, f) reaction by measuring the characteristic γ-rays produced after β decay [21, 22]. The fission product decay data used in the calculations, obtained from the NNDC (National Nuclear Data Center) [23], are compiled in Table 2.
$ Y=\frac{S\lambda {C}_{s}{F}_{t}{F}_{e}}{\phi \sigma N{I}_{\gamma}{\epsilon }_{\gamma}\exp(-\lambda {t}_{1})\left(1-\exp (-\lambda {t}_{2})\right)\displaystyle \sum \limits_{\mathrm{x}=1}^{n}\exp \left(-\lambda ({T}_{nf}-{T}_{\mathrm{x}f})\right)\left[1-\exp \left(-\lambda ({T}_{xf}-{T}_{xi})\right)\right]}, $
(1) where S is the net count of γ-rays; λ denotes the decay constant; Cs is the self-absorption correction factor of γ-ray; Ft denotes the dead time correction factor; Fe is the other correction factor; ϕ denotes the neutron flux density; σ is fission cross section; N denotes number of nucleons in the sample; Iγ is the absolute intensity of γ-ray; ϵγ denotes the γ-ray detection efficiency; t1 is cooling time; t2 denotes the instrument measurement time; Txi and Txf denote the start time and end time of the x-th irradiation in n times of irradiations.
-
The derivation of the cumulative FPY formula is closely related to the advancement of nuclear physics, the theory of radioactive decay, and the statistical nature of the fission process. The establishment of this formula has evolved from experimental measurements to theoretical models, and has been continuously refined through experimental validation and the development of databases. The following Eq. (1) can be used to calculate the cumulative FPY of the 238U(n, f) reaction by measuring the characteristic γ-rays produced after β decay [21, 22]. The fission product decay data used in the calculations, obtained from the NNDC (National Nuclear Data Center) [23], are compiled in Table 2.
$ Y=\frac{S\lambda {C}_{s}{F}_{t}{F}_{e}}{\phi \sigma N{I}_{\gamma}{\epsilon }_{\gamma}\exp(-\lambda {t}_{1})\left(1-\exp (-\lambda {t}_{2})\right)\displaystyle \sum \limits_{\mathrm{x}=1}^{n}\exp \left(-\lambda ({T}_{nf}-{T}_{\mathrm{x}f})\right)\left[1-\exp \left(-\lambda ({T}_{xf}-{T}_{xi})\right)\right]}, $
(1) where S is the net count of γ-rays; λ denotes the decay constant; Cs is the self-absorption correction factor of γ-ray; Ft denotes the dead time correction factor; Fe is the other correction factor; ϕ denotes the neutron flux density; σ is fission cross section; N denotes number of nucleons in the sample; Iγ is the absolute intensity of γ-ray; ϵγ denotes the γ-ray detection efficiency; t1 is cooling time; t2 denotes the instrument measurement time; Txi and Txf denote the start time and end time of the x-th irradiation in n times of irradiations.
-
The derivation of the cumulative FPY formula is closely related to the advancement of nuclear physics, the theory of radioactive decay, and the statistical nature of the fission process. The establishment of this formula has evolved from experimental measurements to theoretical models, and has been continuously refined through experimental validation and the development of databases. The following Eq. (1) can be used to calculate the cumulative FPY of the 238U(n, f) reaction by measuring the characteristic γ-rays produced after β decay [21, 22]. The fission product decay data used in the calculations, obtained from the NNDC (National Nuclear Data Center) [23], are compiled in Table 2.
$ Y=\frac{S\lambda {C}_{s}{F}_{t}{F}_{e}}{\phi \sigma N{I}_{\gamma}{\epsilon }_{\gamma}\exp(-\lambda {t}_{1})\left(1-\exp (-\lambda {t}_{2})\right)\displaystyle \sum \limits_{\mathrm{x}=1}^{n}\exp \left(-\lambda ({T}_{nf}-{T}_{\mathrm{x}f})\right)\left[1-\exp \left(-\lambda ({T}_{xf}-{T}_{xi})\right)\right]}, $
(1) where S is the net count of γ-rays; λ denotes the decay constant; Cs is the self-absorption correction factor of γ-ray; Ft denotes the dead time correction factor; Fe is the other correction factor; ϕ denotes the neutron flux density; σ is fission cross section; N denotes number of nucleons in the sample; Iγ is the absolute intensity of γ-ray; ϵγ denotes the γ-ray detection efficiency; t1 is cooling time; t2 denotes the instrument measurement time; Txi and Txf denote the start time and end time of the x-th irradiation in n times of irradiations.
-
Data correction is an important part of experimental analysis in nuclear physics. Several correction procedures were used to account for the effects of detector efficiency, decay during irradiation, measurement, and variations in the neutron flux [24, 25]. These corrections were made to reduce systematic errors and obtain a precise cumulative fission yield for the fission product of interest. A rigorous correction procedure is essential for ensuring the reliability, accuracy, and scientific value of nuclear physics data. In the present work, the following corrections were accounted for: the uranium isotope correction, the γ-ray cascade coincidence correction, the self-absorption correction, and the neutron flux fluctuation correction.
-
Data correction is an important part of experimental analysis in nuclear physics. Several correction procedures were used to account for the effects of detector efficiency, decay during irradiation, measurement, and variations in the neutron flux [24, 25]. These corrections were made to reduce systematic errors and obtain a precise cumulative fission yield for the fission product of interest. A rigorous correction procedure is essential for ensuring the reliability, accuracy, and scientific value of nuclear physics data. In the present work, the following corrections were accounted for: the uranium isotope correction, the γ-ray cascade coincidence correction, the self-absorption correction, and the neutron flux fluctuation correction.
-
Data correction is an important part of experimental analysis in nuclear physics. Several correction procedures were used to account for the effects of detector efficiency, decay during irradiation, measurement, and variations in the neutron flux [24, 25]. These corrections were made to reduce systematic errors and obtain a precise cumulative fission yield for the fission product of interest. A rigorous correction procedure is essential for ensuring the reliability, accuracy, and scientific value of nuclear physics data. In the present work, the following corrections were accounted for: the uranium isotope correction, the γ-ray cascade coincidence correction, the self-absorption correction, and the neutron flux fluctuation correction.
-
Data correction is an important part of experimental analysis in nuclear physics. Several correction procedures were used to account for the effects of detector efficiency, decay during irradiation, measurement, and variations in the neutron flux [24, 25]. These corrections were made to reduce systematic errors and obtain a precise cumulative fission yield for the fission product of interest. A rigorous correction procedure is essential for ensuring the reliability, accuracy, and scientific value of nuclear physics data. In the present work, the following corrections were accounted for: the uranium isotope correction, the γ-ray cascade coincidence correction, the self-absorption correction, and the neutron flux fluctuation correction.
-
Data correction is an important part of experimental analysis in nuclear physics. Several correction procedures were used to account for the effects of detector efficiency, decay during irradiation, measurement, and variations in the neutron flux [24, 25]. These corrections were made to reduce systematic errors and obtain a precise cumulative fission yield for the fission product of interest. A rigorous correction procedure is essential for ensuring the reliability, accuracy, and scientific value of nuclear physics data. In the present work, the following corrections were accounted for: the uranium isotope correction, the γ-ray cascade coincidence correction, the self-absorption correction, and the neutron flux fluctuation correction.
-
The natural uranium sample comprises the isotopes 235U and 234U. The experimentally measured result constitutes a weighted sum of contributions from uranium isotopes. Extracting the result specific to 238U requires subtracting the contributions of 235U and 234U from the total sample measurement, a process that constitutes an isotopic correction. The calculation in Eq. (2) is as follows:
$ {F}_{i}=\frac{Y{\theta }_{238}{\sigma }_{238}-{Y}_{235}{\theta }_{235}{\sigma }_{235}-{Y}_{234}{\theta }_{234}{\sigma }_{234}}{Y{\theta }_{238}{\sigma }_{238}}. $
(2) Y is the FPYs calculated in Eq. (1). Y234 and Y235 denote the FPYs of 234U and 235U, respectively, induced by 2.9 MeV neutrons. θ234, θ235 and θ238 denote the isotopic abundances of 234U, 235U and 238U. σ234, σ235 and σ238 stand for the fission cross sections of 234U, 235U and 238U, respectively.
Upon review of databases and the literature, it was found that fission yields for 234U and 235U induced by 2.9 MeV neutrons are unavailable. To obtain the isotopic correction factors, fission yields at this energy were interpolated from ENDF/B-VIII.0 data (Evaluated Nuclear Data File) library [26].
-
The natural uranium sample comprises the isotopes 235U and 234U. The experimentally measured result constitutes a weighted sum of contributions from uranium isotopes. Extracting the result specific to 238U requires subtracting the contributions of 235U and 234U from the total sample measurement, a process that constitutes an isotopic correction. The calculation in Eq. (2) is as follows:
$ {F}_{i}=\frac{Y{\theta }_{238}{\sigma }_{238}-{Y}_{235}{\theta }_{235}{\sigma }_{235}-{Y}_{234}{\theta }_{234}{\sigma }_{234}}{Y{\theta }_{238}{\sigma }_{238}}. $
(2) Y is the FPYs calculated in Eq. (1). Y234 and Y235 denote the FPYs of 234U and 235U, respectively, induced by 2.9 MeV neutrons. θ234, θ235 and θ238 denote the isotopic abundances of 234U, 235U and 238U. σ234, σ235 and σ238 stand for the fission cross sections of 234U, 235U and 238U, respectively.
Upon review of databases and the literature, it was found that fission yields for 234U and 235U induced by 2.9 MeV neutrons are unavailable. To obtain the isotopic correction factors, fission yields at this energy were interpolated from ENDF/B-VIII.0 data (Evaluated Nuclear Data File) library [26].
-
The natural uranium sample comprises the isotopes 235U and 234U. The experimentally measured result constitutes a weighted sum of contributions from uranium isotopes. Extracting the result specific to 238U requires subtracting the contributions of 235U and 234U from the total sample measurement, a process that constitutes an isotopic correction. The calculation in Eq. (2) is as follows:
$ {F}_{i}=\frac{Y{\theta }_{238}{\sigma }_{238}-{Y}_{235}{\theta }_{235}{\sigma }_{235}-{Y}_{234}{\theta }_{234}{\sigma }_{234}}{Y{\theta }_{238}{\sigma }_{238}}. $
(2) Y is the FPYs calculated in Eq. (1). Y234 and Y235 denote the FPYs of 234U and 235U, respectively, induced by 2.9 MeV neutrons. θ234, θ235 and θ238 denote the isotopic abundances of 234U, 235U and 238U. σ234, σ235 and σ238 stand for the fission cross sections of 234U, 235U and 238U, respectively.
Upon review of databases and the literature, it was found that fission yields for 234U and 235U induced by 2.9 MeV neutrons are unavailable. To obtain the isotopic correction factors, fission yields at this energy were interpolated from ENDF/B-VIII.0 data (Evaluated Nuclear Data File) library [26].
-
The natural uranium sample comprises the isotopes 235U and 234U. The experimentally measured result constitutes a weighted sum of contributions from uranium isotopes. Extracting the result specific to 238U requires subtracting the contributions of 235U and 234U from the total sample measurement, a process that constitutes an isotopic correction. The calculation in Eq. (2) is as follows:
$ {F}_{i}=\frac{Y{\theta }_{238}{\sigma }_{238}-{Y}_{235}{\theta }_{235}{\sigma }_{235}-{Y}_{234}{\theta }_{234}{\sigma }_{234}}{Y{\theta }_{238}{\sigma }_{238}}. $
(2) Y is the FPYs calculated in Eq. (1). Y234 and Y235 denote the FPYs of 234U and 235U, respectively, induced by 2.9 MeV neutrons. θ234, θ235 and θ238 denote the isotopic abundances of 234U, 235U and 238U. σ234, σ235 and σ238 stand for the fission cross sections of 234U, 235U and 238U, respectively.
Upon review of databases and the literature, it was found that fission yields for 234U and 235U induced by 2.9 MeV neutrons are unavailable. To obtain the isotopic correction factors, fission yields at this energy were interpolated from ENDF/B-VIII.0 data (Evaluated Nuclear Data File) library [26].
-
The natural uranium sample comprises the isotopes 235U and 234U. The experimentally measured result constitutes a weighted sum of contributions from uranium isotopes. Extracting the result specific to 238U requires subtracting the contributions of 235U and 234U from the total sample measurement, a process that constitutes an isotopic correction. The calculation in Eq. (2) is as follows:
$ {F}_{i}=\frac{Y{\theta }_{238}{\sigma }_{238}-{Y}_{235}{\theta }_{235}{\sigma }_{235}-{Y}_{234}{\theta }_{234}{\sigma }_{234}}{Y{\theta }_{238}{\sigma }_{238}}. $
(2) Y is the FPYs calculated in Eq. (1). Y234 and Y235 denote the FPYs of 234U and 235U, respectively, induced by 2.9 MeV neutrons. θ234, θ235 and θ238 denote the isotopic abundances of 234U, 235U and 238U. σ234, σ235 and σ238 stand for the fission cross sections of 234U, 235U and 238U, respectively.
Upon review of databases and the literature, it was found that fission yields for 234U and 235U induced by 2.9 MeV neutrons are unavailable. To obtain the isotopic correction factors, fission yields at this energy were interpolated from ENDF/B-VIII.0 data (Evaluated Nuclear Data File) library [26].
-
During γ-ray measurements, if cascade effects are present, coincidence effects may lead to an observed increase or decrease in the counts at the full-energy peak of the measured γ-rays. The coincidence summing correction factor fmi resulting from cascade decay γmi in the coincidence summing case can be expressed as follows [27]:
$ {f}_{mi}=1-h\epsilon _{mi}^{T}, $
(3) where the parameter h represents the ratio of the emission probability of cascade γ-rays to the sum of the emission probabilities of all transitions from the given nuclear state. The full-spectrum detection efficiency or the total efficiency for cascade decay γmi is represented by
$ \epsilon _{mi}^{T} $ .When cascade decay γin and γnj cause coincidence subtraction, the correction factor can be given by [27]:
$ {f}_{in,nj}=1+h\epsilon _{in}^{P}\epsilon _{nj}^{P}, $
(4) where
$ \epsilon _{in}^{P} $ and$ \epsilon _{nj}^{P} $ represent the full-energy peak efficiencies for the cascade decays γin and γnj, respectively. -
During γ-ray measurements, if cascade effects are present, coincidence effects may lead to an observed increase or decrease in the counts at the full-energy peak of the measured γ-rays. The coincidence summing correction factor fmi resulting from cascade decay γmi in the coincidence summing case can be expressed as follows [27]:
$ {f}_{mi}=1-h\epsilon _{mi}^{T}, $
(3) where the parameter h represents the ratio of the emission probability of cascade γ-rays to the sum of the emission probabilities of all transitions from the given nuclear state. The full-spectrum detection efficiency or the total efficiency for cascade decay γmi is represented by
$ \epsilon _{mi}^{T} $ .When cascade decay γin and γnj cause coincidence subtraction, the correction factor can be given by [27]:
$ {f}_{in,nj}=1+h\epsilon _{in}^{P}\epsilon _{nj}^{P}, $
(4) where
$ \epsilon _{in}^{P} $ and$ \epsilon _{nj}^{P} $ represent the full-energy peak efficiencies for the cascade decays γin and γnj, respectively. -
During γ-ray measurements, if cascade effects are present, coincidence effects may lead to an observed increase or decrease in the counts at the full-energy peak of the measured γ-rays. The coincidence summing correction factor fmi resulting from cascade decay γmi in the coincidence summing case can be expressed as follows [27]:
$ {f}_{mi}=1-h\epsilon _{mi}^{T}, $
(3) where the parameter h represents the ratio of the emission probability of cascade γ-rays to the sum of the emission probabilities of all transitions from the given nuclear state. The full-spectrum detection efficiency or the total efficiency for cascade decay γmi is represented by
$ \epsilon _{mi}^{T} $ .When cascade decay γin and γnj cause coincidence subtraction, the correction factor can be given by [27]:
$ {f}_{in,nj}=1+h\epsilon _{in}^{P}\epsilon _{nj}^{P}, $
(4) where
$ \epsilon _{in}^{P} $ and$ \epsilon _{nj}^{P} $ represent the full-energy peak efficiencies for the cascade decays γin and γnj, respectively. -
During γ-ray measurements, if cascade effects are present, coincidence effects may lead to an observed increase or decrease in the counts at the full-energy peak of the measured γ-rays. The coincidence summing correction factor fmi resulting from cascade decay γmi in the coincidence summing case can be expressed as follows [27]:
$ {f}_{mi}=1-h\epsilon _{mi}^{T}, $
(3) where the parameter h represents the ratio of the emission probability of cascade γ-rays to the sum of the emission probabilities of all transitions from the given nuclear state. The full-spectrum detection efficiency or the total efficiency for cascade decay γmi is represented by
$ \epsilon _{mi}^{T} $ .When cascade decay γin and γnj cause coincidence subtraction, the correction factor can be given by [27]:
$ {f}_{in,nj}=1+h\epsilon _{in}^{P}\epsilon _{nj}^{P}, $
(4) where
$ \epsilon _{in}^{P} $ and$ \epsilon _{nj}^{P} $ represent the full-energy peak efficiencies for the cascade decays γin and γnj, respectively. -
During γ-ray measurements, if cascade effects are present, coincidence effects may lead to an observed increase or decrease in the counts at the full-energy peak of the measured γ-rays. The coincidence summing correction factor fmi resulting from cascade decay γmi in the coincidence summing case can be expressed as follows [27]:
$ {f}_{mi}=1-h\epsilon _{mi}^{T}, $
(3) where the parameter h represents the ratio of the emission probability of cascade γ-rays to the sum of the emission probabilities of all transitions from the given nuclear state. The full-spectrum detection efficiency or the total efficiency for cascade decay γmi is represented by
$ \epsilon _{mi}^{T} $ .When cascade decay γin and γnj cause coincidence subtraction, the correction factor can be given by [27]:
$ {f}_{in,nj}=1+h\epsilon _{in}^{P}\epsilon _{nj}^{P}, $
(4) where
$ \epsilon _{in}^{P} $ and$ \epsilon _{nj}^{P} $ represent the full-energy peak efficiencies for the cascade decays γin and γnj, respectively. -
When γ-rays pass through a material medium, they will interact with it. The photoelectric effect, Compton scattering, or pair production are the main ways of energy transfer when γ-rays interact with matter. These interaction mechanisms affect the registered energy spectrum and must be accounted for during detector calibration and data analysis. Their correct modeling is also needed to give a sound interpretation to experimental γ-ray measurements. Consequently, γ-rays lose intensity as they travel through a material [28].
According to the definition of the reaction cross section, the attenuation can be described as:
$ -{\mathrm{d}}I=\sigma IN{\mathrm{d}}t. $
(5) In Eq. (5), the negative sign indicates a reduction in the positive direction. Moreover, σ is the total cross-section of the three effects that the initial conditions can obtain (t=0, I = I0), and µ = σN. In many cases, it is more convenient to express this in terms of the mass attenuation coefficient µm = µ/ρ, so the following Eq. (6) can be derived:
$ I={I}_{0}\exp (-{\mu }_{m}{d}_{m}) ,$
(6) where I is the flux of γ-rays after passing through matter, and I0 is the flux of γ-rays before passing through matter. µm is the γ-ray linear attenuation factor; dm is the mass thickness of the sample.
The self-absorption correction factor can be calculated as expressed in Eq. (7):
$ C=\frac{{\mathrm{\mu}}_{m}{d}_{m}}{1-\exp (-{\mathrm{\mu}}_{m}{d}_{m})}. $
(7) -
When γ-rays pass through a material medium, they will interact with it. The photoelectric effect, Compton scattering, or pair production are the main ways of energy transfer when γ-rays interact with matter. These interaction mechanisms affect the registered energy spectrum and must be accounted for during detector calibration and data analysis. Their correct modeling is also needed to give a sound interpretation to experimental γ-ray measurements. Consequently, γ-rays lose intensity as they travel through a material [28].
According to the definition of the reaction cross section, the attenuation can be described as:
$ -{\mathrm{d}}I=\sigma IN{\mathrm{d}}t. $
(5) In Eq. (5), the negative sign indicates a reduction in the positive direction. Moreover, σ is the total cross-section of the three effects that the initial conditions can obtain (t=0, I = I0), and µ = σN. In many cases, it is more convenient to express this in terms of the mass attenuation coefficient µm = µ/ρ, so the following Eq. (6) can be derived:
$ I={I}_{0}\exp (-{\mu }_{m}{d}_{m}) ,$
(6) where I is the flux of γ-rays after passing through matter, and I0 is the flux of γ-rays before passing through matter. µm is the γ-ray linear attenuation factor; dm is the mass thickness of the sample.
The self-absorption correction factor can be calculated as expressed in Eq. (7):
$ C=\frac{{\mathrm{\mu}}_{m}{d}_{m}}{1-\exp (-{\mathrm{\mu}}_{m}{d}_{m})}. $
(7) -
When γ-rays pass through a material medium, they will interact with it. The photoelectric effect, Compton scattering, or pair production are the main ways of energy transfer when γ-rays interact with matter. These interaction mechanisms affect the registered energy spectrum and must be accounted for during detector calibration and data analysis. Their correct modeling is also needed to give a sound interpretation to experimental γ-ray measurements. Consequently, γ-rays lose intensity as they travel through a material [28].
According to the definition of the reaction cross section, the attenuation can be described as:
$ -{\mathrm{d}}I=\sigma IN{\mathrm{d}}t. $
(5) In Eq. (5), the negative sign indicates a reduction in the positive direction. Moreover, σ is the total cross-section of the three effects that the initial conditions can obtain (t=0, I = I0), and µ = σN. In many cases, it is more convenient to express this in terms of the mass attenuation coefficient µm = µ/ρ, so the following Eq. (6) can be derived:
$ I={I}_{0}\exp (-{\mu }_{m}{d}_{m}) ,$
(6) where I is the flux of γ-rays after passing through matter, and I0 is the flux of γ-rays before passing through matter. µm is the γ-ray linear attenuation factor; dm is the mass thickness of the sample.
The self-absorption correction factor can be calculated as expressed in Eq. (7):
$ C=\frac{{\mathrm{\mu}}_{m}{d}_{m}}{1-\exp (-{\mathrm{\mu}}_{m}{d}_{m})}. $
(7) -
When γ-rays pass through a material medium, they will interact with it. The photoelectric effect, Compton scattering, or pair production are the main ways of energy transfer when γ-rays interact with matter. These interaction mechanisms affect the registered energy spectrum and must be accounted for during detector calibration and data analysis. Their correct modeling is also needed to give a sound interpretation to experimental γ-ray measurements. Consequently, γ-rays lose intensity as they travel through a material [28].
According to the definition of the reaction cross section, the attenuation can be described as:
$ -{\mathrm{d}}I=\sigma IN{\mathrm{d}}t. $
(5) In Eq. (5), the negative sign indicates a reduction in the positive direction. Moreover, σ is the total cross-section of the three effects that the initial conditions can obtain (t=0, I = I0), and µ = σN. In many cases, it is more convenient to express this in terms of the mass attenuation coefficient µm = µ/ρ, so the following Eq. (6) can be derived:
$ I={I}_{0}\exp (-{\mu }_{m}{d}_{m}) ,$
(6) where I is the flux of γ-rays after passing through matter, and I0 is the flux of γ-rays before passing through matter. µm is the γ-ray linear attenuation factor; dm is the mass thickness of the sample.
The self-absorption correction factor can be calculated as expressed in Eq. (7):
$ C=\frac{{\mathrm{\mu}}_{m}{d}_{m}}{1-\exp (-{\mathrm{\mu}}_{m}{d}_{m})}. $
(7) -
When γ-rays pass through a material medium, they will interact with it. The photoelectric effect, Compton scattering, or pair production are the main ways of energy transfer when γ-rays interact with matter. These interaction mechanisms affect the registered energy spectrum and must be accounted for during detector calibration and data analysis. Their correct modeling is also needed to give a sound interpretation to experimental γ-ray measurements. Consequently, γ-rays lose intensity as they travel through a material [28].
According to the definition of the reaction cross section, the attenuation can be described as:
$ -{\mathrm{d}}I=\sigma IN{\mathrm{d}}t. $
(5) In Eq. (5), the negative sign indicates a reduction in the positive direction. Moreover, σ is the total cross-section of the three effects that the initial conditions can obtain (t=0, I = I0), and µ = σN. In many cases, it is more convenient to express this in terms of the mass attenuation coefficient µm = µ/ρ, so the following Eq. (6) can be derived:
$ I={I}_{0}\exp (-{\mu }_{m}{d}_{m}) ,$
(6) where I is the flux of γ-rays after passing through matter, and I0 is the flux of γ-rays before passing through matter. µm is the γ-ray linear attenuation factor; dm is the mass thickness of the sample.
The self-absorption correction factor can be calculated as expressed in Eq. (7):
$ C=\frac{{\mathrm{\mu}}_{m}{d}_{m}}{1-\exp (-{\mathrm{\mu}}_{m}{d}_{m})}. $
(7) -
Due to accelerator beam instability, the neutron flux varies over time. The neutron flux was monitored and recorded in real time to enable correlation of each reaction event with the instantaneous flux at the time of occurrence during data analysis. To monitor the neutron flux variation during the irradiation experiment, 3He particles produced via the D(d, n)3He reaction were detected using an Au-Si detector. A total of sixty spectra were collected through successive measurements taken every 15 min. The 3He particle counts in these spectra could be used to calculate variations in neutron flux. The neutron fluence fluctuation correction factors can be calculated using the following Eq. (8) [5, 29]:
$ \textit{K}=\frac{\left[\displaystyle \sum \nolimits_{i=1}^{n}{\phi }_{i}\left(1-\exp (-\lambda \Delta {t}_{i})\right)\exp (-\lambda {T}_{i})\right]}{\mathit{\Phi }\left(1-\exp (-\lambda T)\right)}, $
(8) where K is the neutron flux fluctuation correction factor, and n is the number of time intervals into which the irradiation time is divided. T is the total irradiation time. ∆ti is the duration of the i'th measurement. Ti is the time from the end of the i'th measurement to the end of irradiation. ϕi is the neutron flux averaged over the sample during ∆ti. Φ is the neutron flux averaged over the sample during the total irradiation time.
-
Due to accelerator beam instability, the neutron flux varies over time. The neutron flux was monitored and recorded in real time to enable correlation of each reaction event with the instantaneous flux at the time of occurrence during data analysis. To monitor the neutron flux variation during the irradiation experiment, 3He particles produced via the D(d, n)3He reaction were detected using an Au-Si detector. A total of sixty spectra were collected through successive measurements taken every 15 min. The 3He particle counts in these spectra could be used to calculate variations in neutron flux. The neutron fluence fluctuation correction factors can be calculated using the following Eq. (8) [5, 29]:
$ \textit{K}=\frac{\left[\displaystyle \sum \nolimits_{i=1}^{n}{\phi }_{i}\left(1-\exp (-\lambda \Delta {t}_{i})\right)\exp (-\lambda {T}_{i})\right]}{\mathit{\Phi }\left(1-\exp (-\lambda T)\right)}, $
(8) where K is the neutron flux fluctuation correction factor, and n is the number of time intervals into which the irradiation time is divided. T is the total irradiation time. ∆ti is the duration of the i'th measurement. Ti is the time from the end of the i'th measurement to the end of irradiation. ϕi is the neutron flux averaged over the sample during ∆ti. Φ is the neutron flux averaged over the sample during the total irradiation time.
-
Due to accelerator beam instability, the neutron flux varies over time. The neutron flux was monitored and recorded in real time to enable correlation of each reaction event with the instantaneous flux at the time of occurrence during data analysis. To monitor the neutron flux variation during the irradiation experiment, 3He particles produced via the D(d, n)3He reaction were detected using an Au-Si detector. A total of sixty spectra were collected through successive measurements taken every 15 min. The 3He particle counts in these spectra could be used to calculate variations in neutron flux. The neutron fluence fluctuation correction factors can be calculated using the following Eq. (8) [5, 29]:
$ \textit{K}=\frac{\left[\displaystyle \sum \nolimits_{i=1}^{n}{\phi }_{i}\left(1-\exp (-\lambda \Delta {t}_{i})\right)\exp (-\lambda {T}_{i})\right]}{\mathit{\Phi }\left(1-\exp (-\lambda T)\right)}, $
(8) where K is the neutron flux fluctuation correction factor, and n is the number of time intervals into which the irradiation time is divided. T is the total irradiation time. ∆ti is the duration of the i'th measurement. Ti is the time from the end of the i'th measurement to the end of irradiation. ϕi is the neutron flux averaged over the sample during ∆ti. Φ is the neutron flux averaged over the sample during the total irradiation time.
-
Due to accelerator beam instability, the neutron flux varies over time. The neutron flux was monitored and recorded in real time to enable correlation of each reaction event with the instantaneous flux at the time of occurrence during data analysis. To monitor the neutron flux variation during the irradiation experiment, 3He particles produced via the D(d, n)3He reaction were detected using an Au-Si detector. A total of sixty spectra were collected through successive measurements taken every 15 min. The 3He particle counts in these spectra could be used to calculate variations in neutron flux. The neutron fluence fluctuation correction factors can be calculated using the following Eq. (8) [5, 29]:
$ \textit{K}=\frac{\left[\displaystyle \sum \nolimits_{i=1}^{n}{\phi }_{i}\left(1-\exp (-\lambda \Delta {t}_{i})\right)\exp (-\lambda {T}_{i})\right]}{\mathit{\Phi }\left(1-\exp (-\lambda T)\right)}, $
(8) where K is the neutron flux fluctuation correction factor, and n is the number of time intervals into which the irradiation time is divided. T is the total irradiation time. ∆ti is the duration of the i'th measurement. Ti is the time from the end of the i'th measurement to the end of irradiation. ϕi is the neutron flux averaged over the sample during ∆ti. Φ is the neutron flux averaged over the sample during the total irradiation time.
-
Due to accelerator beam instability, the neutron flux varies over time. The neutron flux was monitored and recorded in real time to enable correlation of each reaction event with the instantaneous flux at the time of occurrence during data analysis. To monitor the neutron flux variation during the irradiation experiment, 3He particles produced via the D(d, n)3He reaction were detected using an Au-Si detector. A total of sixty spectra were collected through successive measurements taken every 15 min. The 3He particle counts in these spectra could be used to calculate variations in neutron flux. The neutron fluence fluctuation correction factors can be calculated using the following Eq. (8) [5, 29]:
$ \textit{K}=\frac{\left[\displaystyle \sum \nolimits_{i=1}^{n}{\phi }_{i}\left(1-\exp (-\lambda \Delta {t}_{i})\right)\exp (-\lambda {T}_{i})\right]}{\mathit{\Phi }\left(1-\exp (-\lambda T)\right)}, $
(8) where K is the neutron flux fluctuation correction factor, and n is the number of time intervals into which the irradiation time is divided. T is the total irradiation time. ∆ti is the duration of the i'th measurement. Ti is the time from the end of the i'th measurement to the end of irradiation. ϕi is the neutron flux averaged over the sample during ∆ti. Φ is the neutron flux averaged over the sample during the total irradiation time.
-
Counting loss arises from the limited carrier migration rate in HPGe detectors. Both the γ-ray count rate and the number of radionuclides decrease during the measurement process. The leakage rate will decline over the course of the measurement. For short-duration measurements, the change in the total leakage count rate is negligible. Consequently, the actual leakage rate is virtually identical to the average rate and can be approximated as such.
According to published research [30], the correction for 90Rb, with a 158 s half-life, is only 0.02%. This correction decreases with increasing half-life. Given that the shortest half-life among the seven fission products determined in this work is 18.3 min, the correction was considered negligible.
The correction factors for each of these nuclides are summarized in Table 3.
Fission Products Dead Time Correction
FtIsotope Correction
CiCoincidence Summing
Correction CcSelf-absorption Correction
CsNeutron Fluence Fluctuation
Correction K91Sr 1.023 0.975 0.998 1.019 1.002 92Sr 1.066 0.976 0.999 1.015 1.007 97Zr 1.023 0.983 1.000 1.028 1.001 104Tc 1.066 0.993 1.032 1.090 1.005 105Ru 1.066 0.994 1.000 1.029 1.005 135I 1.023 0.984 1.001 1.018 1.003 143Ce 1.023 0.981 1.001 1.132 1.001 Table 3. The values of correction factors for the identified fission products.
-
Counting loss arises from the limited carrier migration rate in HPGe detectors. Both the γ-ray count rate and the number of radionuclides decrease during the measurement process. The leakage rate will decline over the course of the measurement. For short-duration measurements, the change in the total leakage count rate is negligible. Consequently, the actual leakage rate is virtually identical to the average rate and can be approximated as such.
According to published research [30], the correction for 90Rb, with a 158 s half-life, is only 0.02%. This correction decreases with increasing half-life. Given that the shortest half-life among the seven fission products determined in this work is 18.3 min, the correction was considered negligible.
The correction factors for each of these nuclides are summarized in Table 3.
Fission Products Dead Time Correction
FtIsotope Correction
CiCoincidence Summing
Correction CcSelf-absorption Correction
CsNeutron Fluence Fluctuation
Correction K91Sr 1.023 0.975 0.998 1.019 1.002 92Sr 1.066 0.976 0.999 1.015 1.007 97Zr 1.023 0.983 1.000 1.028 1.001 104Tc 1.066 0.993 1.032 1.090 1.005 105Ru 1.066 0.994 1.000 1.029 1.005 135I 1.023 0.984 1.001 1.018 1.003 143Ce 1.023 0.981 1.001 1.132 1.001 Table 3. The values of correction factors for the identified fission products.
-
Counting loss arises from the limited carrier migration rate in HPGe detectors. Both the γ-ray count rate and the number of radionuclides decrease during the measurement process. The leakage rate will decline over the course of the measurement. For short-duration measurements, the change in the total leakage count rate is negligible. Consequently, the actual leakage rate is virtually identical to the average rate and can be approximated as such.
According to published research [30], the correction for 90Rb, with a 158 s half-life, is only 0.02%. This correction decreases with increasing half-life. Given that the shortest half-life among the seven fission products determined in this work is 18.3 min, the correction was considered negligible.
The correction factors for each of these nuclides are summarized in Table 3.
Fission Products Dead Time Correction
FtIsotope Correction
CiCoincidence Summing
Correction CcSelf-absorption Correction
CsNeutron Fluence Fluctuation
Correction K91Sr 1.023 0.975 0.998 1.019 1.002 92Sr 1.066 0.976 0.999 1.015 1.007 97Zr 1.023 0.983 1.000 1.028 1.001 104Tc 1.066 0.993 1.032 1.090 1.005 105Ru 1.066 0.994 1.000 1.029 1.005 135I 1.023 0.984 1.001 1.018 1.003 143Ce 1.023 0.981 1.001 1.132 1.001 Table 3. The values of correction factors for the identified fission products.
-
Counting loss arises from the limited carrier migration rate in HPGe detectors. Both the γ-ray count rate and the number of radionuclides decrease during the measurement process. The leakage rate will decline over the course of the measurement. For short-duration measurements, the change in the total leakage count rate is negligible. Consequently, the actual leakage rate is virtually identical to the average rate and can be approximated as such.
According to published research [30], the correction for 90Rb, with a 158 s half-life, is only 0.02%. This correction decreases with increasing half-life. Given that the shortest half-life among the seven fission products determined in this work is 18.3 min, the correction was considered negligible.
The correction factors for each of these nuclides are summarized in Table 3.
Fission Products Dead Time Correction
FtIsotope Correction
CiCoincidence Summing
Correction CcSelf-absorption Correction
CsNeutron Fluence Fluctuation
Correction K91Sr 1.023 0.975 0.998 1.019 1.002 92Sr 1.066 0.976 0.999 1.015 1.007 97Zr 1.023 0.983 1.000 1.028 1.001 104Tc 1.066 0.993 1.032 1.090 1.005 105Ru 1.066 0.994 1.000 1.029 1.005 135I 1.023 0.984 1.001 1.018 1.003 143Ce 1.023 0.981 1.001 1.132 1.001 Table 3. The values of correction factors for the identified fission products.
-
Counting loss arises from the limited carrier migration rate in HPGe detectors. Both the γ-ray count rate and the number of radionuclides decrease during the measurement process. The leakage rate will decline over the course of the measurement. For short-duration measurements, the change in the total leakage count rate is negligible. Consequently, the actual leakage rate is virtually identical to the average rate and can be approximated as such.
According to published research [30], the correction for 90Rb, with a 158 s half-life, is only 0.02%. This correction decreases with increasing half-life. Given that the shortest half-life among the seven fission products determined in this work is 18.3 min, the correction was considered negligible.
The correction factors for each of these nuclides are summarized in Table 3.
Fission Products Dead Time Correction
FtIsotope Correction
CiCoincidence Summing
Correction CcSelf-absorption Correction
CsNeutron Fluence Fluctuation
Correction K91Sr 1.023 0.975 0.998 1.019 1.002 92Sr 1.066 0.976 0.999 1.015 1.007 97Zr 1.023 0.983 1.000 1.028 1.001 104Tc 1.066 0.993 1.032 1.090 1.005 105Ru 1.066 0.994 1.000 1.029 1.005 135I 1.023 0.984 1.001 1.018 1.003 143Ce 1.023 0.981 1.001 1.132 1.001 Table 3. The values of correction factors for the identified fission products.
-
No measurement is absolutely precise. As such, uncertainty analysis of the 238U(n, f) yield value is equally important. The cumulative fission yield calculated using Eq. (1) depends on the measured γ-ray net peak area, decay data, neutron flux density, number of target nuclei, γ-ray emission probability, detector efficiency, and fission cross section. Therefore, the uncertainty of the cumulative yield was evaluated by propagating the relative uncertainties of these input quantities. The total relative uncertainty for each fission product was calculated using the root-sum-square method:
$ {\textit{E}}_{\text{total}}=\sqrt{\left[{({{\textit{E}}_{\textit{c}}})}^{2}+{({{\textit{E}}_{\textit{T}}})}^{2}+{({{\textit{E}}_{\phi }})}^{2}+{({{\textit{E}}_{\textit{m}}})}^{2}+{({{\textit{E}}_{\textit{I}}})}^{2}+{({{\textit{E}}_{\varepsilon }})}^{2}+{({{\textit{E}}_{\sigma }})}^{2}+{({{\textit{E}}_{\textit{a}}})}^{2}\right]}, $
(9) where Ec is the uncertainty arising from counting when fitting the net γ-ray full-energy peak area. ET is the uncertainty propagated from the half-life (T1/2) [23] through λ = ln2/T1/2 and the decay correction terms in Eq. (1). Eϕ is the relative uncertainty of the neutron flux density, obtained from the 115In(n, n')115mIn monitor reaction and the associated uncertainty propagation. Em is the uncertainty in the sample mass weighing due to the precision of the electronic scale; the uncertainty of uranium isotopic abundance was negligible compared with the neutron-flux uncertainty. EI is the uncertainty of the absolute γ-ray intensity taken from NNDC decay data [23]. Eϵ is the uncertainty of the full-energy peak efficiency obtained from the 152Eu efficiency calibration curve. Eσ is the uncertainty of the 238U(n, f) fission cross section at 2.9 ± 0.3 MeV. Ea is the uncertainty associated with the γ-ray self-absorption correction.
Table 4 summarizes the above-mentioned relevant uncertainties calculated for each nuclide.
Fission Products Ec(%) ET(%) Eϕ(%) Em(%) EI(%) Eϵ(%) Eσ(%) Ea(%) Etotal(%) 91Sr 2.93 0.62 7.22 0.03 3.28 2.61 0.72 0.30 8.90 92Sr 2.32 0.65 7.22 0.03 0.67 2.61 0.72 0.30 8.11 97Zr 1.41 0.05 7.22 0.03 0.17 0.69 0.72 0.30 7.43 104Tc 3.18 1.64 7.22 0.03 0.34 0.76 0.72 0.30 8.13 105Ru 3.42 0.25 7.22 0.03 0.13 0.68 0.72 0.30 8.06 135I 3.27 0.46 7.22 0.03 3.10 2.61 0.72 0.30 8.94 143Ce 3.53 0.02 7.22 0.03 0.93 0.66 0.72 0.30 8.15 Table 4. Sources of uncertainty in the yield values.
Among all sources of uncertainty, the uncertainty in the neutron flux accounts for the largest portion of the total uncertainty. The mass of the sample plate, detection efficiency, and other factors, such as the 115In monitor plate, are taken into account. In particular, the uncertainty of the γ-ray peak count includes the Compton plateau and statistical error.
-
No measurement is absolutely precise. As such, uncertainty analysis of the 238U(n, f) yield value is equally important. The cumulative fission yield calculated using Eq. (1) depends on the measured γ-ray net peak area, decay data, neutron flux density, number of target nuclei, γ-ray emission probability, detector efficiency, and fission cross section. Therefore, the uncertainty of the cumulative yield was evaluated by propagating the relative uncertainties of these input quantities. The total relative uncertainty for each fission product was calculated using the root-sum-square method:
$ {\textit{E}}_{\text{total}}=\sqrt{\left[{({{\textit{E}}_{\textit{c}}})}^{2}+{({{\textit{E}}_{\textit{T}}})}^{2}+{({{\textit{E}}_{\phi }})}^{2}+{({{\textit{E}}_{\textit{m}}})}^{2}+{({{\textit{E}}_{\textit{I}}})}^{2}+{({{\textit{E}}_{\varepsilon }})}^{2}+{({{\textit{E}}_{\sigma }})}^{2}+{({{\textit{E}}_{\textit{a}}})}^{2}\right]}, $
(9) where Ec is the uncertainty arising from counting when fitting the net γ-ray full-energy peak area. ET is the uncertainty propagated from the half-life (T1/2) [23] through λ = ln2/T1/2 and the decay correction terms in Eq. (1). Eϕ is the relative uncertainty of the neutron flux density, obtained from the 115In(n, n')115mIn monitor reaction and the associated uncertainty propagation. Em is the uncertainty in the sample mass weighing due to the precision of the electronic scale; the uncertainty of uranium isotopic abundance was negligible compared with the neutron-flux uncertainty. EI is the uncertainty of the absolute γ-ray intensity taken from NNDC decay data [23]. Eϵ is the uncertainty of the full-energy peak efficiency obtained from the 152Eu efficiency calibration curve. Eσ is the uncertainty of the 238U(n, f) fission cross section at 2.9 ± 0.3 MeV. Ea is the uncertainty associated with the γ-ray self-absorption correction.
Table 4 summarizes the above-mentioned relevant uncertainties calculated for each nuclide.
Fission Products Ec(%) ET(%) Eϕ(%) Em(%) EI(%) Eϵ(%) Eσ(%) Ea(%) Etotal(%) 91Sr 2.93 0.62 7.22 0.03 3.28 2.61 0.72 0.30 8.90 92Sr 2.32 0.65 7.22 0.03 0.67 2.61 0.72 0.30 8.11 97Zr 1.41 0.05 7.22 0.03 0.17 0.69 0.72 0.30 7.43 104Tc 3.18 1.64 7.22 0.03 0.34 0.76 0.72 0.30 8.13 105Ru 3.42 0.25 7.22 0.03 0.13 0.68 0.72 0.30 8.06 135I 3.27 0.46 7.22 0.03 3.10 2.61 0.72 0.30 8.94 143Ce 3.53 0.02 7.22 0.03 0.93 0.66 0.72 0.30 8.15 Table 4. Sources of uncertainty in the yield values.
Among all sources of uncertainty, the uncertainty in the neutron flux accounts for the largest portion of the total uncertainty. The mass of the sample plate, detection efficiency, and other factors, such as the 115In monitor plate, are taken into account. In particular, the uncertainty of the γ-ray peak count includes the Compton plateau and statistical error.
-
No measurement is absolutely precise. As such, uncertainty analysis of the 238U(n, f) yield value is equally important. The cumulative fission yield calculated using Eq. (1) depends on the measured γ-ray net peak area, decay data, neutron flux density, number of target nuclei, γ-ray emission probability, detector efficiency, and fission cross section. Therefore, the uncertainty of the cumulative yield was evaluated by propagating the relative uncertainties of these input quantities. The total relative uncertainty for each fission product was calculated using the root-sum-square method:
$ {\textit{E}}_{\text{total}}=\sqrt{\left[{({{\textit{E}}_{\textit{c}}})}^{2}+{({{\textit{E}}_{\textit{T}}})}^{2}+{({{\textit{E}}_{\phi }})}^{2}+{({{\textit{E}}_{\textit{m}}})}^{2}+{({{\textit{E}}_{\textit{I}}})}^{2}+{({{\textit{E}}_{\varepsilon }})}^{2}+{({{\textit{E}}_{\sigma }})}^{2}+{({{\textit{E}}_{\textit{a}}})}^{2}\right]}, $
(9) where Ec is the uncertainty arising from counting when fitting the net γ-ray full-energy peak area. ET is the uncertainty propagated from the half-life (T1/2) [23] through λ = ln2/T1/2 and the decay correction terms in Eq. (1). Eϕ is the relative uncertainty of the neutron flux density, obtained from the 115In(n, n')115mIn monitor reaction and the associated uncertainty propagation. Em is the uncertainty in the sample mass weighing due to the precision of the electronic scale; the uncertainty of uranium isotopic abundance was negligible compared with the neutron-flux uncertainty. EI is the uncertainty of the absolute γ-ray intensity taken from NNDC decay data [23]. Eϵ is the uncertainty of the full-energy peak efficiency obtained from the 152Eu efficiency calibration curve. Eσ is the uncertainty of the 238U(n, f) fission cross section at 2.9 ± 0.3 MeV. Ea is the uncertainty associated with the γ-ray self-absorption correction.
Table 4 summarizes the above-mentioned relevant uncertainties calculated for each nuclide.
Fission Products Ec(%) ET(%) Eϕ(%) Em(%) EI(%) Eϵ(%) Eσ(%) Ea(%) Etotal(%) 91Sr 2.93 0.62 7.22 0.03 3.28 2.61 0.72 0.30 8.90 92Sr 2.32 0.65 7.22 0.03 0.67 2.61 0.72 0.30 8.11 97Zr 1.41 0.05 7.22 0.03 0.17 0.69 0.72 0.30 7.43 104Tc 3.18 1.64 7.22 0.03 0.34 0.76 0.72 0.30 8.13 105Ru 3.42 0.25 7.22 0.03 0.13 0.68 0.72 0.30 8.06 135I 3.27 0.46 7.22 0.03 3.10 2.61 0.72 0.30 8.94 143Ce 3.53 0.02 7.22 0.03 0.93 0.66 0.72 0.30 8.15 Table 4. Sources of uncertainty in the yield values.
Among all sources of uncertainty, the uncertainty in the neutron flux accounts for the largest portion of the total uncertainty. The mass of the sample plate, detection efficiency, and other factors, such as the 115In monitor plate, are taken into account. In particular, the uncertainty of the γ-ray peak count includes the Compton plateau and statistical error.
-
No measurement is absolutely precise. As such, uncertainty analysis of the 238U(n, f) yield value is equally important. The cumulative fission yield calculated using Eq. (1) depends on the measured γ-ray net peak area, decay data, neutron flux density, number of target nuclei, γ-ray emission probability, detector efficiency, and fission cross section. Therefore, the uncertainty of the cumulative yield was evaluated by propagating the relative uncertainties of these input quantities. The total relative uncertainty for each fission product was calculated using the root-sum-square method:
$ {\textit{E}}_{\text{total}}=\sqrt{\left[{({{\textit{E}}_{\textit{c}}})}^{2}+{({{\textit{E}}_{\textit{T}}})}^{2}+{({{\textit{E}}_{\phi }})}^{2}+{({{\textit{E}}_{\textit{m}}})}^{2}+{({{\textit{E}}_{\textit{I}}})}^{2}+{({{\textit{E}}_{\varepsilon }})}^{2}+{({{\textit{E}}_{\sigma }})}^{2}+{({{\textit{E}}_{\textit{a}}})}^{2}\right]}, $
(9) where Ec is the uncertainty arising from counting when fitting the net γ-ray full-energy peak area. ET is the uncertainty propagated from the half-life (T1/2) [23] through λ = ln2/T1/2 and the decay correction terms in Eq. (1). Eϕ is the relative uncertainty of the neutron flux density, obtained from the 115In(n, n')115mIn monitor reaction and the associated uncertainty propagation. Em is the uncertainty in the sample mass weighing due to the precision of the electronic scale; the uncertainty of uranium isotopic abundance was negligible compared with the neutron-flux uncertainty. EI is the uncertainty of the absolute γ-ray intensity taken from NNDC decay data [23]. Eϵ is the uncertainty of the full-energy peak efficiency obtained from the 152Eu efficiency calibration curve. Eσ is the uncertainty of the 238U(n, f) fission cross section at 2.9 ± 0.3 MeV. Ea is the uncertainty associated with the γ-ray self-absorption correction.
Table 4 summarizes the above-mentioned relevant uncertainties calculated for each nuclide.
Fission Products Ec(%) ET(%) Eϕ(%) Em(%) EI(%) Eϵ(%) Eσ(%) Ea(%) Etotal(%) 91Sr 2.93 0.62 7.22 0.03 3.28 2.61 0.72 0.30 8.90 92Sr 2.32 0.65 7.22 0.03 0.67 2.61 0.72 0.30 8.11 97Zr 1.41 0.05 7.22 0.03 0.17 0.69 0.72 0.30 7.43 104Tc 3.18 1.64 7.22 0.03 0.34 0.76 0.72 0.30 8.13 105Ru 3.42 0.25 7.22 0.03 0.13 0.68 0.72 0.30 8.06 135I 3.27 0.46 7.22 0.03 3.10 2.61 0.72 0.30 8.94 143Ce 3.53 0.02 7.22 0.03 0.93 0.66 0.72 0.30 8.15 Table 4. Sources of uncertainty in the yield values.
Among all sources of uncertainty, the uncertainty in the neutron flux accounts for the largest portion of the total uncertainty. The mass of the sample plate, detection efficiency, and other factors, such as the 115In monitor plate, are taken into account. In particular, the uncertainty of the γ-ray peak count includes the Compton plateau and statistical error.
-
No measurement is absolutely precise. As such, uncertainty analysis of the 238U(n, f) yield value is equally important. The cumulative fission yield calculated using Eq. (1) depends on the measured γ-ray net peak area, decay data, neutron flux density, number of target nuclei, γ-ray emission probability, detector efficiency, and fission cross section. Therefore, the uncertainty of the cumulative yield was evaluated by propagating the relative uncertainties of these input quantities. The total relative uncertainty for each fission product was calculated using the root-sum-square method:
$ {\textit{E}}_{\text{total}}=\sqrt{\left[{({{\textit{E}}_{\textit{c}}})}^{2}+{({{\textit{E}}_{\textit{T}}})}^{2}+{({{\textit{E}}_{\phi }})}^{2}+{({{\textit{E}}_{\textit{m}}})}^{2}+{({{\textit{E}}_{\textit{I}}})}^{2}+{({{\textit{E}}_{\varepsilon }})}^{2}+{({{\textit{E}}_{\sigma }})}^{2}+{({{\textit{E}}_{\textit{a}}})}^{2}\right]}, $
(9) where Ec is the uncertainty arising from counting when fitting the net γ-ray full-energy peak area. ET is the uncertainty propagated from the half-life (T1/2) [23] through λ = ln2/T1/2 and the decay correction terms in Eq. (1). Eϕ is the relative uncertainty of the neutron flux density, obtained from the 115In(n, n')115mIn monitor reaction and the associated uncertainty propagation. Em is the uncertainty in the sample mass weighing due to the precision of the electronic scale; the uncertainty of uranium isotopic abundance was negligible compared with the neutron-flux uncertainty. EI is the uncertainty of the absolute γ-ray intensity taken from NNDC decay data [23]. Eϵ is the uncertainty of the full-energy peak efficiency obtained from the 152Eu efficiency calibration curve. Eσ is the uncertainty of the 238U(n, f) fission cross section at 2.9 ± 0.3 MeV. Ea is the uncertainty associated with the γ-ray self-absorption correction.
Table 4 summarizes the above-mentioned relevant uncertainties calculated for each nuclide.
Fission Products Ec(%) ET(%) Eϕ(%) Em(%) EI(%) Eϵ(%) Eσ(%) Ea(%) Etotal(%) 91Sr 2.93 0.62 7.22 0.03 3.28 2.61 0.72 0.30 8.90 92Sr 2.32 0.65 7.22 0.03 0.67 2.61 0.72 0.30 8.11 97Zr 1.41 0.05 7.22 0.03 0.17 0.69 0.72 0.30 7.43 104Tc 3.18 1.64 7.22 0.03 0.34 0.76 0.72 0.30 8.13 105Ru 3.42 0.25 7.22 0.03 0.13 0.68 0.72 0.30 8.06 135I 3.27 0.46 7.22 0.03 3.10 2.61 0.72 0.30 8.94 143Ce 3.53 0.02 7.22 0.03 0.93 0.66 0.72 0.30 8.15 Table 4. Sources of uncertainty in the yield values.
Among all sources of uncertainty, the uncertainty in the neutron flux accounts for the largest portion of the total uncertainty. The mass of the sample plate, detection efficiency, and other factors, such as the 115In monitor plate, are taken into account. In particular, the uncertainty of the γ-ray peak count includes the Compton plateau and statistical error.
-
Based on calculations of the cumulative yield, determination of various correction factors, and analysis of uncertainty sources, the cumulative yield values of the seven fission products for 238U induced by 2.9±0.3 MeV neutrons have been ultimately determined. The cumulative FPYs, together with published experimental data that have an energy range closely aligned with this experiment and the cumulative fission yields at 2.9 MeV neutron energy obtained via interpolation from the ENDF/B-VIII.0 databases, are collectively presented in Table 5. When comparing the yield results from this work with those obtained via interpolation, the deviations range from 3.9% to 6.6%.
Fission
ProductsPresent Work
(2.9 MeV)1989 Afarideh et al.
(2.16 MeV)2013 Naik et al.
(3.72 MeV)2016 Gooden et al.
(2.37 MeV)2016 Gooden et al.
(3.60 MeV)Interpolate Values
(2.9 MeV)91Sr 3.62±0.33 3.69±0.33 3.755±0.284 4.17±0.19 4.31±0.18 4.01 92Sr 3.87±0.32 4.45±0.47 3.608±0.261 4.40±0.24 4.91±0.28 4.23 97Zr 5.55±0.44 5.54±0.58 6.086±0.255 5.62±0.17 6.00±0.16 5.51 104Tc 4.97±0.43 4.73±0.54 — — — 4.86 105Ru 3.71±0.32 3.99±0.46 3.211±0.157 4.62±0.20 4.75±0.17 3.90 135I 6.20±0.56 7.04±0.76 5.547±0.259 — — 6.69 143Ce 4.93±0.43 4.49±0.50 4.592±0.297 4.87±0.23 4.51±0.22 4.50 Table 5. Cumulative FPYs obtained from neutron-induced fission of 238U around 2.9 MeV.
As shown in Table 5, a comparison with previously archived experimental data in the EXFOR database [31] reveals differences in yield values. Using γ-ray counting, the work by Afarideh et al. in 1989 [32] measured the absolute cumulative yield of nearly 32 fission products at five different neutron energies in the range of 1.75−5.98 MeV. Among the data available in the 2−3 MeV neutron energy range, only the yield dataset measured by Afarideh et al. includes the seven fission products as those investigated in the present experiment. For the fission yield data at 2.16 MeV, our results show a difference of approximately 0.18%−13.03% compared with the data reported in Ref. [32]. The cumulative yields for the fission products 97Zr, 104Tc, and 143Ce were lower than our results, while those for 91Sr, 92Sr, 105Ru, and 135I were higher. For the fission product 135I, a key precursor that determines the yield and dynamic evolution of 135Xe, a strong neutron absorber that impacts reactor control, studying its yield is crucial for reactor neutronics calculations.
The fission yields of irradiated 238U targets, as reported in the work of Naik et al. (2013) [14], were directly measured using an off-line γ-ray spectrometric technique. A difference of approximately 3.60%−15.54% was observed between our yields and those reported by Naik et al. at 3.72 MeV. Relative to the data of Ref. [14], our yields were higher for the fission products 92Sr, 105Ru, 135I, and 143Ce. In contrast, lower yields were obtained for 91Sr and 97Zr. The 91Sr yield measured in our experiment is in close agreement with that reported by Naik et al., differing by approximately 3.6%. For the fission product 105Ru, the yield measured by Bhatia et al. in 2015 [33] using a dual-fission chamber at 8.9 MeV neutron energy is significantly lower than the trend exhibited by previous data, which showed a distinct negative slope. In 2025, the collaboration of Tonchev et al. [15] supplemented the existing data with a measurement of the cumulative yield for 105Ru at a neutron energy of 14.8 MeV. Across the 11 energy points from 0.5 to 14.8 MeV, the yield initially decreases, then increases. Data from a limited number of energy points are insufficient to establish the energy dependence of the yield. The 105Ru yield data obtained in the present experiment can be utilized to verify the proposed trend.
Among the measurements mentioned above, those studied by Gooden et al. [4] are the closest to those applied in the current research. On comparing the cumulative fission yield data, it can be seen that the underlying trends in the two sets are generally consistent. Very small deviations have been found for selected isotopes that variations in the neutron energy distribution, experimental arrangement, and data correction can explain. Compared with the yields reported by Gooden et al., our results show differences of approximately 1.23%−19.70% at 2.37 MeV and 7.50%−21.89% at 3.60 MeV. For the light-mass region, our results for 91Sr, 92Sr, 97Zr, and 105Ru are lower than those reported by Gooden et al. However, for the fission product 143Ce in the heavy mass region, our cumulative fission yields in the presented study are higher than in the work of Gooden et al. It is found that although there is some difference between 91Sr and 105Ru, the results of this work exhibit good agreement with the data from Ref. [4].
In the current experiment, we measured the cumulative fission yield values of the 238U(n, f) reaction using the activation method. For the sake of comparison, the experimental results from this work, published fission yield data in the 2−3 MeV neutron energy range, the mass chain yield curves from ENDF/B-VIII.0 database at neutron energies of 0.5 MeV and 14 MeV, and the mass chain yield evaluation curve 2.9 MeV neutron energy obtained through interpolation of the mass chain yields at 0.5 and 14 MeV are shown in Fig. 7(a).
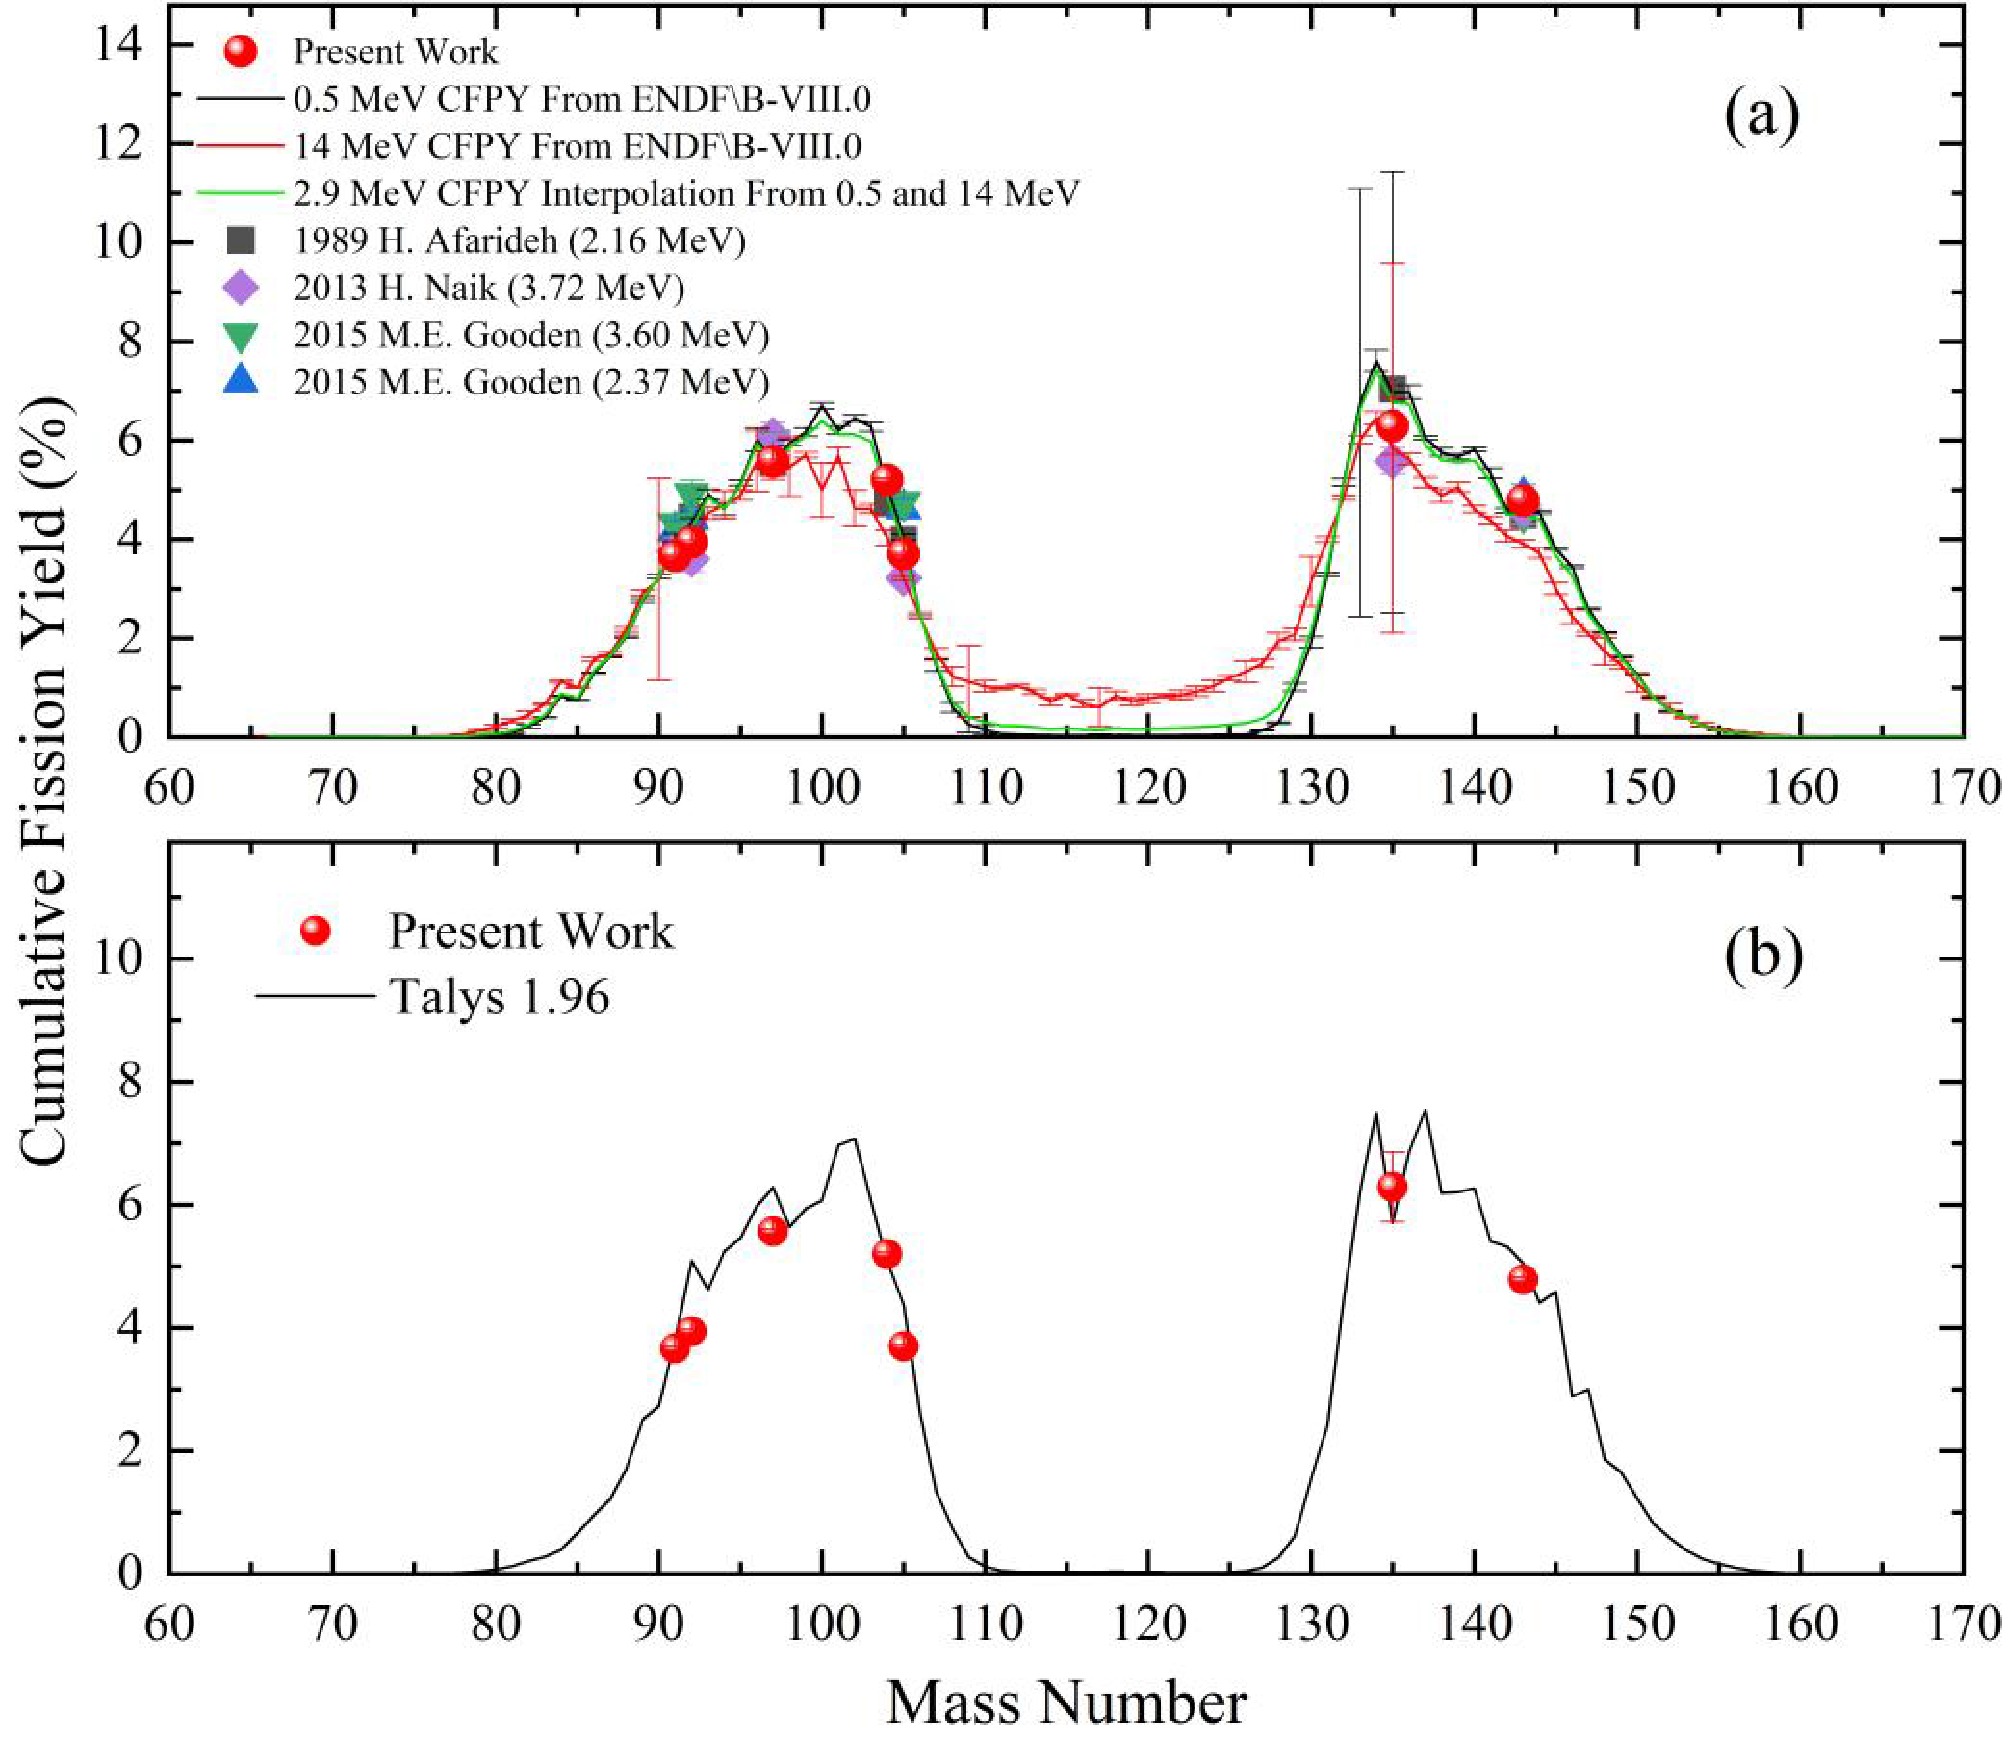
Figure 7. (color online) Comparison of the measured FPYs from this work: (a) with values from published literature and evaluation database, and (b) with theoretical calculation results.
In nuclear physics research, the TALYS code serves as a widely adopted, general-purpose tool for modeling nuclear reactions. We calculated the theoretical fission yield of the 238U(n, f) reaction using TALYS-1.96 [34]. In the calculation, all parameters except the model for the distribution of fission fragments were set to their default values. The theoretical fission yield corresponding to the Okumura model [35] and the experimental results are presented in Fig. 7(b). As shown, the experimentally determined yields agree with the calculated yields. The appearance of sharp peaks in the fission yield curve in Fig. 7(b) is essentially a macroscopic statistical projection of microscopic nuclear structure. Shell effects determine the approximate positions of the peaks (magic number regions). Neutron evaporation governs the distribution of yields among specific mass chains. Odd-even effects dictate the fine-scale fluctuations in yields between neighboring mass numbers.
Overall, our measured yields are consistent with both available experimental data and theoretical calculations, indicating that the yields are reliable. The CENDL-3.2 database lacks evaluated fission-yield data for 238U at neutron energies of 2−3 MeV, and experimental data in this energy region are also scarce. Consequently, this study can lay the foundation for establishing the fission yield database within CENDL-3.2.
-
Based on calculations of the cumulative yield, determination of various correction factors, and analysis of uncertainty sources, the cumulative yield values of the seven fission products for 238U induced by 2.9±0.3 MeV neutrons have been ultimately determined. The cumulative FPYs, together with published experimental data that have an energy range closely aligned with this experiment and the cumulative fission yields at 2.9 MeV neutron energy obtained via interpolation from the ENDF/B-VIII.0 databases, are collectively presented in Table 5. When comparing the yield results from this work with those obtained via interpolation, the deviations range from 3.9% to 6.6%.
Fission
ProductsPresent Work
(2.9 MeV)1989 Afarideh et al.
(2.16 MeV)2013 Naik et al.
(3.72 MeV)2016 Gooden et al.
(2.37 MeV)2016 Gooden et al.
(3.60 MeV)Interpolate Values
(2.9 MeV)91Sr 3.62±0.33 3.69±0.33 3.755±0.284 4.17±0.19 4.31±0.18 4.01 92Sr 3.87±0.32 4.45±0.47 3.608±0.261 4.40±0.24 4.91±0.28 4.23 97Zr 5.55±0.44 5.54±0.58 6.086±0.255 5.62±0.17 6.00±0.16 5.51 104Tc 4.97±0.43 4.73±0.54 — — — 4.86 105Ru 3.71±0.32 3.99±0.46 3.211±0.157 4.62±0.20 4.75±0.17 3.90 135I 6.20±0.56 7.04±0.76 5.547±0.259 — — 6.69 143Ce 4.93±0.43 4.49±0.50 4.592±0.297 4.87±0.23 4.51±0.22 4.50 Table 5. Cumulative FPYs obtained from neutron-induced fission of 238U around 2.9 MeV.
As shown in Table 5, a comparison with previously archived experimental data in the EXFOR database [31] reveals differences in yield values. Using γ-ray counting, the work by Afarideh et al. in 1989 [32] measured the absolute cumulative yield of nearly 32 fission products at five different neutron energies in the range of 1.75−5.98 MeV. Among the data available in the 2−3 MeV neutron energy range, only the yield dataset measured by Afarideh et al. includes the seven fission products as those investigated in the present experiment. For the fission yield data at 2.16 MeV, our results show a difference of approximately 0.18%−13.03% compared with the data reported in Ref. [32]. The cumulative yields for the fission products 97Zr, 104Tc, and 143Ce were lower than our results, while those for 91Sr, 92Sr, 105Ru, and 135I were higher. For the fission product 135I, a key precursor that determines the yield and dynamic evolution of 135Xe, a strong neutron absorber that impacts reactor control, studying its yield is crucial for reactor neutronics calculations.
The fission yields of irradiated 238U targets, as reported in the work of Naik et al. (2013) [14], were directly measured using an off-line γ-ray spectrometric technique. A difference of approximately 3.60%−15.54% was observed between our yields and those reported by Naik et al. at 3.72 MeV. Relative to the data of Ref. [14], our yields were higher for the fission products 92Sr, 105Ru, 135I, and 143Ce. In contrast, lower yields were obtained for 91Sr and 97Zr. The 91Sr yield measured in our experiment is in close agreement with that reported by Naik et al., differing by approximately 3.6%. For the fission product 105Ru, the yield measured by Bhatia et al. in 2015 [33] using a dual-fission chamber at 8.9 MeV neutron energy is significantly lower than the trend exhibited by previous data, which showed a distinct negative slope. In 2025, the collaboration of Tonchev et al. [15] supplemented the existing data with a measurement of the cumulative yield for 105Ru at a neutron energy of 14.8 MeV. Across the 11 energy points from 0.5 to 14.8 MeV, the yield initially decreases, then increases. Data from a limited number of energy points are insufficient to establish the energy dependence of the yield. The 105Ru yield data obtained in the present experiment can be utilized to verify the proposed trend.
Among the measurements mentioned above, those studied by Gooden et al. [4] are the closest to those applied in the current research. On comparing the cumulative fission yield data, it can be seen that the underlying trends in the two sets are generally consistent. Very small deviations have been found for selected isotopes that variations in the neutron energy distribution, experimental arrangement, and data correction can explain. Compared with the yields reported by Gooden et al., our results show differences of approximately 1.23%−19.70% at 2.37 MeV and 7.50%−21.89% at 3.60 MeV. For the light-mass region, our results for 91Sr, 92Sr, 97Zr, and 105Ru are lower than those reported by Gooden et al. However, for the fission product 143Ce in the heavy mass region, our cumulative fission yields in the presented study are higher than in the work of Gooden et al. It is found that although there is some difference between 91Sr and 105Ru, the results of this work exhibit good agreement with the data from Ref. [4].
In the current experiment, we measured the cumulative fission yield values of the 238U(n, f) reaction using the activation method. For the sake of comparison, the experimental results from this work, published fission yield data in the 2−3 MeV neutron energy range, the mass chain yield curves from ENDF/B-VIII.0 database at neutron energies of 0.5 MeV and 14 MeV, and the mass chain yield evaluation curve 2.9 MeV neutron energy obtained through interpolation of the mass chain yields at 0.5 and 14 MeV are shown in Fig. 7(a).
Figure 7. (color online) Comparison of the measured FPYs from this work: (a) with values from published literature and evaluation database, and (b) with theoretical calculation results.
In nuclear physics research, the TALYS code serves as a widely adopted, general-purpose tool for modeling nuclear reactions. We calculated the theoretical fission yield of the 238U(n, f) reaction using TALYS-1.96 [34]. In the calculation, all parameters except the model for the distribution of fission fragments were set to their default values. The theoretical fission yield corresponding to the Okumura model [35] and the experimental results are presented in Fig. 7(b). As shown, the experimentally determined yields agree with the calculated yields. The appearance of sharp peaks in the fission yield curve in Fig. 7(b) is essentially a macroscopic statistical projection of microscopic nuclear structure. Shell effects determine the approximate positions of the peaks (magic number regions). Neutron evaporation governs the distribution of yields among specific mass chains. Odd-even effects dictate the fine-scale fluctuations in yields between neighboring mass numbers.
Overall, our measured yields are consistent with both available experimental data and theoretical calculations, indicating that the yields are reliable. The CENDL-3.2 database lacks evaluated fission-yield data for 238U at neutron energies of 2−3 MeV, and experimental data in this energy region are also scarce. Consequently, this study can lay the foundation for establishing the fission yield database within CENDL-3.2.
-
Based on calculations of the cumulative yield, determination of various correction factors, and analysis of uncertainty sources, the cumulative yield values of the seven fission products for 238U induced by 2.9±0.3 MeV neutrons have been ultimately determined. The cumulative FPYs, together with published experimental data that have an energy range closely aligned with this experiment and the cumulative fission yields at 2.9 MeV neutron energy obtained via interpolation from the ENDF/B-VIII.0 databases, are collectively presented in Table 5. When comparing the yield results from this work with those obtained via interpolation, the deviations range from 3.9% to 6.6%.
Fission
ProductsPresent Work
(2.9 MeV)1989 Afarideh et al.
(2.16 MeV)2013 Naik et al.
(3.72 MeV)2016 Gooden et al.
(2.37 MeV)2016 Gooden et al.
(3.60 MeV)Interpolate Values
(2.9 MeV)91Sr 3.62±0.33 3.69±0.33 3.755±0.284 4.17±0.19 4.31±0.18 4.01 92Sr 3.87±0.32 4.45±0.47 3.608±0.261 4.40±0.24 4.91±0.28 4.23 97Zr 5.55±0.44 5.54±0.58 6.086±0.255 5.62±0.17 6.00±0.16 5.51 104Tc 4.97±0.43 4.73±0.54 — — — 4.86 105Ru 3.71±0.32 3.99±0.46 3.211±0.157 4.62±0.20 4.75±0.17 3.90 135I 6.20±0.56 7.04±0.76 5.547±0.259 — — 6.69 143Ce 4.93±0.43 4.49±0.50 4.592±0.297 4.87±0.23 4.51±0.22 4.50 Table 5. Cumulative FPYs obtained from neutron-induced fission of 238U around 2.9 MeV.
As shown in Table 5, a comparison with previously archived experimental data in the EXFOR database [31] reveals differences in yield values. Using γ-ray counting, the work by Afarideh et al. in 1989 [32] measured the absolute cumulative yield of nearly 32 fission products at five different neutron energies in the range of 1.75−5.98 MeV. Among the data available in the 2−3 MeV neutron energy range, only the yield dataset measured by Afarideh et al. includes the seven fission products as those investigated in the present experiment. For the fission yield data at 2.16 MeV, our results show a difference of approximately 0.18%−13.03% compared with the data reported in Ref. [32]. The cumulative yields for the fission products 97Zr, 104Tc, and 143Ce were lower than our results, while those for 91Sr, 92Sr, 105Ru, and 135I were higher. For the fission product 135I, a key precursor that determines the yield and dynamic evolution of 135Xe, a strong neutron absorber that impacts reactor control, studying its yield is crucial for reactor neutronics calculations.
The fission yields of irradiated 238U targets, as reported in the work of Naik et al. (2013) [14], were directly measured using an off-line γ-ray spectrometric technique. A difference of approximately 3.60%−15.54% was observed between our yields and those reported by Naik et al. at 3.72 MeV. Relative to the data of Ref. [14], our yields were higher for the fission products 92Sr, 105Ru, 135I, and 143Ce. In contrast, lower yields were obtained for 91Sr and 97Zr. The 91Sr yield measured in our experiment is in close agreement with that reported by Naik et al., differing by approximately 3.6%. For the fission product 105Ru, the yield measured by Bhatia et al. in 2015 [33] using a dual-fission chamber at 8.9 MeV neutron energy is significantly lower than the trend exhibited by previous data, which showed a distinct negative slope. In 2025, the collaboration of Tonchev et al. [15] supplemented the existing data with a measurement of the cumulative yield for 105Ru at a neutron energy of 14.8 MeV. Across the 11 energy points from 0.5 to 14.8 MeV, the yield initially decreases, then increases. Data from a limited number of energy points are insufficient to establish the energy dependence of the yield. The 105Ru yield data obtained in the present experiment can be utilized to verify the proposed trend.
Among the measurements mentioned above, those studied by Gooden et al. [4] are the closest to those applied in the current research. On comparing the cumulative fission yield data, it can be seen that the underlying trends in the two sets are generally consistent. Very small deviations have been found for selected isotopes that variations in the neutron energy distribution, experimental arrangement, and data correction can explain. Compared with the yields reported by Gooden et al., our results show differences of approximately 1.23%−19.70% at 2.37 MeV and 7.50%−21.89% at 3.60 MeV. For the light-mass region, our results for 91Sr, 92Sr, 97Zr, and 105Ru are lower than those reported by Gooden et al. However, for the fission product 143Ce in the heavy mass region, our cumulative fission yields in the presented study are higher than in the work of Gooden et al. It is found that although there is some difference between 91Sr and 105Ru, the results of this work exhibit good agreement with the data from Ref. [4].
In the current experiment, we measured the cumulative fission yield values of the 238U(n, f) reaction using the activation method. For the sake of comparison, the experimental results from this work, published fission yield data in the 2−3 MeV neutron energy range, the mass chain yield curves from ENDF/B-VIII.0 database at neutron energies of 0.5 MeV and 14 MeV, and the mass chain yield evaluation curve 2.9 MeV neutron energy obtained through interpolation of the mass chain yields at 0.5 and 14 MeV are shown in Fig. 7(a).
Figure 7. (color online) Comparison of the measured FPYs from this work: (a) with values from published literature and evaluation database, and (b) with theoretical calculation results.
In nuclear physics research, the TALYS code serves as a widely adopted, general-purpose tool for modeling nuclear reactions. We calculated the theoretical fission yield of the 238U(n, f) reaction using TALYS-1.96 [34]. In the calculation, all parameters except the model for the distribution of fission fragments were set to their default values. The theoretical fission yield corresponding to the Okumura model [35] and the experimental results are presented in Fig. 7(b). As shown, the experimentally determined yields agree with the calculated yields. The appearance of sharp peaks in the fission yield curve in Fig. 7(b) is essentially a macroscopic statistical projection of microscopic nuclear structure. Shell effects determine the approximate positions of the peaks (magic number regions). Neutron evaporation governs the distribution of yields among specific mass chains. Odd-even effects dictate the fine-scale fluctuations in yields between neighboring mass numbers.
Overall, our measured yields are consistent with both available experimental data and theoretical calculations, indicating that the yields are reliable. The CENDL-3.2 database lacks evaluated fission-yield data for 238U at neutron energies of 2−3 MeV, and experimental data in this energy region are also scarce. Consequently, this study can lay the foundation for establishing the fission yield database within CENDL-3.2.
-
Based on calculations of the cumulative yield, determination of various correction factors, and analysis of uncertainty sources, the cumulative yield values of the seven fission products for 238U induced by 2.9±0.3 MeV neutrons have been ultimately determined. The cumulative FPYs, together with published experimental data that have an energy range closely aligned with this experiment and the cumulative fission yields at 2.9 MeV neutron energy obtained via interpolation from the ENDF/B-VIII.0 databases, are collectively presented in Table 5. When comparing the yield results from this work with those obtained via interpolation, the deviations range from 3.9% to 6.6%.
Fission
ProductsPresent Work
(2.9 MeV)1989 Afarideh et al.
(2.16 MeV)2013 Naik et al.
(3.72 MeV)2016 Gooden et al.
(2.37 MeV)2016 Gooden et al.
(3.60 MeV)Interpolate Values
(2.9 MeV)91Sr 3.62±0.33 3.69±0.33 3.755±0.284 4.17±0.19 4.31±0.18 4.01 92Sr 3.87±0.32 4.45±0.47 3.608±0.261 4.40±0.24 4.91±0.28 4.23 97Zr 5.55±0.44 5.54±0.58 6.086±0.255 5.62±0.17 6.00±0.16 5.51 104Tc 4.97±0.43 4.73±0.54 — — — 4.86 105Ru 3.71±0.32 3.99±0.46 3.211±0.157 4.62±0.20 4.75±0.17 3.90 135I 6.20±0.56 7.04±0.76 5.547±0.259 — — 6.69 143Ce 4.93±0.43 4.49±0.50 4.592±0.297 4.87±0.23 4.51±0.22 4.50 Table 5. Cumulative FPYs obtained from neutron-induced fission of 238U around 2.9 MeV.
As shown in Table 5, a comparison with previously archived experimental data in the EXFOR database [31] reveals differences in yield values. Using γ-ray counting, the work by Afarideh et al. in 1989 [32] measured the absolute cumulative yield of nearly 32 fission products at five different neutron energies in the range of 1.75−5.98 MeV. Among the data available in the 2−3 MeV neutron energy range, only the yield dataset measured by Afarideh et al. includes the seven fission products as those investigated in the present experiment. For the fission yield data at 2.16 MeV, our results show a difference of approximately 0.18%−13.03% compared with the data reported in Ref. [32]. The cumulative yields for the fission products 97Zr, 104Tc, and 143Ce were lower than our results, while those for 91Sr, 92Sr, 105Ru, and 135I were higher. For the fission product 135I, a key precursor that determines the yield and dynamic evolution of 135Xe, a strong neutron absorber that impacts reactor control, studying its yield is crucial for reactor neutronics calculations.
The fission yields of irradiated 238U targets, as reported in the work of Naik et al. (2013) [14], were directly measured using an off-line γ-ray spectrometric technique. A difference of approximately 3.60%−15.54% was observed between our yields and those reported by Naik et al. at 3.72 MeV. Relative to the data of Ref. [14], our yields were higher for the fission products 92Sr, 105Ru, 135I, and 143Ce. In contrast, lower yields were obtained for 91Sr and 97Zr. The 91Sr yield measured in our experiment is in close agreement with that reported by Naik et al., differing by approximately 3.6%. For the fission product 105Ru, the yield measured by Bhatia et al. in 2015 [33] using a dual-fission chamber at 8.9 MeV neutron energy is significantly lower than the trend exhibited by previous data, which showed a distinct negative slope. In 2025, the collaboration of Tonchev et al. [15] supplemented the existing data with a measurement of the cumulative yield for 105Ru at a neutron energy of 14.8 MeV. Across the 11 energy points from 0.5 to 14.8 MeV, the yield initially decreases, then increases. Data from a limited number of energy points are insufficient to establish the energy dependence of the yield. The 105Ru yield data obtained in the present experiment can be utilized to verify the proposed trend.
Among the measurements mentioned above, those studied by Gooden et al. [4] are the closest to those applied in the current research. On comparing the cumulative fission yield data, it can be seen that the underlying trends in the two sets are generally consistent. Very small deviations have been found for selected isotopes that variations in the neutron energy distribution, experimental arrangement, and data correction can explain. Compared with the yields reported by Gooden et al., our results show differences of approximately 1.23%−19.70% at 2.37 MeV and 7.50%−21.89% at 3.60 MeV. For the light-mass region, our results for 91Sr, 92Sr, 97Zr, and 105Ru are lower than those reported by Gooden et al. However, for the fission product 143Ce in the heavy mass region, our cumulative fission yields in the presented study are higher than in the work of Gooden et al. It is found that although there is some difference between 91Sr and 105Ru, the results of this work exhibit good agreement with the data from Ref. [4].
In the current experiment, we measured the cumulative fission yield values of the 238U(n, f) reaction using the activation method. For the sake of comparison, the experimental results from this work, published fission yield data in the 2−3 MeV neutron energy range, the mass chain yield curves from ENDF/B-VIII.0 database at neutron energies of 0.5 MeV and 14 MeV, and the mass chain yield evaluation curve 2.9 MeV neutron energy obtained through interpolation of the mass chain yields at 0.5 and 14 MeV are shown in Fig. 7(a).
Figure 7. (color online) Comparison of the measured FPYs from this work: (a) with values from published literature and evaluation database, and (b) with theoretical calculation results.
In nuclear physics research, the TALYS code serves as a widely adopted, general-purpose tool for modeling nuclear reactions. We calculated the theoretical fission yield of the 238U(n, f) reaction using TALYS-1.96 [34]. In the calculation, all parameters except the model for the distribution of fission fragments were set to their default values. The theoretical fission yield corresponding to the Okumura model [35] and the experimental results are presented in Fig. 7(b). As shown, the experimentally determined yields agree with the calculated yields. The appearance of sharp peaks in the fission yield curve in Fig. 7(b) is essentially a macroscopic statistical projection of microscopic nuclear structure. Shell effects determine the approximate positions of the peaks (magic number regions). Neutron evaporation governs the distribution of yields among specific mass chains. Odd-even effects dictate the fine-scale fluctuations in yields between neighboring mass numbers.
Overall, our measured yields are consistent with both available experimental data and theoretical calculations, indicating that the yields are reliable. The CENDL-3.2 database lacks evaluated fission-yield data for 238U at neutron energies of 2−3 MeV, and experimental data in this energy region are also scarce. Consequently, this study can lay the foundation for establishing the fission yield database within CENDL-3.2.
-
Based on calculations of the cumulative yield, determination of various correction factors, and analysis of uncertainty sources, the cumulative yield values of the seven fission products for 238U induced by 2.9±0.3 MeV neutrons have been ultimately determined. The cumulative FPYs, together with published experimental data that have an energy range closely aligned with this experiment and the cumulative fission yields at 2.9 MeV neutron energy obtained via interpolation from the ENDF/B-VIII.0 databases, are collectively presented in Table 5. When comparing the yield results from this work with those obtained via interpolation, the deviations range from 3.9% to 6.6%.
Fission
ProductsPresent Work
(2.9 MeV)1989 Afarideh et al.
(2.16 MeV)2013 Naik et al.
(3.72 MeV)2016 Gooden et al.
(2.37 MeV)2016 Gooden et al.
(3.60 MeV)Interpolate Values
(2.9 MeV)91Sr 3.62±0.33 3.69±0.33 3.755±0.284 4.17±0.19 4.31±0.18 4.01 92Sr 3.87±0.32 4.45±0.47 3.608±0.261 4.40±0.24 4.91±0.28 4.23 97Zr 5.55±0.44 5.54±0.58 6.086±0.255 5.62±0.17 6.00±0.16 5.51 104Tc 4.97±0.43 4.73±0.54 — — — 4.86 105Ru 3.71±0.32 3.99±0.46 3.211±0.157 4.62±0.20 4.75±0.17 3.90 135I 6.20±0.56 7.04±0.76 5.547±0.259 — — 6.69 143Ce 4.93±0.43 4.49±0.50 4.592±0.297 4.87±0.23 4.51±0.22 4.50 Table 5. Cumulative FPYs obtained from neutron-induced fission of 238U around 2.9 MeV.
As shown in Table 5, a comparison with previously archived experimental data in the EXFOR database [31] reveals differences in yield values. Using γ-ray counting, the work by Afarideh et al. in 1989 [32] measured the absolute cumulative yield of nearly 32 fission products at five different neutron energies in the range of 1.75−5.98 MeV. Among the data available in the 2−3 MeV neutron energy range, only the yield dataset measured by Afarideh et al. includes the seven fission products as those investigated in the present experiment. For the fission yield data at 2.16 MeV, our results show a difference of approximately 0.18%−13.03% compared with the data reported in Ref. [32]. The cumulative yields for the fission products 97Zr, 104Tc, and 143Ce were lower than our results, while those for 91Sr, 92Sr, 105Ru, and 135I were higher. For the fission product 135I, a key precursor that determines the yield and dynamic evolution of 135Xe, a strong neutron absorber that impacts reactor control, studying its yield is crucial for reactor neutronics calculations.
The fission yields of irradiated 238U targets, as reported in the work of Naik et al. (2013) [14], were directly measured using an off-line γ-ray spectrometric technique. A difference of approximately 3.60%−15.54% was observed between our yields and those reported by Naik et al. at 3.72 MeV. Relative to the data of Ref. [14], our yields were higher for the fission products 92Sr, 105Ru, 135I, and 143Ce. In contrast, lower yields were obtained for 91Sr and 97Zr. The 91Sr yield measured in our experiment is in close agreement with that reported by Naik et al., differing by approximately 3.6%. For the fission product 105Ru, the yield measured by Bhatia et al. in 2015 [33] using a dual-fission chamber at 8.9 MeV neutron energy is significantly lower than the trend exhibited by previous data, which showed a distinct negative slope. In 2025, the collaboration of Tonchev et al. [15] supplemented the existing data with a measurement of the cumulative yield for 105Ru at a neutron energy of 14.8 MeV. Across the 11 energy points from 0.5 to 14.8 MeV, the yield initially decreases, then increases. Data from a limited number of energy points are insufficient to establish the energy dependence of the yield. The 105Ru yield data obtained in the present experiment can be utilized to verify the proposed trend.
Among the measurements mentioned above, those studied by Gooden et al. [4] are the closest to those applied in the current research. On comparing the cumulative fission yield data, it can be seen that the underlying trends in the two sets are generally consistent. Very small deviations have been found for selected isotopes that variations in the neutron energy distribution, experimental arrangement, and data correction can explain. Compared with the yields reported by Gooden et al., our results show differences of approximately 1.23%−19.70% at 2.37 MeV and 7.50%−21.89% at 3.60 MeV. For the light-mass region, our results for 91Sr, 92Sr, 97Zr, and 105Ru are lower than those reported by Gooden et al. However, for the fission product 143Ce in the heavy mass region, our cumulative fission yields in the presented study are higher than in the work of Gooden et al. It is found that although there is some difference between 91Sr and 105Ru, the results of this work exhibit good agreement with the data from Ref. [4].
In the current experiment, we measured the cumulative fission yield values of the 238U(n, f) reaction using the activation method. For the sake of comparison, the experimental results from this work, published fission yield data in the 2−3 MeV neutron energy range, the mass chain yield curves from ENDF/B-VIII.0 database at neutron energies of 0.5 MeV and 14 MeV, and the mass chain yield evaluation curve 2.9 MeV neutron energy obtained through interpolation of the mass chain yields at 0.5 and 14 MeV are shown in Fig. 7(a).
Figure 7. (color online) Comparison of the measured FPYs from this work: (a) with values from published literature and evaluation database, and (b) with theoretical calculation results.
In nuclear physics research, the TALYS code serves as a widely adopted, general-purpose tool for modeling nuclear reactions. We calculated the theoretical fission yield of the 238U(n, f) reaction using TALYS-1.96 [34]. In the calculation, all parameters except the model for the distribution of fission fragments were set to their default values. The theoretical fission yield corresponding to the Okumura model [35] and the experimental results are presented in Fig. 7(b). As shown, the experimentally determined yields agree with the calculated yields. The appearance of sharp peaks in the fission yield curve in Fig. 7(b) is essentially a macroscopic statistical projection of microscopic nuclear structure. Shell effects determine the approximate positions of the peaks (magic number regions). Neutron evaporation governs the distribution of yields among specific mass chains. Odd-even effects dictate the fine-scale fluctuations in yields between neighboring mass numbers.
Overall, our measured yields are consistent with both available experimental data and theoretical calculations, indicating that the yields are reliable. The CENDL-3.2 database lacks evaluated fission-yield data for 238U at neutron energies of 2−3 MeV, and experimental data in this energy region are also scarce. Consequently, this study can lay the foundation for establishing the fission yield database within CENDL-3.2.
-
This paper reports experimental determinations of the cumulative fission of 7 fission products in the 238U(n, f) reaction at a neutron energy of 2.9 ± 0.3 MeV using the activation technique with offline γ-ray spectrometry. The values were measured with a high-resolution HPGe detector system and carefully corrected, and all sources of uncertainty and corrections were accounted for to ensure reliable results. The experimental results for the measured cumulative fission yields were assessed against published experimental findings, nuclear data libraries, and previously published theoretical evaluations, and compared with assessed nuclear data libraries and theoretical results obtained using the TALYS-1.96 code. Overall, the current findings indicate a reasonable correspondence with current data trends and provide new experimental data in the neutron energy range of 2−3 MeV, where data remain scarce. The reported data help minimize uncertainties in cumulative fission yield for 238U and serve as a useful resource for validating nuclear reaction data models and enhancing nuclear data measurements. The findings can be used in the fields of reactor physics, burnup analysis, and nuclear data library development.
-
This paper reports experimental determinations of the cumulative fission of 7 fission products in the 238U(n, f) reaction at a neutron energy of 2.9 ± 0.3 MeV using the activation technique with offline γ-ray spectrometry. The values were measured with a high-resolution HPGe detector system and carefully corrected, and all sources of uncertainty and corrections were accounted for to ensure reliable results. The experimental results for the measured cumulative fission yields were assessed against published experimental findings, nuclear data libraries, and previously published theoretical evaluations, and compared with assessed nuclear data libraries and theoretical results obtained using the TALYS-1.96 code. Overall, the current findings indicate a reasonable correspondence with current data trends and provide new experimental data in the neutron energy range of 2−3 MeV, where data remain scarce. The reported data help minimize uncertainties in cumulative fission yield for 238U and serve as a useful resource for validating nuclear reaction data models and enhancing nuclear data measurements. The findings can be used in the fields of reactor physics, burnup analysis, and nuclear data library development.
-
This paper reports experimental determinations of the cumulative fission of 7 fission products in the 238U(n, f) reaction at a neutron energy of 2.9 ± 0.3 MeV using the activation technique with offline γ-ray spectrometry. The values were measured with a high-resolution HPGe detector system and carefully corrected, and all sources of uncertainty and corrections were accounted for to ensure reliable results. The experimental results for the measured cumulative fission yields were assessed against published experimental findings, nuclear data libraries, and previously published theoretical evaluations, and compared with assessed nuclear data libraries and theoretical results obtained using the TALYS-1.96 code. Overall, the current findings indicate a reasonable correspondence with current data trends and provide new experimental data in the neutron energy range of 2−3 MeV, where data remain scarce. The reported data help minimize uncertainties in cumulative fission yield for 238U and serve as a useful resource for validating nuclear reaction data models and enhancing nuclear data measurements. The findings can be used in the fields of reactor physics, burnup analysis, and nuclear data library development.
-
This paper reports experimental determinations of the cumulative fission of 7 fission products in the 238U(n, f) reaction at a neutron energy of 2.9 ± 0.3 MeV using the activation technique with offline γ-ray spectrometry. The values were measured with a high-resolution HPGe detector system and carefully corrected, and all sources of uncertainty and corrections were accounted for to ensure reliable results. The experimental results for the measured cumulative fission yields were assessed against published experimental findings, nuclear data libraries, and previously published theoretical evaluations, and compared with assessed nuclear data libraries and theoretical results obtained using the TALYS-1.96 code. Overall, the current findings indicate a reasonable correspondence with current data trends and provide new experimental data in the neutron energy range of 2−3 MeV, where data remain scarce. The reported data help minimize uncertainties in cumulative fission yield for 238U and serve as a useful resource for validating nuclear reaction data models and enhancing nuclear data measurements. The findings can be used in the fields of reactor physics, burnup analysis, and nuclear data library development.
-
This paper reports experimental determinations of the cumulative fission of 7 fission products in the 238U(n, f) reaction at a neutron energy of 2.9 ± 0.3 MeV using the activation technique with offline γ-ray spectrometry. The values were measured with a high-resolution HPGe detector system and carefully corrected, and all sources of uncertainty and corrections were accounted for to ensure reliable results. The experimental results for the measured cumulative fission yields were assessed against published experimental findings, nuclear data libraries, and previously published theoretical evaluations, and compared with assessed nuclear data libraries and theoretical results obtained using the TALYS-1.96 code. Overall, the current findings indicate a reasonable correspondence with current data trends and provide new experimental data in the neutron energy range of 2−3 MeV, where data remain scarce. The reported data help minimize uncertainties in cumulative fission yield for 238U and serve as a useful resource for validating nuclear reaction data models and enhancing nuclear data measurements. The findings can be used in the fields of reactor physics, burnup analysis, and nuclear data library development.
Cumulative fission yield measurements on 238U induced by 2.9 MeV neutrons
- Received Date: 2026-01-30
- Available Online: 2026-10-15
Abstract: Neutron-induced fission data are widely used in reactor burnup, neutron fuel verification, and the identification of nuclear fuels. Due to the abundance of 238U, the most common isotope of uranium, cumulative data on 238U fission yield in the D-D neutron energy range are significant for fission research in Generation-IV (Gen-IV) reactors. In this article, measurements of the fission yield of the 238U(n, f) reaction at a neutron energy of 2.9 ± 0.3 MeV have been performed using the activation technique based on off-line γ-ray spectrometry. The neutron irradiation experiment was conducted using the CPNG-600 neutron generator at the China Institute of Atomic Energy (CIAE). A quasi-monoenergetic beam of neutrons was produced using the D(d, n)3He reaction. The γ-rays from the activation products were measured using a low-background HPGe spectrometer, and fluctuations in neutron flux were measured using an Au-Si surface barrier detector. After applying the required correction factor, highly accurate cumulative yields for seven fission products were derived. The obtained measurements were compared with the existing experimental values and yield estimates provided by the ENDF/B-VIII.0 library. Fission yields of the 238U(n, f) reaction were also determined with the help of the TALYS-1.96 code. The present outcomes provide reliable information to confirm the behavior of the energy-dependent fission yield and to supplement the nuclear reaction database for use in reactor design and operation.



 DownLoad: