


 Abstract
 HTML
HTML Reference
 Related
 PDF
PDF


-
The design, construction, operation and maintenance of new-generation advanced nuclear energy facilities require extensively evaluated intermediate- and high-energy nuclear data, whose accuracy and reliability directly determine the progress of nuclear engineering projects. In Accelerator-Driven Subcritical Systems (ADS), high-energy proton beams bombard spallation targets to produce neutrons. Accurate nuclear reaction data above 20 MeV are essential for the design of coupled target-reactor systems, to improve the transmutation efficiency of nuclear waste and optimize reactor shielding design. At present, international nuclear data evaluation projects such as the JENDL-5 [1] and CENDL-3.2 [2] libraries are well-established in the intermediate and low-energy regions, whereas evaluated data in the high-energy range above 200 MeV remain scarce. Such scarcity of high-energy evaluated nuclear data creates an urgent demand for efficient and robust predictive approaches to complement traditional evaluation methods.
Nowadays, machine learning methods are widely adopted in nuclear physics research, providing novel solutions for nuclear data evaluation and theoretical model optimization. Explainable machine learning algorithms such as Kolmogorov-Arnold networks are applied to revise the WS4 theoretical mass model and improve its physical rationality [3]. Physics-Informed Neural Networks (PINN) combined with multi-task learning are employed to predict nuclear level density, which effectively improves the prediction accuracy while guaranteeing physical consistency [4]. Bayesian mixture density networks are utilized to evaluate neutron-induced fission charge yields and achieve robust probabilistic prediction with sparse experimental data [5]. Additionally, Graph Neural Networks (GNNs) are adopted to explore the variation characteristics of nuclear cross-sections across the entire nuclide chart, thus reliably predicting cross-sections for unmeasured nuclides and unexplored energy regions [6]. Although data-driven machine learning approaches exhibit promising performance in nuclear data tasks, physically grounded reaction models remain indispensable for revealing microscopic reaction mechanisms and providing interpretable physical constraints for machine learning frameworks.
The INCL [7, 8] model describes the rapid intranuclear cascade as sequential two-body nucleon collisions under Pauli blocking effects. The first collision is subject to strict Pauli blocking, and subsequent collisions follow a random blocking mechanism modulated by the final-state blocking factor. Nucleons within the nucleus obey the Woods-Saxon density distribution, and the cascade process terminates at a self-consistent time determined by the nuclear mass, thus obviating the need for a pre-equilibrium stage. ABLA++ [9] describes the de-excitation of residual nuclei via particle evaporation, fission, and multifragmentation, where particle evaporation conforms to the Weisskopf-Ewing formalism. Its fission width is defined by the Bohr-Wheeler transition-state model [10] and the Moretto formalism [11], and nuclear level density is characterized by the Gilbert-Cameron constant temperature model [12] and the Bethe-type Fermi gas model [13]. GEMINI++ [14] depicts successive binary decays of excited residual nuclei until de-excitation is dominated by gamma emission. Its evaporation process follows the Hauser-Feshbach formalism with strict angular momentum conservation and requires a longer computation time. For fission width, GEMINI++ applies the Bohr-Wheeler model to symmetric components and the Moretto formalism to asymmetric components, and only the Fermi gas model is used for level density calculation. The liquid drop barriers in both ABLA++ and GEMINI++ originate from the finite-range model [15]. These well-validated theoretical reaction models provide comprehensive microscopic physical information on intranuclear cascade processes, and lay a foundation for embedding physical constraints into data-driven machine learning frameworks.
In a representative study on Bayesian neural network (BNN)-augmented nuclear data evaluation [16], Song et al. established an IQMD-GEMINI++-BNN coupled framework for spallation isotope production cross-sections. In this framework, the BNN serves purely as a post-correction module that improves the final theoretical predictions by fitting logarithmic residuals between simulation results and experimental data, without incorporating residual nucleus properties as input features of the model.
The current study builds on our previous investigation [17] in which a baseline BNN model was developed for high-energy fission cross-section estimation. However, the developed model exhibited limited prediction reliability in energy regions with scarce training data. This model incorporated no physical constraints associated with the intranuclear cascade process and only constructed an empirical mapping between the macroscopic global parameters and fission cross-sections. Moreover, its shallow fully connected architecture delivered restricted feature extraction capacity, and the model was validated solely for the neutron-induced fission
$ (n,f) $ channel, leaving its generalization performance for proton-induced fission$ (p,f) $ untested.To overcome these drawbacks, this work establishes a coupled framework containing the INCL and BNN models, and introduces multi-dimensional physical parameters to enrich the input feature space of the model. By extracting the statistical features of residual nuclei from INCL++ simulation outputs, the proposed framework alleviates the overfitting risk inherent in the direct coupling of Monte Carlo results with the BNN model and effectively enhances the extrapolation accuracy by embedding physical constraints from the intranuclear cascade process. Implemented within the BLiTZ framework [18], this study employs the INCL++ code (version 6.33.1) coupled with the BNN model to calculate the fission cross-sections of actinide nuclei induced by both protons and neutrons over the energy range of 20 MeV to 1.2 GeV. Meanwhile, the applicability of the BNN model is extended to the
$ (p,f) $ reaction channel, and the predicted results are systematically benchmarked against simulation outputs from the INCL-ABLA++ and INCL-GEMINI++ models. -
The design, construction, operation and maintenance of new-generation advanced nuclear energy facilities require extensively evaluated intermediate- and high-energy nuclear data, whose accuracy and reliability directly determine the progress of nuclear engineering projects. In Accelerator-Driven Subcritical Systems (ADS), high-energy proton beams bombard spallation targets to produce neutrons. Accurate nuclear reaction data above 20 MeV are essential for the design of coupled target-reactor systems, to improve the transmutation efficiency of nuclear waste and optimize reactor shielding design. At present, international nuclear data evaluation projects such as the JENDL-5 [1] and CENDL-3.2 [2] libraries are well-established in the intermediate and low-energy regions, whereas evaluated data in the high-energy range above 200 MeV remain scarce. Such scarcity of high-energy evaluated nuclear data creates an urgent demand for efficient and robust predictive approaches to complement traditional evaluation methods.
Nowadays, machine learning methods are widely adopted in nuclear physics research, providing novel solutions for nuclear data evaluation and theoretical model optimization. Explainable machine learning algorithms such as Kolmogorov-Arnold networks are applied to revise the WS4 theoretical mass model and improve its physical rationality [3]. Physics-Informed Neural Networks (PINN) combined with multi-task learning are employed to predict nuclear level density, which effectively improves the prediction accuracy while guaranteeing physical consistency [4]. Bayesian mixture density networks are utilized to evaluate neutron-induced fission charge yields and achieve robust probabilistic prediction with sparse experimental data [5]. Additionally, Graph Neural Networks (GNNs) are adopted to explore the variation characteristics of nuclear cross-sections across the entire nuclide chart, thus reliably predicting cross-sections for unmeasured nuclides and unexplored energy regions [6]. Although data-driven machine learning approaches exhibit promising performance in nuclear data tasks, physically grounded reaction models remain indispensable for revealing microscopic reaction mechanisms and providing interpretable physical constraints for machine learning frameworks.
The INCL [7, 8] model describes the rapid intranuclear cascade as sequential two-body nucleon collisions under Pauli blocking effects. The first collision is subject to strict Pauli blocking, and subsequent collisions follow a random blocking mechanism modulated by the final-state blocking factor. Nucleons within the nucleus obey the Woods-Saxon density distribution, and the cascade process terminates at a self-consistent time determined by the nuclear mass, thus obviating the need for a pre-equilibrium stage. ABLA++ [9] describes the de-excitation of residual nuclei via particle evaporation, fission, and multifragmentation, where particle evaporation conforms to the Weisskopf-Ewing formalism. Its fission width is defined by the Bohr-Wheeler transition-state model [10] and the Moretto formalism [11], and nuclear level density is characterized by the Gilbert-Cameron constant temperature model [12] and the Bethe-type Fermi gas model [13]. GEMINI++ [14] depicts successive binary decays of excited residual nuclei until de-excitation is dominated by gamma emission. Its evaporation process follows the Hauser-Feshbach formalism with strict angular momentum conservation and requires a longer computation time. For fission width, GEMINI++ applies the Bohr-Wheeler model to symmetric components and the Moretto formalism to asymmetric components, and only the Fermi gas model is used for level density calculation. The liquid drop barriers in both ABLA++ and GEMINI++ originate from the finite-range model [15]. These well-validated theoretical reaction models provide comprehensive microscopic physical information on intranuclear cascade processes, and lay a foundation for embedding physical constraints into data-driven machine learning frameworks.
In a representative study on Bayesian neural network (BNN)-augmented nuclear data evaluation [16], Song et al. established an IQMD-GEMINI++-BNN coupled framework for spallation isotope production cross-sections. In this framework, the BNN serves purely as a post-correction module that improves the final theoretical predictions by fitting logarithmic residuals between simulation results and experimental data, without incorporating residual nucleus properties as input features of the model.
The current study builds on our previous investigation [17] in which a baseline BNN model was developed for high-energy fission cross-section estimation. However, the developed model exhibited limited prediction reliability in energy regions with scarce training data. This model incorporated no physical constraints associated with the intranuclear cascade process and only constructed an empirical mapping between the macroscopic global parameters and fission cross-sections. Moreover, its shallow fully connected architecture delivered restricted feature extraction capacity, and the model was validated solely for the neutron-induced fission
$ (n,f) $ channel, leaving its generalization performance for proton-induced fission$ (p,f) $ untested.To overcome these drawbacks, this work establishes a coupled framework containing the INCL and BNN models, and introduces multi-dimensional physical parameters to enrich the input feature space of the model. By extracting the statistical features of residual nuclei from INCL++ simulation outputs, the proposed framework alleviates the overfitting risk inherent in the direct coupling of Monte Carlo results with the BNN model and effectively enhances the extrapolation accuracy by embedding physical constraints from the intranuclear cascade process. Implemented within the BLiTZ framework [18], this study employs the INCL++ code (version 6.33.1) coupled with the BNN model to calculate the fission cross-sections of actinide nuclei induced by both protons and neutrons over the energy range of 20 MeV to 1.2 GeV. Meanwhile, the applicability of the BNN model is extended to the
$ (p,f) $ reaction channel, and the predicted results are systematically benchmarked against simulation outputs from the INCL-ABLA++ and INCL-GEMINI++ models. -
The design, construction, operation and maintenance of new-generation advanced nuclear energy facilities require extensively evaluated intermediate- and high-energy nuclear data, whose accuracy and reliability directly determine the progress of nuclear engineering projects. In Accelerator-Driven Subcritical Systems (ADS), high-energy proton beams bombard spallation targets to produce neutrons. Accurate nuclear reaction data above 20 MeV are essential for the design of coupled target-reactor systems, to improve the transmutation efficiency of nuclear waste and optimize reactor shielding design. At present, international nuclear data evaluation projects such as the JENDL-5 [1] and CENDL-3.2 [2] libraries are well-established in the intermediate and low-energy regions, whereas evaluated data in the high-energy range above 200 MeV remain scarce. Such scarcity of high-energy evaluated nuclear data creates an urgent demand for efficient and robust predictive approaches to complement traditional evaluation methods.
Nowadays, machine learning methods are widely adopted in nuclear physics research, providing novel solutions for nuclear data evaluation and theoretical model optimization. Explainable machine learning algorithms such as Kolmogorov-Arnold networks are applied to revise the WS4 theoretical mass model and improve its physical rationality [3]. Physics-Informed Neural Networks (PINN) combined with multi-task learning are employed to predict nuclear level density, which effectively improves the prediction accuracy while guaranteeing physical consistency [4]. Bayesian mixture density networks are utilized to evaluate neutron-induced fission charge yields and achieve robust probabilistic prediction with sparse experimental data [5]. Additionally, Graph Neural Networks (GNNs) are adopted to explore the variation characteristics of nuclear cross-sections across the entire nuclide chart, thus reliably predicting cross-sections for unmeasured nuclides and unexplored energy regions [6]. Although data-driven machine learning approaches exhibit promising performance in nuclear data tasks, physically grounded reaction models remain indispensable for revealing microscopic reaction mechanisms and providing interpretable physical constraints for machine learning frameworks.
The INCL [7, 8] model describes the rapid intranuclear cascade as sequential two-body nucleon collisions under Pauli blocking effects. The first collision is subject to strict Pauli blocking, and subsequent collisions follow a random blocking mechanism modulated by the final-state blocking factor. Nucleons within the nucleus obey the Woods-Saxon density distribution, and the cascade process terminates at a self-consistent time determined by the nuclear mass, thus obviating the need for a pre-equilibrium stage. ABLA++ [9] describes the de-excitation of residual nuclei via particle evaporation, fission, and multifragmentation, where particle evaporation conforms to the Weisskopf-Ewing formalism. Its fission width is defined by the Bohr-Wheeler transition-state model [10] and the Moretto formalism [11], and nuclear level density is characterized by the Gilbert-Cameron constant temperature model [12] and the Bethe-type Fermi gas model [13]. GEMINI++ [14] depicts successive binary decays of excited residual nuclei until de-excitation is dominated by gamma emission. Its evaporation process follows the Hauser-Feshbach formalism with strict angular momentum conservation and requires a longer computation time. For fission width, GEMINI++ applies the Bohr-Wheeler model to symmetric components and the Moretto formalism to asymmetric components, and only the Fermi gas model is used for level density calculation. The liquid drop barriers in both ABLA++ and GEMINI++ originate from the finite-range model [15]. These well-validated theoretical reaction models provide comprehensive microscopic physical information on intranuclear cascade processes, and lay a foundation for embedding physical constraints into data-driven machine learning frameworks.
In a representative study on Bayesian neural network (BNN)-augmented nuclear data evaluation [16], Song et al. established an IQMD-GEMINI++-BNN coupled framework for spallation isotope production cross-sections. In this framework, the BNN serves purely as a post-correction module that improves the final theoretical predictions by fitting logarithmic residuals between simulation results and experimental data, without incorporating residual nucleus properties as input features of the model.
The current study builds on our previous investigation [17] in which a baseline BNN model was developed for high-energy fission cross-section estimation. However, the developed model exhibited limited prediction reliability in energy regions with scarce training data. This model incorporated no physical constraints associated with the intranuclear cascade process and only constructed an empirical mapping between the macroscopic global parameters and fission cross-sections. Moreover, its shallow fully connected architecture delivered restricted feature extraction capacity, and the model was validated solely for the neutron-induced fission
$ (n,f) $ channel, leaving its generalization performance for proton-induced fission$ (p,f) $ untested.To overcome these drawbacks, this work establishes a coupled framework containing the INCL and BNN models, and introduces multi-dimensional physical parameters to enrich the input feature space of the model. By extracting the statistical features of residual nuclei from INCL++ simulation outputs, the proposed framework alleviates the overfitting risk inherent in the direct coupling of Monte Carlo results with the BNN model and effectively enhances the extrapolation accuracy by embedding physical constraints from the intranuclear cascade process. Implemented within the BLiTZ framework [18], this study employs the INCL++ code (version 6.33.1) coupled with the BNN model to calculate the fission cross-sections of actinide nuclei induced by both protons and neutrons over the energy range of 20 MeV to 1.2 GeV. Meanwhile, the applicability of the BNN model is extended to the
$ (p,f) $ reaction channel, and the predicted results are systematically benchmarked against simulation outputs from the INCL-ABLA++ and INCL-GEMINI++ models. -
The design, construction, operation and maintenance of new-generation advanced nuclear energy facilities require extensively evaluated intermediate- and high-energy nuclear data, whose accuracy and reliability directly determine the progress of nuclear engineering projects. In Accelerator-Driven Subcritical Systems (ADS), high-energy proton beams bombard spallation targets to produce neutrons. Accurate nuclear reaction data above 20 MeV are essential for the design of coupled target-reactor systems, to improve the transmutation efficiency of nuclear waste and optimize reactor shielding design. At present, international nuclear data evaluation projects such as the JENDL-5 [1] and CENDL-3.2 [2] libraries are well-established in the intermediate and low-energy regions, whereas evaluated data in the high-energy range above 200 MeV remain scarce. Such scarcity of high-energy evaluated nuclear data creates an urgent demand for efficient and robust predictive approaches to complement traditional evaluation methods.
Nowadays, machine learning methods are widely adopted in nuclear physics research, providing novel solutions for nuclear data evaluation and theoretical model optimization. Explainable machine learning algorithms such as Kolmogorov-Arnold networks are applied to revise the WS4 theoretical mass model and improve its physical rationality [3]. Physics-Informed Neural Networks (PINN) combined with multi-task learning are employed to predict nuclear level density, which effectively improves the prediction accuracy while guaranteeing physical consistency [4]. Bayesian mixture density networks are utilized to evaluate neutron-induced fission charge yields and achieve robust probabilistic prediction with sparse experimental data [5]. Additionally, Graph Neural Networks (GNNs) are adopted to explore the variation characteristics of nuclear cross-sections across the entire nuclide chart, thus reliably predicting cross-sections for unmeasured nuclides and unexplored energy regions [6]. Although data-driven machine learning approaches exhibit promising performance in nuclear data tasks, physically grounded reaction models remain indispensable for revealing microscopic reaction mechanisms and providing interpretable physical constraints for machine learning frameworks.
The INCL [7, 8] model describes the rapid intranuclear cascade as sequential two-body nucleon collisions under Pauli blocking effects. The first collision is subject to strict Pauli blocking, and subsequent collisions follow a random blocking mechanism modulated by the final-state blocking factor. Nucleons within the nucleus obey the Woods-Saxon density distribution, and the cascade process terminates at a self-consistent time determined by the nuclear mass, thus obviating the need for a pre-equilibrium stage. ABLA++ [9] describes the de-excitation of residual nuclei via particle evaporation, fission, and multifragmentation, where particle evaporation conforms to the Weisskopf-Ewing formalism. Its fission width is defined by the Bohr-Wheeler transition-state model [10] and the Moretto formalism [11], and nuclear level density is characterized by the Gilbert-Cameron constant temperature model [12] and the Bethe-type Fermi gas model [13]. GEMINI++ [14] depicts successive binary decays of excited residual nuclei until de-excitation is dominated by gamma emission. Its evaporation process follows the Hauser-Feshbach formalism with strict angular momentum conservation and requires a longer computation time. For fission width, GEMINI++ applies the Bohr-Wheeler model to symmetric components and the Moretto formalism to asymmetric components, and only the Fermi gas model is used for level density calculation. The liquid drop barriers in both ABLA++ and GEMINI++ originate from the finite-range model [15]. These well-validated theoretical reaction models provide comprehensive microscopic physical information on intranuclear cascade processes, and lay a foundation for embedding physical constraints into data-driven machine learning frameworks.
In a representative study on Bayesian neural network (BNN)-augmented nuclear data evaluation [16], Song et al. established an IQMD-GEMINI++-BNN coupled framework for spallation isotope production cross-sections. In this framework, the BNN serves purely as a post-correction module that improves the final theoretical predictions by fitting logarithmic residuals between simulation results and experimental data, without incorporating residual nucleus properties as input features of the model.
The current study builds on our previous investigation [17] in which a baseline BNN model was developed for high-energy fission cross-section estimation. However, the developed model exhibited limited prediction reliability in energy regions with scarce training data. This model incorporated no physical constraints associated with the intranuclear cascade process and only constructed an empirical mapping between the macroscopic global parameters and fission cross-sections. Moreover, its shallow fully connected architecture delivered restricted feature extraction capacity, and the model was validated solely for the neutron-induced fission
$ (n,f) $ channel, leaving its generalization performance for proton-induced fission$ (p,f) $ untested.To overcome these drawbacks, this work establishes a coupled framework containing the INCL and BNN models, and introduces multi-dimensional physical parameters to enrich the input feature space of the model. By extracting the statistical features of residual nuclei from INCL++ simulation outputs, the proposed framework alleviates the overfitting risk inherent in the direct coupling of Monte Carlo results with the BNN model and effectively enhances the extrapolation accuracy by embedding physical constraints from the intranuclear cascade process. Implemented within the BLiTZ framework [18], this study employs the INCL++ code (version 6.33.1) coupled with the BNN model to calculate the fission cross-sections of actinide nuclei induced by both protons and neutrons over the energy range of 20 MeV to 1.2 GeV. Meanwhile, the applicability of the BNN model is extended to the
$ (p,f) $ reaction channel, and the predicted results are systematically benchmarked against simulation outputs from the INCL-ABLA++ and INCL-GEMINI++ models. -
INCL++ is a Monte Carlo simulation code widely used for nuclear reaction simulations. Considering 20 MeV neutrons bombarding
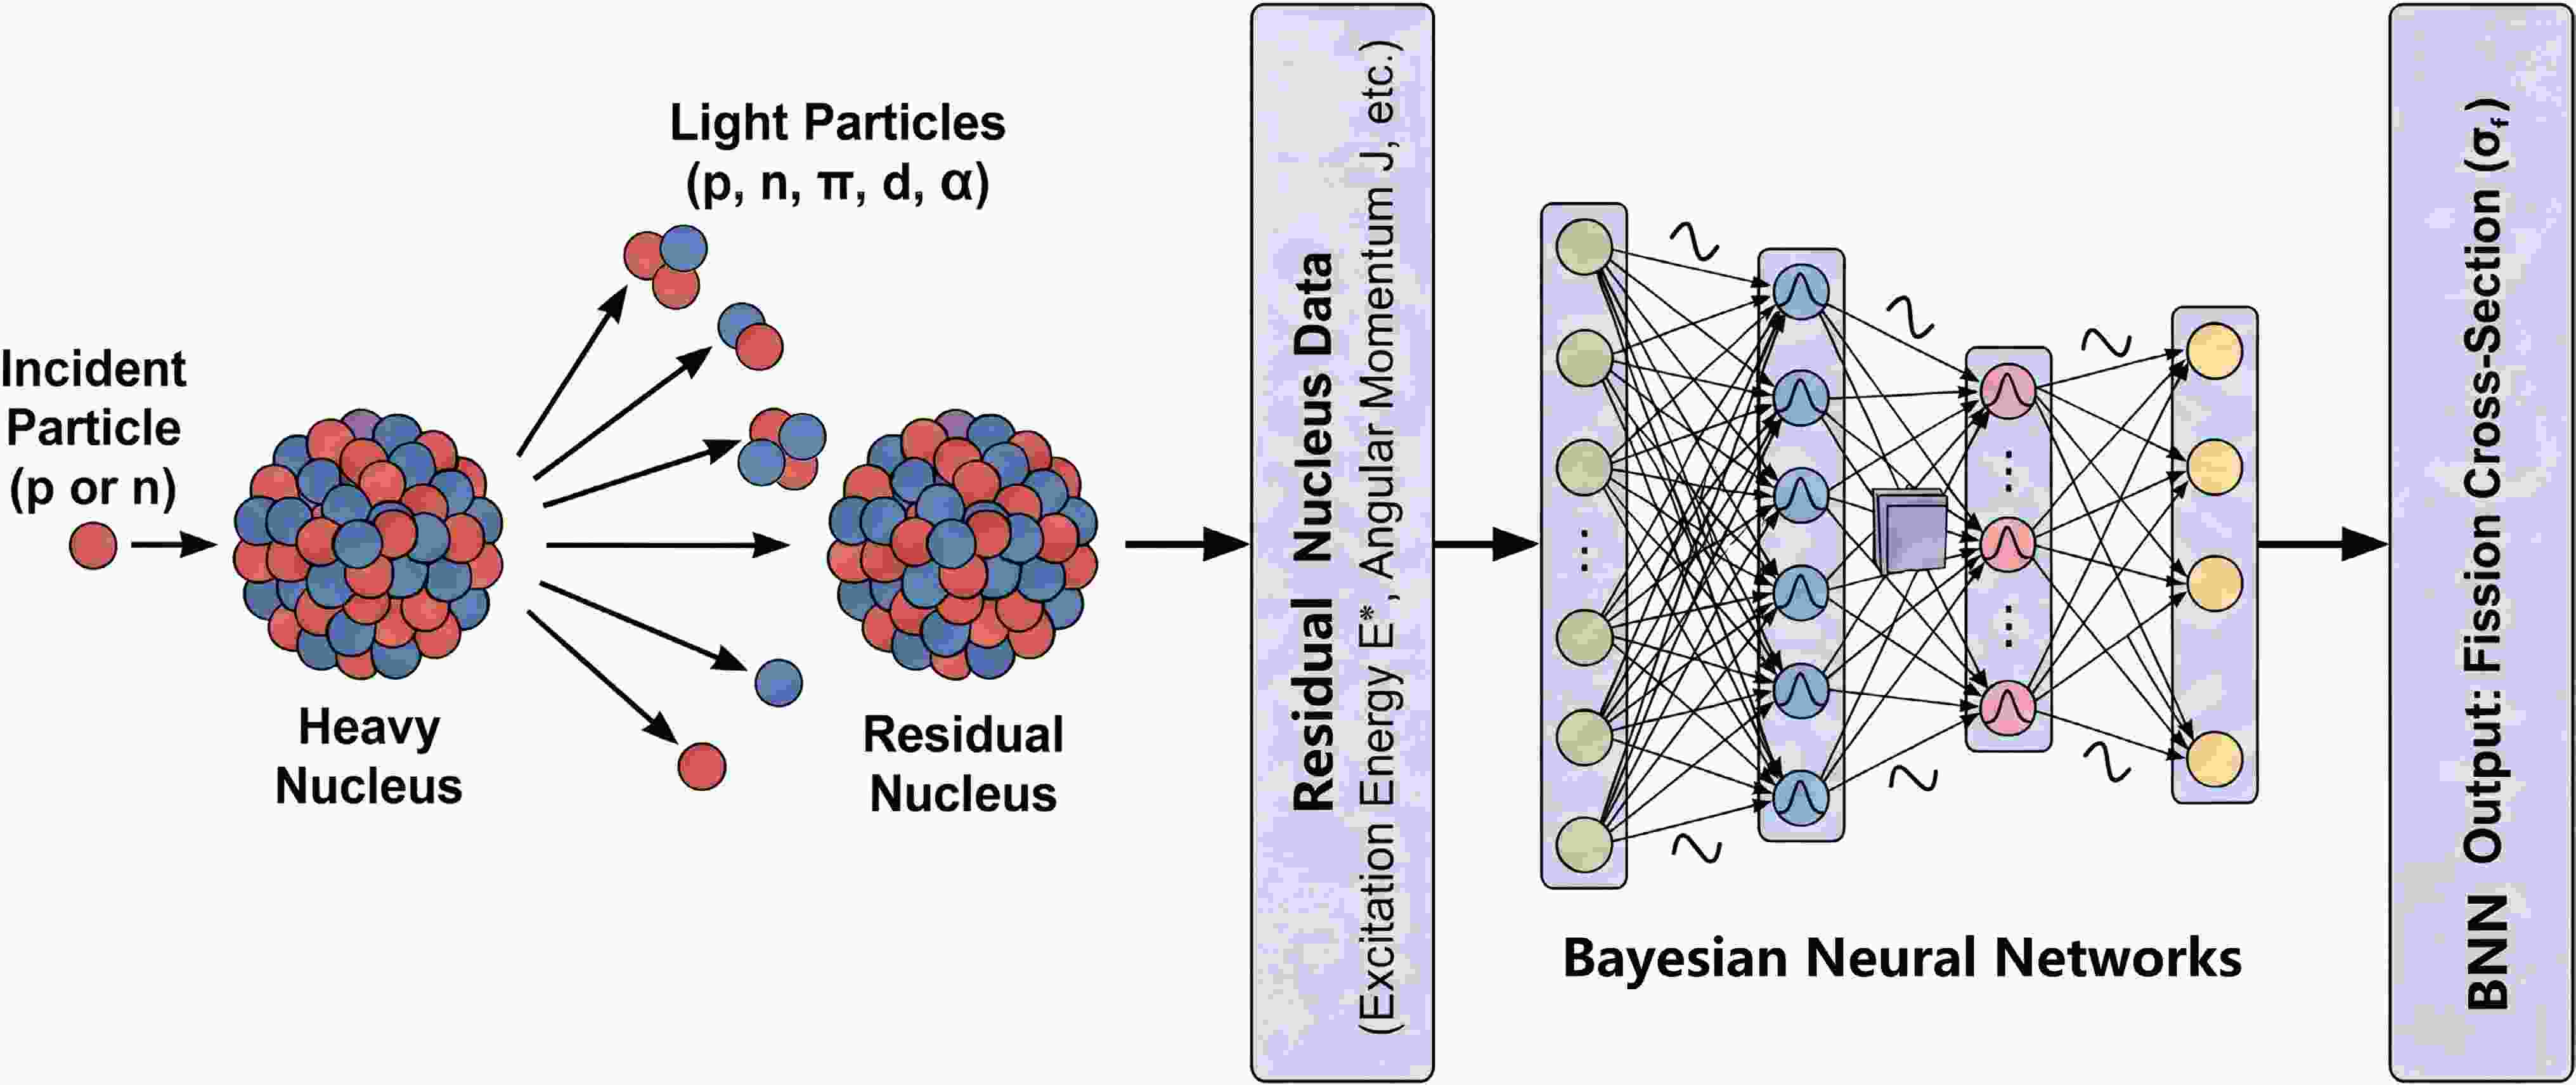
$ ^{235}{\rm{U}} $ as a typical example, when the number of incident neutrons is set as$ 1\times10^6 $ , the simulation generates approximately$ 3.7\times10^5 $ residual nuclei. Directly feeding the original information of all residual nuclei into the BNN model causes excessive computational burden, induces drastic fluctuations in the prediction results, and significantly increases the risk of model overfitting. To solve this issue, the key physical parameters of residual nuclei are extracted, including the mass number A, atomic number Z, excitation energy$ E^* $ , angular momentum J, neutron excess parameter$ (\dfrac{A-2Z}{A}) $ and fissility parameter$ (\dfrac{Z^2}{A}) $ . Based on the statistical distributions of these physical quantities, multiple statistical features are calculated, comprising the mean, median, 10% trimmed mean, standard deviation, Interquartile Range (IQR), Median Absolute Deviation (MAD), total range, maximum value, minimum value, critical quantiles (P10, P25, P75, P90), skewness, excess kurtosis, distribution entropy, coefficient of variation (CV), upper tail ratio and lower tail ratio. These statistical features are adopted as the input of the BNN model. Additionally, the global input variables are supplemented, including the A, Z, neutron excess parameter and fissility parameter of the target nucleus, as well as the A, Z, isospin, incident energy of incident particles, and the yield of residual nuclei. The total input dimension of the BNN model is 123. The extraction and dimensionality reduction of the statistical distribution features effectively reduce the input redundancy and strongly mitigate the overfitting risk. The schematic is shown in Fig. 1. The specific statistical features and their corresponding mathematical expressions are defined as follows.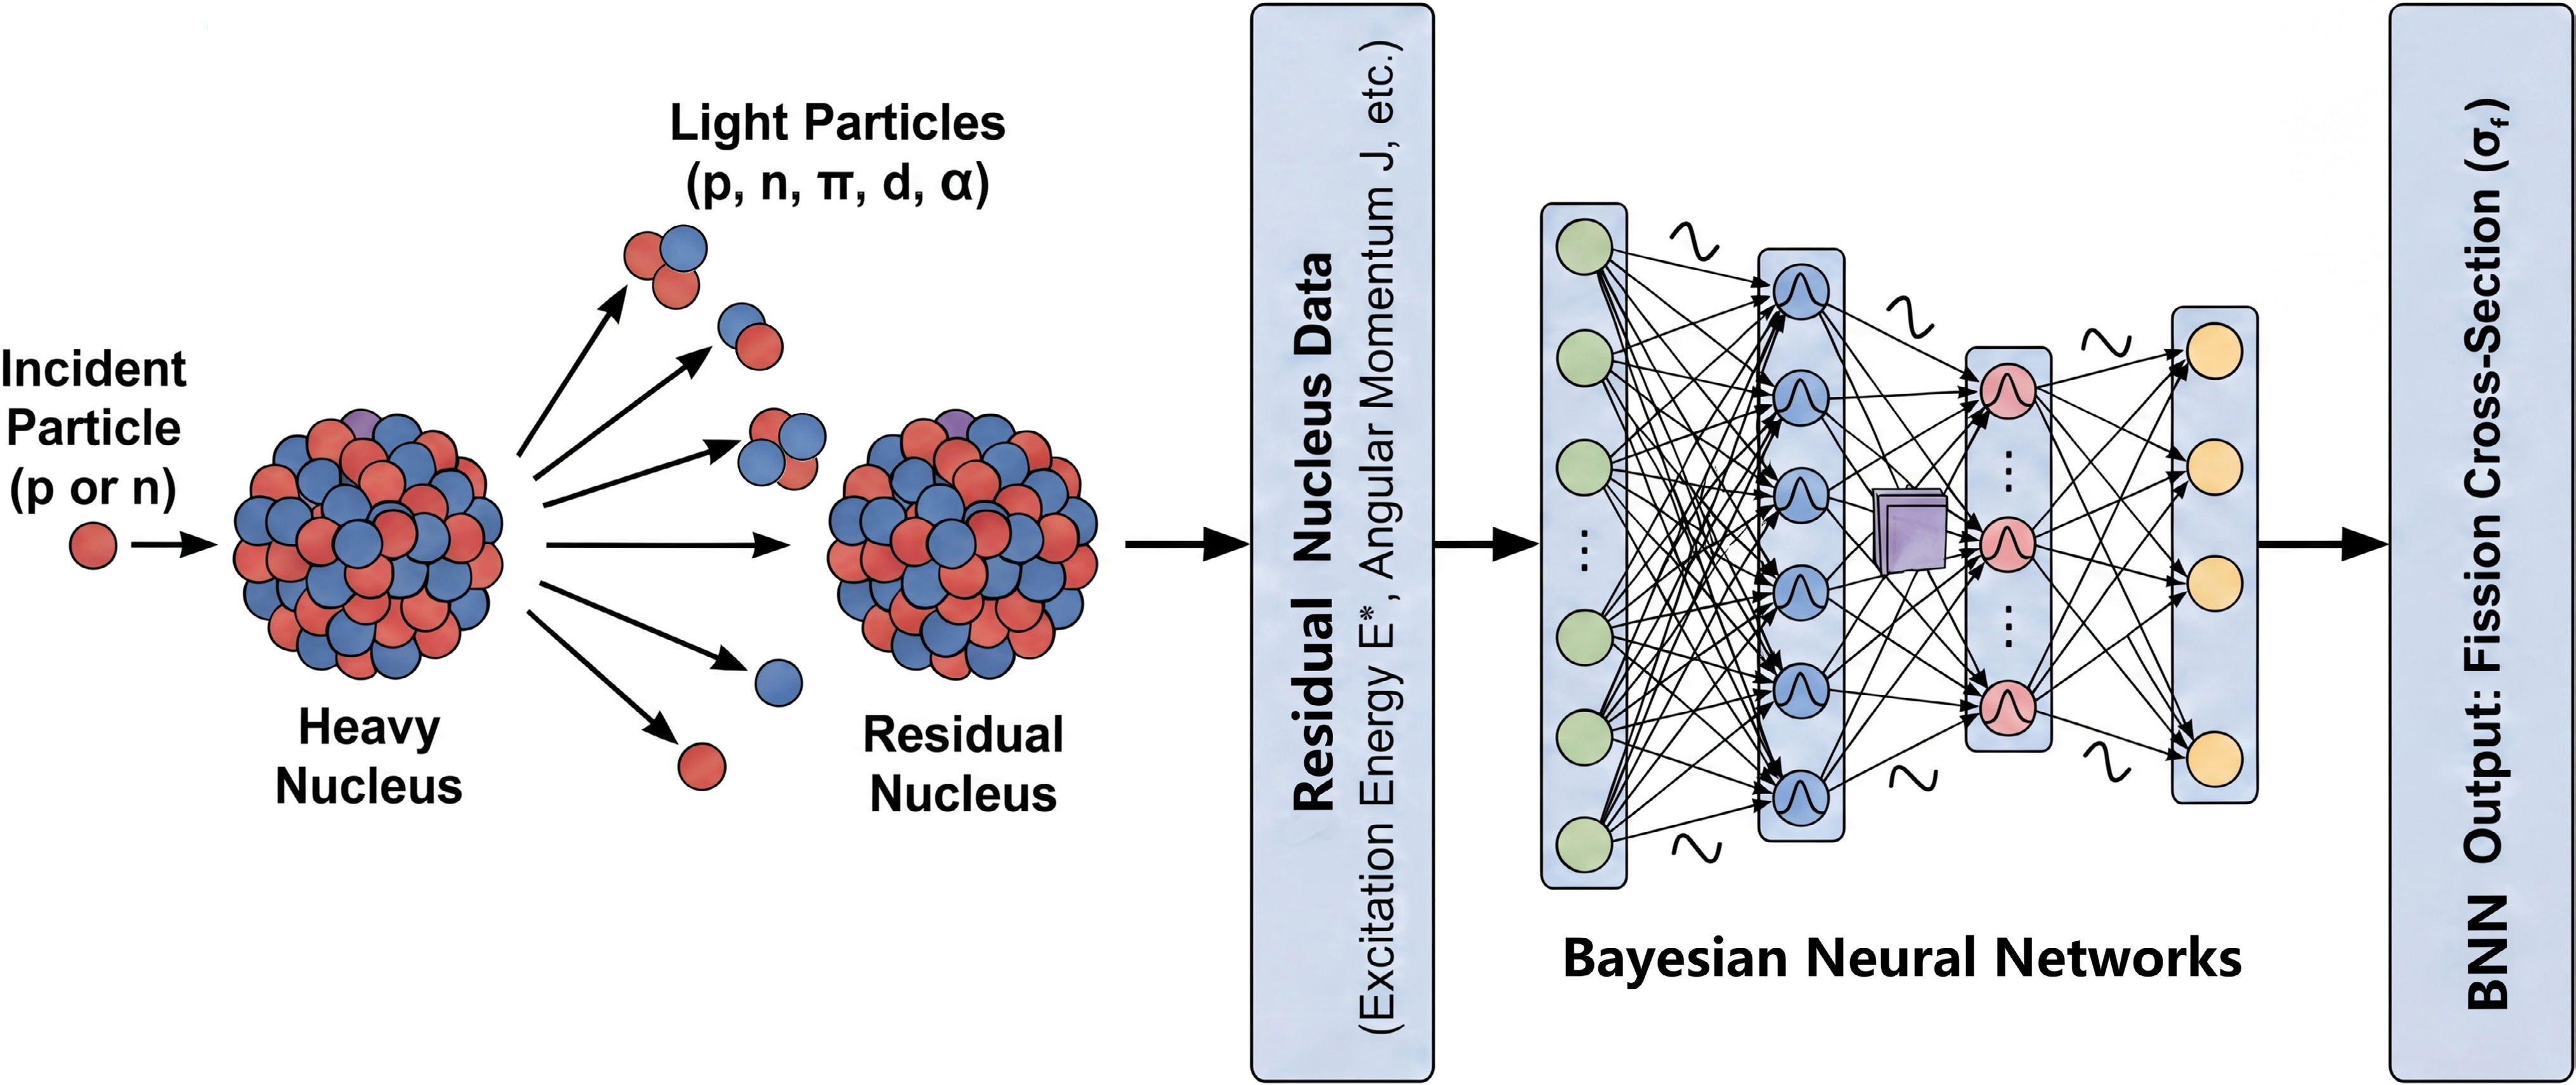
Figure 1. (color online) Schematic of the coupled INCL-BNN model。
-
INCL++ is a Monte Carlo simulation code widely used for nuclear reaction simulations. Considering 20 MeV neutrons bombarding
$ ^{235}{\rm{U}} $ as a typical example, when the number of incident neutrons is set as$ 1\times10^6 $ , the simulation generates approximately$ 3.7\times10^5 $ residual nuclei. Directly feeding the original information of all residual nuclei into the BNN model causes excessive computational burden, induces drastic fluctuations in the prediction results, and significantly increases the risk of model overfitting. To solve this issue, the key physical parameters of residual nuclei are extracted, including the mass number A, atomic number Z, excitation energy$ E^* $ , angular momentum J, neutron excess parameter$ (\dfrac{A-2Z}{A}) $ and fissility parameter$ (\dfrac{Z^2}{A}) $ . Based on the statistical distributions of these physical quantities, multiple statistical features are calculated, comprising the mean, median, 10% trimmed mean, standard deviation, Interquartile Range (IQR), Median Absolute Deviation (MAD), total range, maximum value, minimum value, critical quantiles (P10, P25, P75, P90), skewness, excess kurtosis, distribution entropy, coefficient of variation (CV), upper tail ratio and lower tail ratio. These statistical features are adopted as the input of the BNN model. Additionally, the global input variables are supplemented, including the A, Z, neutron excess parameter and fissility parameter of the target nucleus, as well as the A, Z, isospin, incident energy of incident particles, and the yield of residual nuclei. The total input dimension of the BNN model is 123. The extraction and dimensionality reduction of the statistical distribution features effectively reduce the input redundancy and strongly mitigate the overfitting risk. The schematic is shown in Fig. 1. The specific statistical features and their corresponding mathematical expressions are defined as follows.
Figure 1. (color online) Schematic of the coupled INCL-BNN model。
-
INCL++ is a Monte Carlo simulation code widely used for nuclear reaction simulations. Considering 20 MeV neutrons bombarding
$ ^{235}{\rm{U}} $ as a typical example, when the number of incident neutrons is set as$ 1\times10^6 $ , the simulation generates approximately$ 3.7\times10^5 $ residual nuclei. Directly feeding the original information of all residual nuclei into the BNN model causes excessive computational burden, induces drastic fluctuations in the prediction results, and significantly increases the risk of model overfitting. To solve this issue, the key physical parameters of residual nuclei are extracted, including the mass number A, atomic number Z, excitation energy$ E^* $ , angular momentum J, neutron excess parameter$ (\dfrac{A-2Z}{A}) $ and fissility parameter$ (\dfrac{Z^2}{A}) $ . Based on the statistical distributions of these physical quantities, multiple statistical features are calculated, comprising the mean, median, 10% trimmed mean, standard deviation, Interquartile Range (IQR), Median Absolute Deviation (MAD), total range, maximum value, minimum value, critical quantiles (P10, P25, P75, P90), skewness, excess kurtosis, distribution entropy, coefficient of variation (CV), upper tail ratio and lower tail ratio. These statistical features are adopted as the input of the BNN model. Additionally, the global input variables are supplemented, including the A, Z, neutron excess parameter and fissility parameter of the target nucleus, as well as the A, Z, isospin, incident energy of incident particles, and the yield of residual nuclei. The total input dimension of the BNN model is 123. The extraction and dimensionality reduction of the statistical distribution features effectively reduce the input redundancy and strongly mitigate the overfitting risk. The schematic is shown in Fig. 1. The specific statistical features and their corresponding mathematical expressions are defined as follows.
Figure 1. (color online) Schematic of the coupled INCL-BNN model。
-
INCL++ is a Monte Carlo simulation code widely used for nuclear reaction simulations. Considering 20 MeV neutrons bombarding
$ ^{235}{\rm{U}} $ as a typical example, when the number of incident neutrons is set as$ 1\times10^6 $ , the simulation generates approximately$ 3.7\times10^5 $ residual nuclei. Directly feeding the original information of all residual nuclei into the BNN model causes excessive computational burden, induces drastic fluctuations in the prediction results, and significantly increases the risk of model overfitting. To solve this issue, the key physical parameters of residual nuclei are extracted, including the mass number A, atomic number Z, excitation energy$ E^* $ , angular momentum J, neutron excess parameter$ (\dfrac{A-2Z}{A}) $ and fissility parameter$ (\dfrac{Z^2}{A}) $ . Based on the statistical distributions of these physical quantities, multiple statistical features are calculated, comprising the mean, median, 10% trimmed mean, standard deviation, Interquartile Range (IQR), Median Absolute Deviation (MAD), total range, maximum value, minimum value, critical quantiles (P10, P25, P75, P90), skewness, excess kurtosis, distribution entropy, coefficient of variation (CV), upper tail ratio and lower tail ratio. These statistical features are adopted as the input of the BNN model. Additionally, the global input variables are supplemented, including the A, Z, neutron excess parameter and fissility parameter of the target nucleus, as well as the A, Z, isospin, incident energy of incident particles, and the yield of residual nuclei. The total input dimension of the BNN model is 123. The extraction and dimensionality reduction of the statistical distribution features effectively reduce the input redundancy and strongly mitigate the overfitting risk. The schematic is shown in Fig. 1. The specific statistical features and their corresponding mathematical expressions are defined as follows.
Figure 1. (color online) Schematic of the coupled INCL-BNN model。
-
10% §trimmed mean (
$ \bar{x}_{K} $ ,$ K=0.1 $ ): The arithmetic mean of the remaining data after excluding the top 10% and bottom 10% of extreme values, which reduces the interference of outliers:$ \bar{x}_{K} = \frac{1}{n(1-2K)}\sum\limits_{i=\lfloor Kn\rfloor+1}^{\lceil (1-K)n\rceil} x_{(i)}. $
(1) Sample standard deviation (σ): A core indicator describing the degree of data dispersion:
$ \sigma = \sqrt{\frac{1}{n-1}\sum\limits_{i=1}^{n} \left(x_i - \bar{x}\right)^2}. $
(2) Interquartile Range (IQR): The difference between the upper and lower quartiles, which is robust to outliers:
$ {IQR} = Q_{0.75} - Q_{0.25}, $
(3) where
$ Q_{0.25} $ is the 25th percentile (P25) and$ Q_{0.75} $ is the 75th percentile (P75).Median Absolute Deviation (MAD): The median of the absolute deviations of data points from the overall median, a highly robust statistic:
$ {MAD} = {{Median}}\left( \left| x_i - {{Median}}(x) \right| \right). $
(4) Total range (Range): The difference between the maximum and minimum values of a dataset:
$ {Range} = x_{{\rm{max}}} - x_{{\rm{min}}}. $
(5) -
10% §trimmed mean (
$ \bar{x}_{K} $ ,$ K=0.1 $ ): The arithmetic mean of the remaining data after excluding the top 10% and bottom 10% of extreme values, which reduces the interference of outliers:$ \bar{x}_{K} = \frac{1}{n(1-2K)}\sum\limits_{i=\lfloor Kn\rfloor+1}^{\lceil (1-K)n\rceil} x_{(i)}. $
(1) Sample standard deviation (σ): A core indicator describing the degree of data dispersion:
$ \sigma = \sqrt{\frac{1}{n-1}\sum\limits_{i=1}^{n} \left(x_i - \bar{x}\right)^2}. $
(2) Interquartile Range (IQR): The difference between the upper and lower quartiles, which is robust to outliers:
$ {IQR} = Q_{0.75} - Q_{0.25}, $
(3) where
$ Q_{0.25} $ is the 25th percentile (P25) and$ Q_{0.75} $ is the 75th percentile (P75).Median Absolute Deviation (MAD): The median of the absolute deviations of data points from the overall median, a highly robust statistic:
$ {MAD} = {{Median}}\left( \left| x_i - {{Median}}(x) \right| \right). $
(4) Total range (Range): The difference between the maximum and minimum values of a dataset:
$ {Range} = x_{{\rm{max}}} - x_{{\rm{min}}}. $
(5) -
10% §trimmed mean (
$ \bar{x}_{K} $ ,$ K=0.1 $ ): The arithmetic mean of the remaining data after excluding the top 10% and bottom 10% of extreme values, which reduces the interference of outliers:$ \bar{x}_{K} = \frac{1}{n(1-2K)}\sum\limits_{i=\lfloor Kn\rfloor+1}^{\lceil (1-K)n\rceil} x_{(i)}. $
(1) Sample standard deviation (σ): A core indicator describing the degree of data dispersion:
$ \sigma = \sqrt{\frac{1}{n-1}\sum\limits_{i=1}^{n} \left(x_i - \bar{x}\right)^2}. $
(2) Interquartile Range (IQR): The difference between the upper and lower quartiles, which is robust to outliers:
$ {IQR} = Q_{0.75} - Q_{0.25}, $
(3) where
$ Q_{0.25} $ is the 25th percentile (P25) and$ Q_{0.75} $ is the 75th percentile (P75).Median Absolute Deviation (MAD): The median of the absolute deviations of data points from the overall median, a highly robust statistic:
$ {MAD} = {{Median}}\left( \left| x_i - {{Median}}(x) \right| \right). $
(4) Total range (Range): The difference between the maximum and minimum values of a dataset:
$ {Range} = x_{{\rm{max}}} - x_{{\rm{min}}}. $
(5) -
10% §trimmed mean (
$ \bar{x}_{K} $ ,$ K=0.1 $ ): The arithmetic mean of the remaining data after excluding the top 10% and bottom 10% of extreme values, which reduces the interference of outliers:$ \bar{x}_{K} = \frac{1}{n(1-2K)}\sum\limits_{i=\lfloor Kn\rfloor+1}^{\lceil (1-K)n\rceil} x_{(i)}. $
(1) Sample standard deviation (σ): A core indicator describing the degree of data dispersion:
$ \sigma = \sqrt{\frac{1}{n-1}\sum\limits_{i=1}^{n} \left(x_i - \bar{x}\right)^2}. $
(2) Interquartile Range (IQR): The difference between the upper and lower quartiles, which is robust to outliers:
$ {IQR} = Q_{0.75} - Q_{0.25}, $
(3) where
$ Q_{0.25} $ is the 25th percentile (P25) and$ Q_{0.75} $ is the 75th percentile (P75).Median Absolute Deviation (MAD): The median of the absolute deviations of data points from the overall median, a highly robust statistic:
$ {MAD} = {{Median}}\left( \left| x_i - {{Median}}(x) \right| \right). $
(4) Total range (Range): The difference between the maximum and minimum values of a dataset:
$ {Range} = x_{{\rm{max}}} - x_{{\rm{min}}}. $
(5) -
The 10th, 25th, 75th, and 90th percentiles (denoted as P10, P25, P75, P90) are the critical cut-off values corresponding to cumulative probabilities after sorting the dataset in ascending order, expressed as
$ Q_{0.10},\; Q_{0.25},\; Q_{0.75},\; Q_{0.90}. $
(6) -
The 10th, 25th, 75th, and 90th percentiles (denoted as P10, P25, P75, P90) are the critical cut-off values corresponding to cumulative probabilities after sorting the dataset in ascending order, expressed as
$ Q_{0.10},\; Q_{0.25},\; Q_{0.75},\; Q_{0.90}. $
(6) -
The 10th, 25th, 75th, and 90th percentiles (denoted as P10, P25, P75, P90) are the critical cut-off values corresponding to cumulative probabilities after sorting the dataset in ascending order, expressed as
$ Q_{0.10},\; Q_{0.25},\; Q_{0.75},\; Q_{0.90}. $
(6) -
The 10th, 25th, 75th, and 90th percentiles (denoted as P10, P25, P75, P90) are the critical cut-off values corresponding to cumulative probabilities after sorting the dataset in ascending order, expressed as
$ Q_{0.10},\; Q_{0.25},\; Q_{0.75},\; Q_{0.90}. $
(6) -
Sample skewness: Describes the degree of left-right asymmetry of the data distribution:
$ {Skewness} = \frac{n}{(n-1)(n-2)}\sum\limits_{i=1}^n \left( \frac{x_i - \bar{x}}{\sigma} \right)^3. $
(7) Sample excess kurtosis: Measures the steepness or flatness of the distribution, adjusted by subtracting the benchmark value 3 of the normal distribution:
$ \begin{split} {Excess}\ {Kurtosis} =\;& \frac{n(n+1)}{(n-1)(n-2)(n-3)}\sum\limits_{i=1}^n \left( \frac{x_i - \bar{x}}{\sigma} \right)^4 \\ &- \frac{3(n-1)^2}{(n-2)(n-3)}. \end{split}$
(8) -
Sample skewness: Describes the degree of left-right asymmetry of the data distribution:
$ {Skewness} = \frac{n}{(n-1)(n-2)}\sum\limits_{i=1}^n \left( \frac{x_i - \bar{x}}{\sigma} \right)^3. $
(7) Sample excess kurtosis: Measures the steepness or flatness of the distribution, adjusted by subtracting the benchmark value 3 of the normal distribution:
$ \begin{split} {Excess}\ {Kurtosis} =\;& \frac{n(n+1)}{(n-1)(n-2)(n-3)}\sum\limits_{i=1}^n \left( \frac{x_i - \bar{x}}{\sigma} \right)^4 \\ &- \frac{3(n-1)^2}{(n-2)(n-3)}. \end{split}$
(8) -
Sample skewness: Describes the degree of left-right asymmetry of the data distribution:
$ {Skewness} = \frac{n}{(n-1)(n-2)}\sum\limits_{i=1}^n \left( \frac{x_i - \bar{x}}{\sigma} \right)^3. $
(7) Sample excess kurtosis: Measures the steepness or flatness of the distribution, adjusted by subtracting the benchmark value 3 of the normal distribution:
$ \begin{split} {Excess}\ {Kurtosis} =\;& \frac{n(n+1)}{(n-1)(n-2)(n-3)}\sum\limits_{i=1}^n \left( \frac{x_i - \bar{x}}{\sigma} \right)^4 \\ &- \frac{3(n-1)^2}{(n-2)(n-3)}. \end{split}$
(8) -
Sample skewness: Describes the degree of left-right asymmetry of the data distribution:
$ {Skewness} = \frac{n}{(n-1)(n-2)}\sum\limits_{i=1}^n \left( \frac{x_i - \bar{x}}{\sigma} \right)^3. $
(7) Sample excess kurtosis: Measures the steepness or flatness of the distribution, adjusted by subtracting the benchmark value 3 of the normal distribution:
$ \begin{split} {Excess}\ {Kurtosis} =\;& \frac{n(n+1)}{(n-1)(n-2)(n-3)}\sum\limits_{i=1}^n \left( \frac{x_i - \bar{x}}{\sigma} \right)^4 \\ &- \frac{3(n-1)^2}{(n-2)(n-3)}. \end{split}$
(8) -
Shannon entropy (H): Quantifies the degree of disorder of the data distribution using the discrete form applicable to the study:
$ H = -\sum\limits_{i} p_i \ln p_i, $
(9) where
$ p_i $ is the probability of each data interval.Coefficient of variation (CV): A dimensionless indicator describing data dispersion, eliminating the influence of dimensions:
$ {CV} = \frac{\sigma}{\bar{x}}. $
(10) -
Shannon entropy (H): Quantifies the degree of disorder of the data distribution using the discrete form applicable to the study:
$ H = -\sum\limits_{i} p_i \ln p_i, $
(9) where
$ p_i $ is the probability of each data interval.Coefficient of variation (CV): A dimensionless indicator describing data dispersion, eliminating the influence of dimensions:
$ {CV} = \frac{\sigma}{\bar{x}}. $
(10) -
Shannon entropy (H): Quantifies the degree of disorder of the data distribution using the discrete form applicable to the study:
$ H = -\sum\limits_{i} p_i \ln p_i, $
(9) where
$ p_i $ is the probability of each data interval.Coefficient of variation (CV): A dimensionless indicator describing data dispersion, eliminating the influence of dimensions:
$ {CV} = \frac{\sigma}{\bar{x}}. $
(10) -
Shannon entropy (H): Quantifies the degree of disorder of the data distribution using the discrete form applicable to the study:
$ H = -\sum\limits_{i} p_i \ln p_i, $
(9) where
$ p_i $ is the probability of each data interval.Coefficient of variation (CV): A dimensionless indicator describing data dispersion, eliminating the influence of dimensions:
$ {CV} = \frac{\sigma}{\bar{x}}. $
(10) -
Upper tail ratio: The proportion of samples greater than the 90th percentile
$ Q_{0.90} $ :$ {Upper\, Tail\,\, Ratio} = \frac{{Number\,\, of\,\, samples } \gt Q_{0.90}}{{Total\,\, sample\,\, number}}. $
(11) Lower tail ratio: The proportion of samples less than the 10th percentile
$ Q_{0.10} $ :$ {Lower\,\, Tail\,\, Ratio} = \frac{{Number\,\,of \,\,samples } \lt Q_{0.10}}{{Total\,\, sample\,\, number}}. $
(12) In the aforementioned equations, n denotes the total number of residual nuclei samples,
$ x_i $ represents each individual sample value of the residual nuclear physical parameters,$ \bar{x} $ is the arithmetic mean of the dataset, and σ is the sample standard deviation. All 19 statistical features, combined with the global input variables, constitute the 123-dimensional input of the BNN model.This study used fission cross-section datasets of typical actinide nuclides for neutron-induced and proton-induced fission reactions. As summarized in Table 1, the total dataset included 3121 samples, comprising 2100
$ (n,f) $ samples and 1021$ (p,f) $ samples. The$ (n,f) $ data combined experimental cross-section values fitted by the BNN model in previous studies and evaluated data from the JENDL-5 database, covering an energy range of 20−978 MeV. The$ (p,f) $ data originated from EXFOR experimental measurements and JENDL-5 evaluated data, spanning 20 MeV–1 GeV.Dataset partition Data source Reaction channel Target nuclides Energy range Data points Total dataset Fitted experimental data
and JENDL-5$ (n,f) $ 230,232Th; 233,234,235,236,238U; 237Np; 238,239,240,241,242,247Pu;
241,242,243Am20−978 MeV 2100 EXFOR and JENDL-5 $ (p,f) $ 232Th; 235,238U; 237Np; 238,239,240,241,242Pu; 241,242Am 20 MeV–1 GeV 1021 Validation set EXFOR $ (n,f) $ 242Pu; 234U 200−955 MeV 34 $ (p,f) $ 239Pu; 234U 20 MeV–1 GeV 50 Table 1. Summary of the fission cross-section dataset used in this work.
All samples were randomly divided into a training set and an internal test set at a ratio of 9:1 for model training and basic evaluation. An independent validation set was further established to evaluate the model's extrapolation and generalization performance. This validation set consisted of 34
$ (n,f) $ samples for 242Pu and 234U at 200−955 MeV, and 50$ (p,f) $ samples for 239Pu and 234U at 20 MeV–1 GeV. All validation data were excluded from model training. Notably, the INCL model served solely to generate microscopic residual nucleus properties as input features for the BNN model and did not produce any fission cross-section labels used for model training and validation.In this study, two Bayesian convolutional neural network architectures are established, namely the one-dimensional (BCNN1D) and two-dimensional (BCNN2D) structures. Both models reduce the 114-dimensional high-dimensional statistical features to six robust low-dimensional refined features while fully preserving the nine-dimensional original global physical features without any alteration. The total loss function is defined as follows:
$ \begin{aligned} {\cal{L}}_{{\rm{total}}}(\theta) &= \underbrace{-\mathbb{E}_{q_\theta({\bf{w}})}\bigl[\log p({\cal{D}} \mid {\boldsymbol{w}})\bigr] + \beta\,{\rm{KL}}\bigl(q_\theta({\boldsymbol{w}}) \,\|\, p({\boldsymbol{w}})\bigr)}_{\text{Negative ELBO (variational loss)}}, \end{aligned} $
(13) In this equation, θ denotes the learnable variational parameters of the Bayesian neural network,
$ {\boldsymbol{w}} $ represents the stochastic network weights,$ q_\theta({\boldsymbol{w}}) $ is the variational posterior distribution of the weights, and$ p({\boldsymbol{w}}) $ is the predefined prior distribution of the weights;$ {\cal{D}} $ refers to the training dataset. The expectation operator$ \mathbb{E}_{q_\theta({\bf{w}})}[\cdot] $ corresponds to the expectation over the variational posterior of the network weights. The Kullback-Leibler (KL) divergence$ {\rm{KL}}(\cdot\|\cdot) $ quantifies the discrepancy between the posterior and prior distributions of the weights, and β is a trade-off coefficient adjusting the weight of the KL divergence term in the total loss.BCNN1D and BCNN2D both adopt the variational inference framework for Bayesian probabilistic regression. Both models consider a 123-dimensional reaction feature vector as input and split the raw features into two fixed components: 9-dimensional physical features and 114-dimensional statistical features. A lightweight feature attention block constructed with standard linear layers is embedded in both architectures to perform feature weighting. The Gaussian Error Linear Unit (GELU) is adopted as the nonlinear activation function throughout the networks, which is defined as
$ {\rm{GELU}}(x) = x\Phi(x) $ , where$ \Phi(x) $ represents the cumulative distribution function of the standard normal distribution.For BCNN1D, the 114-dimensional statistical features are reshaped and input to a Bayesian 1D convolution module. This module consists of two stacked BayesianConv1d layers with output channels of 4 and 1, respectively. Both convolutional layers adopt a kernel size of 3 and a stride of 2, and are followed by GELU activation functions. The extracted sequential features are flattened into 29 dimensions and further compressed to 6 dimensions through a Bayesian linear layer. The compressed 6-dimensional statistical representation is concatenated with the 9-dimensional physical features to form a 15-dimensional fused feature vector. Subsequently, the fused vector is processed by the Feature Attention block, which adopts two linear layers with a dimension transformation of
$ 15 \to 16 \to 15 $ , paired with ReLU and Sigmoid activation functions to generate feature weights. The weighted 15-dimensional features are finally fed into a Bayesian MLP header with the dimension mapping of$ 15 \to 128 \to 64 \to 1 $ , where GELU activation is deployed between adjacent Bayesian linear layers for regression prediction.BCNN2D adopts a Bayesian two-dimensional convolutional paradigm. The 114-dimensional statistical features are zero-padded to 120 dimensions and rearranged into a
$ 10 \times 12 $ 2D feature map. Two BayesianConv2d layers with$ 3 \times 3 $ kernels are utilized, with output channels set to 4 and 1. The first convolutional layer uses a stride of 2 for downsampling, while the second layer adopts a stride of 1; GELU activation is applied after each convolution operation. The processed feature map is flattened into 30 dimensions and projected into a 6-dimensional compact feature representation via a Bayesian linear layer. After concatenation with the 9-dimensional physical features, the combined 15-dimensional features are processed using the identical Feature Attention module. The weighted features are then transmitted to the same Bayesian MLP header with a$ 15 \to 128 \to 64 \to 1 $ dimension configuration to produce the final regression output. All models are optimized by the Adam with Weight Decay (AdamW) optimizer. Detailed hyperparameter settings are presented in Table 2, where N denotes the number of training samples. Based on the model performance metrics listed in the table, the BCNN2D model presents the optimal overall performance under identical hyperparameter conditions. The superior performance of BCNN2D likely arises from its 2D convolution, which captures cross-dimensional correlations in the structured$ 10 \times 12 $ residual nucleus data. These data are inaccessible to BCNN1D while processing the 114-dimensional sequence. Accordingly, the BCNN2D model is finally adopted in this study. Hereafter, the notation INCL-BNN is used to represent the coupling framework of INCL and BCNN2D.Model KL Weight (β) Learning Rate Train Epoch Train MSE Test MSE Train $ R^2 $ Test $ R^2 $ Train MAE/mb Test MAE/mb BCNN1D $ \dfrac{0.2}{N} $ $ 3 \times 10^{-3} $ $ 1 \times 10^{4} $ 0.005436 0.006578 0.9923 0.9908 20.16 20.82 BCNN2D $ \dfrac{0.2}{N} $ $ 3 \times 10^{-3} $ $ 1 \times 10^{4} $ 0.004213 0.005005 0.9940 0.9930 18.14 19.10 Table 2. Model Configurations and Performance Metrics.
To quantitatively evaluate the physical contribution of each residual nucleus feature output from the INCL intranuclear cascade model, ablation experiments are performed. The results are summarized in Table 3. These experiments clearly verify the indispensable role of the microscopic physical information embedded via INCL simulations, and reveal pronounced hierarchical importance among different residual nucleus feature groups for fission cross-section prediction. When all input features provided by INCL are fully excluded, the test mean absolute error (MAE) rises sharply from 19.10 to 27.28 mb, and the test coefficient of determination
$ R^2 $ drops from 0.9930 to 0.9876. This result indicates that a model built only with basic nuclide parameters suffers from substantial degradation in prediction accuracy and generalization performance in the absence of such physical constraints.Excluded input features Train MSE Test MSE Train $ R^2 $ Test $ R^2 $ Train MAE/mb Test MAE/mb Test MAE increment/mb None 0.004213 0.005005 0.9940 0.9930 18.14 19.10 0.00 All input features provided by INCL 0.006304 0.008852 0.9911 0.9876 23.53 27.28 8.18 Residual nucleus excitation energy 0.005259 0.008540 0.9926 0.9880 22.27 26.27 7.17 Residual nucleus fissility 0.006044 0.009094 0.9914 0.9872 23.01 27.27 8.17 Residual nucleus angular momentum 0.005398 0.010528 0.9924 0.9852 22.89 28.01 8.91 Residual nucleus neutron excess 0.004441 0.005057 0.9937 0.9929 20.10 21.64 2.54 Residual nucleus mass number 0.003927 0.004874 0.9944 0.9932 17.27 20.06 0.96 Residual nucleus charge number 0.003609 0.004475 0.9949 0.9937 17.64 20.31 1.21 Table 3. Ablation experiment results of the proposed INCL-BNN fission cross-section model.
Among all feature groups, the angular momentum of the residual nucleus exerts the most prominent influence. Its removal leads to the maximum test MAE increment of 8.91 mb and the lowest test
$ R^2 $ of 0.9852. The fissility and excitation energy of the residual nucleus rank as the second most important features, and their removal increases the test MAE by 8.17 mb and 7.17 mb, respectively. Within the Bohr-Wheeler statistical fission framework, the fission width is determined by the level density ratio between the saddle-point configuration and ground state, and the Fermi-gas level density exhibits an exponential dependence on the excitation energy. Meanwhile, angular momentum modulates the effective fission barrier, and both excitation energy and angular momentum jointly govern the fission width. These three input features, namely the excitation energy, angular momentum and fissility parameter of the residual nucleus, can significantly improve the prediction performance of the model. The residual neutron excess imposes a moderate effect, with its exclusion only increasing the test MAE by 2.54 mb, which indicates that the neutron excess contributes significantly less to fission cross-sections than the angular momentum and excitation energy. By contrast, the mass number and charge number of the residual nucleus have negligible impact on the prediction results. Their removal only raises the test MAE by 0.96 mb and 1.21 mb, respectively, causing a slight decline in model generalization capability. This phenomenon demonstrates that the major improvement in the model prediction performance stems from the angular momentum, excitation energy, and fissility parameter of excited residual nuclei, rather than simple statistical quantities of mass and charge distributions. -
Upper tail ratio: The proportion of samples greater than the 90th percentile
$ Q_{0.90} $ :$ {Upper\, Tail\,\, Ratio} = \frac{{Number\,\, of\,\, samples } \gt Q_{0.90}}{{Total\,\, sample\,\, number}}. $
(11) Lower tail ratio: The proportion of samples less than the 10th percentile
$ Q_{0.10} $ :$ {Lower\,\, Tail\,\, Ratio} = \frac{{Number\,\,of \,\,samples } \lt Q_{0.10}}{{Total\,\, sample\,\, number}}. $
(12) In the aforementioned equations, n denotes the total number of residual nuclei samples,
$ x_i $ represents each individual sample value of the residual nuclear physical parameters,$ \bar{x} $ is the arithmetic mean of the dataset, and σ is the sample standard deviation. All 19 statistical features, combined with the global input variables, constitute the 123-dimensional input of the BNN model.This study used fission cross-section datasets of typical actinide nuclides for neutron-induced and proton-induced fission reactions. As summarized in Table 1, the total dataset included 3121 samples, comprising 2100
$ (n,f) $ samples and 1021$ (p,f) $ samples. The$ (n,f) $ data combined experimental cross-section values fitted by the BNN model in previous studies and evaluated data from the JENDL-5 database, covering an energy range of 20−978 MeV. The$ (p,f) $ data originated from EXFOR experimental measurements and JENDL-5 evaluated data, spanning 20 MeV–1 GeV.Dataset partition Data source Reaction channel Target nuclides Energy range Data points Total dataset Fitted experimental data
and JENDL-5$ (n,f) $ 230,232Th; 233,234,235,236,238U; 237Np; 238,239,240,241,242,247Pu;
241,242,243Am20−978 MeV 2100 EXFOR and JENDL-5 $ (p,f) $ 232Th; 235,238U; 237Np; 238,239,240,241,242Pu; 241,242Am 20 MeV–1 GeV 1021 Validation set EXFOR $ (n,f) $ 242Pu; 234U 200−955 MeV 34 $ (p,f) $ 239Pu; 234U 20 MeV–1 GeV 50 Table 1. Summary of the fission cross-section dataset used in this work.
All samples were randomly divided into a training set and an internal test set at a ratio of 9:1 for model training and basic evaluation. An independent validation set was further established to evaluate the model's extrapolation and generalization performance. This validation set consisted of 34
$ (n,f) $ samples for 242Pu and 234U at 200−955 MeV, and 50$ (p,f) $ samples for 239Pu and 234U at 20 MeV–1 GeV. All validation data were excluded from model training. Notably, the INCL model served solely to generate microscopic residual nucleus properties as input features for the BNN model and did not produce any fission cross-section labels used for model training and validation.In this study, two Bayesian convolutional neural network architectures are established, namely the one-dimensional (BCNN1D) and two-dimensional (BCNN2D) structures. Both models reduce the 114-dimensional high-dimensional statistical features to six robust low-dimensional refined features while fully preserving the nine-dimensional original global physical features without any alteration. The total loss function is defined as follows:
$ \begin{aligned} {\cal{L}}_{{\rm{total}}}(\theta) &= \underbrace{-\mathbb{E}_{q_\theta({\bf{w}})}\bigl[\log p({\cal{D}} \mid {\boldsymbol{w}})\bigr] + \beta\,{\rm{KL}}\bigl(q_\theta({\boldsymbol{w}}) \,\|\, p({\boldsymbol{w}})\bigr)}_{\text{Negative ELBO (variational loss)}}, \end{aligned} $
(13) In this equation, θ denotes the learnable variational parameters of the Bayesian neural network,
$ {\boldsymbol{w}} $ represents the stochastic network weights,$ q_\theta({\boldsymbol{w}}) $ is the variational posterior distribution of the weights, and$ p({\boldsymbol{w}}) $ is the predefined prior distribution of the weights;$ {\cal{D}} $ refers to the training dataset. The expectation operator$ \mathbb{E}_{q_\theta({\bf{w}})}[\cdot] $ corresponds to the expectation over the variational posterior of the network weights. The Kullback-Leibler (KL) divergence$ {\rm{KL}}(\cdot\|\cdot) $ quantifies the discrepancy between the posterior and prior distributions of the weights, and β is a trade-off coefficient adjusting the weight of the KL divergence term in the total loss.BCNN1D and BCNN2D both adopt the variational inference framework for Bayesian probabilistic regression. Both models consider a 123-dimensional reaction feature vector as input and split the raw features into two fixed components: 9-dimensional physical features and 114-dimensional statistical features. A lightweight feature attention block constructed with standard linear layers is embedded in both architectures to perform feature weighting. The Gaussian Error Linear Unit (GELU) is adopted as the nonlinear activation function throughout the networks, which is defined as
$ {\rm{GELU}}(x) = x\Phi(x) $ , where$ \Phi(x) $ represents the cumulative distribution function of the standard normal distribution.For BCNN1D, the 114-dimensional statistical features are reshaped and input to a Bayesian 1D convolution module. This module consists of two stacked BayesianConv1d layers with output channels of 4 and 1, respectively. Both convolutional layers adopt a kernel size of 3 and a stride of 2, and are followed by GELU activation functions. The extracted sequential features are flattened into 29 dimensions and further compressed to 6 dimensions through a Bayesian linear layer. The compressed 6-dimensional statistical representation is concatenated with the 9-dimensional physical features to form a 15-dimensional fused feature vector. Subsequently, the fused vector is processed by the Feature Attention block, which adopts two linear layers with a dimension transformation of
$ 15 \to 16 \to 15 $ , paired with ReLU and Sigmoid activation functions to generate feature weights. The weighted 15-dimensional features are finally fed into a Bayesian MLP header with the dimension mapping of$ 15 \to 128 \to 64 \to 1 $ , where GELU activation is deployed between adjacent Bayesian linear layers for regression prediction.BCNN2D adopts a Bayesian two-dimensional convolutional paradigm. The 114-dimensional statistical features are zero-padded to 120 dimensions and rearranged into a
$ 10 \times 12 $ 2D feature map. Two BayesianConv2d layers with$ 3 \times 3 $ kernels are utilized, with output channels set to 4 and 1. The first convolutional layer uses a stride of 2 for downsampling, while the second layer adopts a stride of 1; GELU activation is applied after each convolution operation. The processed feature map is flattened into 30 dimensions and projected into a 6-dimensional compact feature representation via a Bayesian linear layer. After concatenation with the 9-dimensional physical features, the combined 15-dimensional features are processed using the identical Feature Attention module. The weighted features are then transmitted to the same Bayesian MLP header with a$ 15 \to 128 \to 64 \to 1 $ dimension configuration to produce the final regression output. All models are optimized by the Adam with Weight Decay (AdamW) optimizer. Detailed hyperparameter settings are presented in Table 2, where N denotes the number of training samples. Based on the model performance metrics listed in the table, the BCNN2D model presents the optimal overall performance under identical hyperparameter conditions. The superior performance of BCNN2D likely arises from its 2D convolution, which captures cross-dimensional correlations in the structured$ 10 \times 12 $ residual nucleus data. These data are inaccessible to BCNN1D while processing the 114-dimensional sequence. Accordingly, the BCNN2D model is finally adopted in this study. Hereafter, the notation INCL-BNN is used to represent the coupling framework of INCL and BCNN2D.Model KL Weight (β) Learning Rate Train Epoch Train MSE Test MSE Train $ R^2 $ Test $ R^2 $ Train MAE/mb Test MAE/mb BCNN1D $ \dfrac{0.2}{N} $ $ 3 \times 10^{-3} $ $ 1 \times 10^{4} $ 0.005436 0.006578 0.9923 0.9908 20.16 20.82 BCNN2D $ \dfrac{0.2}{N} $ $ 3 \times 10^{-3} $ $ 1 \times 10^{4} $ 0.004213 0.005005 0.9940 0.9930 18.14 19.10 Table 2. Model Configurations and Performance Metrics.
To quantitatively evaluate the physical contribution of each residual nucleus feature output from the INCL intranuclear cascade model, ablation experiments are performed. The results are summarized in Table 3. These experiments clearly verify the indispensable role of the microscopic physical information embedded via INCL simulations, and reveal pronounced hierarchical importance among different residual nucleus feature groups for fission cross-section prediction. When all input features provided by INCL are fully excluded, the test mean absolute error (MAE) rises sharply from 19.10 to 27.28 mb, and the test coefficient of determination
$ R^2 $ drops from 0.9930 to 0.9876. This result indicates that a model built only with basic nuclide parameters suffers from substantial degradation in prediction accuracy and generalization performance in the absence of such physical constraints.Excluded input features Train MSE Test MSE Train $ R^2 $ Test $ R^2 $ Train MAE/mb Test MAE/mb Test MAE increment/mb None 0.004213 0.005005 0.9940 0.9930 18.14 19.10 0.00 All input features provided by INCL 0.006304 0.008852 0.9911 0.9876 23.53 27.28 8.18 Residual nucleus excitation energy 0.005259 0.008540 0.9926 0.9880 22.27 26.27 7.17 Residual nucleus fissility 0.006044 0.009094 0.9914 0.9872 23.01 27.27 8.17 Residual nucleus angular momentum 0.005398 0.010528 0.9924 0.9852 22.89 28.01 8.91 Residual nucleus neutron excess 0.004441 0.005057 0.9937 0.9929 20.10 21.64 2.54 Residual nucleus mass number 0.003927 0.004874 0.9944 0.9932 17.27 20.06 0.96 Residual nucleus charge number 0.003609 0.004475 0.9949 0.9937 17.64 20.31 1.21 Table 3. Ablation experiment results of the proposed INCL-BNN fission cross-section model.
Among all feature groups, the angular momentum of the residual nucleus exerts the most prominent influence. Its removal leads to the maximum test MAE increment of 8.91 mb and the lowest test
$ R^2 $ of 0.9852. The fissility and excitation energy of the residual nucleus rank as the second most important features, and their removal increases the test MAE by 8.17 mb and 7.17 mb, respectively. Within the Bohr-Wheeler statistical fission framework, the fission width is determined by the level density ratio between the saddle-point configuration and ground state, and the Fermi-gas level density exhibits an exponential dependence on the excitation energy. Meanwhile, angular momentum modulates the effective fission barrier, and both excitation energy and angular momentum jointly govern the fission width. These three input features, namely the excitation energy, angular momentum and fissility parameter of the residual nucleus, can significantly improve the prediction performance of the model. The residual neutron excess imposes a moderate effect, with its exclusion only increasing the test MAE by 2.54 mb, which indicates that the neutron excess contributes significantly less to fission cross-sections than the angular momentum and excitation energy. By contrast, the mass number and charge number of the residual nucleus have negligible impact on the prediction results. Their removal only raises the test MAE by 0.96 mb and 1.21 mb, respectively, causing a slight decline in model generalization capability. This phenomenon demonstrates that the major improvement in the model prediction performance stems from the angular momentum, excitation energy, and fissility parameter of excited residual nuclei, rather than simple statistical quantities of mass and charge distributions. -
Upper tail ratio: The proportion of samples greater than the 90th percentile
$ Q_{0.90} $ :$ {Upper\, Tail\,\, Ratio} = \frac{{Number\,\, of\,\, samples } \gt Q_{0.90}}{{Total\,\, sample\,\, number}}. $
(11) Lower tail ratio: The proportion of samples less than the 10th percentile
$ Q_{0.10} $ :$ {Lower\,\, Tail\,\, Ratio} = \frac{{Number\,\,of \,\,samples } \lt Q_{0.10}}{{Total\,\, sample\,\, number}}. $
(12) In the aforementioned equations, n denotes the total number of residual nuclei samples,
$ x_i $ represents each individual sample value of the residual nuclear physical parameters,$ \bar{x} $ is the arithmetic mean of the dataset, and σ is the sample standard deviation. All 19 statistical features, combined with the global input variables, constitute the 123-dimensional input of the BNN model.This study used fission cross-section datasets of typical actinide nuclides for neutron-induced and proton-induced fission reactions. As summarized in Table 1, the total dataset included 3121 samples, comprising 2100
$ (n,f) $ samples and 1021$ (p,f) $ samples. The$ (n,f) $ data combined experimental cross-section values fitted by the BNN model in previous studies and evaluated data from the JENDL-5 database, covering an energy range of 20−978 MeV. The$ (p,f) $ data originated from EXFOR experimental measurements and JENDL-5 evaluated data, spanning 20 MeV–1 GeV.Dataset partition Data source Reaction channel Target nuclides Energy range Data points Total dataset Fitted experimental data
and JENDL-5$ (n,f) $ 230,232Th; 233,234,235,236,238U; 237Np; 238,239,240,241,242,247Pu;
241,242,243Am20−978 MeV 2100 EXFOR and JENDL-5 $ (p,f) $ 232Th; 235,238U; 237Np; 238,239,240,241,242Pu; 241,242Am 20 MeV–1 GeV 1021 Validation set EXFOR $ (n,f) $ 242Pu; 234U 200−955 MeV 34 $ (p,f) $ 239Pu; 234U 20 MeV–1 GeV 50 Table 1. Summary of the fission cross-section dataset used in this work.
All samples were randomly divided into a training set and an internal test set at a ratio of 9:1 for model training and basic evaluation. An independent validation set was further established to evaluate the model's extrapolation and generalization performance. This validation set consisted of 34
$ (n,f) $ samples for 242Pu and 234U at 200−955 MeV, and 50$ (p,f) $ samples for 239Pu and 234U at 20 MeV–1 GeV. All validation data were excluded from model training. Notably, the INCL model served solely to generate microscopic residual nucleus properties as input features for the BNN model and did not produce any fission cross-section labels used for model training and validation.In this study, two Bayesian convolutional neural network architectures are established, namely the one-dimensional (BCNN1D) and two-dimensional (BCNN2D) structures. Both models reduce the 114-dimensional high-dimensional statistical features to six robust low-dimensional refined features while fully preserving the nine-dimensional original global physical features without any alteration. The total loss function is defined as follows:
$ \begin{aligned} {\cal{L}}_{{\rm{total}}}(\theta) &= \underbrace{-\mathbb{E}_{q_\theta({\bf{w}})}\bigl[\log p({\cal{D}} \mid {\boldsymbol{w}})\bigr] + \beta\,{\rm{KL}}\bigl(q_\theta({\boldsymbol{w}}) \,\|\, p({\boldsymbol{w}})\bigr)}_{\text{Negative ELBO (variational loss)}}, \end{aligned} $
(13) In this equation, θ denotes the learnable variational parameters of the Bayesian neural network,
$ {\boldsymbol{w}} $ represents the stochastic network weights,$ q_\theta({\boldsymbol{w}}) $ is the variational posterior distribution of the weights, and$ p({\boldsymbol{w}}) $ is the predefined prior distribution of the weights;$ {\cal{D}} $ refers to the training dataset. The expectation operator$ \mathbb{E}_{q_\theta({\bf{w}})}[\cdot] $ corresponds to the expectation over the variational posterior of the network weights. The Kullback-Leibler (KL) divergence$ {\rm{KL}}(\cdot\|\cdot) $ quantifies the discrepancy between the posterior and prior distributions of the weights, and β is a trade-off coefficient adjusting the weight of the KL divergence term in the total loss.BCNN1D and BCNN2D both adopt the variational inference framework for Bayesian probabilistic regression. Both models consider a 123-dimensional reaction feature vector as input and split the raw features into two fixed components: 9-dimensional physical features and 114-dimensional statistical features. A lightweight feature attention block constructed with standard linear layers is embedded in both architectures to perform feature weighting. The Gaussian Error Linear Unit (GELU) is adopted as the nonlinear activation function throughout the networks, which is defined as
$ {\rm{GELU}}(x) = x\Phi(x) $ , where$ \Phi(x) $ represents the cumulative distribution function of the standard normal distribution.For BCNN1D, the 114-dimensional statistical features are reshaped and input to a Bayesian 1D convolution module. This module consists of two stacked BayesianConv1d layers with output channels of 4 and 1, respectively. Both convolutional layers adopt a kernel size of 3 and a stride of 2, and are followed by GELU activation functions. The extracted sequential features are flattened into 29 dimensions and further compressed to 6 dimensions through a Bayesian linear layer. The compressed 6-dimensional statistical representation is concatenated with the 9-dimensional physical features to form a 15-dimensional fused feature vector. Subsequently, the fused vector is processed by the Feature Attention block, which adopts two linear layers with a dimension transformation of
$ 15 \to 16 \to 15 $ , paired with ReLU and Sigmoid activation functions to generate feature weights. The weighted 15-dimensional features are finally fed into a Bayesian MLP header with the dimension mapping of$ 15 \to 128 \to 64 \to 1 $ , where GELU activation is deployed between adjacent Bayesian linear layers for regression prediction.BCNN2D adopts a Bayesian two-dimensional convolutional paradigm. The 114-dimensional statistical features are zero-padded to 120 dimensions and rearranged into a
$ 10 \times 12 $ 2D feature map. Two BayesianConv2d layers with$ 3 \times 3 $ kernels are utilized, with output channels set to 4 and 1. The first convolutional layer uses a stride of 2 for downsampling, while the second layer adopts a stride of 1; GELU activation is applied after each convolution operation. The processed feature map is flattened into 30 dimensions and projected into a 6-dimensional compact feature representation via a Bayesian linear layer. After concatenation with the 9-dimensional physical features, the combined 15-dimensional features are processed using the identical Feature Attention module. The weighted features are then transmitted to the same Bayesian MLP header with a$ 15 \to 128 \to 64 \to 1 $ dimension configuration to produce the final regression output. All models are optimized by the Adam with Weight Decay (AdamW) optimizer. Detailed hyperparameter settings are presented in Table 2, where N denotes the number of training samples. Based on the model performance metrics listed in the table, the BCNN2D model presents the optimal overall performance under identical hyperparameter conditions. The superior performance of BCNN2D likely arises from its 2D convolution, which captures cross-dimensional correlations in the structured$ 10 \times 12 $ residual nucleus data. These data are inaccessible to BCNN1D while processing the 114-dimensional sequence. Accordingly, the BCNN2D model is finally adopted in this study. Hereafter, the notation INCL-BNN is used to represent the coupling framework of INCL and BCNN2D.Model KL Weight (β) Learning Rate Train Epoch Train MSE Test MSE Train $ R^2 $ Test $ R^2 $ Train MAE/mb Test MAE/mb BCNN1D $ \dfrac{0.2}{N} $ $ 3 \times 10^{-3} $ $ 1 \times 10^{4} $ 0.005436 0.006578 0.9923 0.9908 20.16 20.82 BCNN2D $ \dfrac{0.2}{N} $ $ 3 \times 10^{-3} $ $ 1 \times 10^{4} $ 0.004213 0.005005 0.9940 0.9930 18.14 19.10 Table 2. Model Configurations and Performance Metrics.
To quantitatively evaluate the physical contribution of each residual nucleus feature output from the INCL intranuclear cascade model, ablation experiments are performed. The results are summarized in Table 3. These experiments clearly verify the indispensable role of the microscopic physical information embedded via INCL simulations, and reveal pronounced hierarchical importance among different residual nucleus feature groups for fission cross-section prediction. When all input features provided by INCL are fully excluded, the test mean absolute error (MAE) rises sharply from 19.10 to 27.28 mb, and the test coefficient of determination
$ R^2 $ drops from 0.9930 to 0.9876. This result indicates that a model built only with basic nuclide parameters suffers from substantial degradation in prediction accuracy and generalization performance in the absence of such physical constraints.Excluded input features Train MSE Test MSE Train $ R^2 $ Test $ R^2 $ Train MAE/mb Test MAE/mb Test MAE increment/mb None 0.004213 0.005005 0.9940 0.9930 18.14 19.10 0.00 All input features provided by INCL 0.006304 0.008852 0.9911 0.9876 23.53 27.28 8.18 Residual nucleus excitation energy 0.005259 0.008540 0.9926 0.9880 22.27 26.27 7.17 Residual nucleus fissility 0.006044 0.009094 0.9914 0.9872 23.01 27.27 8.17 Residual nucleus angular momentum 0.005398 0.010528 0.9924 0.9852 22.89 28.01 8.91 Residual nucleus neutron excess 0.004441 0.005057 0.9937 0.9929 20.10 21.64 2.54 Residual nucleus mass number 0.003927 0.004874 0.9944 0.9932 17.27 20.06 0.96 Residual nucleus charge number 0.003609 0.004475 0.9949 0.9937 17.64 20.31 1.21 Table 3. Ablation experiment results of the proposed INCL-BNN fission cross-section model.
Among all feature groups, the angular momentum of the residual nucleus exerts the most prominent influence. Its removal leads to the maximum test MAE increment of 8.91 mb and the lowest test
$ R^2 $ of 0.9852. The fissility and excitation energy of the residual nucleus rank as the second most important features, and their removal increases the test MAE by 8.17 mb and 7.17 mb, respectively. Within the Bohr-Wheeler statistical fission framework, the fission width is determined by the level density ratio between the saddle-point configuration and ground state, and the Fermi-gas level density exhibits an exponential dependence on the excitation energy. Meanwhile, angular momentum modulates the effective fission barrier, and both excitation energy and angular momentum jointly govern the fission width. These three input features, namely the excitation energy, angular momentum and fissility parameter of the residual nucleus, can significantly improve the prediction performance of the model. The residual neutron excess imposes a moderate effect, with its exclusion only increasing the test MAE by 2.54 mb, which indicates that the neutron excess contributes significantly less to fission cross-sections than the angular momentum and excitation energy. By contrast, the mass number and charge number of the residual nucleus have negligible impact on the prediction results. Their removal only raises the test MAE by 0.96 mb and 1.21 mb, respectively, causing a slight decline in model generalization capability. This phenomenon demonstrates that the major improvement in the model prediction performance stems from the angular momentum, excitation energy, and fissility parameter of excited residual nuclei, rather than simple statistical quantities of mass and charge distributions. -
Upper tail ratio: The proportion of samples greater than the 90th percentile
$ Q_{0.90} $ :$ {Upper\, Tail\,\, Ratio} = \frac{{Number\,\, of\,\, samples } \gt Q_{0.90}}{{Total\,\, sample\,\, number}}. $
(11) Lower tail ratio: The proportion of samples less than the 10th percentile
$ Q_{0.10} $ :$ {Lower\,\, Tail\,\, Ratio} = \frac{{Number\,\,of \,\,samples } \lt Q_{0.10}}{{Total\,\, sample\,\, number}}. $
(12) In the aforementioned equations, n denotes the total number of residual nuclei samples,
$ x_i $ represents each individual sample value of the residual nuclear physical parameters,$ \bar{x} $ is the arithmetic mean of the dataset, and σ is the sample standard deviation. All 19 statistical features, combined with the global input variables, constitute the 123-dimensional input of the BNN model.This study used fission cross-section datasets of typical actinide nuclides for neutron-induced and proton-induced fission reactions. As summarized in Table 1, the total dataset included 3121 samples, comprising 2100
$ (n,f) $ samples and 1021$ (p,f) $ samples. The$ (n,f) $ data combined experimental cross-section values fitted by the BNN model in previous studies and evaluated data from the JENDL-5 database, covering an energy range of 20−978 MeV. The$ (p,f) $ data originated from EXFOR experimental measurements and JENDL-5 evaluated data, spanning 20 MeV–1 GeV.Dataset partition Data source Reaction channel Target nuclides Energy range Data points Total dataset Fitted experimental data
and JENDL-5$ (n,f) $ 230,232Th; 233,234,235,236,238U; 237Np; 238,239,240,241,242,247Pu;
241,242,243Am20−978 MeV 2100 EXFOR and JENDL-5 $ (p,f) $ 232Th; 235,238U; 237Np; 238,239,240,241,242Pu; 241,242Am 20 MeV–1 GeV 1021 Validation set EXFOR $ (n,f) $ 242Pu; 234U 200−955 MeV 34 $ (p,f) $ 239Pu; 234U 20 MeV–1 GeV 50 Table 1. Summary of the fission cross-section dataset used in this work.
All samples were randomly divided into a training set and an internal test set at a ratio of 9:1 for model training and basic evaluation. An independent validation set was further established to evaluate the model's extrapolation and generalization performance. This validation set consisted of 34
$ (n,f) $ samples for 242Pu and 234U at 200−955 MeV, and 50$ (p,f) $ samples for 239Pu and 234U at 20 MeV–1 GeV. All validation data were excluded from model training. Notably, the INCL model served solely to generate microscopic residual nucleus properties as input features for the BNN model and did not produce any fission cross-section labels used for model training and validation.In this study, two Bayesian convolutional neural network architectures are established, namely the one-dimensional (BCNN1D) and two-dimensional (BCNN2D) structures. Both models reduce the 114-dimensional high-dimensional statistical features to six robust low-dimensional refined features while fully preserving the nine-dimensional original global physical features without any alteration. The total loss function is defined as follows:
$ \begin{aligned} {\cal{L}}_{{\rm{total}}}(\theta) &= \underbrace{-\mathbb{E}_{q_\theta({\bf{w}})}\bigl[\log p({\cal{D}} \mid {\boldsymbol{w}})\bigr] + \beta\,{\rm{KL}}\bigl(q_\theta({\boldsymbol{w}}) \,\|\, p({\boldsymbol{w}})\bigr)}_{\text{Negative ELBO (variational loss)}}, \end{aligned} $
(13) In this equation, θ denotes the learnable variational parameters of the Bayesian neural network,
$ {\boldsymbol{w}} $ represents the stochastic network weights,$ q_\theta({\boldsymbol{w}}) $ is the variational posterior distribution of the weights, and$ p({\boldsymbol{w}}) $ is the predefined prior distribution of the weights;$ {\cal{D}} $ refers to the training dataset. The expectation operator$ \mathbb{E}_{q_\theta({\bf{w}})}[\cdot] $ corresponds to the expectation over the variational posterior of the network weights. The Kullback-Leibler (KL) divergence$ {\rm{KL}}(\cdot\|\cdot) $ quantifies the discrepancy between the posterior and prior distributions of the weights, and β is a trade-off coefficient adjusting the weight of the KL divergence term in the total loss.BCNN1D and BCNN2D both adopt the variational inference framework for Bayesian probabilistic regression. Both models consider a 123-dimensional reaction feature vector as input and split the raw features into two fixed components: 9-dimensional physical features and 114-dimensional statistical features. A lightweight feature attention block constructed with standard linear layers is embedded in both architectures to perform feature weighting. The Gaussian Error Linear Unit (GELU) is adopted as the nonlinear activation function throughout the networks, which is defined as
$ {\rm{GELU}}(x) = x\Phi(x) $ , where$ \Phi(x) $ represents the cumulative distribution function of the standard normal distribution.For BCNN1D, the 114-dimensional statistical features are reshaped and input to a Bayesian 1D convolution module. This module consists of two stacked BayesianConv1d layers with output channels of 4 and 1, respectively. Both convolutional layers adopt a kernel size of 3 and a stride of 2, and are followed by GELU activation functions. The extracted sequential features are flattened into 29 dimensions and further compressed to 6 dimensions through a Bayesian linear layer. The compressed 6-dimensional statistical representation is concatenated with the 9-dimensional physical features to form a 15-dimensional fused feature vector. Subsequently, the fused vector is processed by the Feature Attention block, which adopts two linear layers with a dimension transformation of
$ 15 \to 16 \to 15 $ , paired with ReLU and Sigmoid activation functions to generate feature weights. The weighted 15-dimensional features are finally fed into a Bayesian MLP header with the dimension mapping of$ 15 \to 128 \to 64 \to 1 $ , where GELU activation is deployed between adjacent Bayesian linear layers for regression prediction.BCNN2D adopts a Bayesian two-dimensional convolutional paradigm. The 114-dimensional statistical features are zero-padded to 120 dimensions and rearranged into a
$ 10 \times 12 $ 2D feature map. Two BayesianConv2d layers with$ 3 \times 3 $ kernels are utilized, with output channels set to 4 and 1. The first convolutional layer uses a stride of 2 for downsampling, while the second layer adopts a stride of 1; GELU activation is applied after each convolution operation. The processed feature map is flattened into 30 dimensions and projected into a 6-dimensional compact feature representation via a Bayesian linear layer. After concatenation with the 9-dimensional physical features, the combined 15-dimensional features are processed using the identical Feature Attention module. The weighted features are then transmitted to the same Bayesian MLP header with a$ 15 \to 128 \to 64 \to 1 $ dimension configuration to produce the final regression output. All models are optimized by the Adam with Weight Decay (AdamW) optimizer. Detailed hyperparameter settings are presented in Table 2, where N denotes the number of training samples. Based on the model performance metrics listed in the table, the BCNN2D model presents the optimal overall performance under identical hyperparameter conditions. The superior performance of BCNN2D likely arises from its 2D convolution, which captures cross-dimensional correlations in the structured$ 10 \times 12 $ residual nucleus data. These data are inaccessible to BCNN1D while processing the 114-dimensional sequence. Accordingly, the BCNN2D model is finally adopted in this study. Hereafter, the notation INCL-BNN is used to represent the coupling framework of INCL and BCNN2D.Model KL Weight (β) Learning Rate Train Epoch Train MSE Test MSE Train $ R^2 $ Test $ R^2 $ Train MAE/mb Test MAE/mb BCNN1D $ \dfrac{0.2}{N} $ $ 3 \times 10^{-3} $ $ 1 \times 10^{4} $ 0.005436 0.006578 0.9923 0.9908 20.16 20.82 BCNN2D $ \dfrac{0.2}{N} $ $ 3 \times 10^{-3} $ $ 1 \times 10^{4} $ 0.004213 0.005005 0.9940 0.9930 18.14 19.10 Table 2. Model Configurations and Performance Metrics.
To quantitatively evaluate the physical contribution of each residual nucleus feature output from the INCL intranuclear cascade model, ablation experiments are performed. The results are summarized in Table 3. These experiments clearly verify the indispensable role of the microscopic physical information embedded via INCL simulations, and reveal pronounced hierarchical importance among different residual nucleus feature groups for fission cross-section prediction. When all input features provided by INCL are fully excluded, the test mean absolute error (MAE) rises sharply from 19.10 to 27.28 mb, and the test coefficient of determination
$ R^2 $ drops from 0.9930 to 0.9876. This result indicates that a model built only with basic nuclide parameters suffers from substantial degradation in prediction accuracy and generalization performance in the absence of such physical constraints.Excluded input features Train MSE Test MSE Train $ R^2 $ Test $ R^2 $ Train MAE/mb Test MAE/mb Test MAE increment/mb None 0.004213 0.005005 0.9940 0.9930 18.14 19.10 0.00 All input features provided by INCL 0.006304 0.008852 0.9911 0.9876 23.53 27.28 8.18 Residual nucleus excitation energy 0.005259 0.008540 0.9926 0.9880 22.27 26.27 7.17 Residual nucleus fissility 0.006044 0.009094 0.9914 0.9872 23.01 27.27 8.17 Residual nucleus angular momentum 0.005398 0.010528 0.9924 0.9852 22.89 28.01 8.91 Residual nucleus neutron excess 0.004441 0.005057 0.9937 0.9929 20.10 21.64 2.54 Residual nucleus mass number 0.003927 0.004874 0.9944 0.9932 17.27 20.06 0.96 Residual nucleus charge number 0.003609 0.004475 0.9949 0.9937 17.64 20.31 1.21 Table 3. Ablation experiment results of the proposed INCL-BNN fission cross-section model.
Among all feature groups, the angular momentum of the residual nucleus exerts the most prominent influence. Its removal leads to the maximum test MAE increment of 8.91 mb and the lowest test
$ R^2 $ of 0.9852. The fissility and excitation energy of the residual nucleus rank as the second most important features, and their removal increases the test MAE by 8.17 mb and 7.17 mb, respectively. Within the Bohr-Wheeler statistical fission framework, the fission width is determined by the level density ratio between the saddle-point configuration and ground state, and the Fermi-gas level density exhibits an exponential dependence on the excitation energy. Meanwhile, angular momentum modulates the effective fission barrier, and both excitation energy and angular momentum jointly govern the fission width. These three input features, namely the excitation energy, angular momentum and fissility parameter of the residual nucleus, can significantly improve the prediction performance of the model. The residual neutron excess imposes a moderate effect, with its exclusion only increasing the test MAE by 2.54 mb, which indicates that the neutron excess contributes significantly less to fission cross-sections than the angular momentum and excitation energy. By contrast, the mass number and charge number of the residual nucleus have negligible impact on the prediction results. Their removal only raises the test MAE by 0.96 mb and 1.21 mb, respectively, causing a slight decline in model generalization capability. This phenomenon demonstrates that the major improvement in the model prediction performance stems from the angular momentum, excitation energy, and fissility parameter of excited residual nuclei, rather than simple statistical quantities of mass and charge distributions. -
The validation data and predictions of the BNN model are shown in Fig. 2. Panels (a), (b) and (c) indicate that the INCL-BNN results exhibit a good consistency with the trend of experimental data. In panel (d), the INCL-BNN calculation overestimates the experimental data at energies above 600 MeV, and such overestimation also appears in the calculations of INCL-ABLA++ and INCL-GEMINI++. In our previous studies, the calculated cross-sections can be reduced by adjusting the Fermi gas model parameter
$ \widetilde{a} $ in ABLA++ and tuning the ratio$ a_f/a_n $ in GEMINI++, where$ a_f $ refers to the level density parameter at the saddle point and$ a_n $ represents the corresponding parameter at ground-state deformation. However, further experimental measurements are still needed for in-depth verification. Meanwhile, the BNN model captures the$ (p,f) $ reaction features of$ ^{234}{\rm{U}} $ ,$ ^{235}{\rm{U}} $ ,$ ^{236}{\rm{U}} $ , and$ ^{238}{\rm{U}} $ . Near 60 MeV, the peak heights predicted by the INCL-BNN, INCL-ABLA++, and INCL-GEMINI++ models show a gently declining trend as the mass number A increases, as presented in Fig. 2 (b) and Figs. 3 (d)-(f). This consistent trend is probably correlated with the calculation of the fission barrier. From the perspective of the training dataset adopted for the BNN model alone, the prediction trend of the INCL-BNN model is reasonable and reliable.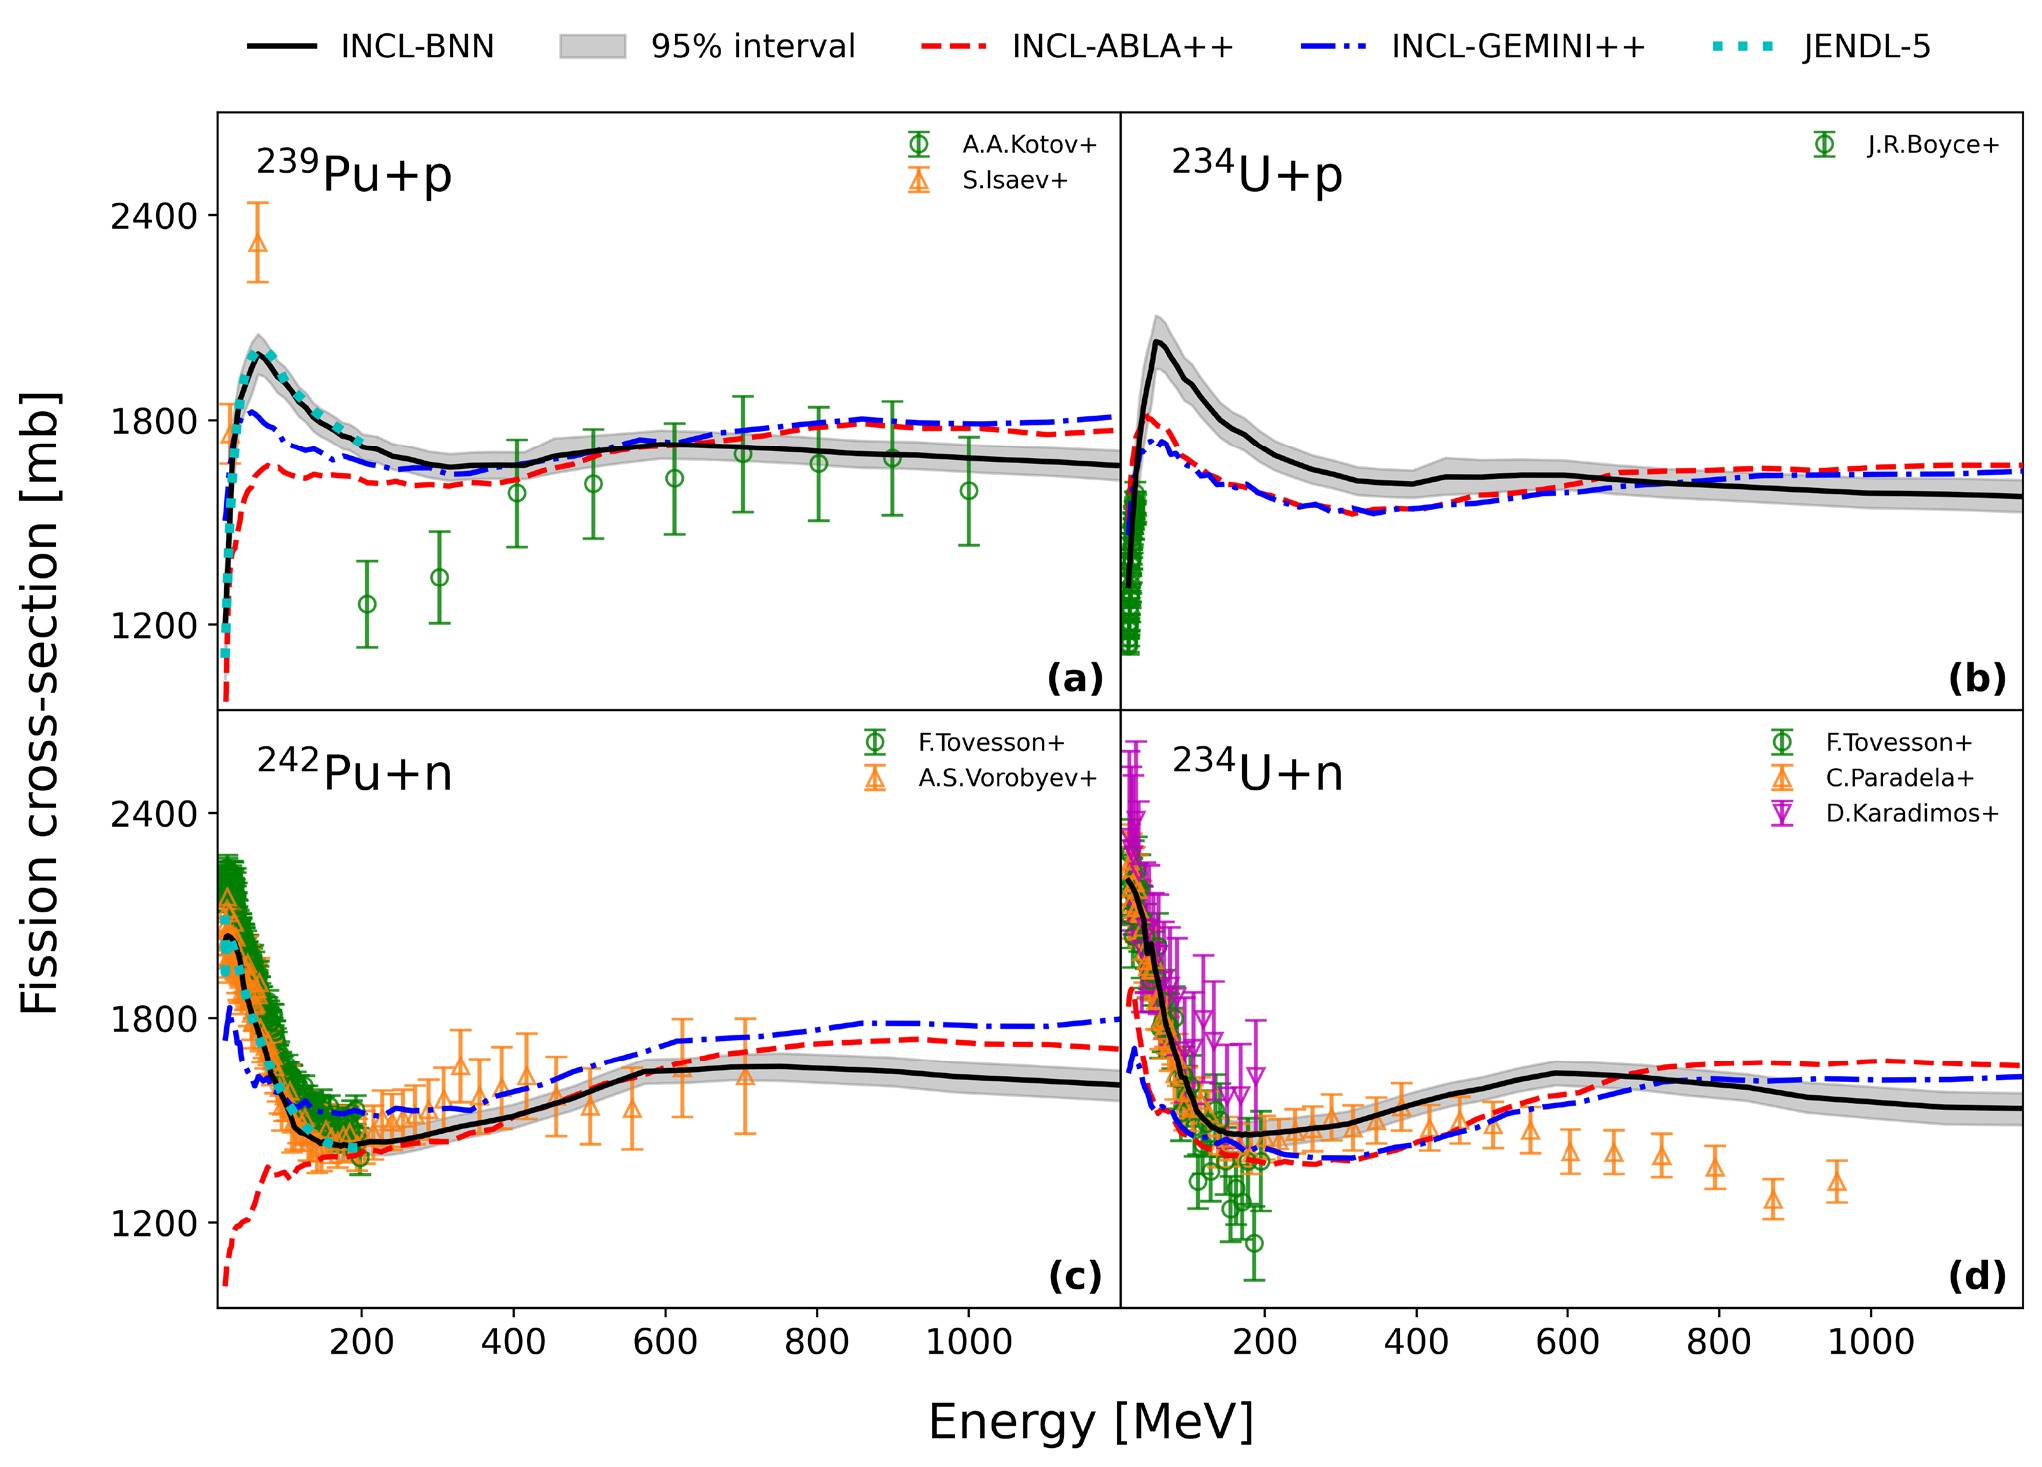
Figure 2. (color online) The INCL-BNN predictions of
$ (p,f) $ cross-sections of$ ^{239}{\rm{Pu}} $ and$ ^{234}{\rm{U}} $ , as well as (n,f) cross-sections of$ ^{242}{\rm{Pu}} $ and$ ^{234}{\rm{U}} $ in the validation dataset, are compared with the results from INCL-ABLA++, INCL-GEMINI++, and experimental measurements. All experimental data in the figure are obtained from Refs. [19−24].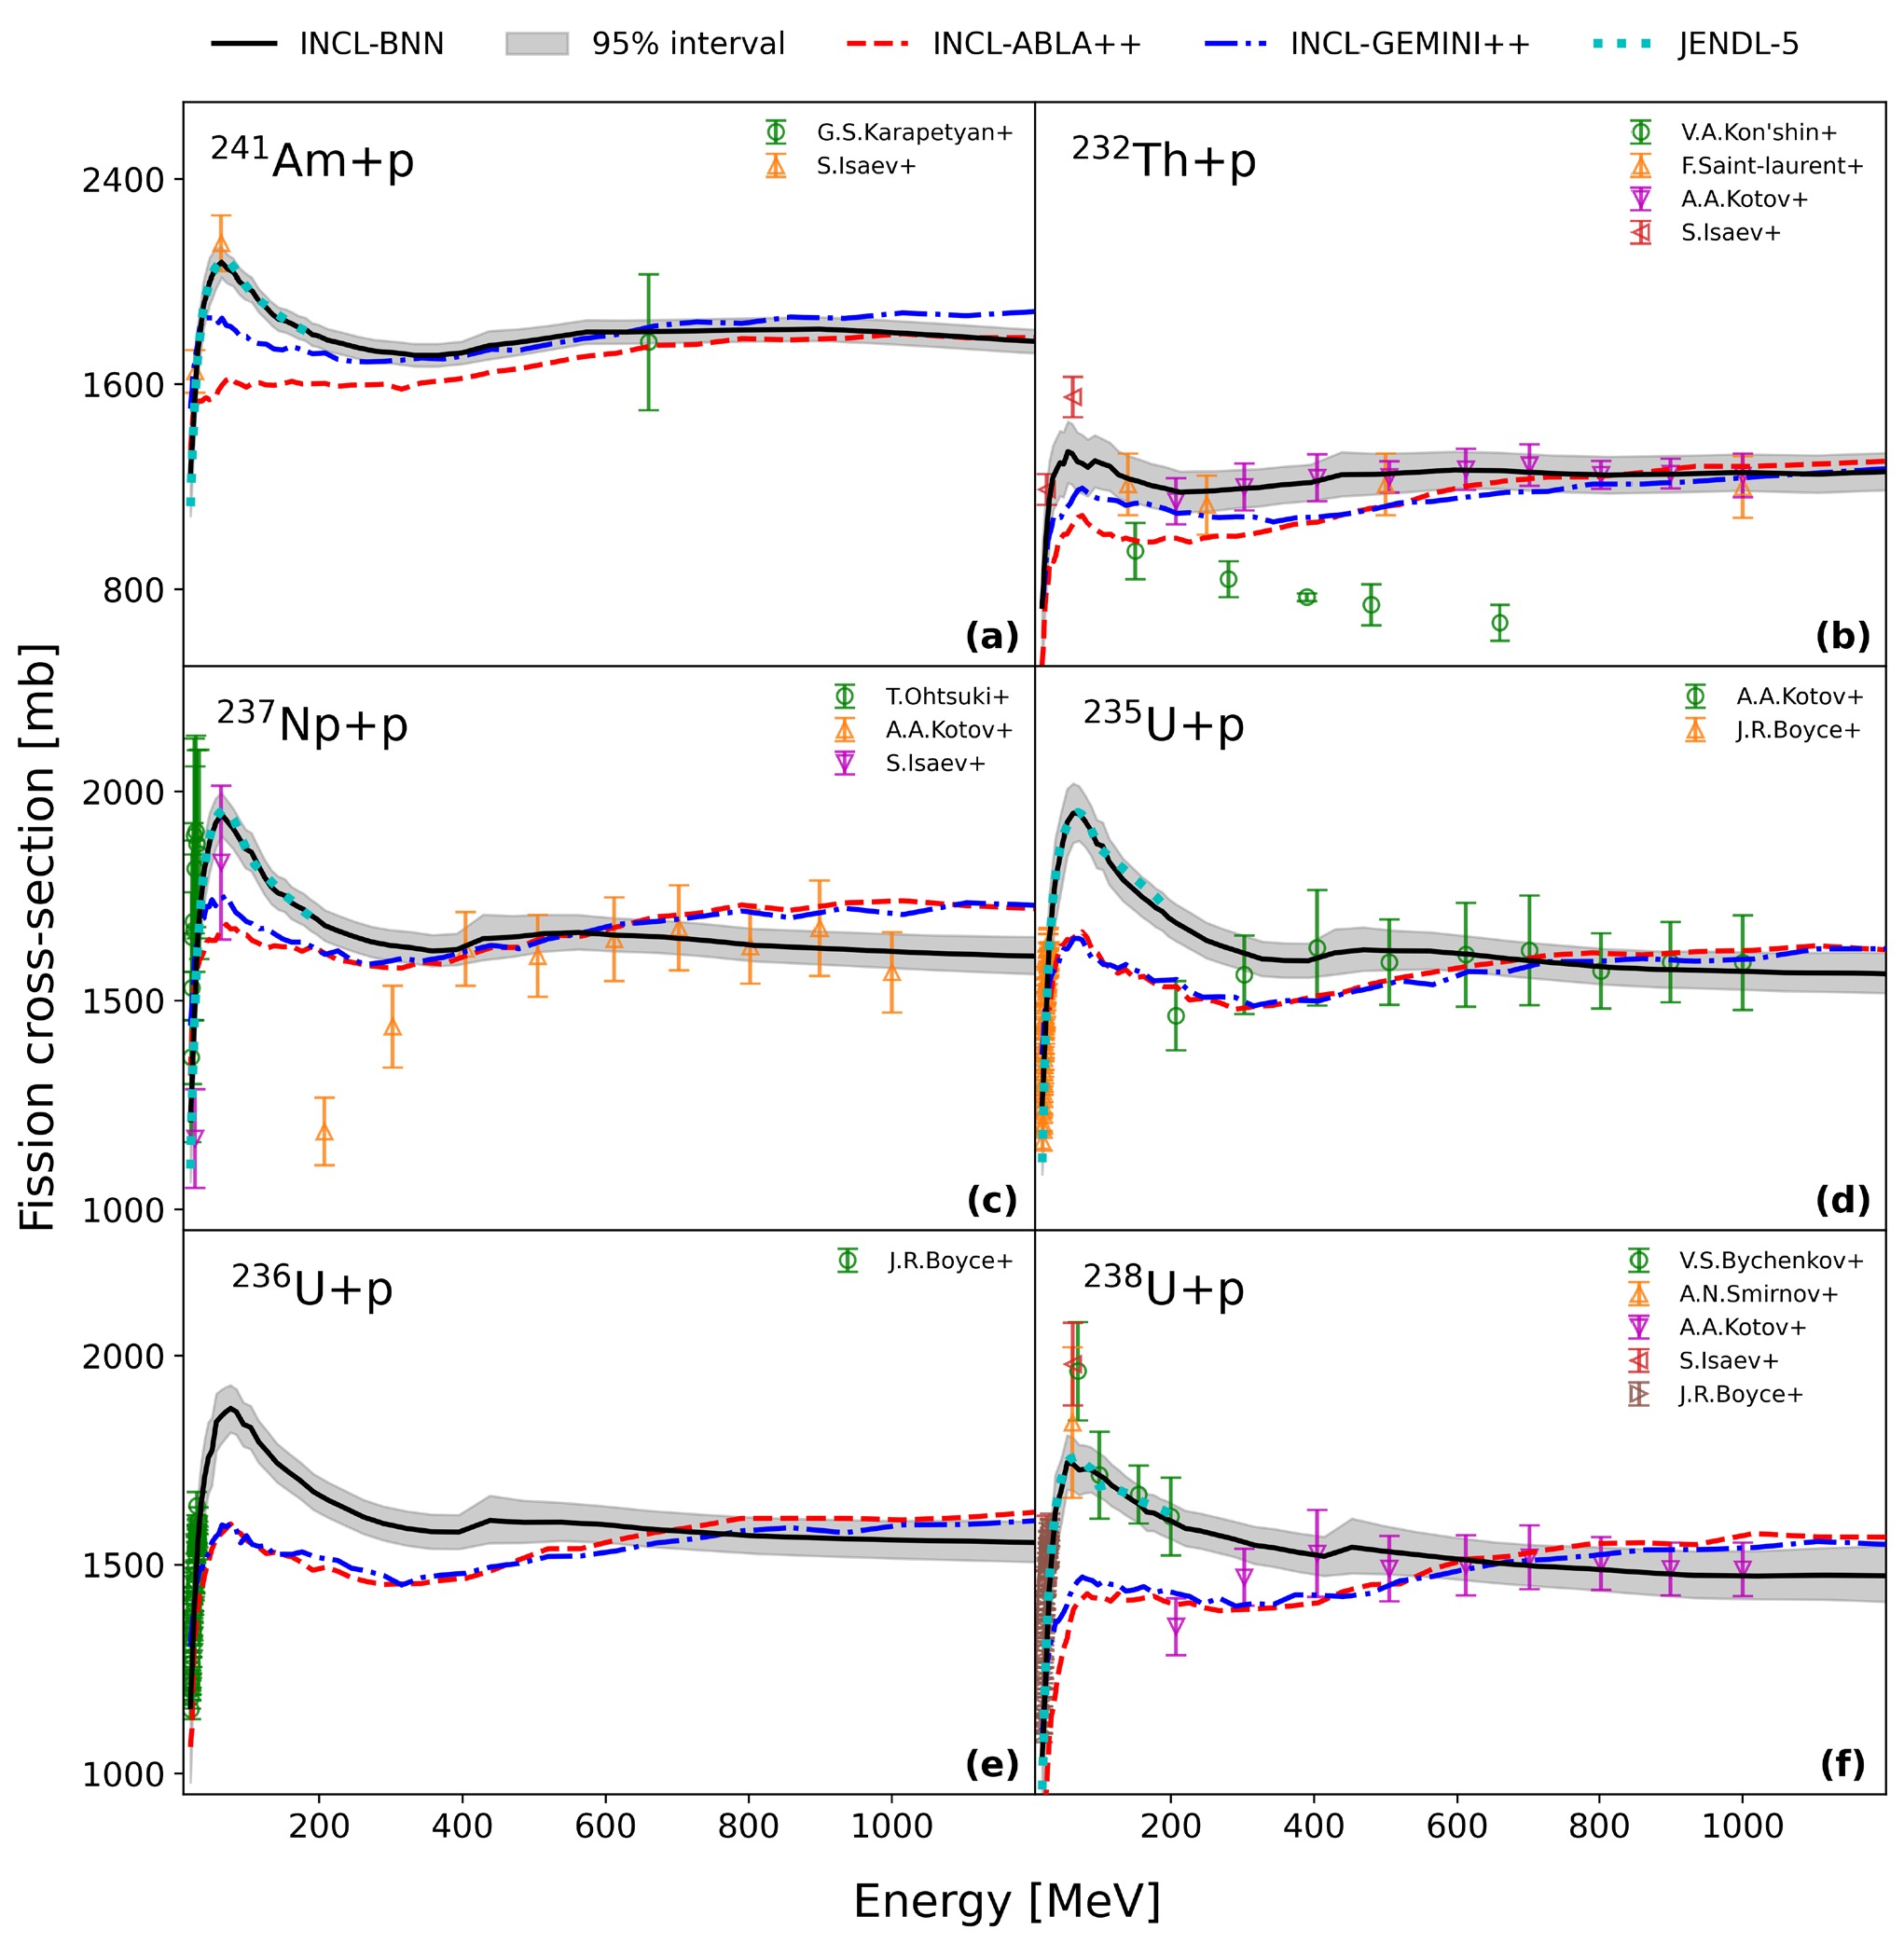
Figure 3. (color online) INCL-BNN predictions of
$ (p,f) $ cross-sections for$ ^{241}{\rm{Am}} $ ,$ ^{232}{\rm{Th}} $ ,$ ^{237}{\rm{Np}} $ , and$ ^{235,236,238}{\rm{U}} $ are compared with INCL-ABLA++, INCL-GEMINI++, and experimental data. The experimental data are obtained from Refs. [19−21, 25−30].Notably, the training dataset in this study excludes the
$ (p,f) $ reaction data of$ ^{232}{\rm{Th}} $ below 200 MeV, along with the data of$ ^{236}{\rm{U}} $ . Even then, the predictions of the INCL-BNN model for$ ^{232}{\rm{Th}} $ at energies below 200 MeV follow a similar variation trend to the experimental data. In the higher-energy region, the INCL-BNN predictions agree well with the experimental data and show a reasonable trend, as illustrated in Fig. 3 (b) and (e). Meanwhile, satisfactory consistency is observed for the remaining cases contained in the training dataset.For the
$ (n,f) $ reaction, the INCL-BNN model achieves a good agreement with the training data. For$ ^{230}{\rm{Th}} $ , INCL-ABLA++ and INCL-GEMINI++ both underestimate the experimental data, whereas INCL-BNN presents a similar prediction trend in the higher-energy region, as displayed in Fig. 4 (a). For$ ^{243}{\rm{Am}} $ and$ ^{239,240,241}{\rm{Pu}} $ (see Figs. 5 (a), (c), (d), (e)), the fission cross-sections predicted by INCL-BNN show a declining trend at energies above 600 MeV. This phenomenon is likely affected by the training data of$ ^{237}{\rm{Np}} $ above 600 MeV (Fig. 5(b)), leading INCL-BNN to reproduce the same variation trend. Meanwhile, INCL-ABLA++ and INCL-GEMINI++ overestimate the fission cross-sections of$ ^{237}{\rm{Np}} $ in the energy range over 600 MeV. Furthermore, for$ ^{239,241}{\rm{Pu}} $ , no sharp rise or fall in cross-sections (as observed in our previous study) appears above 200 MeV, yielding more physically reasonable variation trends. Overall, the coupling of the INCL model with BNN models can further constrain the predictions of the BNN framework. Additionally, the BNN model can effectively capture the evolutionary trends of$ (n,f) $ and$ (p,f) $ reaction cross-sections.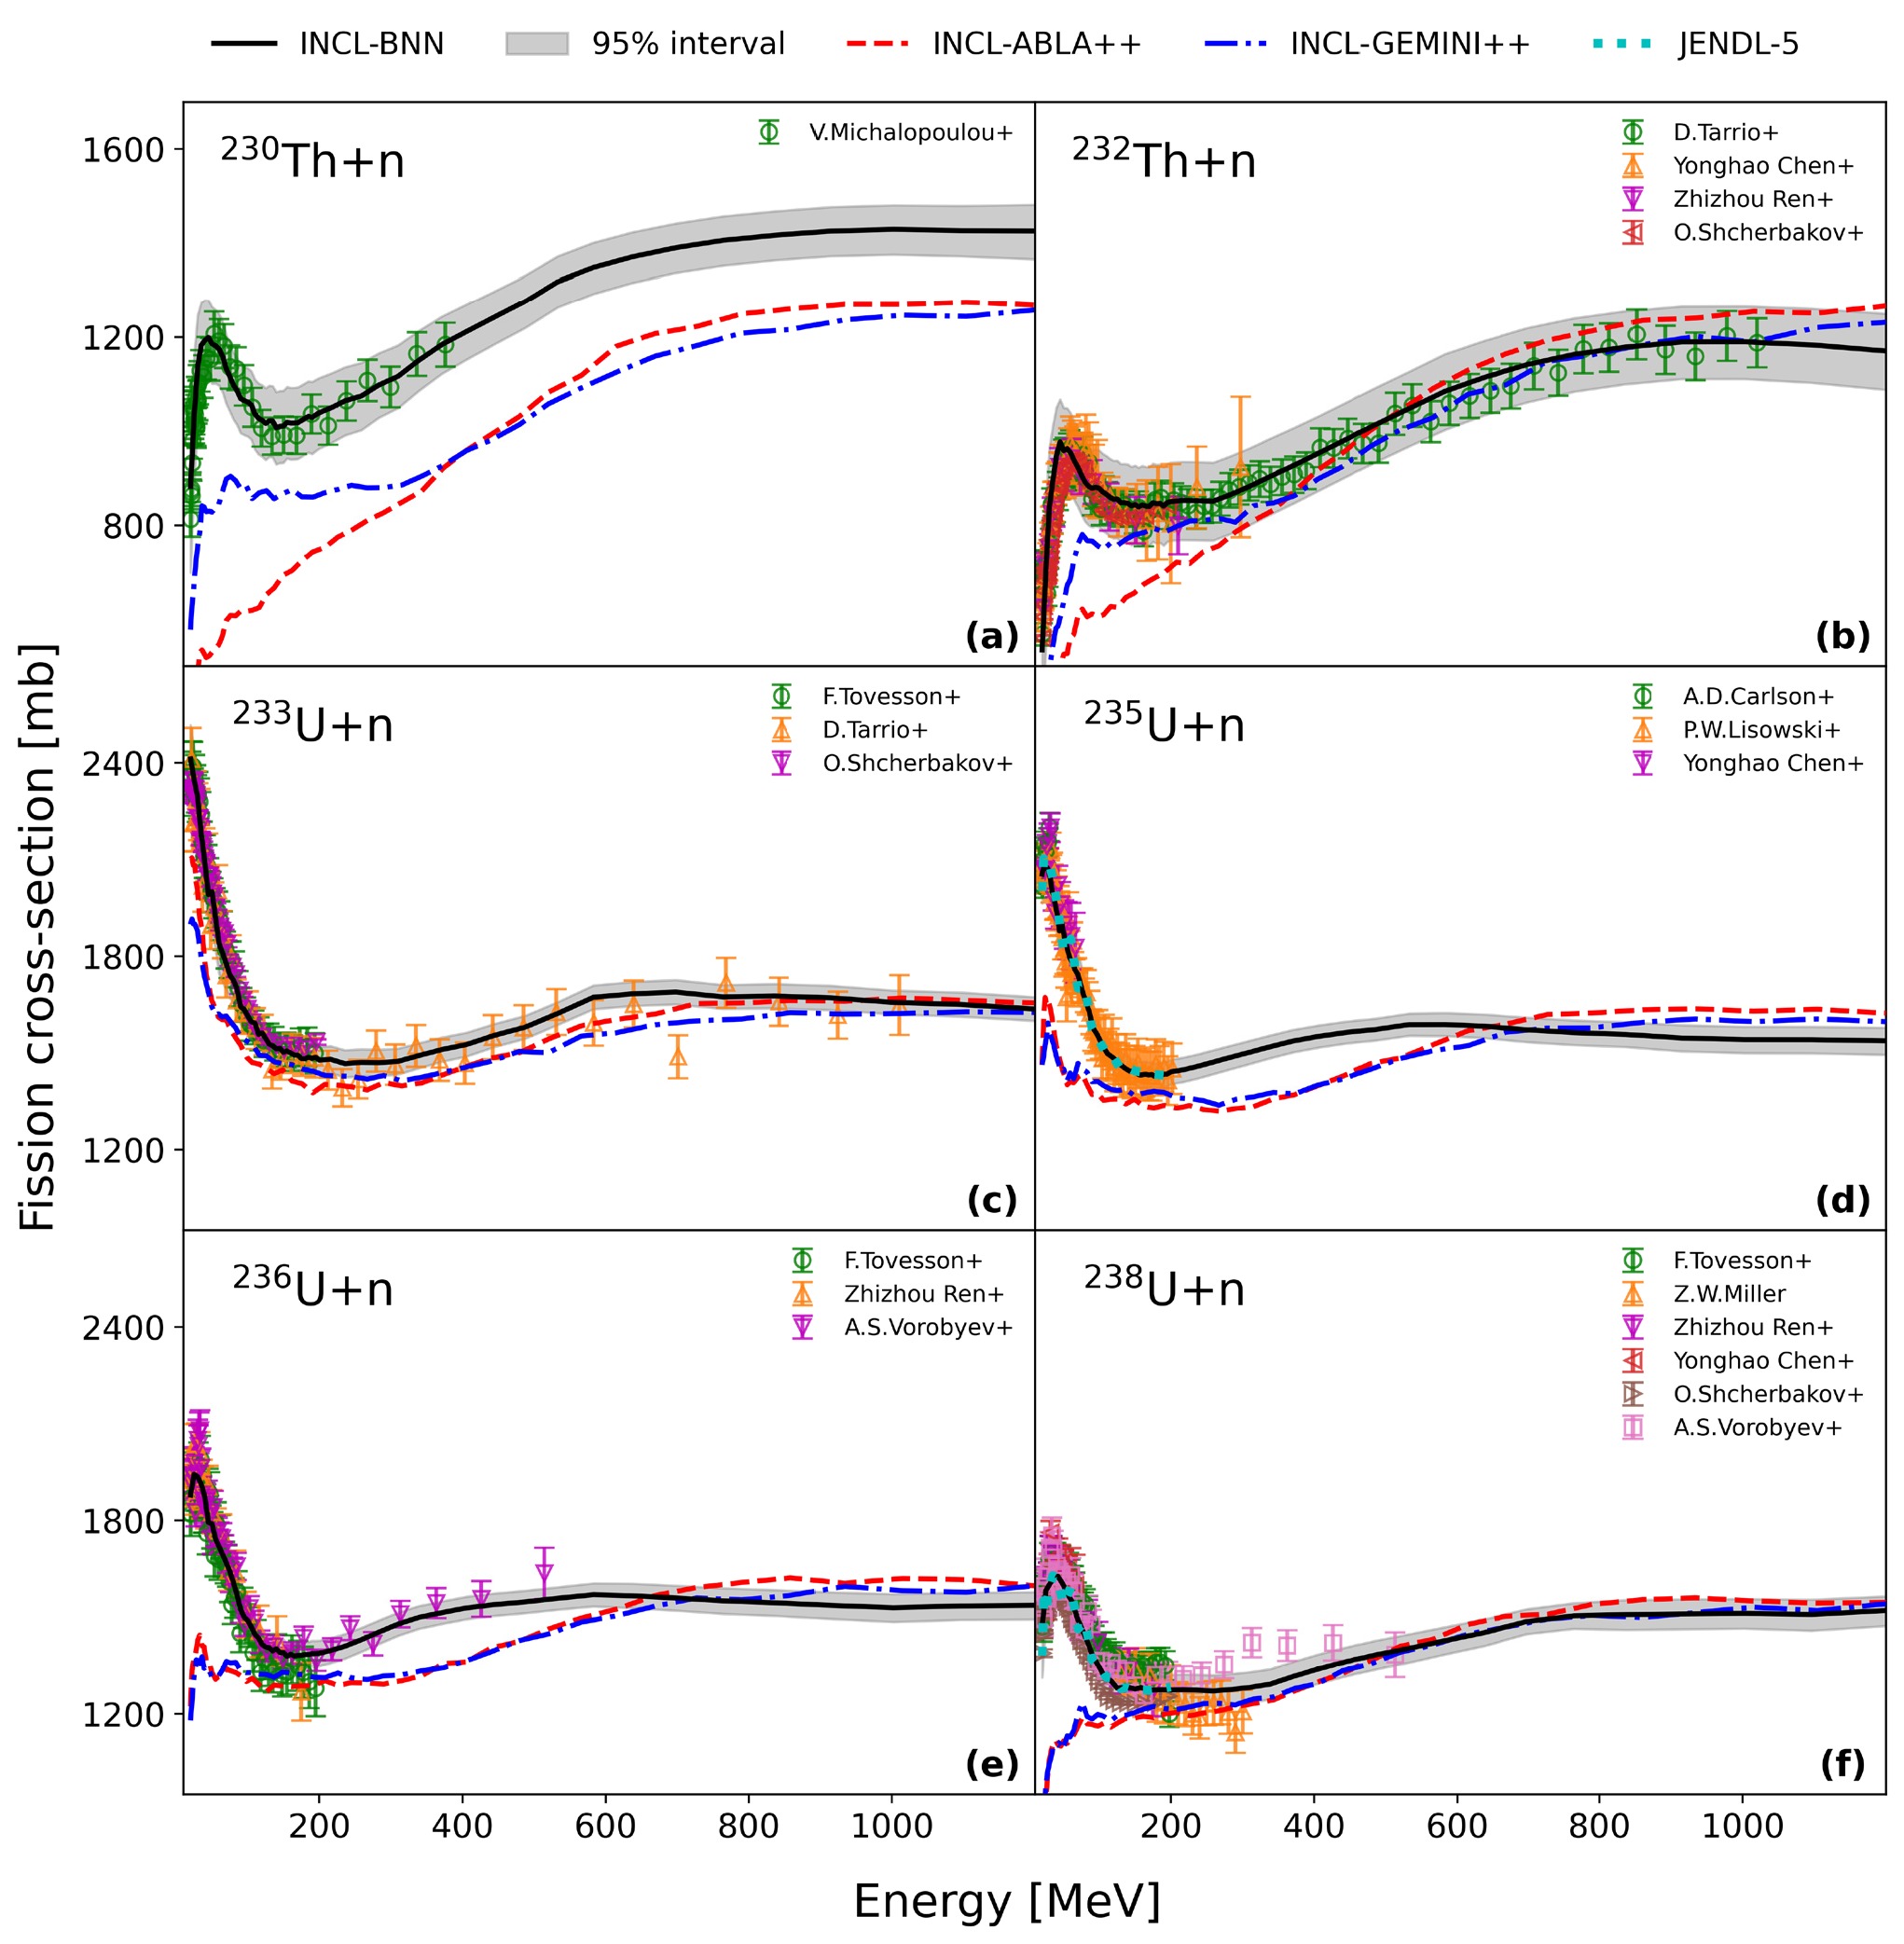
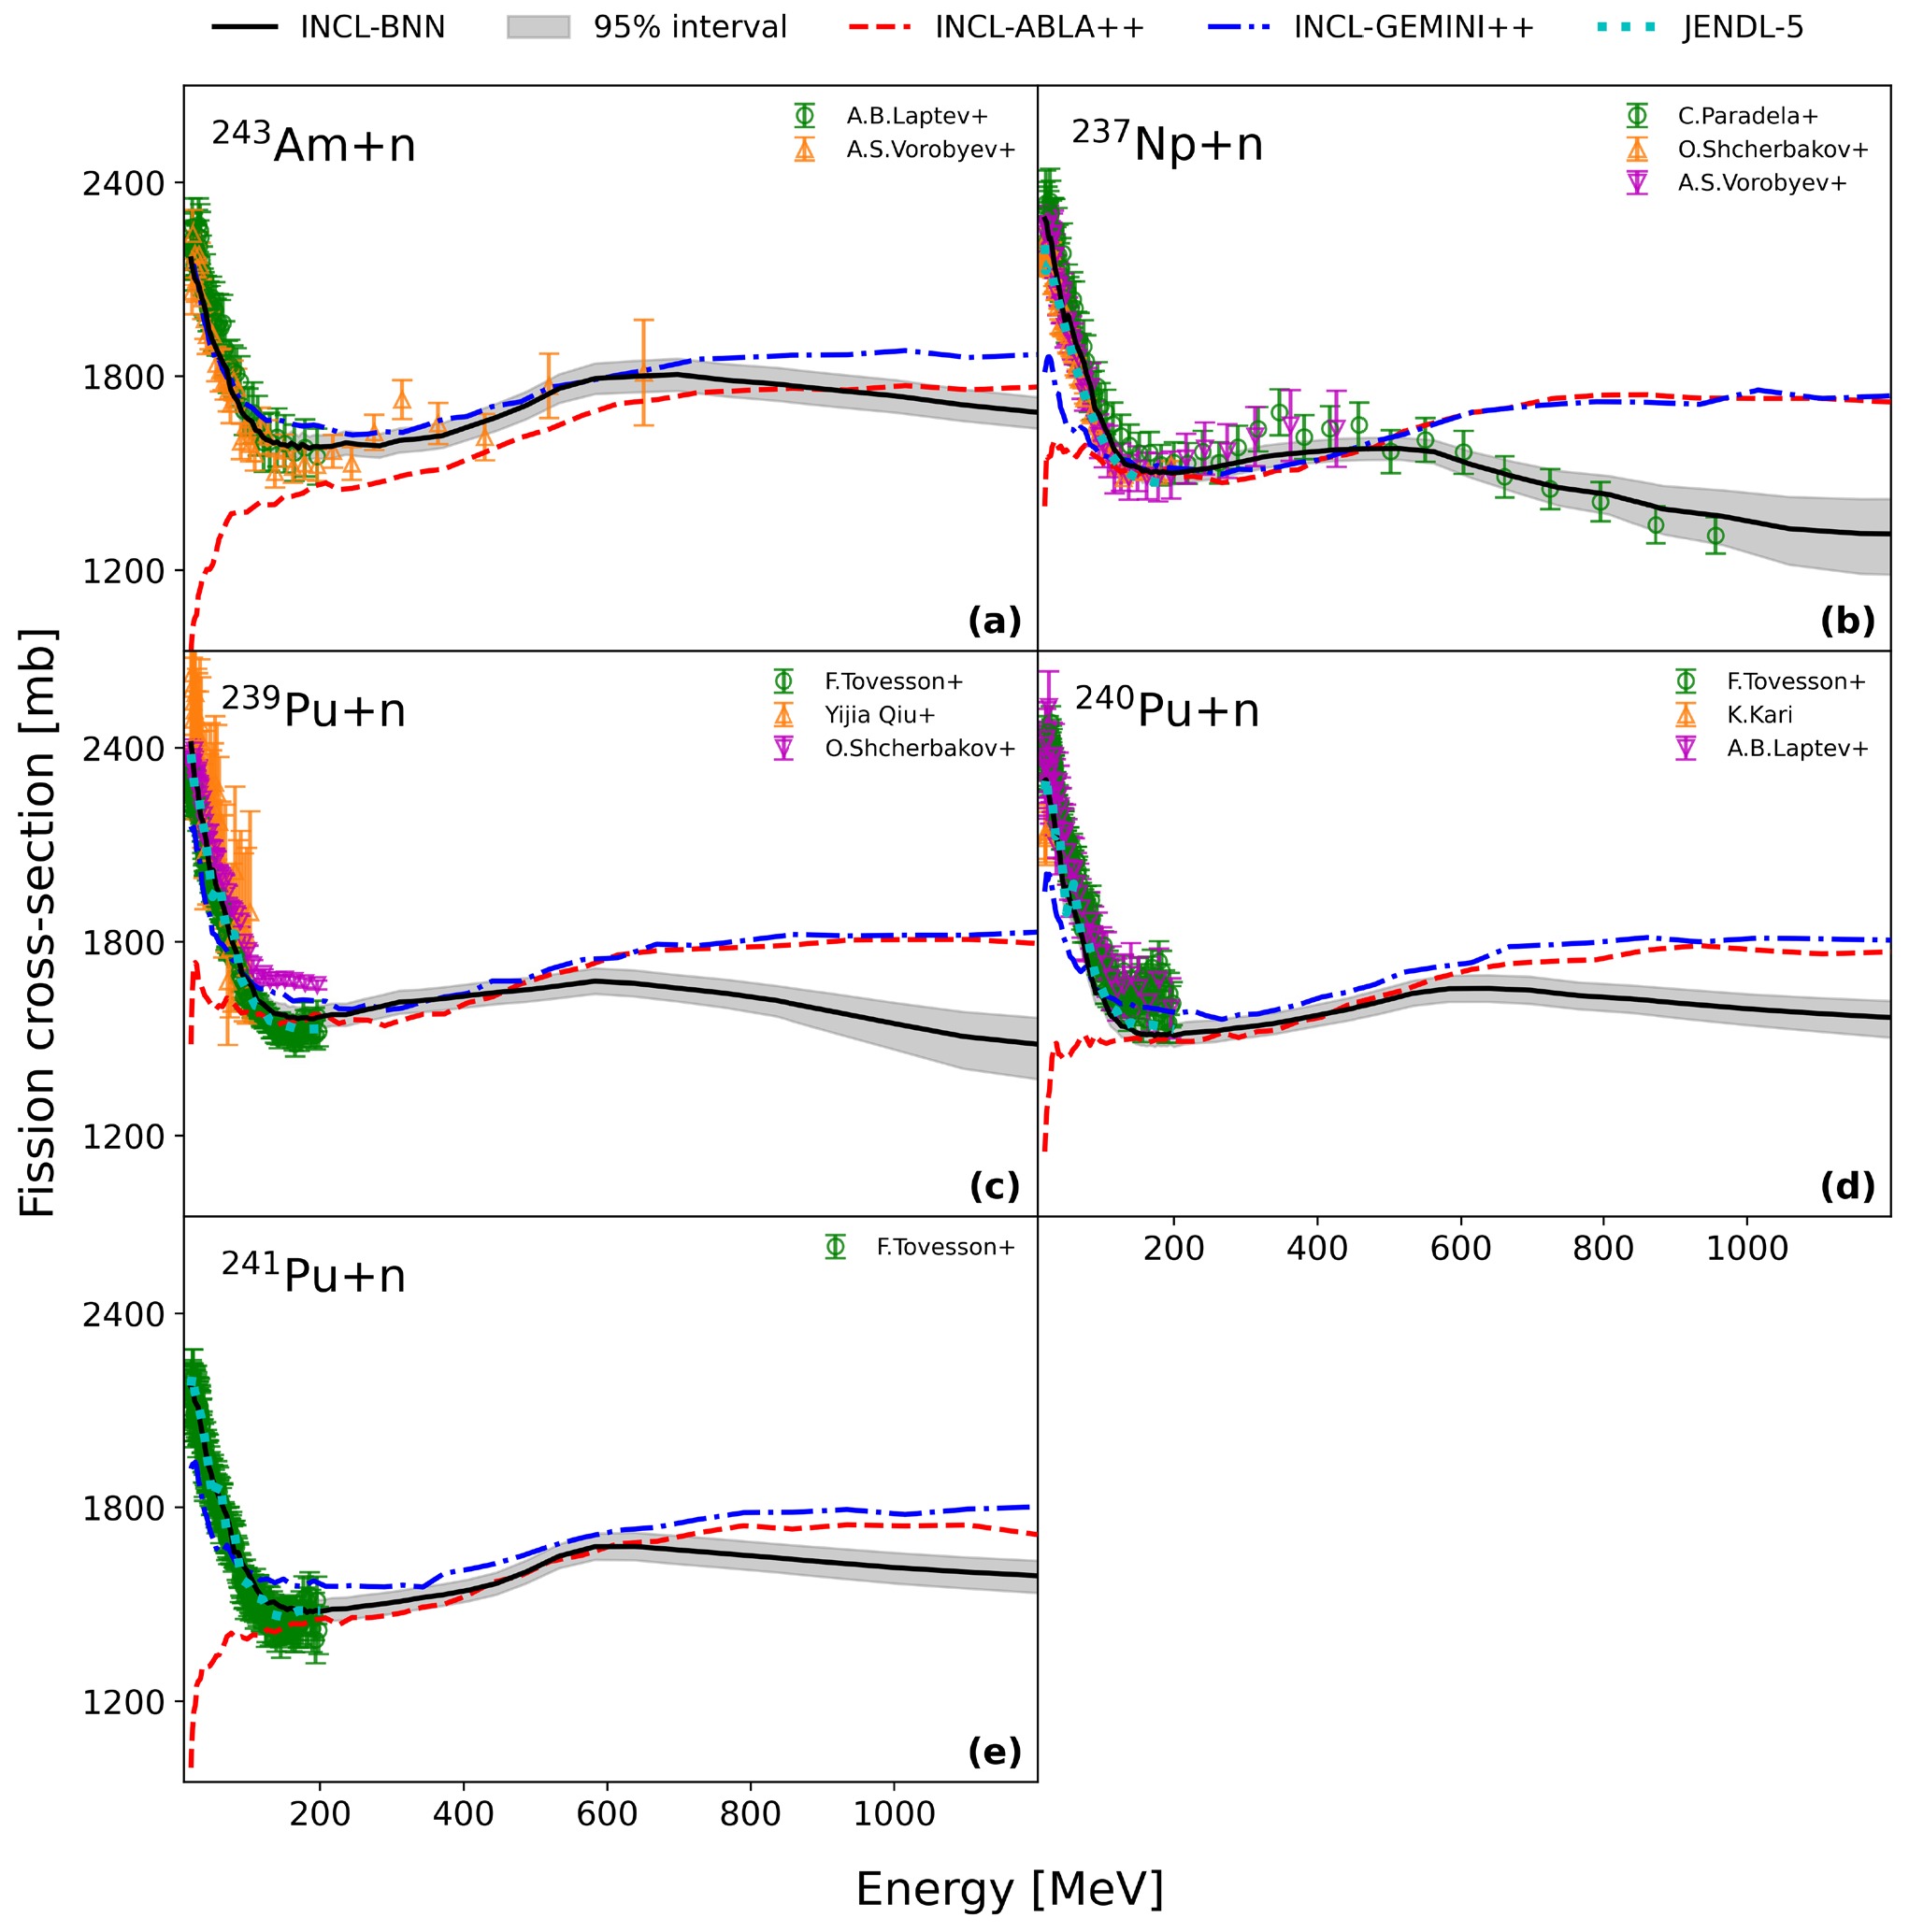
Figure 5. (color online) INCL-BNN predictions of
$ (n,f) $ cross-sections for$ ^{243}{\rm{Am}} $ ,$ ^{237}{\rm{Np}} $ , and$ ^{239,240,241}{\rm{Pu}} $ are compared with results from INCL-ABLA++, INCL-GEMINI++, and experimental data; experimental data in the figure are acquired from Refs. [22, 23, 35, 43−47]. -
The validation data and predictions of the BNN model are shown in Fig. 2. Panels (a), (b) and (c) indicate that the INCL-BNN results exhibit a good consistency with the trend of experimental data. In panel (d), the INCL-BNN calculation overestimates the experimental data at energies above 600 MeV, and such overestimation also appears in the calculations of INCL-ABLA++ and INCL-GEMINI++. In our previous studies, the calculated cross-sections can be reduced by adjusting the Fermi gas model parameter
$ \widetilde{a} $ in ABLA++ and tuning the ratio$ a_f/a_n $ in GEMINI++, where$ a_f $ refers to the level density parameter at the saddle point and$ a_n $ represents the corresponding parameter at ground-state deformation. However, further experimental measurements are still needed for in-depth verification. Meanwhile, the BNN model captures the$ (p,f) $ reaction features of$ ^{234}{\rm{U}} $ ,$ ^{235}{\rm{U}} $ ,$ ^{236}{\rm{U}} $ , and$ ^{238}{\rm{U}} $ . Near 60 MeV, the peak heights predicted by the INCL-BNN, INCL-ABLA++, and INCL-GEMINI++ models show a gently declining trend as the mass number A increases, as presented in Fig. 2 (b) and Figs. 3 (d)-(f). This consistent trend is probably correlated with the calculation of the fission barrier. From the perspective of the training dataset adopted for the BNN model alone, the prediction trend of the INCL-BNN model is reasonable and reliable.
Figure 2. (color online) The INCL-BNN predictions of
$ (p,f) $ cross-sections of$ ^{239}{\rm{Pu}} $ and$ ^{234}{\rm{U}} $ , as well as (n,f) cross-sections of$ ^{242}{\rm{Pu}} $ and$ ^{234}{\rm{U}} $ in the validation dataset, are compared with the results from INCL-ABLA++, INCL-GEMINI++, and experimental measurements. All experimental data in the figure are obtained from Refs. [19−24].
Figure 3. (color online) INCL-BNN predictions of
$ (p,f) $ cross-sections for$ ^{241}{\rm{Am}} $ ,$ ^{232}{\rm{Th}} $ ,$ ^{237}{\rm{Np}} $ , and$ ^{235,236,238}{\rm{U}} $ are compared with INCL-ABLA++, INCL-GEMINI++, and experimental data. The experimental data are obtained from Refs. [19−21, 25−30].Notably, the training dataset in this study excludes the
$ (p,f) $ reaction data of$ ^{232}{\rm{Th}} $ below 200 MeV, along with the data of$ ^{236}{\rm{U}} $ . Even then, the predictions of the INCL-BNN model for$ ^{232}{\rm{Th}} $ at energies below 200 MeV follow a similar variation trend to the experimental data. In the higher-energy region, the INCL-BNN predictions agree well with the experimental data and show a reasonable trend, as illustrated in Fig. 3 (b) and (e). Meanwhile, satisfactory consistency is observed for the remaining cases contained in the training dataset.For the
$ (n,f) $ reaction, the INCL-BNN model achieves a good agreement with the training data. For$ ^{230}{\rm{Th}} $ , INCL-ABLA++ and INCL-GEMINI++ both underestimate the experimental data, whereas INCL-BNN presents a similar prediction trend in the higher-energy region, as displayed in Fig. 4 (a). For$ ^{243}{\rm{Am}} $ and$ ^{239,240,241}{\rm{Pu}} $ (see Figs. 5 (a), (c), (d), (e)), the fission cross-sections predicted by INCL-BNN show a declining trend at energies above 600 MeV. This phenomenon is likely affected by the training data of$ ^{237}{\rm{Np}} $ above 600 MeV (Fig. 5(b)), leading INCL-BNN to reproduce the same variation trend. Meanwhile, INCL-ABLA++ and INCL-GEMINI++ overestimate the fission cross-sections of$ ^{237}{\rm{Np}} $ in the energy range over 600 MeV. Furthermore, for$ ^{239,241}{\rm{Pu}} $ , no sharp rise or fall in cross-sections (as observed in our previous study) appears above 200 MeV, yielding more physically reasonable variation trends. Overall, the coupling of the INCL model with BNN models can further constrain the predictions of the BNN framework. Additionally, the BNN model can effectively capture the evolutionary trends of$ (n,f) $ and$ (p,f) $ reaction cross-sections.
Figure 5. (color online) INCL-BNN predictions of
$ (n,f) $ cross-sections for$ ^{243}{\rm{Am}} $ ,$ ^{237}{\rm{Np}} $ , and$ ^{239,240,241}{\rm{Pu}} $ are compared with results from INCL-ABLA++, INCL-GEMINI++, and experimental data; experimental data in the figure are acquired from Refs. [22, 23, 35, 43−47]. -
The validation data and predictions of the BNN model are shown in Fig. 2. Panels (a), (b) and (c) indicate that the INCL-BNN results exhibit a good consistency with the trend of experimental data. In panel (d), the INCL-BNN calculation overestimates the experimental data at energies above 600 MeV, and such overestimation also appears in the calculations of INCL-ABLA++ and INCL-GEMINI++. In our previous studies, the calculated cross-sections can be reduced by adjusting the Fermi gas model parameter
$ \widetilde{a} $ in ABLA++ and tuning the ratio$ a_f/a_n $ in GEMINI++, where$ a_f $ refers to the level density parameter at the saddle point and$ a_n $ represents the corresponding parameter at ground-state deformation. However, further experimental measurements are still needed for in-depth verification. Meanwhile, the BNN model captures the$ (p,f) $ reaction features of$ ^{234}{\rm{U}} $ ,$ ^{235}{\rm{U}} $ ,$ ^{236}{\rm{U}} $ , and$ ^{238}{\rm{U}} $ . Near 60 MeV, the peak heights predicted by the INCL-BNN, INCL-ABLA++, and INCL-GEMINI++ models show a gently declining trend as the mass number A increases, as presented in Fig. 2 (b) and Figs. 3 (d)-(f). This consistent trend is probably correlated with the calculation of the fission barrier. From the perspective of the training dataset adopted for the BNN model alone, the prediction trend of the INCL-BNN model is reasonable and reliable.
Figure 2. (color online) The INCL-BNN predictions of
$ (p,f) $ cross-sections of$ ^{239}{\rm{Pu}} $ and$ ^{234}{\rm{U}} $ , as well as (n,f) cross-sections of$ ^{242}{\rm{Pu}} $ and$ ^{234}{\rm{U}} $ in the validation dataset, are compared with the results from INCL-ABLA++, INCL-GEMINI++, and experimental measurements. All experimental data in the figure are obtained from Refs. [19−24].
Figure 3. (color online) INCL-BNN predictions of
$ (p,f) $ cross-sections for$ ^{241}{\rm{Am}} $ ,$ ^{232}{\rm{Th}} $ ,$ ^{237}{\rm{Np}} $ , and$ ^{235,236,238}{\rm{U}} $ are compared with INCL-ABLA++, INCL-GEMINI++, and experimental data. The experimental data are obtained from Refs. [19−21, 25−30].Notably, the training dataset in this study excludes the
$ (p,f) $ reaction data of$ ^{232}{\rm{Th}} $ below 200 MeV, along with the data of$ ^{236}{\rm{U}} $ . Even then, the predictions of the INCL-BNN model for$ ^{232}{\rm{Th}} $ at energies below 200 MeV follow a similar variation trend to the experimental data. In the higher-energy region, the INCL-BNN predictions agree well with the experimental data and show a reasonable trend, as illustrated in Fig. 3 (b) and (e). Meanwhile, satisfactory consistency is observed for the remaining cases contained in the training dataset.For the
$ (n,f) $ reaction, the INCL-BNN model achieves a good agreement with the training data. For$ ^{230}{\rm{Th}} $ , INCL-ABLA++ and INCL-GEMINI++ both underestimate the experimental data, whereas INCL-BNN presents a similar prediction trend in the higher-energy region, as displayed in Fig. 4 (a). For$ ^{243}{\rm{Am}} $ and$ ^{239,240,241}{\rm{Pu}} $ (see Figs. 5 (a), (c), (d), (e)), the fission cross-sections predicted by INCL-BNN show a declining trend at energies above 600 MeV. This phenomenon is likely affected by the training data of$ ^{237}{\rm{Np}} $ above 600 MeV (Fig. 5(b)), leading INCL-BNN to reproduce the same variation trend. Meanwhile, INCL-ABLA++ and INCL-GEMINI++ overestimate the fission cross-sections of$ ^{237}{\rm{Np}} $ in the energy range over 600 MeV. Furthermore, for$ ^{239,241}{\rm{Pu}} $ , no sharp rise or fall in cross-sections (as observed in our previous study) appears above 200 MeV, yielding more physically reasonable variation trends. Overall, the coupling of the INCL model with BNN models can further constrain the predictions of the BNN framework. Additionally, the BNN model can effectively capture the evolutionary trends of$ (n,f) $ and$ (p,f) $ reaction cross-sections.
Figure 5. (color online) INCL-BNN predictions of
$ (n,f) $ cross-sections for$ ^{243}{\rm{Am}} $ ,$ ^{237}{\rm{Np}} $ , and$ ^{239,240,241}{\rm{Pu}} $ are compared with results from INCL-ABLA++, INCL-GEMINI++, and experimental data; experimental data in the figure are acquired from Refs. [22, 23, 35, 43−47]. -
The validation data and predictions of the BNN model are shown in Fig. 2. Panels (a), (b) and (c) indicate that the INCL-BNN results exhibit a good consistency with the trend of experimental data. In panel (d), the INCL-BNN calculation overestimates the experimental data at energies above 600 MeV, and such overestimation also appears in the calculations of INCL-ABLA++ and INCL-GEMINI++. In our previous studies, the calculated cross-sections can be reduced by adjusting the Fermi gas model parameter
$ \widetilde{a} $ in ABLA++ and tuning the ratio$ a_f/a_n $ in GEMINI++, where$ a_f $ refers to the level density parameter at the saddle point and$ a_n $ represents the corresponding parameter at ground-state deformation. However, further experimental measurements are still needed for in-depth verification. Meanwhile, the BNN model captures the$ (p,f) $ reaction features of$ ^{234}{\rm{U}} $ ,$ ^{235}{\rm{U}} $ ,$ ^{236}{\rm{U}} $ , and$ ^{238}{\rm{U}} $ . Near 60 MeV, the peak heights predicted by the INCL-BNN, INCL-ABLA++, and INCL-GEMINI++ models show a gently declining trend as the mass number A increases, as presented in Fig. 2 (b) and Figs. 3 (d)-(f). This consistent trend is probably correlated with the calculation of the fission barrier. From the perspective of the training dataset adopted for the BNN model alone, the prediction trend of the INCL-BNN model is reasonable and reliable.
Figure 2. (color online) The INCL-BNN predictions of
$ (p,f) $ cross-sections of$ ^{239}{\rm{Pu}} $ and$ ^{234}{\rm{U}} $ , as well as (n,f) cross-sections of$ ^{242}{\rm{Pu}} $ and$ ^{234}{\rm{U}} $ in the validation dataset, are compared with the results from INCL-ABLA++, INCL-GEMINI++, and experimental measurements. All experimental data in the figure are obtained from Refs. [19−24].
Figure 3. (color online) INCL-BNN predictions of
$ (p,f) $ cross-sections for$ ^{241}{\rm{Am}} $ ,$ ^{232}{\rm{Th}} $ ,$ ^{237}{\rm{Np}} $ , and$ ^{235,236,238}{\rm{U}} $ are compared with INCL-ABLA++, INCL-GEMINI++, and experimental data. The experimental data are obtained from Refs. [19−21, 25−30].Notably, the training dataset in this study excludes the
$ (p,f) $ reaction data of$ ^{232}{\rm{Th}} $ below 200 MeV, along with the data of$ ^{236}{\rm{U}} $ . Even then, the predictions of the INCL-BNN model for$ ^{232}{\rm{Th}} $ at energies below 200 MeV follow a similar variation trend to the experimental data. In the higher-energy region, the INCL-BNN predictions agree well with the experimental data and show a reasonable trend, as illustrated in Fig. 3 (b) and (e). Meanwhile, satisfactory consistency is observed for the remaining cases contained in the training dataset.For the
$ (n,f) $ reaction, the INCL-BNN model achieves a good agreement with the training data. For$ ^{230}{\rm{Th}} $ , INCL-ABLA++ and INCL-GEMINI++ both underestimate the experimental data, whereas INCL-BNN presents a similar prediction trend in the higher-energy region, as displayed in Fig. 4 (a). For$ ^{243}{\rm{Am}} $ and$ ^{239,240,241}{\rm{Pu}} $ (see Figs. 5 (a), (c), (d), (e)), the fission cross-sections predicted by INCL-BNN show a declining trend at energies above 600 MeV. This phenomenon is likely affected by the training data of$ ^{237}{\rm{Np}} $ above 600 MeV (Fig. 5(b)), leading INCL-BNN to reproduce the same variation trend. Meanwhile, INCL-ABLA++ and INCL-GEMINI++ overestimate the fission cross-sections of$ ^{237}{\rm{Np}} $ in the energy range over 600 MeV. Furthermore, for$ ^{239,241}{\rm{Pu}} $ , no sharp rise or fall in cross-sections (as observed in our previous study) appears above 200 MeV, yielding more physically reasonable variation trends. Overall, the coupling of the INCL model with BNN models can further constrain the predictions of the BNN framework. Additionally, the BNN model can effectively capture the evolutionary trends of$ (n,f) $ and$ (p,f) $ reaction cross-sections.
Figure 5. (color online) INCL-BNN predictions of
$ (n,f) $ cross-sections for$ ^{243}{\rm{Am}} $ ,$ ^{237}{\rm{Np}} $ , and$ ^{239,240,241}{\rm{Pu}} $ are compared with results from INCL-ABLA++, INCL-GEMINI++, and experimental data; experimental data in the figure are acquired from Refs. [22, 23, 35, 43−47]. -
This study constructs a fission cross-section calculation framework coupling INCL with BNN, and introduces more physical input parameters to constrain the BNN predictions. The INCL-BNN results are in good agreement with experimental data and accurately capture the variation trend of fission cross-sections versus energy. Ablation experiments demonstrate that among all INCL-extracted inputs, the residual nucleus angular momentum, fissility, and excitation energy contribute most prominently to the prediction performance, while macroscopic nuclide properties including the mass number and charge number have only negligible effects. For energies above 600 MeV, the INCL-BNN model is prone to the impact of training data and shows similar trend characteristics in the prediction of other nuclides, which still needs further experimental measurement and verification. Future efforts will be devoted to further improving the INCL-BNN framework to realize the prediction of more reaction channels.
-
This study constructs a fission cross-section calculation framework coupling INCL with BNN, and introduces more physical input parameters to constrain the BNN predictions. The INCL-BNN results are in good agreement with experimental data and accurately capture the variation trend of fission cross-sections versus energy. Ablation experiments demonstrate that among all INCL-extracted inputs, the residual nucleus angular momentum, fissility, and excitation energy contribute most prominently to the prediction performance, while macroscopic nuclide properties including the mass number and charge number have only negligible effects. For energies above 600 MeV, the INCL-BNN model is prone to the impact of training data and shows similar trend characteristics in the prediction of other nuclides, which still needs further experimental measurement and verification. Future efforts will be devoted to further improving the INCL-BNN framework to realize the prediction of more reaction channels.
-
This study constructs a fission cross-section calculation framework coupling INCL with BNN, and introduces more physical input parameters to constrain the BNN predictions. The INCL-BNN results are in good agreement with experimental data and accurately capture the variation trend of fission cross-sections versus energy. Ablation experiments demonstrate that among all INCL-extracted inputs, the residual nucleus angular momentum, fissility, and excitation energy contribute most prominently to the prediction performance, while macroscopic nuclide properties including the mass number and charge number have only negligible effects. For energies above 600 MeV, the INCL-BNN model is prone to the impact of training data and shows similar trend characteristics in the prediction of other nuclides, which still needs further experimental measurement and verification. Future efforts will be devoted to further improving the INCL-BNN framework to realize the prediction of more reaction channels.
-
This study constructs a fission cross-section calculation framework coupling INCL with BNN, and introduces more physical input parameters to constrain the BNN predictions. The INCL-BNN results are in good agreement with experimental data and accurately capture the variation trend of fission cross-sections versus energy. Ablation experiments demonstrate that among all INCL-extracted inputs, the residual nucleus angular momentum, fissility, and excitation energy contribute most prominently to the prediction performance, while macroscopic nuclide properties including the mass number and charge number have only negligible effects. For energies above 600 MeV, the INCL-BNN model is prone to the impact of training data and shows similar trend characteristics in the prediction of other nuclides, which still needs further experimental measurement and verification. Future efforts will be devoted to further improving the INCL-BNN framework to realize the prediction of more reaction channels.
Study on intermediate- and high-energy proton- and neutron-induced fission cross-sections by coupling the Liège intranuclear cascade model with Bayesian neural networks
- Received Date: 2026-06-08
- Available Online: 2026-10-15
Abstract: The intermediate- and high-energy proton- and neutron-induced fission cross-sections serve as essential nuclear data for the design and safe operation of the Accelerator-Driven Subcritical System (ADS). This work proposes a hybrid framework combining the Liège Intranuclear Cascade Model (INCL) with Bayesian Neural Networks (BNN) to calculate relevant fission cross-sections. The numerical results are further validated against the simulated data from the INCL-ABLA++ and INCL-GEMINI++ coupled models. The results demonstrate that the established INCL-BNN hybrid framework incorporates adequate physical constraints. It not only accurately reproduces the evolutionary trend of fission cross-sections but also maintains excellent consistency with available experimental measurements. In energy ranges lacking experimental data, the INCL-BNN model exhibits a physically reasonable predictive trend.



 DownLoad: