


 Abstract
 HTML
HTML Reference
 Related
 PDF
PDF


-
Understanding the formation of nuclei in astrophysical environments requires comprehensive reaction network calculations that incorporate all relevant reactions contributing to the production and destruction of nuclei at temperatures of a few GK. Neutron capture processes (the s- and r-processes) play a fundamental role in nucleosynthesis, accounting for the production of most elements heavier than iron in various stellar scenarios. However, a small group of 35 proton-rich nuclei are not produced by either the s- or r-process. These nuclides, which lie between 74Se and 196Hg, are generally referred to as p-nuclei. Their natural abundances are significantly lower than those of neighboring s- and r-process isotopes in the same mass region.
Early explanations of the p-process were proposed by Burbidge et al. [1] and A. G. W. Cameron [2]. They suggested that p-nuclei are formed by the so-called p-process, either through proton-capture reactions or via a series of photodisintegration reactions, (γ, p), (γ, n), and (γ, α), acting on pre-existing s- or r-process seed nuclei at temperatures on the order of a few GK. These processes were initially associated with the hydrogen-rich envelope of Type II supernova explosions [1]. Subsequently, Woosley and Howard [3] proposed that p-nuclei are primarily produced through photodisintegration in the O/Ne-burning shell of massive stars during core-collapse supernova explosions. Although this model successfully reproduces the solar abundances of many p-nuclei, it significantly underproduces the lighter p-nuclei [3, 4]. Consequently, the astrophysical origin of the p-nuclei remains an open question.
The synthesis of p-nuclei involves a complex reaction network comprising approximately 2,000 stable and unstable nuclei interconnected by more than 20,000 nuclear reactions [5]. Experimental data at astrophysical energies are, however, scarce because of several limitations:
(i) many of the relevant nuclei are unstable and not readily accessible in laboratories,
(ii) stellar temperatures on the order of GK correspond to relatively low interaction energies, at which charged-particle-induced reactions are strongly suppressed by the Coulomb barrier, and
(iii) the γ-ray beams required for photodisintegration studies are available only at a limited number of facilities worldwide. Therefore, (p, γ) cross sections are usually measured in terrestrial laboratories, and the corresponding (γ, p) cross sections are then derived using the principle of detailed balance [6]. Moreover, measuring (p, γ) reactions instead of (γ,p) reactions is advantageous because it minimizes the stellar enhancement effect arising from thermal excitations in the stellar plasma [7].
The abundance pattern of p-nuclei closely follows that of s- and r-process isotopes [8], emphasizing the importance of reliable nuclear data for the seed nuclei involved. Owing to the limited availability of experimental data on radiative proton-capture reactions, most p-process simulations rely heavily on theoretical predictions based on the Hauser–Feshbach statistical model [9]. The key challenge lies in constraining the nuclear input parameters used in the calculations. Therefore, it is essential to examine the reliability of theoretical predictions and to assess the sensitivity of the calculated cross sections to the underlying nuclear ingredients.
In this work, theoretical calculations have been performed for (p, γ) reactions on Sn isotopes and neighboring nuclei. With its magic proton number
$ Z=50 $ , Sn has many stable isotopes in the mass-number range$ A=112-124 $ , making it an ideal testing ground for statistical model calculations. The synthesis of Sn isotopes involves contributions from all three major nucleosynthetic processes: 112,114Sn (p-process), 115Sn (s-, r-, and p-process) [10, 11], 116Sn (s-process), 117,118,119,120,122Sn (s- and r-process), and 124Sn (r-process) [12]. Despite extensive experimental and theoretical efforts, discrepancies between predicted and observed solar abundances of Sn isotopes persist. Nevertheless, the rich isotopic diversity of Sn makes it a promising candidate for investigating nucleosynthesis pathways and isotopic anomalies [13].Although p-nuclei are the primary focus, the study of neighboring nuclei is equally important because nucleosynthesis calculations involve a complex reaction network comprising many isotopes. To ensure reliable abundance predictions, contributions from all relevant reaction pathways must be considered. Since measuring cross sections for many of these reactions remains challenging, theoretical calculations are indispensable. However, reliable predictions of cross sections for experimentally inaccessible reactions require well-constrained nuclear input parameters.
Motivated by these considerations, the present work focuses on a systematic study of (p, γ) reaction cross sections for Sn isotopes and neighboring nuclei in the atomic-number range
$ Z=42-56 $ . Various model combinations within the TALYS framework [14] have been explored to identify a set of nuclear models capable of consistently reproducing the available experimental (p, γ) data in the Sn region. Once validated, these model combinations may subsequently be employed to predict cross sections for reactions that are experimentally challenging or presently inaccessible in the neighboring region.Experimental (p, γ) cross sections for reactions with 112,114,116,119Sn isotopes have been reported in Refs. [15−17]. In all these studies, the measurements were compared with statistical model calculations using the NON-SMOKER (web) database [18]. Although the NON-SMOKER (web) predictions underestimated the astrophysical S-factors for all four reactions, the calculations for 114,116Sn(p, γ)115,117Sb were scaled as a function of energy to improve agreement with the experimental data [16, 17]. Measurements reported by S. Harissopulos et al. [19] for the 116,118Sn(p, γ)117,119Sb reactions in the energy range 2.2−5.2 MeV were found to agree with the TALYS calculations, except for the cross sections at energies ≤ 3.2 MeV. Very recently, the first experimental determination of the 115Sn(p, γ)116Sb cross sections was reported using the activation technique over the energy range 2.42−5.93 MeV [20]. A direct comparison with statistical model calculations demonstrated that TALYS successfully reproduces the measured cross sections, whereas the NON-SMOKER (web) predictions exhibit significant deviations.
Previous studies [21, 22] have investigated the experimental (p, γ) data for Sn isotopes using the TALYS nuclear reaction code. TALYS 1.6 was employed to compute astrophysical S-factors using various optical model potentials (OMPs), including the Koning and Delaroche OMP (KD03) [23] and the microscopic Jeukenne-Lejeune-Mahaux (JLM) potential [24], combined with relativistic mean field (RMF) densities, to reproduce the experimental data [21]. To achieve agreement between the calculated and experimental S-factors, the same scaling function as that used in Ref. [17] was adopted for the Koning and Delaroche OMP (KD03), while the JLM potential was scaled by a factor of 3. Subsequently, TALYS 1.8 calculations were used to investigate the influence of different photon strength function (PSF) models on (p, γ) cross sections for the reactions 112,114,116Sn(p, γ)113,115,117Sb [22]. The latest version, TALYS 2.0, incorporates the phenomenological Simplified Modified Lorentzian (SMLO) PSF developed by Goriely et al. [25], which is now the default PSF model for E1 and M1 γ-ray transitions and is expected to provide improved results.
The present work aims to assess the relative predictive capabilities of TALYS 2.0 and the NON-SMOKER database in reproducing the S-factor values derived from the measured cross sections of (p, γ) reactions on Sn isotopes, namely 112,114,115,116,118,119Sn. The primary objective of this work is to identify a set of TALYS nuclear input models that best reproduces the available experimental Sn(p, γ) cross sections. Once such an optimal model combination is established, it is applied to study (p, γ) reactions on neighboring nuclei in the atomic-number range
$ Z=42-56 $ . Additionally, to further test the reliability of the models used for the systematic study presented here, the Sn(p, γ)Sb cross sections have been reproduced using experimentally derived nuclear level density (NLD) and photon strength function (PSF) parameters from the systematic study of Sn isotopes by Markova et al. [26]. This approach ensures that the TALYS calculations are guided by local experimental systematics, allowing a critical assessment of the reliability of the default theoretical inputs employed in TALYS. Such benchmarking provides a consistent basis for extending the analysis to a systematic study over the broader atomic-number range$ Z=42-56 $ within the TALYS framework. It should be noted that a single model combination cannot reproduce (p, γ) cross sections across the entire nuclear chart. This work, therefore, focuses on establishing a reliable modeling framework within a restricted region of nuclei around Sn. Such an approach improves the predictive capability of TALYS in this region, particularly for reactions for which no experimental data are available. In addition to the Sn isotopes, the reactions investigated in the present work include 124Xe(p, γ)125Cs, 92,94,95,97,98,100Mo(p, γ)93,95,96,98,99,101Tc, 96,98,99,104Ru(p, γ)97,99,100,105Rh, 102,104,105Pd(p, γ)103,105,106Ag, 103Rh(p, γ)104Pd, 113,115In(p, γ)114,116Sn, 107,109Ag(p, γ)108,110Cd, 127I(p, γ)128Xe, 106,108,110,112Cd(p, γ)107,109,111,113In, 120Te(p, γ)121I, 121,123Sb(p, γ)122,124Te, and 130Ba(p, γ)131La.The statistical model framework employed in this work is described in Sec. II. Electron screening corrections are discussed in Sec. III. A detailed comparison between the experimental data and theoretical predictions for Sn isotopes and neighboring nuclei is presented in Sec. IV. Finally, Sec. V summarizes the findings of this study.
-
Understanding the formation of nuclei in astrophysical environments requires comprehensive reaction network calculations that incorporate all relevant reactions contributing to the production and destruction of nuclei at temperatures of a few GK. Neutron capture processes (the s- and r-processes) play a fundamental role in nucleosynthesis, accounting for the production of most elements heavier than iron in various stellar scenarios. However, a small group of 35 proton-rich nuclei are not produced by either the s- or r-process. These nuclides, which lie between 74Se and 196Hg, are generally referred to as p-nuclei. Their natural abundances are significantly lower than those of neighboring s- and r-process isotopes in the same mass region.
Early explanations of the p-process were proposed by Burbidge et al. [1] and A. G. W. Cameron [2]. They suggested that p-nuclei are formed by the so-called p-process, either through proton-capture reactions or via a series of photodisintegration reactions, (γ, p), (γ, n), and (γ, α), acting on pre-existing s- or r-process seed nuclei at temperatures on the order of a few GK. These processes were initially associated with the hydrogen-rich envelope of Type II supernova explosions [1]. Subsequently, Woosley and Howard [3] proposed that p-nuclei are primarily produced through photodisintegration in the O/Ne-burning shell of massive stars during core-collapse supernova explosions. Although this model successfully reproduces the solar abundances of many p-nuclei, it significantly underproduces the lighter p-nuclei [3, 4]. Consequently, the astrophysical origin of the p-nuclei remains an open question.
The synthesis of p-nuclei involves a complex reaction network comprising approximately 2,000 stable and unstable nuclei interconnected by more than 20,000 nuclear reactions [5]. Experimental data at astrophysical energies are, however, scarce because of several limitations:
(i) many of the relevant nuclei are unstable and not readily accessible in laboratories,
(ii) stellar temperatures on the order of GK correspond to relatively low interaction energies, at which charged-particle-induced reactions are strongly suppressed by the Coulomb barrier, and
(iii) the γ-ray beams required for photodisintegration studies are available only at a limited number of facilities worldwide. Therefore, (p, γ) cross sections are usually measured in terrestrial laboratories, and the corresponding (γ, p) cross sections are then derived using the principle of detailed balance [6]. Moreover, measuring (p, γ) reactions instead of (γ,p) reactions is advantageous because it minimizes the stellar enhancement effect arising from thermal excitations in the stellar plasma [7].
The abundance pattern of p-nuclei closely follows that of s- and r-process isotopes [8], emphasizing the importance of reliable nuclear data for the seed nuclei involved. Owing to the limited availability of experimental data on radiative proton-capture reactions, most p-process simulations rely heavily on theoretical predictions based on the Hauser–Feshbach statistical model [9]. The key challenge lies in constraining the nuclear input parameters used in the calculations. Therefore, it is essential to examine the reliability of theoretical predictions and to assess the sensitivity of the calculated cross sections to the underlying nuclear ingredients.
In this work, theoretical calculations have been performed for (p, γ) reactions on Sn isotopes and neighboring nuclei. With its magic proton number
$ Z=50 $ , Sn has many stable isotopes in the mass-number range$ A=112-124 $ , making it an ideal testing ground for statistical model calculations. The synthesis of Sn isotopes involves contributions from all three major nucleosynthetic processes: 112,114Sn (p-process), 115Sn (s-, r-, and p-process) [10, 11], 116Sn (s-process), 117,118,119,120,122Sn (s- and r-process), and 124Sn (r-process) [12]. Despite extensive experimental and theoretical efforts, discrepancies between predicted and observed solar abundances of Sn isotopes persist. Nevertheless, the rich isotopic diversity of Sn makes it a promising candidate for investigating nucleosynthesis pathways and isotopic anomalies [13].Although p-nuclei are the primary focus, the study of neighboring nuclei is equally important because nucleosynthesis calculations involve a complex reaction network comprising many isotopes. To ensure reliable abundance predictions, contributions from all relevant reaction pathways must be considered. Since measuring cross sections for many of these reactions remains challenging, theoretical calculations are indispensable. However, reliable predictions of cross sections for experimentally inaccessible reactions require well-constrained nuclear input parameters.
Motivated by these considerations, the present work focuses on a systematic study of (p, γ) reaction cross sections for Sn isotopes and neighboring nuclei in the atomic-number range
$ Z=42-56 $ . Various model combinations within the TALYS framework [14] have been explored to identify a set of nuclear models capable of consistently reproducing the available experimental (p, γ) data in the Sn region. Once validated, these model combinations may subsequently be employed to predict cross sections for reactions that are experimentally challenging or presently inaccessible in the neighboring region.Experimental (p, γ) cross sections for reactions with 112,114,116,119Sn isotopes have been reported in Refs. [15−17]. In all these studies, the measurements were compared with statistical model calculations using the NON-SMOKER (web) database [18]. Although the NON-SMOKER (web) predictions underestimated the astrophysical S-factors for all four reactions, the calculations for 114,116Sn(p, γ)115,117Sb were scaled as a function of energy to improve agreement with the experimental data [16, 17]. Measurements reported by S. Harissopulos et al. [19] for the 116,118Sn(p, γ)117,119Sb reactions in the energy range 2.2−5.2 MeV were found to agree with the TALYS calculations, except for the cross sections at energies ≤ 3.2 MeV. Very recently, the first experimental determination of the 115Sn(p, γ)116Sb cross sections was reported using the activation technique over the energy range 2.42−5.93 MeV [20]. A direct comparison with statistical model calculations demonstrated that TALYS successfully reproduces the measured cross sections, whereas the NON-SMOKER (web) predictions exhibit significant deviations.
Previous studies [21, 22] have investigated the experimental (p, γ) data for Sn isotopes using the TALYS nuclear reaction code. TALYS 1.6 was employed to compute astrophysical S-factors using various optical model potentials (OMPs), including the Koning and Delaroche OMP (KD03) [23] and the microscopic Jeukenne-Lejeune-Mahaux (JLM) potential [24], combined with relativistic mean field (RMF) densities, to reproduce the experimental data [21]. To achieve agreement between the calculated and experimental S-factors, the same scaling function as that used in Ref. [17] was adopted for the Koning and Delaroche OMP (KD03), while the JLM potential was scaled by a factor of 3. Subsequently, TALYS 1.8 calculations were used to investigate the influence of different photon strength function (PSF) models on (p, γ) cross sections for the reactions 112,114,116Sn(p, γ)113,115,117Sb [22]. The latest version, TALYS 2.0, incorporates the phenomenological Simplified Modified Lorentzian (SMLO) PSF developed by Goriely et al. [25], which is now the default PSF model for E1 and M1 γ-ray transitions and is expected to provide improved results.
The present work aims to assess the relative predictive capabilities of TALYS 2.0 and the NON-SMOKER database in reproducing the S-factor values derived from the measured cross sections of (p, γ) reactions on Sn isotopes, namely 112,114,115,116,118,119Sn. The primary objective of this work is to identify a set of TALYS nuclear input models that best reproduces the available experimental Sn(p, γ) cross sections. Once such an optimal model combination is established, it is applied to study (p, γ) reactions on neighboring nuclei in the atomic-number range
$ Z=42-56 $ . Additionally, to further test the reliability of the models used for the systematic study presented here, the Sn(p, γ)Sb cross sections have been reproduced using experimentally derived nuclear level density (NLD) and photon strength function (PSF) parameters from the systematic study of Sn isotopes by Markova et al. [26]. This approach ensures that the TALYS calculations are guided by local experimental systematics, allowing a critical assessment of the reliability of the default theoretical inputs employed in TALYS. Such benchmarking provides a consistent basis for extending the analysis to a systematic study over the broader atomic-number range$ Z=42-56 $ within the TALYS framework. It should be noted that a single model combination cannot reproduce (p, γ) cross sections across the entire nuclear chart. This work, therefore, focuses on establishing a reliable modeling framework within a restricted region of nuclei around Sn. Such an approach improves the predictive capability of TALYS in this region, particularly for reactions for which no experimental data are available. In addition to the Sn isotopes, the reactions investigated in the present work include 124Xe(p, γ)125Cs, 92,94,95,97,98,100Mo(p, γ)93,95,96,98,99,101Tc, 96,98,99,104Ru(p, γ)97,99,100,105Rh, 102,104,105Pd(p, γ)103,105,106Ag, 103Rh(p, γ)104Pd, 113,115In(p, γ)114,116Sn, 107,109Ag(p, γ)108,110Cd, 127I(p, γ)128Xe, 106,108,110,112Cd(p, γ)107,109,111,113In, 120Te(p, γ)121I, 121,123Sb(p, γ)122,124Te, and 130Ba(p, γ)131La.The statistical model framework employed in this work is described in Sec. II. Electron screening corrections are discussed in Sec. III. A detailed comparison between the experimental data and theoretical predictions for Sn isotopes and neighboring nuclei is presented in Sec. IV. Finally, Sec. V summarizes the findings of this study.
-
Understanding the formation of nuclei in astrophysical environments requires comprehensive reaction network calculations that incorporate all relevant reactions contributing to the production and destruction of nuclei at temperatures of a few GK. Neutron capture processes (the s- and r-processes) play a fundamental role in nucleosynthesis, accounting for the production of most elements heavier than iron in various stellar scenarios. However, a small group of 35 proton-rich nuclei are not produced by either the s- or r-process. These nuclides, which lie between 74Se and 196Hg, are generally referred to as p-nuclei. Their natural abundances are significantly lower than those of neighboring s- and r-process isotopes in the same mass region.
Early explanations of the p-process were proposed by Burbidge et al. [1] and A. G. W. Cameron [2]. They suggested that p-nuclei are formed by the so-called p-process, either through proton-capture reactions or via a series of photodisintegration reactions, (γ, p), (γ, n), and (γ, α), acting on pre-existing s- or r-process seed nuclei at temperatures on the order of a few GK. These processes were initially associated with the hydrogen-rich envelope of Type II supernova explosions [1]. Subsequently, Woosley and Howard [3] proposed that p-nuclei are primarily produced through photodisintegration in the O/Ne-burning shell of massive stars during core-collapse supernova explosions. Although this model successfully reproduces the solar abundances of many p-nuclei, it significantly underproduces the lighter p-nuclei [3, 4]. Consequently, the astrophysical origin of the p-nuclei remains an open question.
The synthesis of p-nuclei involves a complex reaction network comprising approximately 2,000 stable and unstable nuclei interconnected by more than 20,000 nuclear reactions [5]. Experimental data at astrophysical energies are, however, scarce because of several limitations:
(i) many of the relevant nuclei are unstable and not readily accessible in laboratories,
(ii) stellar temperatures on the order of GK correspond to relatively low interaction energies, at which charged-particle-induced reactions are strongly suppressed by the Coulomb barrier, and
(iii) the γ-ray beams required for photodisintegration studies are available only at a limited number of facilities worldwide. Therefore, (p, γ) cross sections are usually measured in terrestrial laboratories, and the corresponding (γ, p) cross sections are then derived using the principle of detailed balance [6]. Moreover, measuring (p, γ) reactions instead of (γ,p) reactions is advantageous because it minimizes the stellar enhancement effect arising from thermal excitations in the stellar plasma [7].
The abundance pattern of p-nuclei closely follows that of s- and r-process isotopes [8], emphasizing the importance of reliable nuclear data for the seed nuclei involved. Owing to the limited availability of experimental data on radiative proton-capture reactions, most p-process simulations rely heavily on theoretical predictions based on the Hauser–Feshbach statistical model [9]. The key challenge lies in constraining the nuclear input parameters used in the calculations. Therefore, it is essential to examine the reliability of theoretical predictions and to assess the sensitivity of the calculated cross sections to the underlying nuclear ingredients.
In this work, theoretical calculations have been performed for (p, γ) reactions on Sn isotopes and neighboring nuclei. With its magic proton number
$ Z=50 $ , Sn has many stable isotopes in the mass-number range$ A=112-124 $ , making it an ideal testing ground for statistical model calculations. The synthesis of Sn isotopes involves contributions from all three major nucleosynthetic processes: 112,114Sn (p-process), 115Sn (s-, r-, and p-process) [10, 11], 116Sn (s-process), 117,118,119,120,122Sn (s- and r-process), and 124Sn (r-process) [12]. Despite extensive experimental and theoretical efforts, discrepancies between predicted and observed solar abundances of Sn isotopes persist. Nevertheless, the rich isotopic diversity of Sn makes it a promising candidate for investigating nucleosynthesis pathways and isotopic anomalies [13].Although p-nuclei are the primary focus, the study of neighboring nuclei is equally important because nucleosynthesis calculations involve a complex reaction network comprising many isotopes. To ensure reliable abundance predictions, contributions from all relevant reaction pathways must be considered. Since measuring cross sections for many of these reactions remains challenging, theoretical calculations are indispensable. However, reliable predictions of cross sections for experimentally inaccessible reactions require well-constrained nuclear input parameters.
Motivated by these considerations, the present work focuses on a systematic study of (p, γ) reaction cross sections for Sn isotopes and neighboring nuclei in the atomic-number range
$ Z=42-56 $ . Various model combinations within the TALYS framework [14] have been explored to identify a set of nuclear models capable of consistently reproducing the available experimental (p, γ) data in the Sn region. Once validated, these model combinations may subsequently be employed to predict cross sections for reactions that are experimentally challenging or presently inaccessible in the neighboring region.Experimental (p, γ) cross sections for reactions with 112,114,116,119Sn isotopes have been reported in Refs. [15−17]. In all these studies, the measurements were compared with statistical model calculations using the NON-SMOKER (web) database [18]. Although the NON-SMOKER (web) predictions underestimated the astrophysical S-factors for all four reactions, the calculations for 114,116Sn(p, γ)115,117Sb were scaled as a function of energy to improve agreement with the experimental data [16, 17]. Measurements reported by S. Harissopulos et al. [19] for the 116,118Sn(p, γ)117,119Sb reactions in the energy range 2.2−5.2 MeV were found to agree with the TALYS calculations, except for the cross sections at energies ≤ 3.2 MeV. Very recently, the first experimental determination of the 115Sn(p, γ)116Sb cross sections was reported using the activation technique over the energy range 2.42−5.93 MeV [20]. A direct comparison with statistical model calculations demonstrated that TALYS successfully reproduces the measured cross sections, whereas the NON-SMOKER (web) predictions exhibit significant deviations.
Previous studies [21, 22] have investigated the experimental (p, γ) data for Sn isotopes using the TALYS nuclear reaction code. TALYS 1.6 was employed to compute astrophysical S-factors using various optical model potentials (OMPs), including the Koning and Delaroche OMP (KD03) [23] and the microscopic Jeukenne-Lejeune-Mahaux (JLM) potential [24], combined with relativistic mean field (RMF) densities, to reproduce the experimental data [21]. To achieve agreement between the calculated and experimental S-factors, the same scaling function as that used in Ref. [17] was adopted for the Koning and Delaroche OMP (KD03), while the JLM potential was scaled by a factor of 3. Subsequently, TALYS 1.8 calculations were used to investigate the influence of different photon strength function (PSF) models on (p, γ) cross sections for the reactions 112,114,116Sn(p, γ)113,115,117Sb [22]. The latest version, TALYS 2.0, incorporates the phenomenological Simplified Modified Lorentzian (SMLO) PSF developed by Goriely et al. [25], which is now the default PSF model for E1 and M1 γ-ray transitions and is expected to provide improved results.
The present work aims to assess the relative predictive capabilities of TALYS 2.0 and the NON-SMOKER database in reproducing the S-factor values derived from the measured cross sections of (p, γ) reactions on Sn isotopes, namely 112,114,115,116,118,119Sn. The primary objective of this work is to identify a set of TALYS nuclear input models that best reproduces the available experimental Sn(p, γ) cross sections. Once such an optimal model combination is established, it is applied to study (p, γ) reactions on neighboring nuclei in the atomic-number range
$ Z=42-56 $ . Additionally, to further test the reliability of the models used for the systematic study presented here, the Sn(p, γ)Sb cross sections have been reproduced using experimentally derived nuclear level density (NLD) and photon strength function (PSF) parameters from the systematic study of Sn isotopes by Markova et al. [26]. This approach ensures that the TALYS calculations are guided by local experimental systematics, allowing a critical assessment of the reliability of the default theoretical inputs employed in TALYS. Such benchmarking provides a consistent basis for extending the analysis to a systematic study over the broader atomic-number range$ Z=42-56 $ within the TALYS framework. It should be noted that a single model combination cannot reproduce (p, γ) cross sections across the entire nuclear chart. This work, therefore, focuses on establishing a reliable modeling framework within a restricted region of nuclei around Sn. Such an approach improves the predictive capability of TALYS in this region, particularly for reactions for which no experimental data are available. In addition to the Sn isotopes, the reactions investigated in the present work include 124Xe(p, γ)125Cs, 92,94,95,97,98,100Mo(p, γ)93,95,96,98,99,101Tc, 96,98,99,104Ru(p, γ)97,99,100,105Rh, 102,104,105Pd(p, γ)103,105,106Ag, 103Rh(p, γ)104Pd, 113,115In(p, γ)114,116Sn, 107,109Ag(p, γ)108,110Cd, 127I(p, γ)128Xe, 106,108,110,112Cd(p, γ)107,109,111,113In, 120Te(p, γ)121I, 121,123Sb(p, γ)122,124Te, and 130Ba(p, γ)131La.The statistical model framework employed in this work is described in Sec. II. Electron screening corrections are discussed in Sec. III. A detailed comparison between the experimental data and theoretical predictions for Sn isotopes and neighboring nuclei is presented in Sec. IV. Finally, Sec. V summarizes the findings of this study.
-
Understanding the formation of nuclei in astrophysical environments requires comprehensive reaction network calculations that incorporate all relevant reactions contributing to the production and destruction of nuclei at temperatures of a few GK. Neutron capture processes (the s- and r-processes) play a fundamental role in nucleosynthesis, accounting for the production of most elements heavier than iron in various stellar scenarios. However, a small group of 35 proton-rich nuclei are not produced by either the s- or r-process. These nuclides, which lie between 74Se and 196Hg, are generally referred to as p-nuclei. Their natural abundances are significantly lower than those of neighboring s- and r-process isotopes in the same mass region.
Early explanations of the p-process were proposed by Burbidge et al. [1] and A. G. W. Cameron [2]. They suggested that p-nuclei are formed by the so-called p-process, either through proton-capture reactions or via a series of photodisintegration reactions, (γ, p), (γ, n), and (γ, α), acting on pre-existing s- or r-process seed nuclei at temperatures on the order of a few GK. These processes were initially associated with the hydrogen-rich envelope of Type II supernova explosions [1]. Subsequently, Woosley and Howard [3] proposed that p-nuclei are primarily produced through photodisintegration in the O/Ne-burning shell of massive stars during core-collapse supernova explosions. Although this model successfully reproduces the solar abundances of many p-nuclei, it significantly underproduces the lighter p-nuclei [3, 4]. Consequently, the astrophysical origin of the p-nuclei remains an open question.
The synthesis of p-nuclei involves a complex reaction network comprising approximately 2,000 stable and unstable nuclei interconnected by more than 20,000 nuclear reactions [5]. Experimental data at astrophysical energies are, however, scarce because of several limitations:
(i) many of the relevant nuclei are unstable and not readily accessible in laboratories,
(ii) stellar temperatures on the order of GK correspond to relatively low interaction energies, at which charged-particle-induced reactions are strongly suppressed by the Coulomb barrier, and
(iii) the γ-ray beams required for photodisintegration studies are available only at a limited number of facilities worldwide. Therefore, (p, γ) cross sections are usually measured in terrestrial laboratories, and the corresponding (γ, p) cross sections are then derived using the principle of detailed balance [6]. Moreover, measuring (p, γ) reactions instead of (γ,p) reactions is advantageous because it minimizes the stellar enhancement effect arising from thermal excitations in the stellar plasma [7].
The abundance pattern of p-nuclei closely follows that of s- and r-process isotopes [8], emphasizing the importance of reliable nuclear data for the seed nuclei involved. Owing to the limited availability of experimental data on radiative proton-capture reactions, most p-process simulations rely heavily on theoretical predictions based on the Hauser–Feshbach statistical model [9]. The key challenge lies in constraining the nuclear input parameters used in the calculations. Therefore, it is essential to examine the reliability of theoretical predictions and to assess the sensitivity of the calculated cross sections to the underlying nuclear ingredients.
In this work, theoretical calculations have been performed for (p, γ) reactions on Sn isotopes and neighboring nuclei. With its magic proton number
$ Z=50 $ , Sn has many stable isotopes in the mass-number range$ A=112-124 $ , making it an ideal testing ground for statistical model calculations. The synthesis of Sn isotopes involves contributions from all three major nucleosynthetic processes: 112,114Sn (p-process), 115Sn (s-, r-, and p-process) [10, 11], 116Sn (s-process), 117,118,119,120,122Sn (s- and r-process), and 124Sn (r-process) [12]. Despite extensive experimental and theoretical efforts, discrepancies between predicted and observed solar abundances of Sn isotopes persist. Nevertheless, the rich isotopic diversity of Sn makes it a promising candidate for investigating nucleosynthesis pathways and isotopic anomalies [13].Although p-nuclei are the primary focus, the study of neighboring nuclei is equally important because nucleosynthesis calculations involve a complex reaction network comprising many isotopes. To ensure reliable abundance predictions, contributions from all relevant reaction pathways must be considered. Since measuring cross sections for many of these reactions remains challenging, theoretical calculations are indispensable. However, reliable predictions of cross sections for experimentally inaccessible reactions require well-constrained nuclear input parameters.
Motivated by these considerations, the present work focuses on a systematic study of (p, γ) reaction cross sections for Sn isotopes and neighboring nuclei in the atomic-number range
$ Z=42-56 $ . Various model combinations within the TALYS framework [14] have been explored to identify a set of nuclear models capable of consistently reproducing the available experimental (p, γ) data in the Sn region. Once validated, these model combinations may subsequently be employed to predict cross sections for reactions that are experimentally challenging or presently inaccessible in the neighboring region.Experimental (p, γ) cross sections for reactions with 112,114,116,119Sn isotopes have been reported in Refs. [15−17]. In all these studies, the measurements were compared with statistical model calculations using the NON-SMOKER (web) database [18]. Although the NON-SMOKER (web) predictions underestimated the astrophysical S-factors for all four reactions, the calculations for 114,116Sn(p, γ)115,117Sb were scaled as a function of energy to improve agreement with the experimental data [16, 17]. Measurements reported by S. Harissopulos et al. [19] for the 116,118Sn(p, γ)117,119Sb reactions in the energy range 2.2−5.2 MeV were found to agree with the TALYS calculations, except for the cross sections at energies ≤ 3.2 MeV. Very recently, the first experimental determination of the 115Sn(p, γ)116Sb cross sections was reported using the activation technique over the energy range 2.42−5.93 MeV [20]. A direct comparison with statistical model calculations demonstrated that TALYS successfully reproduces the measured cross sections, whereas the NON-SMOKER (web) predictions exhibit significant deviations.
Previous studies [21, 22] have investigated the experimental (p, γ) data for Sn isotopes using the TALYS nuclear reaction code. TALYS 1.6 was employed to compute astrophysical S-factors using various optical model potentials (OMPs), including the Koning and Delaroche OMP (KD03) [23] and the microscopic Jeukenne-Lejeune-Mahaux (JLM) potential [24], combined with relativistic mean field (RMF) densities, to reproduce the experimental data [21]. To achieve agreement between the calculated and experimental S-factors, the same scaling function as that used in Ref. [17] was adopted for the Koning and Delaroche OMP (KD03), while the JLM potential was scaled by a factor of 3. Subsequently, TALYS 1.8 calculations were used to investigate the influence of different photon strength function (PSF) models on (p, γ) cross sections for the reactions 112,114,116Sn(p, γ)113,115,117Sb [22]. The latest version, TALYS 2.0, incorporates the phenomenological Simplified Modified Lorentzian (SMLO) PSF developed by Goriely et al. [25], which is now the default PSF model for E1 and M1 γ-ray transitions and is expected to provide improved results.
The present work aims to assess the relative predictive capabilities of TALYS 2.0 and the NON-SMOKER database in reproducing the S-factor values derived from the measured cross sections of (p, γ) reactions on Sn isotopes, namely 112,114,115,116,118,119Sn. The primary objective of this work is to identify a set of TALYS nuclear input models that best reproduces the available experimental Sn(p, γ) cross sections. Once such an optimal model combination is established, it is applied to study (p, γ) reactions on neighboring nuclei in the atomic-number range
$ Z=42-56 $ . Additionally, to further test the reliability of the models used for the systematic study presented here, the Sn(p, γ)Sb cross sections have been reproduced using experimentally derived nuclear level density (NLD) and photon strength function (PSF) parameters from the systematic study of Sn isotopes by Markova et al. [26]. This approach ensures that the TALYS calculations are guided by local experimental systematics, allowing a critical assessment of the reliability of the default theoretical inputs employed in TALYS. Such benchmarking provides a consistent basis for extending the analysis to a systematic study over the broader atomic-number range$ Z=42-56 $ within the TALYS framework. It should be noted that a single model combination cannot reproduce (p, γ) cross sections across the entire nuclear chart. This work, therefore, focuses on establishing a reliable modeling framework within a restricted region of nuclei around Sn. Such an approach improves the predictive capability of TALYS in this region, particularly for reactions for which no experimental data are available. In addition to the Sn isotopes, the reactions investigated in the present work include 124Xe(p, γ)125Cs, 92,94,95,97,98,100Mo(p, γ)93,95,96,98,99,101Tc, 96,98,99,104Ru(p, γ)97,99,100,105Rh, 102,104,105Pd(p, γ)103,105,106Ag, 103Rh(p, γ)104Pd, 113,115In(p, γ)114,116Sn, 107,109Ag(p, γ)108,110Cd, 127I(p, γ)128Xe, 106,108,110,112Cd(p, γ)107,109,111,113In, 120Te(p, γ)121I, 121,123Sb(p, γ)122,124Te, and 130Ba(p, γ)131La.The statistical model framework employed in this work is described in Sec. II. Electron screening corrections are discussed in Sec. III. A detailed comparison between the experimental data and theoretical predictions for Sn isotopes and neighboring nuclei is presented in Sec. IV. Finally, Sec. V summarizes the findings of this study.
-
Understanding the formation of nuclei in astrophysical environments requires comprehensive reaction network calculations that incorporate all relevant reactions contributing to the production and destruction of nuclei at temperatures of a few GK. Neutron capture processes (the s- and r-processes) play a fundamental role in nucleosynthesis, accounting for the production of most elements heavier than iron in various stellar scenarios. However, a small group of 35 proton-rich nuclei are not produced by either the s- or r-process. These nuclides, which lie between 74Se and 196Hg, are generally referred to as p-nuclei. Their natural abundances are significantly lower than those of neighboring s- and r-process isotopes in the same mass region.
Early explanations of the p-process were proposed by Burbidge et al. [1] and A. G. W. Cameron [2]. They suggested that p-nuclei are formed by the so-called p-process, either through proton-capture reactions or via a series of photodisintegration reactions, (γ, p), (γ, n), and (γ, α), acting on pre-existing s- or r-process seed nuclei at temperatures on the order of a few GK. These processes were initially associated with the hydrogen-rich envelope of Type II supernova explosions [1]. Subsequently, Woosley and Howard [3] proposed that p-nuclei are primarily produced through photodisintegration in the O/Ne-burning shell of massive stars during core-collapse supernova explosions. Although this model successfully reproduces the solar abundances of many p-nuclei, it significantly underproduces the lighter p-nuclei [3, 4]. Consequently, the astrophysical origin of the p-nuclei remains an open question.
The synthesis of p-nuclei involves a complex reaction network comprising approximately 2,000 stable and unstable nuclei interconnected by more than 20,000 nuclear reactions [5]. Experimental data at astrophysical energies are, however, scarce because of several limitations:
(i) many of the relevant nuclei are unstable and not readily accessible in laboratories,
(ii) stellar temperatures on the order of GK correspond to relatively low interaction energies, at which charged-particle-induced reactions are strongly suppressed by the Coulomb barrier, and
(iii) the γ-ray beams required for photodisintegration studies are available only at a limited number of facilities worldwide. Therefore, (p, γ) cross sections are usually measured in terrestrial laboratories, and the corresponding (γ, p) cross sections are then derived using the principle of detailed balance [6]. Moreover, measuring (p, γ) reactions instead of (γ,p) reactions is advantageous because it minimizes the stellar enhancement effect arising from thermal excitations in the stellar plasma [7].
The abundance pattern of p-nuclei closely follows that of s- and r-process isotopes [8], emphasizing the importance of reliable nuclear data for the seed nuclei involved. Owing to the limited availability of experimental data on radiative proton-capture reactions, most p-process simulations rely heavily on theoretical predictions based on the Hauser–Feshbach statistical model [9]. The key challenge lies in constraining the nuclear input parameters used in the calculations. Therefore, it is essential to examine the reliability of theoretical predictions and to assess the sensitivity of the calculated cross sections to the underlying nuclear ingredients.
In this work, theoretical calculations have been performed for (p, γ) reactions on Sn isotopes and neighboring nuclei. With its magic proton number
$ Z=50 $ , Sn has many stable isotopes in the mass-number range$ A=112-124 $ , making it an ideal testing ground for statistical model calculations. The synthesis of Sn isotopes involves contributions from all three major nucleosynthetic processes: 112,114Sn (p-process), 115Sn (s-, r-, and p-process) [10, 11], 116Sn (s-process), 117,118,119,120,122Sn (s- and r-process), and 124Sn (r-process) [12]. Despite extensive experimental and theoretical efforts, discrepancies between predicted and observed solar abundances of Sn isotopes persist. Nevertheless, the rich isotopic diversity of Sn makes it a promising candidate for investigating nucleosynthesis pathways and isotopic anomalies [13].Although p-nuclei are the primary focus, the study of neighboring nuclei is equally important because nucleosynthesis calculations involve a complex reaction network comprising many isotopes. To ensure reliable abundance predictions, contributions from all relevant reaction pathways must be considered. Since measuring cross sections for many of these reactions remains challenging, theoretical calculations are indispensable. However, reliable predictions of cross sections for experimentally inaccessible reactions require well-constrained nuclear input parameters.
Motivated by these considerations, the present work focuses on a systematic study of (p, γ) reaction cross sections for Sn isotopes and neighboring nuclei in the atomic-number range
$ Z=42-56 $ . Various model combinations within the TALYS framework [14] have been explored to identify a set of nuclear models capable of consistently reproducing the available experimental (p, γ) data in the Sn region. Once validated, these model combinations may subsequently be employed to predict cross sections for reactions that are experimentally challenging or presently inaccessible in the neighboring region.Experimental (p, γ) cross sections for reactions with 112,114,116,119Sn isotopes have been reported in Refs. [15−17]. In all these studies, the measurements were compared with statistical model calculations using the NON-SMOKER (web) database [18]. Although the NON-SMOKER (web) predictions underestimated the astrophysical S-factors for all four reactions, the calculations for 114,116Sn(p, γ)115,117Sb were scaled as a function of energy to improve agreement with the experimental data [16, 17]. Measurements reported by S. Harissopulos et al. [19] for the 116,118Sn(p, γ)117,119Sb reactions in the energy range 2.2−5.2 MeV were found to agree with the TALYS calculations, except for the cross sections at energies ≤ 3.2 MeV. Very recently, the first experimental determination of the 115Sn(p, γ)116Sb cross sections was reported using the activation technique over the energy range 2.42−5.93 MeV [20]. A direct comparison with statistical model calculations demonstrated that TALYS successfully reproduces the measured cross sections, whereas the NON-SMOKER (web) predictions exhibit significant deviations.
Previous studies [21, 22] have investigated the experimental (p, γ) data for Sn isotopes using the TALYS nuclear reaction code. TALYS 1.6 was employed to compute astrophysical S-factors using various optical model potentials (OMPs), including the Koning and Delaroche OMP (KD03) [23] and the microscopic Jeukenne-Lejeune-Mahaux (JLM) potential [24], combined with relativistic mean field (RMF) densities, to reproduce the experimental data [21]. To achieve agreement between the calculated and experimental S-factors, the same scaling function as that used in Ref. [17] was adopted for the Koning and Delaroche OMP (KD03), while the JLM potential was scaled by a factor of 3. Subsequently, TALYS 1.8 calculations were used to investigate the influence of different photon strength function (PSF) models on (p, γ) cross sections for the reactions 112,114,116Sn(p, γ)113,115,117Sb [22]. The latest version, TALYS 2.0, incorporates the phenomenological Simplified Modified Lorentzian (SMLO) PSF developed by Goriely et al. [25], which is now the default PSF model for E1 and M1 γ-ray transitions and is expected to provide improved results.
The present work aims to assess the relative predictive capabilities of TALYS 2.0 and the NON-SMOKER database in reproducing the S-factor values derived from the measured cross sections of (p, γ) reactions on Sn isotopes, namely 112,114,115,116,118,119Sn. The primary objective of this work is to identify a set of TALYS nuclear input models that best reproduces the available experimental Sn(p, γ) cross sections. Once such an optimal model combination is established, it is applied to study (p, γ) reactions on neighboring nuclei in the atomic-number range
$ Z=42-56 $ . Additionally, to further test the reliability of the models used for the systematic study presented here, the Sn(p, γ)Sb cross sections have been reproduced using experimentally derived nuclear level density (NLD) and photon strength function (PSF) parameters from the systematic study of Sn isotopes by Markova et al. [26]. This approach ensures that the TALYS calculations are guided by local experimental systematics, allowing a critical assessment of the reliability of the default theoretical inputs employed in TALYS. Such benchmarking provides a consistent basis for extending the analysis to a systematic study over the broader atomic-number range$ Z=42-56 $ within the TALYS framework. It should be noted that a single model combination cannot reproduce (p, γ) cross sections across the entire nuclear chart. This work, therefore, focuses on establishing a reliable modeling framework within a restricted region of nuclei around Sn. Such an approach improves the predictive capability of TALYS in this region, particularly for reactions for which no experimental data are available. In addition to the Sn isotopes, the reactions investigated in the present work include 124Xe(p, γ)125Cs, 92,94,95,97,98,100Mo(p, γ)93,95,96,98,99,101Tc, 96,98,99,104Ru(p, γ)97,99,100,105Rh, 102,104,105Pd(p, γ)103,105,106Ag, 103Rh(p, γ)104Pd, 113,115In(p, γ)114,116Sn, 107,109Ag(p, γ)108,110Cd, 127I(p, γ)128Xe, 106,108,110,112Cd(p, γ)107,109,111,113In, 120Te(p, γ)121I, 121,123Sb(p, γ)122,124Te, and 130Ba(p, γ)131La.The statistical model framework employed in this work is described in Sec. II. Electron screening corrections are discussed in Sec. III. A detailed comparison between the experimental data and theoretical predictions for Sn isotopes and neighboring nuclei is presented in Sec. IV. Finally, Sec. V summarizes the findings of this study.
-
Statistical concepts in nuclear physics are essential for describing the nucleus as a many-body system capable of exhibiting various configurations, even at relatively low excitation energies. In astrophysical nucleosynthesis, abundance calculations depend critically on reaction rates, particularly those of capture reactions, which are key nuclear inputs. Intermediate- and heavy-mass nuclei formed in explosive scenarios exhibit high densities of excited states, necessitating a statistical approach to compound nuclear reactions. This approach describes the average behavior and decay of an equilibrated compound nucleus based on the available excitation energy.
Nuclear reaction simulation platforms, such as TALYS [14] and NON-SMOKER [18], simplify complex reaction network calculations using the Hauser-Feshbach (HF) statistical model. This model computes reaction cross sections averaged over numerous excited states in the compound nucleus while accounting for angular momentum correlations between incident and outgoing channels. The resulting cross sections and reaction rates provide a comprehensive description of all energetically allowed decay modes of the compound nucleus and are of central importance for astrophysical applications.
In this work, the code TALYS [14] is used as the platform to calculate the reaction cross sections, from which the corresponding S-factors (see Sec. IV) are derived. Within the HF framework, the cross section for the reaction a+A →C*→b+B is expressed as the product of the compound nucleus formation probability and its decay probability into a specific channel. The essential nuclear inputs required for these calculations are nuclear masses, nuclear level densities (NLDs), photon strength functions (PSFs), and nucleus–nucleus optical model potentials (OMPs).
TALYS is applicable over an incident energy range from 1 keV to 200 MeV for projectiles such as protons, neutrons, deuterons, tritons, 3He, and alpha particles, and for target nuclei with mass numbers
$ 12 \leq A \leq 339 $ . Unlike TALYS, the NON-SMOKER (web) nuclear code is not open-source software, although its database is freely accessible online. Although both TALYS and NON-SMOKER (web) require basic information about the projectile and target nucleus, NON-SMOKER additionally requires selection of a mass model, whereas TALYS requires specification of the energy range of interest. Differences between TALYS and NON-SMOKER (web) predictions arise from several factors, including the numerical implementation of the Hauser-Feshbach equations, the choice of nuclear input models, and the inclusion of additional reaction mechanisms. For example, TALYS incorporates direct and pre-equilibrium components, whereas the NON-SMOKER database primarily considers compound nuclear reactions. Moreover, TALYS provides a wide range of phenomenological and microscopic models for NLDs, PSFs, and OMPs, whereas NON-SMOKER (web) employs fixed model prescriptions. -
Statistical concepts in nuclear physics are essential for describing the nucleus as a many-body system capable of exhibiting various configurations, even at relatively low excitation energies. In astrophysical nucleosynthesis, abundance calculations depend critically on reaction rates, particularly those of capture reactions, which are key nuclear inputs. Intermediate- and heavy-mass nuclei formed in explosive scenarios exhibit high densities of excited states, necessitating a statistical approach to compound nuclear reactions. This approach describes the average behavior and decay of an equilibrated compound nucleus based on the available excitation energy.
Nuclear reaction simulation platforms, such as TALYS [14] and NON-SMOKER [18], simplify complex reaction network calculations using the Hauser-Feshbach (HF) statistical model. This model computes reaction cross sections averaged over numerous excited states in the compound nucleus while accounting for angular momentum correlations between incident and outgoing channels. The resulting cross sections and reaction rates provide a comprehensive description of all energetically allowed decay modes of the compound nucleus and are of central importance for astrophysical applications.
In this work, the code TALYS [14] is used as the platform to calculate the reaction cross sections, from which the corresponding S-factors (see Sec. IV) are derived. Within the HF framework, the cross section for the reaction a+A →C*→b+B is expressed as the product of the compound nucleus formation probability and its decay probability into a specific channel. The essential nuclear inputs required for these calculations are nuclear masses, nuclear level densities (NLDs), photon strength functions (PSFs), and nucleus–nucleus optical model potentials (OMPs).
TALYS is applicable over an incident energy range from 1 keV to 200 MeV for projectiles such as protons, neutrons, deuterons, tritons, 3He, and alpha particles, and for target nuclei with mass numbers
$ 12 \leq A \leq 339 $ . Unlike TALYS, the NON-SMOKER (web) nuclear code is not open-source software, although its database is freely accessible online. Although both TALYS and NON-SMOKER (web) require basic information about the projectile and target nucleus, NON-SMOKER additionally requires selection of a mass model, whereas TALYS requires specification of the energy range of interest. Differences between TALYS and NON-SMOKER (web) predictions arise from several factors, including the numerical implementation of the Hauser-Feshbach equations, the choice of nuclear input models, and the inclusion of additional reaction mechanisms. For example, TALYS incorporates direct and pre-equilibrium components, whereas the NON-SMOKER database primarily considers compound nuclear reactions. Moreover, TALYS provides a wide range of phenomenological and microscopic models for NLDs, PSFs, and OMPs, whereas NON-SMOKER (web) employs fixed model prescriptions. -
Statistical concepts in nuclear physics are essential for describing the nucleus as a many-body system capable of exhibiting various configurations, even at relatively low excitation energies. In astrophysical nucleosynthesis, abundance calculations depend critically on reaction rates, particularly those of capture reactions, which are key nuclear inputs. Intermediate- and heavy-mass nuclei formed in explosive scenarios exhibit high densities of excited states, necessitating a statistical approach to compound nuclear reactions. This approach describes the average behavior and decay of an equilibrated compound nucleus based on the available excitation energy.
Nuclear reaction simulation platforms, such as TALYS [14] and NON-SMOKER [18], simplify complex reaction network calculations using the Hauser-Feshbach (HF) statistical model. This model computes reaction cross sections averaged over numerous excited states in the compound nucleus while accounting for angular momentum correlations between incident and outgoing channels. The resulting cross sections and reaction rates provide a comprehensive description of all energetically allowed decay modes of the compound nucleus and are of central importance for astrophysical applications.
In this work, the code TALYS [14] is used as the platform to calculate the reaction cross sections, from which the corresponding S-factors (see Sec. IV) are derived. Within the HF framework, the cross section for the reaction a+A →C*→b+B is expressed as the product of the compound nucleus formation probability and its decay probability into a specific channel. The essential nuclear inputs required for these calculations are nuclear masses, nuclear level densities (NLDs), photon strength functions (PSFs), and nucleus–nucleus optical model potentials (OMPs).
TALYS is applicable over an incident energy range from 1 keV to 200 MeV for projectiles such as protons, neutrons, deuterons, tritons, 3He, and alpha particles, and for target nuclei with mass numbers
$ 12 \leq A \leq 339 $ . Unlike TALYS, the NON-SMOKER (web) nuclear code is not open-source software, although its database is freely accessible online. Although both TALYS and NON-SMOKER (web) require basic information about the projectile and target nucleus, NON-SMOKER additionally requires selection of a mass model, whereas TALYS requires specification of the energy range of interest. Differences between TALYS and NON-SMOKER (web) predictions arise from several factors, including the numerical implementation of the Hauser-Feshbach equations, the choice of nuclear input models, and the inclusion of additional reaction mechanisms. For example, TALYS incorporates direct and pre-equilibrium components, whereas the NON-SMOKER database primarily considers compound nuclear reactions. Moreover, TALYS provides a wide range of phenomenological and microscopic models for NLDs, PSFs, and OMPs, whereas NON-SMOKER (web) employs fixed model prescriptions. -
Statistical concepts in nuclear physics are essential for describing the nucleus as a many-body system capable of exhibiting various configurations, even at relatively low excitation energies. In astrophysical nucleosynthesis, abundance calculations depend critically on reaction rates, particularly those of capture reactions, which are key nuclear inputs. Intermediate- and heavy-mass nuclei formed in explosive scenarios exhibit high densities of excited states, necessitating a statistical approach to compound nuclear reactions. This approach describes the average behavior and decay of an equilibrated compound nucleus based on the available excitation energy.
Nuclear reaction simulation platforms, such as TALYS [14] and NON-SMOKER [18], simplify complex reaction network calculations using the Hauser-Feshbach (HF) statistical model. This model computes reaction cross sections averaged over numerous excited states in the compound nucleus while accounting for angular momentum correlations between incident and outgoing channels. The resulting cross sections and reaction rates provide a comprehensive description of all energetically allowed decay modes of the compound nucleus and are of central importance for astrophysical applications.
In this work, the code TALYS [14] is used as the platform to calculate the reaction cross sections, from which the corresponding S-factors (see Sec. IV) are derived. Within the HF framework, the cross section for the reaction a+A →C*→b+B is expressed as the product of the compound nucleus formation probability and its decay probability into a specific channel. The essential nuclear inputs required for these calculations are nuclear masses, nuclear level densities (NLDs), photon strength functions (PSFs), and nucleus–nucleus optical model potentials (OMPs).
TALYS is applicable over an incident energy range from 1 keV to 200 MeV for projectiles such as protons, neutrons, deuterons, tritons, 3He, and alpha particles, and for target nuclei with mass numbers
$ 12 \leq A \leq 339 $ . Unlike TALYS, the NON-SMOKER (web) nuclear code is not open-source software, although its database is freely accessible online. Although both TALYS and NON-SMOKER (web) require basic information about the projectile and target nucleus, NON-SMOKER additionally requires selection of a mass model, whereas TALYS requires specification of the energy range of interest. Differences between TALYS and NON-SMOKER (web) predictions arise from several factors, including the numerical implementation of the Hauser-Feshbach equations, the choice of nuclear input models, and the inclusion of additional reaction mechanisms. For example, TALYS incorporates direct and pre-equilibrium components, whereas the NON-SMOKER database primarily considers compound nuclear reactions. Moreover, TALYS provides a wide range of phenomenological and microscopic models for NLDs, PSFs, and OMPs, whereas NON-SMOKER (web) employs fixed model prescriptions. -
Statistical concepts in nuclear physics are essential for describing the nucleus as a many-body system capable of exhibiting various configurations, even at relatively low excitation energies. In astrophysical nucleosynthesis, abundance calculations depend critically on reaction rates, particularly those of capture reactions, which are key nuclear inputs. Intermediate- and heavy-mass nuclei formed in explosive scenarios exhibit high densities of excited states, necessitating a statistical approach to compound nuclear reactions. This approach describes the average behavior and decay of an equilibrated compound nucleus based on the available excitation energy.
Nuclear reaction simulation platforms, such as TALYS [14] and NON-SMOKER [18], simplify complex reaction network calculations using the Hauser-Feshbach (HF) statistical model. This model computes reaction cross sections averaged over numerous excited states in the compound nucleus while accounting for angular momentum correlations between incident and outgoing channels. The resulting cross sections and reaction rates provide a comprehensive description of all energetically allowed decay modes of the compound nucleus and are of central importance for astrophysical applications.
In this work, the code TALYS [14] is used as the platform to calculate the reaction cross sections, from which the corresponding S-factors (see Sec. IV) are derived. Within the HF framework, the cross section for the reaction a+A →C*→b+B is expressed as the product of the compound nucleus formation probability and its decay probability into a specific channel. The essential nuclear inputs required for these calculations are nuclear masses, nuclear level densities (NLDs), photon strength functions (PSFs), and nucleus–nucleus optical model potentials (OMPs).
TALYS is applicable over an incident energy range from 1 keV to 200 MeV for projectiles such as protons, neutrons, deuterons, tritons, 3He, and alpha particles, and for target nuclei with mass numbers
$ 12 \leq A \leq 339 $ . Unlike TALYS, the NON-SMOKER (web) nuclear code is not open-source software, although its database is freely accessible online. Although both TALYS and NON-SMOKER (web) require basic information about the projectile and target nucleus, NON-SMOKER additionally requires selection of a mass model, whereas TALYS requires specification of the energy range of interest. Differences between TALYS and NON-SMOKER (web) predictions arise from several factors, including the numerical implementation of the Hauser-Feshbach equations, the choice of nuclear input models, and the inclusion of additional reaction mechanisms. For example, TALYS incorporates direct and pre-equilibrium components, whereas the NON-SMOKER database primarily considers compound nuclear reactions. Moreover, TALYS provides a wide range of phenomenological and microscopic models for NLDs, PSFs, and OMPs, whereas NON-SMOKER (web) employs fixed model prescriptions. -
Nuclear level density (NLD) is defined as the number of available nuclear states per unit excitation energy. At low excitation energies, level densities can be determined by counting observed discrete levels, whereas near the particle separation energy they can be inferred from resonance spacings. At higher excitation energies, however, theoretical models are required. For a noninteracting Fermi gas, the state density
$ \omega(E) $ as a function of excitation energy E is given by [27, 28]:$ \begin{aligned}[b] {\omega}(E)= \frac{{\sqrt\pi}}{12} \frac{{\mathrm{exp}}(2 \sqrt{aE})}{E^{5/4} a^{1/4}} . \end{aligned} $
(1) Here, a is the nuclear level-density parameter, defined as
$ a=\dfrac{ \pi^{2} g}{6} $ , where g represents the single-particle level density. The state density,$ \omega(E) $ , is related to the spin-dependent level density,$ \rho(E,J) $ , by$ \omega(E)= \sum_{J} (2J + 1)\,\rho(E, J) $ .The reliability of an NLD model in fitting experimental data is typically assessed by its ability to reproduce the s-wave neutron resonance spacing,
$ D_0 $ , at the neutron separation energy and the cumulative number of observed low-lying discrete levels. The s-wave ($ D_0 $ ) and p-wave ($ D_1 $ ) resonance spacings for the nucleus (Z+1, A+1), formed by proton capture on a target nucleus (Z, A), are given by [29].$ \begin{aligned}[b] D_0 = \dfrac{1}{{{\rho}(J+{\dfrac{1}{2}})}+{\rho}(J-{\dfrac{1}{2}})} {\mathrm{for}} \;J>0 ,\end{aligned} $
(2) $ \begin{aligned}[b] D_1 = \dfrac{1}{{{\rho}(J+{\dfrac{3}{2}})}+{{\rho}(J+{\dfrac{1}{2}})}+{{\rho}(J-{\dfrac{1}{2}})} +{{\rho}(J-{\dfrac{3}{2}})}} \, {\mathrm{for}} \;J \gt 1 ,\end{aligned} $
(3) where J is the ground-state spin of the target nucleus. In this work, an NLD model is considered reliable if it reproduces the experimental level scheme and satisfies the approximate relation
$ D_0 $ ~ 2$ D_1 $ .TALYS incorporates three phenomenological and three microscopic NLD models, as listed in Table 1, enabling the selection of the most suitable approach for reproducing the experimental data. The default phenomenological model is the Constant Temperature Model (CTM). The CTM framework divides the excitation energy range into two distinct regimes. Between 0 MeV and a specified matching energy (
$ E_M $ ), the level density follows a constant-temperature law, whereas above$ E_M $ , the model smoothly transitions to the standard Fermi gas formula.Nuclear Input Phenomenological Models Semi-microscopic Models NLD Constant Temperature Model (CTM) [30] Hartree-Fock-Bardeen-Cooper-Schrieffer (HF-BCS) [31] Back-Shifted Fermi Gas Model(BFM)[31−33] Skyrme-Hartree-Fock-Bogoliubov (Skyrme-HFB) [29] Generalized Superfluid Model (GSM) [34, 35] Temperature-dependent HFB model employing the D1M
Gogny force (Gogny-HFB) [36]PSF Brink-Axel model (BA-SLO) [37, 38] HF-BCS plus QRPA model based on Skyrme Sly4 interaction [39] Generalized Lorentzian form by Kopecky and Uhl (KU-GLO) [40, 41] HFB plus QRPA model based on Skyrme BSk7 interaction [42] Hybrid model [43] Temperature-dependent HFB plus QRPA model based on
Skyrme BSk7 interaction [42]Simplified Modified Lorentzian (SMLO) [25, 44] Relativistic Mean Field plus QRPA model [45] Temperature-dependent HFB plus QRPA using the D1M
Gogny force (Gogny-HFB-QRPA) [46]HFB plus QRPA with Skyrme interaction [42] p/n-OMP Global and local OMP by Koning and Delaroche (KD03) [23] Jeukenne-Lejeune-Mahaux OMP (JLM) [24] Table 1. The nuclear inputs used for cross-section calculations within the Hauser–Feshbach statistical model, together with the corresponding phenomenological and semi-microscopic models incorporated into TALYS, are summarized. Model abbreviations for selected options are provided in parentheses. Here, NLD denotes nuclear level density, PSF denotes photon strength function, and p/n-OMP denotes the proton or neutron optical model potential.
Among the microscopic NLD models, the Skyrme-Hartree-Fock-Bogoliubov (Skyrme-HFB) combinatorial model is employed in this work. This microscopic model constructs the intrinsic non-collective particle-hole state density directly from the HFB single-particle level scheme and then folds it with a vibrational state density to obtain the total state densities. Owing to this microscopic foundation, the Skyrme-HFB approach intrinsically and coherently accounts for shell and pairing effects.
By contrast, NON-SMOKER (web) employs the Rauscher-Thielemann-Kratz (RTK) model [47] to calculate nuclear level densities.
-
Nuclear level density (NLD) is defined as the number of available nuclear states per unit excitation energy. At low excitation energies, level densities can be determined by counting observed discrete levels, whereas near the particle separation energy they can be inferred from resonance spacings. At higher excitation energies, however, theoretical models are required. For a noninteracting Fermi gas, the state density
$ \omega(E) $ as a function of excitation energy E is given by [27, 28]:$ \begin{aligned}[b] {\omega}(E)= \frac{{\sqrt\pi}}{12} \frac{{\mathrm{exp}}(2 \sqrt{aE})}{E^{5/4} a^{1/4}} . \end{aligned} $
(1) Here, a is the nuclear level-density parameter, defined as
$ a=\dfrac{ \pi^{2} g}{6} $ , where g represents the single-particle level density. The state density,$ \omega(E) $ , is related to the spin-dependent level density,$ \rho(E,J) $ , by$ \omega(E)= \sum_{J} (2J + 1)\,\rho(E, J) $ .The reliability of an NLD model in fitting experimental data is typically assessed by its ability to reproduce the s-wave neutron resonance spacing,
$ D_0 $ , at the neutron separation energy and the cumulative number of observed low-lying discrete levels. The s-wave ($ D_0 $ ) and p-wave ($ D_1 $ ) resonance spacings for the nucleus (Z+1, A+1), formed by proton capture on a target nucleus (Z, A), are given by [29].$ \begin{aligned}[b] D_0 = \dfrac{1}{{{\rho}(J+{\dfrac{1}{2}})}+{\rho}(J-{\dfrac{1}{2}})} {\mathrm{for}} \;J>0 ,\end{aligned} $
(2) $ \begin{aligned}[b] D_1 = \dfrac{1}{{{\rho}(J+{\dfrac{3}{2}})}+{{\rho}(J+{\dfrac{1}{2}})}+{{\rho}(J-{\dfrac{1}{2}})} +{{\rho}(J-{\dfrac{3}{2}})}} \, {\mathrm{for}} \;J \gt 1 ,\end{aligned} $
(3) where J is the ground-state spin of the target nucleus. In this work, an NLD model is considered reliable if it reproduces the experimental level scheme and satisfies the approximate relation
$ D_0 $ ~ 2$ D_1 $ .TALYS incorporates three phenomenological and three microscopic NLD models, as listed in Table 1, enabling the selection of the most suitable approach for reproducing the experimental data. The default phenomenological model is the Constant Temperature Model (CTM). The CTM framework divides the excitation energy range into two distinct regimes. Between 0 MeV and a specified matching energy (
$ E_M $ ), the level density follows a constant-temperature law, whereas above$ E_M $ , the model smoothly transitions to the standard Fermi gas formula.Nuclear Input Phenomenological Models Semi-microscopic Models NLD Constant Temperature Model (CTM) [30] Hartree-Fock-Bardeen-Cooper-Schrieffer (HF-BCS) [31] Back-Shifted Fermi Gas Model(BFM)[31−33] Skyrme-Hartree-Fock-Bogoliubov (Skyrme-HFB) [29] Generalized Superfluid Model (GSM) [34, 35] Temperature-dependent HFB model employing the D1M
Gogny force (Gogny-HFB) [36]PSF Brink-Axel model (BA-SLO) [37, 38] HF-BCS plus QRPA model based on Skyrme Sly4 interaction [39] Generalized Lorentzian form by Kopecky and Uhl (KU-GLO) [40, 41] HFB plus QRPA model based on Skyrme BSk7 interaction [42] Hybrid model [43] Temperature-dependent HFB plus QRPA model based on
Skyrme BSk7 interaction [42]Simplified Modified Lorentzian (SMLO) [25, 44] Relativistic Mean Field plus QRPA model [45] Temperature-dependent HFB plus QRPA using the D1M
Gogny force (Gogny-HFB-QRPA) [46]HFB plus QRPA with Skyrme interaction [42] p/n-OMP Global and local OMP by Koning and Delaroche (KD03) [23] Jeukenne-Lejeune-Mahaux OMP (JLM) [24] Table 1. The nuclear inputs used for cross-section calculations within the Hauser–Feshbach statistical model, together with the corresponding phenomenological and semi-microscopic models incorporated into TALYS, are summarized. Model abbreviations for selected options are provided in parentheses. Here, NLD denotes nuclear level density, PSF denotes photon strength function, and p/n-OMP denotes the proton or neutron optical model potential.
Among the microscopic NLD models, the Skyrme-Hartree-Fock-Bogoliubov (Skyrme-HFB) combinatorial model is employed in this work. This microscopic model constructs the intrinsic non-collective particle-hole state density directly from the HFB single-particle level scheme and then folds it with a vibrational state density to obtain the total state densities. Owing to this microscopic foundation, the Skyrme-HFB approach intrinsically and coherently accounts for shell and pairing effects.
By contrast, NON-SMOKER (web) employs the Rauscher-Thielemann-Kratz (RTK) model [47] to calculate nuclear level densities.
-
Nuclear level density (NLD) is defined as the number of available nuclear states per unit excitation energy. At low excitation energies, level densities can be determined by counting observed discrete levels, whereas near the particle separation energy they can be inferred from resonance spacings. At higher excitation energies, however, theoretical models are required. For a noninteracting Fermi gas, the state density
$ \omega(E) $ as a function of excitation energy E is given by [27, 28]:$ \begin{aligned}[b] {\omega}(E)= \frac{{\sqrt\pi}}{12} \frac{{\mathrm{exp}}(2 \sqrt{aE})}{E^{5/4} a^{1/4}} . \end{aligned} $
(1) Here, a is the nuclear level-density parameter, defined as
$ a=\dfrac{ \pi^{2} g}{6} $ , where g represents the single-particle level density. The state density,$ \omega(E) $ , is related to the spin-dependent level density,$ \rho(E,J) $ , by$ \omega(E)= \sum_{J} (2J + 1)\,\rho(E, J) $ .The reliability of an NLD model in fitting experimental data is typically assessed by its ability to reproduce the s-wave neutron resonance spacing,
$ D_0 $ , at the neutron separation energy and the cumulative number of observed low-lying discrete levels. The s-wave ($ D_0 $ ) and p-wave ($ D_1 $ ) resonance spacings for the nucleus (Z+1, A+1), formed by proton capture on a target nucleus (Z, A), are given by [29].$ \begin{aligned}[b] D_0 = \dfrac{1}{{{\rho}(J+{\dfrac{1}{2}})}+{\rho}(J-{\dfrac{1}{2}})} {\mathrm{for}} \;J>0 ,\end{aligned} $
(2) $ \begin{aligned}[b] D_1 = \dfrac{1}{{{\rho}(J+{\dfrac{3}{2}})}+{{\rho}(J+{\dfrac{1}{2}})}+{{\rho}(J-{\dfrac{1}{2}})} +{{\rho}(J-{\dfrac{3}{2}})}} \, {\mathrm{for}} \;J \gt 1 ,\end{aligned} $
(3) where J is the ground-state spin of the target nucleus. In this work, an NLD model is considered reliable if it reproduces the experimental level scheme and satisfies the approximate relation
$ D_0 $ ~ 2$ D_1 $ .TALYS incorporates three phenomenological and three microscopic NLD models, as listed in Table 1, enabling the selection of the most suitable approach for reproducing the experimental data. The default phenomenological model is the Constant Temperature Model (CTM). The CTM framework divides the excitation energy range into two distinct regimes. Between 0 MeV and a specified matching energy (
$ E_M $ ), the level density follows a constant-temperature law, whereas above$ E_M $ , the model smoothly transitions to the standard Fermi gas formula.Nuclear Input Phenomenological Models Semi-microscopic Models NLD Constant Temperature Model (CTM) [30] Hartree-Fock-Bardeen-Cooper-Schrieffer (HF-BCS) [31] Back-Shifted Fermi Gas Model(BFM)[31−33] Skyrme-Hartree-Fock-Bogoliubov (Skyrme-HFB) [29] Generalized Superfluid Model (GSM) [34, 35] Temperature-dependent HFB model employing the D1M
Gogny force (Gogny-HFB) [36]PSF Brink-Axel model (BA-SLO) [37, 38] HF-BCS plus QRPA model based on Skyrme Sly4 interaction [39] Generalized Lorentzian form by Kopecky and Uhl (KU-GLO) [40, 41] HFB plus QRPA model based on Skyrme BSk7 interaction [42] Hybrid model [43] Temperature-dependent HFB plus QRPA model based on
Skyrme BSk7 interaction [42]Simplified Modified Lorentzian (SMLO) [25, 44] Relativistic Mean Field plus QRPA model [45] Temperature-dependent HFB plus QRPA using the D1M
Gogny force (Gogny-HFB-QRPA) [46]HFB plus QRPA with Skyrme interaction [42] p/n-OMP Global and local OMP by Koning and Delaroche (KD03) [23] Jeukenne-Lejeune-Mahaux OMP (JLM) [24] Table 1. The nuclear inputs used for cross-section calculations within the Hauser–Feshbach statistical model, together with the corresponding phenomenological and semi-microscopic models incorporated into TALYS, are summarized. Model abbreviations for selected options are provided in parentheses. Here, NLD denotes nuclear level density, PSF denotes photon strength function, and p/n-OMP denotes the proton or neutron optical model potential.
Among the microscopic NLD models, the Skyrme-Hartree-Fock-Bogoliubov (Skyrme-HFB) combinatorial model is employed in this work. This microscopic model constructs the intrinsic non-collective particle-hole state density directly from the HFB single-particle level scheme and then folds it with a vibrational state density to obtain the total state densities. Owing to this microscopic foundation, the Skyrme-HFB approach intrinsically and coherently accounts for shell and pairing effects.
By contrast, NON-SMOKER (web) employs the Rauscher-Thielemann-Kratz (RTK) model [47] to calculate nuclear level densities.
-
Nuclear level density (NLD) is defined as the number of available nuclear states per unit excitation energy. At low excitation energies, level densities can be determined by counting observed discrete levels, whereas near the particle separation energy they can be inferred from resonance spacings. At higher excitation energies, however, theoretical models are required. For a noninteracting Fermi gas, the state density
$ \omega(E) $ as a function of excitation energy E is given by [27, 28]:$ \begin{aligned}[b] {\omega}(E)= \frac{{\sqrt\pi}}{12} \frac{{\mathrm{exp}}(2 \sqrt{aE})}{E^{5/4} a^{1/4}} . \end{aligned} $
(1) Here, a is the nuclear level-density parameter, defined as
$ a=\dfrac{ \pi^{2} g}{6} $ , where g represents the single-particle level density. The state density,$ \omega(E) $ , is related to the spin-dependent level density,$ \rho(E,J) $ , by$ \omega(E)= \sum_{J} (2J + 1)\,\rho(E, J) $ .The reliability of an NLD model in fitting experimental data is typically assessed by its ability to reproduce the s-wave neutron resonance spacing,
$ D_0 $ , at the neutron separation energy and the cumulative number of observed low-lying discrete levels. The s-wave ($ D_0 $ ) and p-wave ($ D_1 $ ) resonance spacings for the nucleus (Z+1, A+1), formed by proton capture on a target nucleus (Z, A), are given by [29].$ \begin{aligned}[b] D_0 = \dfrac{1}{{{\rho}(J+{\dfrac{1}{2}})}+{\rho}(J-{\dfrac{1}{2}})} {\mathrm{for}} \;J>0 ,\end{aligned} $
(2) $ \begin{aligned}[b] D_1 = \dfrac{1}{{{\rho}(J+{\dfrac{3}{2}})}+{{\rho}(J+{\dfrac{1}{2}})}+{{\rho}(J-{\dfrac{1}{2}})} +{{\rho}(J-{\dfrac{3}{2}})}} \, {\mathrm{for}} \;J \gt 1 ,\end{aligned} $
(3) where J is the ground-state spin of the target nucleus. In this work, an NLD model is considered reliable if it reproduces the experimental level scheme and satisfies the approximate relation
$ D_0 $ ~ 2$ D_1 $ .TALYS incorporates three phenomenological and three microscopic NLD models, as listed in Table 1, enabling the selection of the most suitable approach for reproducing the experimental data. The default phenomenological model is the Constant Temperature Model (CTM). The CTM framework divides the excitation energy range into two distinct regimes. Between 0 MeV and a specified matching energy (
$ E_M $ ), the level density follows a constant-temperature law, whereas above$ E_M $ , the model smoothly transitions to the standard Fermi gas formula.Nuclear Input Phenomenological Models Semi-microscopic Models NLD Constant Temperature Model (CTM) [30] Hartree-Fock-Bardeen-Cooper-Schrieffer (HF-BCS) [31] Back-Shifted Fermi Gas Model(BFM)[31−33] Skyrme-Hartree-Fock-Bogoliubov (Skyrme-HFB) [29] Generalized Superfluid Model (GSM) [34, 35] Temperature-dependent HFB model employing the D1M
Gogny force (Gogny-HFB) [36]PSF Brink-Axel model (BA-SLO) [37, 38] HF-BCS plus QRPA model based on Skyrme Sly4 interaction [39] Generalized Lorentzian form by Kopecky and Uhl (KU-GLO) [40, 41] HFB plus QRPA model based on Skyrme BSk7 interaction [42] Hybrid model [43] Temperature-dependent HFB plus QRPA model based on
Skyrme BSk7 interaction [42]Simplified Modified Lorentzian (SMLO) [25, 44] Relativistic Mean Field plus QRPA model [45] Temperature-dependent HFB plus QRPA using the D1M
Gogny force (Gogny-HFB-QRPA) [46]HFB plus QRPA with Skyrme interaction [42] p/n-OMP Global and local OMP by Koning and Delaroche (KD03) [23] Jeukenne-Lejeune-Mahaux OMP (JLM) [24] Table 1. The nuclear inputs used for cross-section calculations within the Hauser–Feshbach statistical model, together with the corresponding phenomenological and semi-microscopic models incorporated into TALYS, are summarized. Model abbreviations for selected options are provided in parentheses. Here, NLD denotes nuclear level density, PSF denotes photon strength function, and p/n-OMP denotes the proton or neutron optical model potential.
Among the microscopic NLD models, the Skyrme-Hartree-Fock-Bogoliubov (Skyrme-HFB) combinatorial model is employed in this work. This microscopic model constructs the intrinsic non-collective particle-hole state density directly from the HFB single-particle level scheme and then folds it with a vibrational state density to obtain the total state densities. Owing to this microscopic foundation, the Skyrme-HFB approach intrinsically and coherently accounts for shell and pairing effects.
By contrast, NON-SMOKER (web) employs the Rauscher-Thielemann-Kratz (RTK) model [47] to calculate nuclear level densities.
-
Nuclear level density (NLD) is defined as the number of available nuclear states per unit excitation energy. At low excitation energies, level densities can be determined by counting observed discrete levels, whereas near the particle separation energy they can be inferred from resonance spacings. At higher excitation energies, however, theoretical models are required. For a noninteracting Fermi gas, the state density
$ \omega(E) $ as a function of excitation energy E is given by [27, 28]:$ \begin{aligned}[b] {\omega}(E)= \frac{{\sqrt\pi}}{12} \frac{{\mathrm{exp}}(2 \sqrt{aE})}{E^{5/4} a^{1/4}} . \end{aligned} $
(1) Here, a is the nuclear level-density parameter, defined as
$ a=\dfrac{ \pi^{2} g}{6} $ , where g represents the single-particle level density. The state density,$ \omega(E) $ , is related to the spin-dependent level density,$ \rho(E,J) $ , by$ \omega(E)= \sum_{J} (2J + 1)\,\rho(E, J) $ .The reliability of an NLD model in fitting experimental data is typically assessed by its ability to reproduce the s-wave neutron resonance spacing,
$ D_0 $ , at the neutron separation energy and the cumulative number of observed low-lying discrete levels. The s-wave ($ D_0 $ ) and p-wave ($ D_1 $ ) resonance spacings for the nucleus (Z+1, A+1), formed by proton capture on a target nucleus (Z, A), are given by [29].$ \begin{aligned}[b] D_0 = \dfrac{1}{{{\rho}(J+{\dfrac{1}{2}})}+{\rho}(J-{\dfrac{1}{2}})} {\mathrm{for}} \;J>0 ,\end{aligned} $
(2) $ \begin{aligned}[b] D_1 = \dfrac{1}{{{\rho}(J+{\dfrac{3}{2}})}+{{\rho}(J+{\dfrac{1}{2}})}+{{\rho}(J-{\dfrac{1}{2}})} +{{\rho}(J-{\dfrac{3}{2}})}} \, {\mathrm{for}} \;J \gt 1 ,\end{aligned} $
(3) where J is the ground-state spin of the target nucleus. In this work, an NLD model is considered reliable if it reproduces the experimental level scheme and satisfies the approximate relation
$ D_0 $ ~ 2$ D_1 $ .TALYS incorporates three phenomenological and three microscopic NLD models, as listed in Table 1, enabling the selection of the most suitable approach for reproducing the experimental data. The default phenomenological model is the Constant Temperature Model (CTM). The CTM framework divides the excitation energy range into two distinct regimes. Between 0 MeV and a specified matching energy (
$ E_M $ ), the level density follows a constant-temperature law, whereas above$ E_M $ , the model smoothly transitions to the standard Fermi gas formula.Nuclear Input Phenomenological Models Semi-microscopic Models NLD Constant Temperature Model (CTM) [30] Hartree-Fock-Bardeen-Cooper-Schrieffer (HF-BCS) [31] Back-Shifted Fermi Gas Model(BFM)[31−33] Skyrme-Hartree-Fock-Bogoliubov (Skyrme-HFB) [29] Generalized Superfluid Model (GSM) [34, 35] Temperature-dependent HFB model employing the D1M
Gogny force (Gogny-HFB) [36]PSF Brink-Axel model (BA-SLO) [37, 38] HF-BCS plus QRPA model based on Skyrme Sly4 interaction [39] Generalized Lorentzian form by Kopecky and Uhl (KU-GLO) [40, 41] HFB plus QRPA model based on Skyrme BSk7 interaction [42] Hybrid model [43] Temperature-dependent HFB plus QRPA model based on
Skyrme BSk7 interaction [42]Simplified Modified Lorentzian (SMLO) [25, 44] Relativistic Mean Field plus QRPA model [45] Temperature-dependent HFB plus QRPA using the D1M
Gogny force (Gogny-HFB-QRPA) [46]HFB plus QRPA with Skyrme interaction [42] p/n-OMP Global and local OMP by Koning and Delaroche (KD03) [23] Jeukenne-Lejeune-Mahaux OMP (JLM) [24] Table 1. The nuclear inputs used for cross-section calculations within the Hauser–Feshbach statistical model, together with the corresponding phenomenological and semi-microscopic models incorporated into TALYS, are summarized. Model abbreviations for selected options are provided in parentheses. Here, NLD denotes nuclear level density, PSF denotes photon strength function, and p/n-OMP denotes the proton or neutron optical model potential.
Among the microscopic NLD models, the Skyrme-Hartree-Fock-Bogoliubov (Skyrme-HFB) combinatorial model is employed in this work. This microscopic model constructs the intrinsic non-collective particle-hole state density directly from the HFB single-particle level scheme and then folds it with a vibrational state density to obtain the total state densities. Owing to this microscopic foundation, the Skyrme-HFB approach intrinsically and coherently accounts for shell and pairing effects.
By contrast, NON-SMOKER (web) employs the Rauscher-Thielemann-Kratz (RTK) model [47] to calculate nuclear level densities.
-
Within the Hauser–Feshbach statistical framework, the decay of a compound nucleus through a specific exit channel, such as neutron, proton, or γ-ray emission, is governed by transmission coefficients. For γ-ray emission, these coefficients are denoted by
$ T_{XL} $ , where X specifies the electromagnetic character (electric, E, or magnetic, M), and L represents the transition multipolarity. In radiative capture reactions of the type (p, γ), electric dipole (E1) transitions typically dominate the decay process.The photon strength function (PSF),
$ f_{XL} $ , describes the average probability of photon emission or absorption at a given γ-ray energy,$ E_{\gamma} $ , and is related to the transmission coefficient$ T_{XL} $ by [14]:$ \begin{aligned}[b] T_{XL}(E_{\gamma}) = 2\pi f_{XL}(E_{\gamma}) E_{\gamma}^{2L+1}. \end{aligned} $
(4) The PSF is largely determined by the properties of the giant dipole resonance (GDR), which is commonly modeled with a Lorentzian shape parameterized by the GDR centroid energy, width, and strength.
To calculate γ-ray emission probabilities in nuclear reactions, TALYS provides several phenomenological and microscopic PSF models; those used in this work are listed in Table 1. The phenomenological models used in the present work are:
(i) Brink-Axel Standard Lorentzian (BA-SLO) model
(ii) Kopecky-Uhl Generalized Lorentzian (KU-GLO) model, and
(iii) Simplified Modified Lorentzian (SMLO) model
The BA-SLO model [37, 38] represents the PSF as a temperature independent, symmetric Lorentzian. However, this model lacks the energy-dependent damping required for reliable calculations at low γ-ray energies. In contrast, the KU-GLO model [40, 41] introduces an energy- and temperature-dependent width, yielding a more realistic description of γ-ray strength, particularly near the neutron separation energy. The SMLO model, inspired by microscopic quasiparticle random phase approximation (QRPA) and shell-model predictions, incorporates temperature dependence and additional low-energy strength components. This model explicitly includes the M1 spin-flip resonance, the low-energy scissors mode for deformed nuclei, and an exponential low-energy upbend while maintaining a temperature-dependent E1 width. Owing to its improved predictive capability over a wide mass range (
$ 8 \lt Z \lt 124 $ ) [25, 44], SMLO is adopted as the default PSF model in TALYS.Microscopic PSF models based on QRPA calculations with different nuclear interactions, including Skyrme, Gogny, and relativistic mean-field interactions [39, 42, 45, 46], are also available. In this work, the Gogny-HFB-QRPA model [46] is considered as a representative microscopic approach. This model provides a sophisticated description by combining axially deformed Hartree–Fock–Bogoliubov calculations with QRPA, supplemented by phenomenological corrections to account for damping and low-energy strength.
NON-SMOKER employs the Cowan–Thielemann–Truran formulation [48] for radiative transmission coefficients.
-
Within the Hauser–Feshbach statistical framework, the decay of a compound nucleus through a specific exit channel, such as neutron, proton, or γ-ray emission, is governed by transmission coefficients. For γ-ray emission, these coefficients are denoted by
$ T_{XL} $ , where X specifies the electromagnetic character (electric, E, or magnetic, M), and L represents the transition multipolarity. In radiative capture reactions of the type (p, γ), electric dipole (E1) transitions typically dominate the decay process.The photon strength function (PSF),
$ f_{XL} $ , describes the average probability of photon emission or absorption at a given γ-ray energy,$ E_{\gamma} $ , and is related to the transmission coefficient$ T_{XL} $ by [14]:$ \begin{aligned}[b] T_{XL}(E_{\gamma}) = 2\pi f_{XL}(E_{\gamma}) E_{\gamma}^{2L+1}. \end{aligned} $
(4) The PSF is largely determined by the properties of the giant dipole resonance (GDR), which is commonly modeled with a Lorentzian shape parameterized by the GDR centroid energy, width, and strength.
To calculate γ-ray emission probabilities in nuclear reactions, TALYS provides several phenomenological and microscopic PSF models; those used in this work are listed in Table 1. The phenomenological models used in the present work are:
(i) Brink-Axel Standard Lorentzian (BA-SLO) model
(ii) Kopecky-Uhl Generalized Lorentzian (KU-GLO) model, and
(iii) Simplified Modified Lorentzian (SMLO) model
The BA-SLO model [37, 38] represents the PSF as a temperature independent, symmetric Lorentzian. However, this model lacks the energy-dependent damping required for reliable calculations at low γ-ray energies. In contrast, the KU-GLO model [40, 41] introduces an energy- and temperature-dependent width, yielding a more realistic description of γ-ray strength, particularly near the neutron separation energy. The SMLO model, inspired by microscopic quasiparticle random phase approximation (QRPA) and shell-model predictions, incorporates temperature dependence and additional low-energy strength components. This model explicitly includes the M1 spin-flip resonance, the low-energy scissors mode for deformed nuclei, and an exponential low-energy upbend while maintaining a temperature-dependent E1 width. Owing to its improved predictive capability over a wide mass range (
$ 8 \lt Z \lt 124 $ ) [25, 44], SMLO is adopted as the default PSF model in TALYS.Microscopic PSF models based on QRPA calculations with different nuclear interactions, including Skyrme, Gogny, and relativistic mean-field interactions [39, 42, 45, 46], are also available. In this work, the Gogny-HFB-QRPA model [46] is considered as a representative microscopic approach. This model provides a sophisticated description by combining axially deformed Hartree–Fock–Bogoliubov calculations with QRPA, supplemented by phenomenological corrections to account for damping and low-energy strength.
NON-SMOKER employs the Cowan–Thielemann–Truran formulation [48] for radiative transmission coefficients.
-
Within the Hauser–Feshbach statistical framework, the decay of a compound nucleus through a specific exit channel, such as neutron, proton, or γ-ray emission, is governed by transmission coefficients. For γ-ray emission, these coefficients are denoted by
$ T_{XL} $ , where X specifies the electromagnetic character (electric, E, or magnetic, M), and L represents the transition multipolarity. In radiative capture reactions of the type (p, γ), electric dipole (E1) transitions typically dominate the decay process.The photon strength function (PSF),
$ f_{XL} $ , describes the average probability of photon emission or absorption at a given γ-ray energy,$ E_{\gamma} $ , and is related to the transmission coefficient$ T_{XL} $ by [14]:$ \begin{aligned}[b] T_{XL}(E_{\gamma}) = 2\pi f_{XL}(E_{\gamma}) E_{\gamma}^{2L+1}. \end{aligned} $
(4) The PSF is largely determined by the properties of the giant dipole resonance (GDR), which is commonly modeled with a Lorentzian shape parameterized by the GDR centroid energy, width, and strength.
To calculate γ-ray emission probabilities in nuclear reactions, TALYS provides several phenomenological and microscopic PSF models; those used in this work are listed in Table 1. The phenomenological models used in the present work are:
(i) Brink-Axel Standard Lorentzian (BA-SLO) model
(ii) Kopecky-Uhl Generalized Lorentzian (KU-GLO) model, and
(iii) Simplified Modified Lorentzian (SMLO) model
The BA-SLO model [37, 38] represents the PSF as a temperature independent, symmetric Lorentzian. However, this model lacks the energy-dependent damping required for reliable calculations at low γ-ray energies. In contrast, the KU-GLO model [40, 41] introduces an energy- and temperature-dependent width, yielding a more realistic description of γ-ray strength, particularly near the neutron separation energy. The SMLO model, inspired by microscopic quasiparticle random phase approximation (QRPA) and shell-model predictions, incorporates temperature dependence and additional low-energy strength components. This model explicitly includes the M1 spin-flip resonance, the low-energy scissors mode for deformed nuclei, and an exponential low-energy upbend while maintaining a temperature-dependent E1 width. Owing to its improved predictive capability over a wide mass range (
$ 8 \lt Z \lt 124 $ ) [25, 44], SMLO is adopted as the default PSF model in TALYS.Microscopic PSF models based on QRPA calculations with different nuclear interactions, including Skyrme, Gogny, and relativistic mean-field interactions [39, 42, 45, 46], are also available. In this work, the Gogny-HFB-QRPA model [46] is considered as a representative microscopic approach. This model provides a sophisticated description by combining axially deformed Hartree–Fock–Bogoliubov calculations with QRPA, supplemented by phenomenological corrections to account for damping and low-energy strength.
NON-SMOKER employs the Cowan–Thielemann–Truran formulation [48] for radiative transmission coefficients.
-
Within the Hauser–Feshbach statistical framework, the decay of a compound nucleus through a specific exit channel, such as neutron, proton, or γ-ray emission, is governed by transmission coefficients. For γ-ray emission, these coefficients are denoted by
$ T_{XL} $ , where X specifies the electromagnetic character (electric, E, or magnetic, M), and L represents the transition multipolarity. In radiative capture reactions of the type (p, γ), electric dipole (E1) transitions typically dominate the decay process.The photon strength function (PSF),
$ f_{XL} $ , describes the average probability of photon emission or absorption at a given γ-ray energy,$ E_{\gamma} $ , and is related to the transmission coefficient$ T_{XL} $ by [14]:$ \begin{aligned}[b] T_{XL}(E_{\gamma}) = 2\pi f_{XL}(E_{\gamma}) E_{\gamma}^{2L+1}. \end{aligned} $
(4) The PSF is largely determined by the properties of the giant dipole resonance (GDR), which is commonly modeled with a Lorentzian shape parameterized by the GDR centroid energy, width, and strength.
To calculate γ-ray emission probabilities in nuclear reactions, TALYS provides several phenomenological and microscopic PSF models; those used in this work are listed in Table 1. The phenomenological models used in the present work are:
(i) Brink-Axel Standard Lorentzian (BA-SLO) model
(ii) Kopecky-Uhl Generalized Lorentzian (KU-GLO) model, and
(iii) Simplified Modified Lorentzian (SMLO) model
The BA-SLO model [37, 38] represents the PSF as a temperature independent, symmetric Lorentzian. However, this model lacks the energy-dependent damping required for reliable calculations at low γ-ray energies. In contrast, the KU-GLO model [40, 41] introduces an energy- and temperature-dependent width, yielding a more realistic description of γ-ray strength, particularly near the neutron separation energy. The SMLO model, inspired by microscopic quasiparticle random phase approximation (QRPA) and shell-model predictions, incorporates temperature dependence and additional low-energy strength components. This model explicitly includes the M1 spin-flip resonance, the low-energy scissors mode for deformed nuclei, and an exponential low-energy upbend while maintaining a temperature-dependent E1 width. Owing to its improved predictive capability over a wide mass range (
$ 8 \lt Z \lt 124 $ ) [25, 44], SMLO is adopted as the default PSF model in TALYS.Microscopic PSF models based on QRPA calculations with different nuclear interactions, including Skyrme, Gogny, and relativistic mean-field interactions [39, 42, 45, 46], are also available. In this work, the Gogny-HFB-QRPA model [46] is considered as a representative microscopic approach. This model provides a sophisticated description by combining axially deformed Hartree–Fock–Bogoliubov calculations with QRPA, supplemented by phenomenological corrections to account for damping and low-energy strength.
NON-SMOKER employs the Cowan–Thielemann–Truran formulation [48] for radiative transmission coefficients.
-
Within the Hauser–Feshbach statistical framework, the decay of a compound nucleus through a specific exit channel, such as neutron, proton, or γ-ray emission, is governed by transmission coefficients. For γ-ray emission, these coefficients are denoted by
$ T_{XL} $ , where X specifies the electromagnetic character (electric, E, or magnetic, M), and L represents the transition multipolarity. In radiative capture reactions of the type (p, γ), electric dipole (E1) transitions typically dominate the decay process.The photon strength function (PSF),
$ f_{XL} $ , describes the average probability of photon emission or absorption at a given γ-ray energy,$ E_{\gamma} $ , and is related to the transmission coefficient$ T_{XL} $ by [14]:$ \begin{aligned}[b] T_{XL}(E_{\gamma}) = 2\pi f_{XL}(E_{\gamma}) E_{\gamma}^{2L+1}. \end{aligned} $
(4) The PSF is largely determined by the properties of the giant dipole resonance (GDR), which is commonly modeled with a Lorentzian shape parameterized by the GDR centroid energy, width, and strength.
To calculate γ-ray emission probabilities in nuclear reactions, TALYS provides several phenomenological and microscopic PSF models; those used in this work are listed in Table 1. The phenomenological models used in the present work are:
(i) Brink-Axel Standard Lorentzian (BA-SLO) model
(ii) Kopecky-Uhl Generalized Lorentzian (KU-GLO) model, and
(iii) Simplified Modified Lorentzian (SMLO) model
The BA-SLO model [37, 38] represents the PSF as a temperature independent, symmetric Lorentzian. However, this model lacks the energy-dependent damping required for reliable calculations at low γ-ray energies. In contrast, the KU-GLO model [40, 41] introduces an energy- and temperature-dependent width, yielding a more realistic description of γ-ray strength, particularly near the neutron separation energy. The SMLO model, inspired by microscopic quasiparticle random phase approximation (QRPA) and shell-model predictions, incorporates temperature dependence and additional low-energy strength components. This model explicitly includes the M1 spin-flip resonance, the low-energy scissors mode for deformed nuclei, and an exponential low-energy upbend while maintaining a temperature-dependent E1 width. Owing to its improved predictive capability over a wide mass range (
$ 8 \lt Z \lt 124 $ ) [25, 44], SMLO is adopted as the default PSF model in TALYS.Microscopic PSF models based on QRPA calculations with different nuclear interactions, including Skyrme, Gogny, and relativistic mean-field interactions [39, 42, 45, 46], are also available. In this work, the Gogny-HFB-QRPA model [46] is considered as a representative microscopic approach. This model provides a sophisticated description by combining axially deformed Hartree–Fock–Bogoliubov calculations with QRPA, supplemented by phenomenological corrections to account for damping and low-energy strength.
NON-SMOKER employs the Cowan–Thielemann–Truran formulation [48] for radiative transmission coefficients.
-
The optical potential plays a crucial role in solving the Schrödinger equation, which yields the transmission probability of the projectile incident on the target during a reaction. This transmission probability is then used to analyze compound-nucleus reaction cross sections within the framework of Hauser-Feshbach statistical theory. The interaction between the projectile and the target nucleus in a reaction can be described using optical model potentials. The most commonly used functional form of the phenomenological optical potential for a spherical nucleus [49, 50] is written as:
$ \begin{aligned}[b] U(r,E) =& - V_{V}(E) f(r) - {\mathrm{i}}W_{V}(E) f(r) + a_{D} W_{D}(E) g(r) \\ &+ V_{SO}(r,E).l.\sigma + V_{C} (r) ,\end{aligned} $
(5) where the form factors f(r) and g(r) have Woods–Saxon forms,
$ \begin{aligned}[b] f(r)= \frac{1}{1 + {{\rm{e}}^{\left(\tfrac{r-R}{a'}\right)}}} , \quad g(r) = \frac{{\mathrm{d}} f(r)} {{\mathrm{d}}r} ,\end{aligned} $
(6) and
$ {V_{V}} $ ,$ {W_{V}} $ ,$ {W_{D}} $ , and$ {V_{SO}} $ are the real volume, imaginary volume, imaginary surface, and real spin-orbit potential depths, respectively. The term$ {V_C} $ represents the Coulomb potential. The geometrical parameters R,$ a' $ , and r refer to the effective nuclear radius, the surface diffuseness of the nucleus, and the radial distance measured from the center of the nucleus, respectively. Equation 5 allows the depths and radial parameters to be adjusted to obtain the best fit to the experimental data.The phenomenological optical model potential (OMP) implemented in TALYS is based on the formulation of Koning and Delaroche, commonly referred to as KD03 [23]. TALYS incorporates both local and global parameterizations of the KD03 OMP. By default, TALYS retrieves the local OMP parameters from its internal database. However, in the absence of a local parameterization in the nuclear structure and model parameter database, TALYS automatically applies a set of global OMP parameters. These parameters depend on the atomic number (Z) and mass number (A) of the interacting nuclei and are used to calculate the transmission coefficients. In addition to the analytical expressions for the spherical OMP, TALYS also provides the option to use the semi-microscopic Jeukenne-Lejeune-Mahaux (JLM) potential, as described in Ref. [24]. NON-SMOKER also uses the JLM model for the optical potential.
To improve the reliability of the calculated radiative capture cross sections and assess the limitations of the default theoretical inputs in TALYS, an additional set of TALYS calculations was performed using experimentally constrained nuclear level density (NLD) and photon strength function (PSF) parameters. In this approach, empirical inputs reported by Markova et al. [26] were adopted for the Sn isotopic chain. The statistical model calculations were guided by recent experimental information available for neighboring tin isotopes. Following the comprehensive Oslo method systematics, the NLDs of the compound nuclei were modeled using the Constant Temperature and Fermi Gas model. The PSF normalization was fixed using experimentally measured average total radiative widths from neutron resonance data, ensuring consistency with known decay properties. To account for the experimentally observed enhancement in low-energy γ-ray strength, the low-lying electric dipole response, commonly referred to as the Pygmy Dipole Resonance, was explicitly included in the calculations. The Gaussian parametrization reported by Markova et al. was converted into an equivalent Lorentzian form compatible with TALYS input requirements. Since direct PSF measurements are not available for the Sb compound nuclei populated in the Sn(p, γ) reactions, the corresponding parameters were adopted from neighboring Sn isotopes, assuming structural similarity. By incorporating these experimentally constrained NLD and PSF inputs, the calculations were constrained by local experimental data rather than by default theoretical parameters.
In nuclear astrophysics, ensuring that extrapolations remain reliable and accurate in experimentally unexplored regions is crucial. Microscopic or semi-microscopic global models are generally preferred for extrapolation because analytical models lack a means to validate the quality of extrapolated parameters. However, despite advances in various global microscopic approaches, their use remains limited by concerns about their accuracy. Moreover, they do not provide the same flexibility as phenomenological models, whose parameters can be readily modified to better fit and interpret experimental data. Consequently, the model combinations (as mentioned in Table 2) used in the present work employ the phenomenological OMP KD03 to reproduce the (p, γ) reaction cross sections, as discussed in the following section.
Model set NLD model PSF model p-OMP model TALYS I CTM SMLO KD03 TALYS II Skyrme-HFB SMLO KD03 TALYS III Skyrme-HFB SMLO JLM TALYS IV Skyrme-HFB Gogny-HFB-QRPA KD03 TALYS V Skyrme-HFB Gogny-HFB-QRPA JLM TALYS VI CTM KU-GLO KD03 TALYS VII CTM BA-SLO KD03 Table 2. Combinations of NLD, PSF, and OMP models used for cross-section calculations with TALYS 2.0. The names of the model combinations are listed in the first column. The model abbreviations mentioned above are detailed in Table 1.
-
The optical potential plays a crucial role in solving the Schrödinger equation, which yields the transmission probability of the projectile incident on the target during a reaction. This transmission probability is then used to analyze compound-nucleus reaction cross sections within the framework of Hauser-Feshbach statistical theory. The interaction between the projectile and the target nucleus in a reaction can be described using optical model potentials. The most commonly used functional form of the phenomenological optical potential for a spherical nucleus [49, 50] is written as:
$ \begin{aligned}[b] U(r,E) =& - V_{V}(E) f(r) - {\mathrm{i}}W_{V}(E) f(r) + a_{D} W_{D}(E) g(r) \\ &+ V_{SO}(r,E).l.\sigma + V_{C} (r) ,\end{aligned} $
(5) where the form factors f(r) and g(r) have Woods–Saxon forms,
$ \begin{aligned}[b] f(r)= \frac{1}{1 + {{\rm{e}}^{\left(\tfrac{r-R}{a'}\right)}}} , \quad g(r) = \frac{{\mathrm{d}} f(r)} {{\mathrm{d}}r} ,\end{aligned} $
(6) and
$ {V_{V}} $ ,$ {W_{V}} $ ,$ {W_{D}} $ , and$ {V_{SO}} $ are the real volume, imaginary volume, imaginary surface, and real spin-orbit potential depths, respectively. The term$ {V_C} $ represents the Coulomb potential. The geometrical parameters R,$ a' $ , and r refer to the effective nuclear radius, the surface diffuseness of the nucleus, and the radial distance measured from the center of the nucleus, respectively. Equation 5 allows the depths and radial parameters to be adjusted to obtain the best fit to the experimental data.The phenomenological optical model potential (OMP) implemented in TALYS is based on the formulation of Koning and Delaroche, commonly referred to as KD03 [23]. TALYS incorporates both local and global parameterizations of the KD03 OMP. By default, TALYS retrieves the local OMP parameters from its internal database. However, in the absence of a local parameterization in the nuclear structure and model parameter database, TALYS automatically applies a set of global OMP parameters. These parameters depend on the atomic number (Z) and mass number (A) of the interacting nuclei and are used to calculate the transmission coefficients. In addition to the analytical expressions for the spherical OMP, TALYS also provides the option to use the semi-microscopic Jeukenne-Lejeune-Mahaux (JLM) potential, as described in Ref. [24]. NON-SMOKER also uses the JLM model for the optical potential.
To improve the reliability of the calculated radiative capture cross sections and assess the limitations of the default theoretical inputs in TALYS, an additional set of TALYS calculations was performed using experimentally constrained nuclear level density (NLD) and photon strength function (PSF) parameters. In this approach, empirical inputs reported by Markova et al. [26] were adopted for the Sn isotopic chain. The statistical model calculations were guided by recent experimental information available for neighboring tin isotopes. Following the comprehensive Oslo method systematics, the NLDs of the compound nuclei were modeled using the Constant Temperature and Fermi Gas model. The PSF normalization was fixed using experimentally measured average total radiative widths from neutron resonance data, ensuring consistency with known decay properties. To account for the experimentally observed enhancement in low-energy γ-ray strength, the low-lying electric dipole response, commonly referred to as the Pygmy Dipole Resonance, was explicitly included in the calculations. The Gaussian parametrization reported by Markova et al. was converted into an equivalent Lorentzian form compatible with TALYS input requirements. Since direct PSF measurements are not available for the Sb compound nuclei populated in the Sn(p, γ) reactions, the corresponding parameters were adopted from neighboring Sn isotopes, assuming structural similarity. By incorporating these experimentally constrained NLD and PSF inputs, the calculations were constrained by local experimental data rather than by default theoretical parameters.
In nuclear astrophysics, ensuring that extrapolations remain reliable and accurate in experimentally unexplored regions is crucial. Microscopic or semi-microscopic global models are generally preferred for extrapolation because analytical models lack a means to validate the quality of extrapolated parameters. However, despite advances in various global microscopic approaches, their use remains limited by concerns about their accuracy. Moreover, they do not provide the same flexibility as phenomenological models, whose parameters can be readily modified to better fit and interpret experimental data. Consequently, the model combinations (as mentioned in Table 2) used in the present work employ the phenomenological OMP KD03 to reproduce the (p, γ) reaction cross sections, as discussed in the following section.
Model set NLD model PSF model p-OMP model TALYS I CTM SMLO KD03 TALYS II Skyrme-HFB SMLO KD03 TALYS III Skyrme-HFB SMLO JLM TALYS IV Skyrme-HFB Gogny-HFB-QRPA KD03 TALYS V Skyrme-HFB Gogny-HFB-QRPA JLM TALYS VI CTM KU-GLO KD03 TALYS VII CTM BA-SLO KD03 Table 2. Combinations of NLD, PSF, and OMP models used for cross-section calculations with TALYS 2.0. The names of the model combinations are listed in the first column. The model abbreviations mentioned above are detailed in Table 1.
-
The optical potential plays a crucial role in solving the Schrödinger equation, which yields the transmission probability of the projectile incident on the target during a reaction. This transmission probability is then used to analyze compound-nucleus reaction cross sections within the framework of Hauser-Feshbach statistical theory. The interaction between the projectile and the target nucleus in a reaction can be described using optical model potentials. The most commonly used functional form of the phenomenological optical potential for a spherical nucleus [49, 50] is written as:
$ \begin{aligned}[b] U(r,E) =& - V_{V}(E) f(r) - {\mathrm{i}}W_{V}(E) f(r) + a_{D} W_{D}(E) g(r) \\ &+ V_{SO}(r,E).l.\sigma + V_{C} (r) ,\end{aligned} $
(5) where the form factors f(r) and g(r) have Woods–Saxon forms,
$ \begin{aligned}[b] f(r)= \frac{1}{1 + {{\rm{e}}^{\left(\tfrac{r-R}{a'}\right)}}} , \quad g(r) = \frac{{\mathrm{d}} f(r)} {{\mathrm{d}}r} ,\end{aligned} $
(6) and
$ {V_{V}} $ ,$ {W_{V}} $ ,$ {W_{D}} $ , and$ {V_{SO}} $ are the real volume, imaginary volume, imaginary surface, and real spin-orbit potential depths, respectively. The term$ {V_C} $ represents the Coulomb potential. The geometrical parameters R,$ a' $ , and r refer to the effective nuclear radius, the surface diffuseness of the nucleus, and the radial distance measured from the center of the nucleus, respectively. Equation 5 allows the depths and radial parameters to be adjusted to obtain the best fit to the experimental data.The phenomenological optical model potential (OMP) implemented in TALYS is based on the formulation of Koning and Delaroche, commonly referred to as KD03 [23]. TALYS incorporates both local and global parameterizations of the KD03 OMP. By default, TALYS retrieves the local OMP parameters from its internal database. However, in the absence of a local parameterization in the nuclear structure and model parameter database, TALYS automatically applies a set of global OMP parameters. These parameters depend on the atomic number (Z) and mass number (A) of the interacting nuclei and are used to calculate the transmission coefficients. In addition to the analytical expressions for the spherical OMP, TALYS also provides the option to use the semi-microscopic Jeukenne-Lejeune-Mahaux (JLM) potential, as described in Ref. [24]. NON-SMOKER also uses the JLM model for the optical potential.
To improve the reliability of the calculated radiative capture cross sections and assess the limitations of the default theoretical inputs in TALYS, an additional set of TALYS calculations was performed using experimentally constrained nuclear level density (NLD) and photon strength function (PSF) parameters. In this approach, empirical inputs reported by Markova et al. [26] were adopted for the Sn isotopic chain. The statistical model calculations were guided by recent experimental information available for neighboring tin isotopes. Following the comprehensive Oslo method systematics, the NLDs of the compound nuclei were modeled using the Constant Temperature and Fermi Gas model. The PSF normalization was fixed using experimentally measured average total radiative widths from neutron resonance data, ensuring consistency with known decay properties. To account for the experimentally observed enhancement in low-energy γ-ray strength, the low-lying electric dipole response, commonly referred to as the Pygmy Dipole Resonance, was explicitly included in the calculations. The Gaussian parametrization reported by Markova et al. was converted into an equivalent Lorentzian form compatible with TALYS input requirements. Since direct PSF measurements are not available for the Sb compound nuclei populated in the Sn(p, γ) reactions, the corresponding parameters were adopted from neighboring Sn isotopes, assuming structural similarity. By incorporating these experimentally constrained NLD and PSF inputs, the calculations were constrained by local experimental data rather than by default theoretical parameters.
In nuclear astrophysics, ensuring that extrapolations remain reliable and accurate in experimentally unexplored regions is crucial. Microscopic or semi-microscopic global models are generally preferred for extrapolation because analytical models lack a means to validate the quality of extrapolated parameters. However, despite advances in various global microscopic approaches, their use remains limited by concerns about their accuracy. Moreover, they do not provide the same flexibility as phenomenological models, whose parameters can be readily modified to better fit and interpret experimental data. Consequently, the model combinations (as mentioned in Table 2) used in the present work employ the phenomenological OMP KD03 to reproduce the (p, γ) reaction cross sections, as discussed in the following section.
Model set NLD model PSF model p-OMP model TALYS I CTM SMLO KD03 TALYS II Skyrme-HFB SMLO KD03 TALYS III Skyrme-HFB SMLO JLM TALYS IV Skyrme-HFB Gogny-HFB-QRPA KD03 TALYS V Skyrme-HFB Gogny-HFB-QRPA JLM TALYS VI CTM KU-GLO KD03 TALYS VII CTM BA-SLO KD03 Table 2. Combinations of NLD, PSF, and OMP models used for cross-section calculations with TALYS 2.0. The names of the model combinations are listed in the first column. The model abbreviations mentioned above are detailed in Table 1.
-
The optical potential plays a crucial role in solving the Schrödinger equation, which yields the transmission probability of the projectile incident on the target during a reaction. This transmission probability is then used to analyze compound-nucleus reaction cross sections within the framework of Hauser-Feshbach statistical theory. The interaction between the projectile and the target nucleus in a reaction can be described using optical model potentials. The most commonly used functional form of the phenomenological optical potential for a spherical nucleus [49, 50] is written as:
$ \begin{aligned}[b] U(r,E) =& - V_{V}(E) f(r) - {\mathrm{i}}W_{V}(E) f(r) + a_{D} W_{D}(E) g(r) \\ &+ V_{SO}(r,E).l.\sigma + V_{C} (r) ,\end{aligned} $
(5) where the form factors f(r) and g(r) have Woods–Saxon forms,
$ \begin{aligned}[b] f(r)= \frac{1}{1 + {{\rm{e}}^{\left(\tfrac{r-R}{a'}\right)}}} , \quad g(r) = \frac{{\mathrm{d}} f(r)} {{\mathrm{d}}r} ,\end{aligned} $
(6) and
$ {V_{V}} $ ,$ {W_{V}} $ ,$ {W_{D}} $ , and$ {V_{SO}} $ are the real volume, imaginary volume, imaginary surface, and real spin-orbit potential depths, respectively. The term$ {V_C} $ represents the Coulomb potential. The geometrical parameters R,$ a' $ , and r refer to the effective nuclear radius, the surface diffuseness of the nucleus, and the radial distance measured from the center of the nucleus, respectively. Equation 5 allows the depths and radial parameters to be adjusted to obtain the best fit to the experimental data.The phenomenological optical model potential (OMP) implemented in TALYS is based on the formulation of Koning and Delaroche, commonly referred to as KD03 [23]. TALYS incorporates both local and global parameterizations of the KD03 OMP. By default, TALYS retrieves the local OMP parameters from its internal database. However, in the absence of a local parameterization in the nuclear structure and model parameter database, TALYS automatically applies a set of global OMP parameters. These parameters depend on the atomic number (Z) and mass number (A) of the interacting nuclei and are used to calculate the transmission coefficients. In addition to the analytical expressions for the spherical OMP, TALYS also provides the option to use the semi-microscopic Jeukenne-Lejeune-Mahaux (JLM) potential, as described in Ref. [24]. NON-SMOKER also uses the JLM model for the optical potential.
To improve the reliability of the calculated radiative capture cross sections and assess the limitations of the default theoretical inputs in TALYS, an additional set of TALYS calculations was performed using experimentally constrained nuclear level density (NLD) and photon strength function (PSF) parameters. In this approach, empirical inputs reported by Markova et al. [26] were adopted for the Sn isotopic chain. The statistical model calculations were guided by recent experimental information available for neighboring tin isotopes. Following the comprehensive Oslo method systematics, the NLDs of the compound nuclei were modeled using the Constant Temperature and Fermi Gas model. The PSF normalization was fixed using experimentally measured average total radiative widths from neutron resonance data, ensuring consistency with known decay properties. To account for the experimentally observed enhancement in low-energy γ-ray strength, the low-lying electric dipole response, commonly referred to as the Pygmy Dipole Resonance, was explicitly included in the calculations. The Gaussian parametrization reported by Markova et al. was converted into an equivalent Lorentzian form compatible with TALYS input requirements. Since direct PSF measurements are not available for the Sb compound nuclei populated in the Sn(p, γ) reactions, the corresponding parameters were adopted from neighboring Sn isotopes, assuming structural similarity. By incorporating these experimentally constrained NLD and PSF inputs, the calculations were constrained by local experimental data rather than by default theoretical parameters.
In nuclear astrophysics, ensuring that extrapolations remain reliable and accurate in experimentally unexplored regions is crucial. Microscopic or semi-microscopic global models are generally preferred for extrapolation because analytical models lack a means to validate the quality of extrapolated parameters. However, despite advances in various global microscopic approaches, their use remains limited by concerns about their accuracy. Moreover, they do not provide the same flexibility as phenomenological models, whose parameters can be readily modified to better fit and interpret experimental data. Consequently, the model combinations (as mentioned in Table 2) used in the present work employ the phenomenological OMP KD03 to reproduce the (p, γ) reaction cross sections, as discussed in the following section.
Model set NLD model PSF model p-OMP model TALYS I CTM SMLO KD03 TALYS II Skyrme-HFB SMLO KD03 TALYS III Skyrme-HFB SMLO JLM TALYS IV Skyrme-HFB Gogny-HFB-QRPA KD03 TALYS V Skyrme-HFB Gogny-HFB-QRPA JLM TALYS VI CTM KU-GLO KD03 TALYS VII CTM BA-SLO KD03 Table 2. Combinations of NLD, PSF, and OMP models used for cross-section calculations with TALYS 2.0. The names of the model combinations are listed in the first column. The model abbreviations mentioned above are detailed in Table 1.
-
The optical potential plays a crucial role in solving the Schrödinger equation, which yields the transmission probability of the projectile incident on the target during a reaction. This transmission probability is then used to analyze compound-nucleus reaction cross sections within the framework of Hauser-Feshbach statistical theory. The interaction between the projectile and the target nucleus in a reaction can be described using optical model potentials. The most commonly used functional form of the phenomenological optical potential for a spherical nucleus [49, 50] is written as:
$ \begin{aligned}[b] U(r,E) =& - V_{V}(E) f(r) - {\mathrm{i}}W_{V}(E) f(r) + a_{D} W_{D}(E) g(r) \\ &+ V_{SO}(r,E).l.\sigma + V_{C} (r) ,\end{aligned} $
(5) where the form factors f(r) and g(r) have Woods–Saxon forms,
$ \begin{aligned}[b] f(r)= \frac{1}{1 + {{\rm{e}}^{\left(\tfrac{r-R}{a'}\right)}}} , \quad g(r) = \frac{{\mathrm{d}} f(r)} {{\mathrm{d}}r} ,\end{aligned} $
(6) and
$ {V_{V}} $ ,$ {W_{V}} $ ,$ {W_{D}} $ , and$ {V_{SO}} $ are the real volume, imaginary volume, imaginary surface, and real spin-orbit potential depths, respectively. The term$ {V_C} $ represents the Coulomb potential. The geometrical parameters R,$ a' $ , and r refer to the effective nuclear radius, the surface diffuseness of the nucleus, and the radial distance measured from the center of the nucleus, respectively. Equation 5 allows the depths and radial parameters to be adjusted to obtain the best fit to the experimental data.The phenomenological optical model potential (OMP) implemented in TALYS is based on the formulation of Koning and Delaroche, commonly referred to as KD03 [23]. TALYS incorporates both local and global parameterizations of the KD03 OMP. By default, TALYS retrieves the local OMP parameters from its internal database. However, in the absence of a local parameterization in the nuclear structure and model parameter database, TALYS automatically applies a set of global OMP parameters. These parameters depend on the atomic number (Z) and mass number (A) of the interacting nuclei and are used to calculate the transmission coefficients. In addition to the analytical expressions for the spherical OMP, TALYS also provides the option to use the semi-microscopic Jeukenne-Lejeune-Mahaux (JLM) potential, as described in Ref. [24]. NON-SMOKER also uses the JLM model for the optical potential.
To improve the reliability of the calculated radiative capture cross sections and assess the limitations of the default theoretical inputs in TALYS, an additional set of TALYS calculations was performed using experimentally constrained nuclear level density (NLD) and photon strength function (PSF) parameters. In this approach, empirical inputs reported by Markova et al. [26] were adopted for the Sn isotopic chain. The statistical model calculations were guided by recent experimental information available for neighboring tin isotopes. Following the comprehensive Oslo method systematics, the NLDs of the compound nuclei were modeled using the Constant Temperature and Fermi Gas model. The PSF normalization was fixed using experimentally measured average total radiative widths from neutron resonance data, ensuring consistency with known decay properties. To account for the experimentally observed enhancement in low-energy γ-ray strength, the low-lying electric dipole response, commonly referred to as the Pygmy Dipole Resonance, was explicitly included in the calculations. The Gaussian parametrization reported by Markova et al. was converted into an equivalent Lorentzian form compatible with TALYS input requirements. Since direct PSF measurements are not available for the Sb compound nuclei populated in the Sn(p, γ) reactions, the corresponding parameters were adopted from neighboring Sn isotopes, assuming structural similarity. By incorporating these experimentally constrained NLD and PSF inputs, the calculations were constrained by local experimental data rather than by default theoretical parameters.
In nuclear astrophysics, ensuring that extrapolations remain reliable and accurate in experimentally unexplored regions is crucial. Microscopic or semi-microscopic global models are generally preferred for extrapolation because analytical models lack a means to validate the quality of extrapolated parameters. However, despite advances in various global microscopic approaches, their use remains limited by concerns about their accuracy. Moreover, they do not provide the same flexibility as phenomenological models, whose parameters can be readily modified to better fit and interpret experimental data. Consequently, the model combinations (as mentioned in Table 2) used in the present work employ the phenomenological OMP KD03 to reproduce the (p, γ) reaction cross sections, as discussed in the following section.
Model set NLD model PSF model p-OMP model TALYS I CTM SMLO KD03 TALYS II Skyrme-HFB SMLO KD03 TALYS III Skyrme-HFB SMLO JLM TALYS IV Skyrme-HFB Gogny-HFB-QRPA KD03 TALYS V Skyrme-HFB Gogny-HFB-QRPA JLM TALYS VI CTM KU-GLO KD03 TALYS VII CTM BA-SLO KD03 Table 2. Combinations of NLD, PSF, and OMP models used for cross-section calculations with TALYS 2.0. The names of the model combinations are listed in the first column. The model abbreviations mentioned above are detailed in Table 1.
-
To quantify the agreement between the calculated and measured (p, γ) cross sections across the studied mass range, two statistical methods, chi-square and relative variance analyses, were used. For experimental data points at energies
$ E_i $ with measured cross sections$ \sigma_i^{\mathrm{exp}} $ and uncertainties$ \Delta\sigma_i $ , and the corresponding calculated cross sections$ \sigma_i^{\mathrm{cal}} $ , the chi-square is defined as [51]:$ \begin{aligned}[b] \chi^{2} =\sum_{i=1}^{N}\left(\frac{\sigma_i^{\rm cal}-\sigma_i^{\exp}}{\Delta\sigma_i}\right)^{2}. \end{aligned} $
(7) Here, N denotes the number of experimental data points. A smaller
$ \chi^2 $ value indicates greater statistical consistency with the measured data when the experimental uncertainties are small. The relative variance D is defined as [22, 52]:$ \begin{aligned}[b] D=\frac{1}{N}\sum_{i=1}^{N}\left|\frac{\sigma_i^{\rm cal}-\sigma_i^{\exp}}{\sigma_i^{\exp}}\right|. \end{aligned} $
(8) The quantity D represents the mean fractional deviation between the calculated and measured cross sections across the energy range considered. It is scale-free and does not incorporate the experimental uncertainty bars. Therefore, the smallest value of D corresponds to the model that agrees most closely with the experimental cross sections.
Both
$ \chi^2 $ and D are used for the numerical analysis because D compares only the calculated results with the experimental data, whereas$ \chi^2 $ also incorporates the experimental uncertainties as a parameter in the calculations. Taken together,$ \chi^2 $ (uncertainty-aware) and D (scale-free) provide a balanced assessment of both statistical consistency and practical accuracy. Applying these quantitative diagnostics across many isotopes allows us to identify the TALYS input combinations (optical potentials, level densities, γ-strength models, etc.) that minimize$ \chi^2 $ and/or D globally, rather than for a single case. Such constraints improve the predictive reliability of (p, γ) cross sections for nuclei for which data are unavailable and feed directly into reaction-rate libraries, thereby reducing systematic uncertainties in network calculations. In turn, outliers (large D or large contributions to$ \chi^2 $ ) indicate the most impactful targets for new measurements, further constraining model inputs and improving future rate predictions. -
To quantify the agreement between the calculated and measured (p, γ) cross sections across the studied mass range, two statistical methods, chi-square and relative variance analyses, were used. For experimental data points at energies
$ E_i $ with measured cross sections$ \sigma_i^{\mathrm{exp}} $ and uncertainties$ \Delta\sigma_i $ , and the corresponding calculated cross sections$ \sigma_i^{\mathrm{cal}} $ , the chi-square is defined as [51]:$ \begin{aligned}[b] \chi^{2} =\sum_{i=1}^{N}\left(\frac{\sigma_i^{\rm cal}-\sigma_i^{\exp}}{\Delta\sigma_i}\right)^{2}. \end{aligned} $
(7) Here, N denotes the number of experimental data points. A smaller
$ \chi^2 $ value indicates greater statistical consistency with the measured data when the experimental uncertainties are small. The relative variance D is defined as [22, 52]:$ \begin{aligned}[b] D=\frac{1}{N}\sum_{i=1}^{N}\left|\frac{\sigma_i^{\rm cal}-\sigma_i^{\exp}}{\sigma_i^{\exp}}\right|. \end{aligned} $
(8) The quantity D represents the mean fractional deviation between the calculated and measured cross sections across the energy range considered. It is scale-free and does not incorporate the experimental uncertainty bars. Therefore, the smallest value of D corresponds to the model that agrees most closely with the experimental cross sections.
Both
$ \chi^2 $ and D are used for the numerical analysis because D compares only the calculated results with the experimental data, whereas$ \chi^2 $ also incorporates the experimental uncertainties as a parameter in the calculations. Taken together,$ \chi^2 $ (uncertainty-aware) and D (scale-free) provide a balanced assessment of both statistical consistency and practical accuracy. Applying these quantitative diagnostics across many isotopes allows us to identify the TALYS input combinations (optical potentials, level densities, γ-strength models, etc.) that minimize$ \chi^2 $ and/or D globally, rather than for a single case. Such constraints improve the predictive reliability of (p, γ) cross sections for nuclei for which data are unavailable and feed directly into reaction-rate libraries, thereby reducing systematic uncertainties in network calculations. In turn, outliers (large D or large contributions to$ \chi^2 $ ) indicate the most impactful targets for new measurements, further constraining model inputs and improving future rate predictions. -
To quantify the agreement between the calculated and measured (p, γ) cross sections across the studied mass range, two statistical methods, chi-square and relative variance analyses, were used. For experimental data points at energies
$ E_i $ with measured cross sections$ \sigma_i^{\mathrm{exp}} $ and uncertainties$ \Delta\sigma_i $ , and the corresponding calculated cross sections$ \sigma_i^{\mathrm{cal}} $ , the chi-square is defined as [51]:$ \begin{aligned}[b] \chi^{2} =\sum_{i=1}^{N}\left(\frac{\sigma_i^{\rm cal}-\sigma_i^{\exp}}{\Delta\sigma_i}\right)^{2}. \end{aligned} $
(7) Here, N denotes the number of experimental data points. A smaller
$ \chi^2 $ value indicates greater statistical consistency with the measured data when the experimental uncertainties are small. The relative variance D is defined as [22, 52]:$ \begin{aligned}[b] D=\frac{1}{N}\sum_{i=1}^{N}\left|\frac{\sigma_i^{\rm cal}-\sigma_i^{\exp}}{\sigma_i^{\exp}}\right|. \end{aligned} $
(8) The quantity D represents the mean fractional deviation between the calculated and measured cross sections across the energy range considered. It is scale-free and does not incorporate the experimental uncertainty bars. Therefore, the smallest value of D corresponds to the model that agrees most closely with the experimental cross sections.
Both
$ \chi^2 $ and D are used for the numerical analysis because D compares only the calculated results with the experimental data, whereas$ \chi^2 $ also incorporates the experimental uncertainties as a parameter in the calculations. Taken together,$ \chi^2 $ (uncertainty-aware) and D (scale-free) provide a balanced assessment of both statistical consistency and practical accuracy. Applying these quantitative diagnostics across many isotopes allows us to identify the TALYS input combinations (optical potentials, level densities, γ-strength models, etc.) that minimize$ \chi^2 $ and/or D globally, rather than for a single case. Such constraints improve the predictive reliability of (p, γ) cross sections for nuclei for which data are unavailable and feed directly into reaction-rate libraries, thereby reducing systematic uncertainties in network calculations. In turn, outliers (large D or large contributions to$ \chi^2 $ ) indicate the most impactful targets for new measurements, further constraining model inputs and improving future rate predictions. -
To quantify the agreement between the calculated and measured (p, γ) cross sections across the studied mass range, two statistical methods, chi-square and relative variance analyses, were used. For experimental data points at energies
$ E_i $ with measured cross sections$ \sigma_i^{\mathrm{exp}} $ and uncertainties$ \Delta\sigma_i $ , and the corresponding calculated cross sections$ \sigma_i^{\mathrm{cal}} $ , the chi-square is defined as [51]:$ \begin{aligned}[b] \chi^{2} =\sum_{i=1}^{N}\left(\frac{\sigma_i^{\rm cal}-\sigma_i^{\exp}}{\Delta\sigma_i}\right)^{2}. \end{aligned} $
(7) Here, N denotes the number of experimental data points. A smaller
$ \chi^2 $ value indicates greater statistical consistency with the measured data when the experimental uncertainties are small. The relative variance D is defined as [22, 52]:$ \begin{aligned}[b] D=\frac{1}{N}\sum_{i=1}^{N}\left|\frac{\sigma_i^{\rm cal}-\sigma_i^{\exp}}{\sigma_i^{\exp}}\right|. \end{aligned} $
(8) The quantity D represents the mean fractional deviation between the calculated and measured cross sections across the energy range considered. It is scale-free and does not incorporate the experimental uncertainty bars. Therefore, the smallest value of D corresponds to the model that agrees most closely with the experimental cross sections.
Both
$ \chi^2 $ and D are used for the numerical analysis because D compares only the calculated results with the experimental data, whereas$ \chi^2 $ also incorporates the experimental uncertainties as a parameter in the calculations. Taken together,$ \chi^2 $ (uncertainty-aware) and D (scale-free) provide a balanced assessment of both statistical consistency and practical accuracy. Applying these quantitative diagnostics across many isotopes allows us to identify the TALYS input combinations (optical potentials, level densities, γ-strength models, etc.) that minimize$ \chi^2 $ and/or D globally, rather than for a single case. Such constraints improve the predictive reliability of (p, γ) cross sections for nuclei for which data are unavailable and feed directly into reaction-rate libraries, thereby reducing systematic uncertainties in network calculations. In turn, outliers (large D or large contributions to$ \chi^2 $ ) indicate the most impactful targets for new measurements, further constraining model inputs and improving future rate predictions. -
To quantify the agreement between the calculated and measured (p, γ) cross sections across the studied mass range, two statistical methods, chi-square and relative variance analyses, were used. For experimental data points at energies
$ E_i $ with measured cross sections$ \sigma_i^{\mathrm{exp}} $ and uncertainties$ \Delta\sigma_i $ , and the corresponding calculated cross sections$ \sigma_i^{\mathrm{cal}} $ , the chi-square is defined as [51]:$ \begin{aligned}[b] \chi^{2} =\sum_{i=1}^{N}\left(\frac{\sigma_i^{\rm cal}-\sigma_i^{\exp}}{\Delta\sigma_i}\right)^{2}. \end{aligned} $
(7) Here, N denotes the number of experimental data points. A smaller
$ \chi^2 $ value indicates greater statistical consistency with the measured data when the experimental uncertainties are small. The relative variance D is defined as [22, 52]:$ \begin{aligned}[b] D=\frac{1}{N}\sum_{i=1}^{N}\left|\frac{\sigma_i^{\rm cal}-\sigma_i^{\exp}}{\sigma_i^{\exp}}\right|. \end{aligned} $
(8) The quantity D represents the mean fractional deviation between the calculated and measured cross sections across the energy range considered. It is scale-free and does not incorporate the experimental uncertainty bars. Therefore, the smallest value of D corresponds to the model that agrees most closely with the experimental cross sections.
Both
$ \chi^2 $ and D are used for the numerical analysis because D compares only the calculated results with the experimental data, whereas$ \chi^2 $ also incorporates the experimental uncertainties as a parameter in the calculations. Taken together,$ \chi^2 $ (uncertainty-aware) and D (scale-free) provide a balanced assessment of both statistical consistency and practical accuracy. Applying these quantitative diagnostics across many isotopes allows us to identify the TALYS input combinations (optical potentials, level densities, γ-strength models, etc.) that minimize$ \chi^2 $ and/or D globally, rather than for a single case. Such constraints improve the predictive reliability of (p, γ) cross sections for nuclei for which data are unavailable and feed directly into reaction-rate libraries, thereby reducing systematic uncertainties in network calculations. In turn, outliers (large D or large contributions to$ \chi^2 $ ) indicate the most impactful targets for new measurements, further constraining model inputs and improving future rate predictions. -
In low-energy proton-induced reactions, bound electrons in the target material enhance the measured cross sections relative to their bare-nucleus values. This phenomenon, known as electron screening, effectively reduces the Coulomb barrier experienced by the incident proton, thereby increasing the reaction probability under laboratory conditions compared with stellar environments. To account for this effect, a systematic electron-screening correction was applied to the experimentally measured (p, γ) cross sections across the atomic-number range
$ Z=42-56 $ . The correction factor fs(E), defined as the ratio of the screened to the bare cross section, was calculated using the enhancement-factor formalism [19, 53].$ \begin{aligned}[b] f_{s}(E) = \frac{E_{\rm C.M.}}{E_{\rm C.M.} + U_s} {\mathrm{exp}} \left(\frac{\pi \eta(E) U_s}{E_{\rm C.M.}} \right) .\end{aligned} $
(9) Here,
$ E_{\rm C.M.} $ is the total kinetic energy of protons in the center-of-mass frame, η is the Sommerfeld parameter, and$ U_s $ is the screening potential. The key input in this formulation is the electron screening potential. Studies of the D(d, p)3H reaction in various metal hosts consistently report a screening potential of$ U_s \approx 300 $ eV (± 30 eV) [53]. Although uncertainty remains regarding the precise value of Us, the choice of Us ≈ 300 eV represents a reasonable and widely adopted estimate that minimizes systematic uncertainties in the derived bare-nucleus cross sections and resulting reaction rates. Hence, after correcting the laboratory-measured cross sections for electron screening, the bare-nucleus cross sections are obtained as,$ \begin{aligned}[b] \sigma_{\rm bare} (E) = \frac{\sigma_{\rm meas} (E)}{f_{s}(E)} .\end{aligned} $
(10) In the present work, the available experimental (p, γ) cross sections for Sn isotopes and neighboring nuclei were corrected for electron-screening effects to extract the bare-nucleus cross sections,
$ \sigma_{\rm bare} $ . These cross sections were subsequently compared with the TALYS-predicted cross sections for the various (p, γ) reactions investigated in this work. Hereafter, the measured or experimental cross sections refer to the bare-nucleus cross sections,$ \sigma_{\rm bare} $ .For the reactions studied in this work, the factor
$ f_s $ was close to unity, indicating that$ \sigma_{\rm bare} $ did not differ substantially from$ \sigma_{\rm meas} $ . Nevertheless,$ \sigma_{\rm bare} $ was used for comparison with TALYS because this procedure should be followed for reactions in stellar environments. -
In low-energy proton-induced reactions, bound electrons in the target material enhance the measured cross sections relative to their bare-nucleus values. This phenomenon, known as electron screening, effectively reduces the Coulomb barrier experienced by the incident proton, thereby increasing the reaction probability under laboratory conditions compared with stellar environments. To account for this effect, a systematic electron-screening correction was applied to the experimentally measured (p, γ) cross sections across the atomic-number range
$ Z=42-56 $ . The correction factor fs(E), defined as the ratio of the screened to the bare cross section, was calculated using the enhancement-factor formalism [19, 53].$ \begin{aligned}[b] f_{s}(E) = \frac{E_{\rm C.M.}}{E_{\rm C.M.} + U_s} {\mathrm{exp}} \left(\frac{\pi \eta(E) U_s}{E_{\rm C.M.}} \right) .\end{aligned} $
(9) Here,
$ E_{\rm C.M.} $ is the total kinetic energy of protons in the center-of-mass frame, η is the Sommerfeld parameter, and$ U_s $ is the screening potential. The key input in this formulation is the electron screening potential. Studies of the D(d, p)3H reaction in various metal hosts consistently report a screening potential of$ U_s \approx 300 $ eV (± 30 eV) [53]. Although uncertainty remains regarding the precise value of Us, the choice of Us ≈ 300 eV represents a reasonable and widely adopted estimate that minimizes systematic uncertainties in the derived bare-nucleus cross sections and resulting reaction rates. Hence, after correcting the laboratory-measured cross sections for electron screening, the bare-nucleus cross sections are obtained as,$ \begin{aligned}[b] \sigma_{\rm bare} (E) = \frac{\sigma_{\rm meas} (E)}{f_{s}(E)} .\end{aligned} $
(10) In the present work, the available experimental (p, γ) cross sections for Sn isotopes and neighboring nuclei were corrected for electron-screening effects to extract the bare-nucleus cross sections,
$ \sigma_{\rm bare} $ . These cross sections were subsequently compared with the TALYS-predicted cross sections for the various (p, γ) reactions investigated in this work. Hereafter, the measured or experimental cross sections refer to the bare-nucleus cross sections,$ \sigma_{\rm bare} $ .For the reactions studied in this work, the factor
$ f_s $ was close to unity, indicating that$ \sigma_{\rm bare} $ did not differ substantially from$ \sigma_{\rm meas} $ . Nevertheless,$ \sigma_{\rm bare} $ was used for comparison with TALYS because this procedure should be followed for reactions in stellar environments. -
In low-energy proton-induced reactions, bound electrons in the target material enhance the measured cross sections relative to their bare-nucleus values. This phenomenon, known as electron screening, effectively reduces the Coulomb barrier experienced by the incident proton, thereby increasing the reaction probability under laboratory conditions compared with stellar environments. To account for this effect, a systematic electron-screening correction was applied to the experimentally measured (p, γ) cross sections across the atomic-number range
$ Z=42-56 $ . The correction factor fs(E), defined as the ratio of the screened to the bare cross section, was calculated using the enhancement-factor formalism [19, 53].$ \begin{aligned}[b] f_{s}(E) = \frac{E_{\rm C.M.}}{E_{\rm C.M.} + U_s} {\mathrm{exp}} \left(\frac{\pi \eta(E) U_s}{E_{\rm C.M.}} \right) .\end{aligned} $
(9) Here,
$ E_{\rm C.M.} $ is the total kinetic energy of protons in the center-of-mass frame, η is the Sommerfeld parameter, and$ U_s $ is the screening potential. The key input in this formulation is the electron screening potential. Studies of the D(d, p)3H reaction in various metal hosts consistently report a screening potential of$ U_s \approx 300 $ eV (± 30 eV) [53]. Although uncertainty remains regarding the precise value of Us, the choice of Us ≈ 300 eV represents a reasonable and widely adopted estimate that minimizes systematic uncertainties in the derived bare-nucleus cross sections and resulting reaction rates. Hence, after correcting the laboratory-measured cross sections for electron screening, the bare-nucleus cross sections are obtained as,$ \begin{aligned}[b] \sigma_{\rm bare} (E) = \frac{\sigma_{\rm meas} (E)}{f_{s}(E)} .\end{aligned} $
(10) In the present work, the available experimental (p, γ) cross sections for Sn isotopes and neighboring nuclei were corrected for electron-screening effects to extract the bare-nucleus cross sections,
$ \sigma_{\rm bare} $ . These cross sections were subsequently compared with the TALYS-predicted cross sections for the various (p, γ) reactions investigated in this work. Hereafter, the measured or experimental cross sections refer to the bare-nucleus cross sections,$ \sigma_{\rm bare} $ .For the reactions studied in this work, the factor
$ f_s $ was close to unity, indicating that$ \sigma_{\rm bare} $ did not differ substantially from$ \sigma_{\rm meas} $ . Nevertheless,$ \sigma_{\rm bare} $ was used for comparison with TALYS because this procedure should be followed for reactions in stellar environments. -
In low-energy proton-induced reactions, bound electrons in the target material enhance the measured cross sections relative to their bare-nucleus values. This phenomenon, known as electron screening, effectively reduces the Coulomb barrier experienced by the incident proton, thereby increasing the reaction probability under laboratory conditions compared with stellar environments. To account for this effect, a systematic electron-screening correction was applied to the experimentally measured (p, γ) cross sections across the atomic-number range
$ Z=42-56 $ . The correction factor fs(E), defined as the ratio of the screened to the bare cross section, was calculated using the enhancement-factor formalism [19, 53].$ \begin{aligned}[b] f_{s}(E) = \frac{E_{\rm C.M.}}{E_{\rm C.M.} + U_s} {\mathrm{exp}} \left(\frac{\pi \eta(E) U_s}{E_{\rm C.M.}} \right) .\end{aligned} $
(9) Here,
$ E_{\rm C.M.} $ is the total kinetic energy of protons in the center-of-mass frame, η is the Sommerfeld parameter, and$ U_s $ is the screening potential. The key input in this formulation is the electron screening potential. Studies of the D(d, p)3H reaction in various metal hosts consistently report a screening potential of$ U_s \approx 300 $ eV (± 30 eV) [53]. Although uncertainty remains regarding the precise value of Us, the choice of Us ≈ 300 eV represents a reasonable and widely adopted estimate that minimizes systematic uncertainties in the derived bare-nucleus cross sections and resulting reaction rates. Hence, after correcting the laboratory-measured cross sections for electron screening, the bare-nucleus cross sections are obtained as,$ \begin{aligned}[b] \sigma_{\rm bare} (E) = \frac{\sigma_{\rm meas} (E)}{f_{s}(E)} .\end{aligned} $
(10) In the present work, the available experimental (p, γ) cross sections for Sn isotopes and neighboring nuclei were corrected for electron-screening effects to extract the bare-nucleus cross sections,
$ \sigma_{\rm bare} $ . These cross sections were subsequently compared with the TALYS-predicted cross sections for the various (p, γ) reactions investigated in this work. Hereafter, the measured or experimental cross sections refer to the bare-nucleus cross sections,$ \sigma_{\rm bare} $ .For the reactions studied in this work, the factor
$ f_s $ was close to unity, indicating that$ \sigma_{\rm bare} $ did not differ substantially from$ \sigma_{\rm meas} $ . Nevertheless,$ \sigma_{\rm bare} $ was used for comparison with TALYS because this procedure should be followed for reactions in stellar environments. -
In low-energy proton-induced reactions, bound electrons in the target material enhance the measured cross sections relative to their bare-nucleus values. This phenomenon, known as electron screening, effectively reduces the Coulomb barrier experienced by the incident proton, thereby increasing the reaction probability under laboratory conditions compared with stellar environments. To account for this effect, a systematic electron-screening correction was applied to the experimentally measured (p, γ) cross sections across the atomic-number range
$ Z=42-56 $ . The correction factor fs(E), defined as the ratio of the screened to the bare cross section, was calculated using the enhancement-factor formalism [19, 53].$ \begin{aligned}[b] f_{s}(E) = \frac{E_{\rm C.M.}}{E_{\rm C.M.} + U_s} {\mathrm{exp}} \left(\frac{\pi \eta(E) U_s}{E_{\rm C.M.}} \right) .\end{aligned} $
(9) Here,
$ E_{\rm C.M.} $ is the total kinetic energy of protons in the center-of-mass frame, η is the Sommerfeld parameter, and$ U_s $ is the screening potential. The key input in this formulation is the electron screening potential. Studies of the D(d, p)3H reaction in various metal hosts consistently report a screening potential of$ U_s \approx 300 $ eV (± 30 eV) [53]. Although uncertainty remains regarding the precise value of Us, the choice of Us ≈ 300 eV represents a reasonable and widely adopted estimate that minimizes systematic uncertainties in the derived bare-nucleus cross sections and resulting reaction rates. Hence, after correcting the laboratory-measured cross sections for electron screening, the bare-nucleus cross sections are obtained as,$ \begin{aligned}[b] \sigma_{\rm bare} (E) = \frac{\sigma_{\rm meas} (E)}{f_{s}(E)} .\end{aligned} $
(10) In the present work, the available experimental (p, γ) cross sections for Sn isotopes and neighboring nuclei were corrected for electron-screening effects to extract the bare-nucleus cross sections,
$ \sigma_{\rm bare} $ . These cross sections were subsequently compared with the TALYS-predicted cross sections for the various (p, γ) reactions investigated in this work. Hereafter, the measured or experimental cross sections refer to the bare-nucleus cross sections,$ \sigma_{\rm bare} $ .For the reactions studied in this work, the factor
$ f_s $ was close to unity, indicating that$ \sigma_{\rm bare} $ did not differ substantially from$ \sigma_{\rm meas} $ . Nevertheless,$ \sigma_{\rm bare} $ was used for comparison with TALYS because this procedure should be followed for reactions in stellar environments. -
TALYS provides a user-friendly input framework in which parameters such as the projectile, target, and energy range must be specified. The calculated results are then compared with experimental data extracted from the EXFOR database [54] and with theoretical predictions from the NON-SMOKER database [18], which is available online.
In this work, a systematic investigation was conducted to analyze the influence of different nuclear input models, namely the photon strength function (PSF), nuclear level density (NLD), and optical model potential (OMP), on (p, γ) reactions involving Sn isotopes within the TALYS framework. This approach enables the identification of a set of nuclear model combinations that can reliably reproduce the available experimental cross sections.
The different model combinations used in this work are summarized in Table 2. Their compatibility with the experimental data was evaluated both visually and quantitatively. The model combination "TALYS I" refers to the standard default settings of the TALYS code. The model set "TALYS II" differs from TALYS I in the choice of NLD, employing the microscopic Skyrme-Hartree-Fock-Bogoliubov (Skyrme-HFB) model [29]. In "TALYS III," the semi-microscopic Jeukenne-Lejeune-Mahaux (JLM) [24] optical model potential is used instead of the phenomenological OMP of Koning and Delaroche (KD03) [23]. The model sets "TALYS IV" and "TALYS V" employ the semi-microscopic temperature-dependent HFB plus QRPA model using the D1M Gogny force (Gogny-HFB-QRPA) [46] for the PSF instead of the default phenomenological Simplified Modified Lorentzian (SMLO) model [25, 44]; the former uses the phenomenological KD03 OMP, whereas the latter uses the JLM potential. The model sets "TALYS VI" and "TALYS VII" differ from TALYS I in the choice of PSF model: TALYS VI employs the Generalized Lorentzian model of Kopecky and Uhl (KU-GLO) [40, 41], whereas TALYS VII uses the Brink-Axel Standard Lorentzian model (BA-SLO) [37, 38]. In addition, the TALYS VI model set is experimentally constrained by employing the NLD and PSF parameters from the systematic study of Sn isotopes by Markova et al. [26]. Using the Constant Temperature model (CTM) [30] for the NLD, the experimental average neutron resonance spacing (
$ D_0 $ ), nuclear temperature (T), and spin cut-off parameters evaluated at the neutron separation energy were reproduced consistently with the experimental values derived in Ref. [26]. Additionally, the low-energy dipole strength, including the pygmy dipole resonance observed in the experimental study, is explicitly incorporated. In the absence of direct measurements for the compound Sb nuclei, the PSF parameters were adopted from the neighboring Sn isotopes.Table 3 summarizes the
$ \chi^2 $ and D values obtained using Eqs. (7) and (8) for the different TALYS model combinations across Sn isotopes and neighboring nuclei. A comparison of the experimental cross sections with different model combinations in the TALYS framework is discussed in the following two subsections.Reaction TALYS I TALYS II TALYS III $ \chi^2 $ D $ \chi^2 $ D $ \chi^2 $ D 112Sn(p, γ)113Sb [15] 2.86 0.162 2.26 0.150 114Sn(p, γ)115Sb [17] 0.853 0.157 0.517 0.121 115Sn(p, γ)116Sb [20] 21.5 0.657 4.61 0.308 116Sn(p, γ)117Sb [16] 7.73 0.486 6.69 0.487 [17] 10.2 0.557 10.6 0.576 [19] 8.5 0.517 4.61 0.308 118Sn(p, γ)119Sb [19] 0.797 0.155 0.641 0.127 119Sn(p, γ)120Sb [15] 32.3 0.704 32.2 0.709 12.0 0.387 92Mo(p, γ)93Tc [55, 56] 21.5 0.657 4.61 0.308 94Mo(p, γ)95Tc [55, 56] 4.01 0.415 25.1 0.726 95Mo(p, γ)96Tc [56] 7.02 0.243 3.609 0.185 97Mo(p, γ)98Tc [55] 1.42 0.352 0.355 0.171 98Mo(p, γ)99Tc [55] 1.21 0.184 0.855 0.151 100Mo(p, γ)101Tc [55] 7.98 0.687 2.45 0.375 96Ru(p, γ)97Rh [57] 238 1.55 465 2.12 98Ru(p, γ)99Rh [57] 11.1 0.375 10.8 0.37 99Ru(p, γ)100Rh [57] 54.0 0.638 33.9 0.543 104Ru(p, γ)105Rh [57] 93.1 0.638 68.0 0.543 102Pd(p, γ) [58, 59] 4.81 0.265 4.75 0.259 2.34 0.19 104Pd(p, γ)105Ag [60] 5.42 0.298 4.57 0.235 105Pd(p, γ)106Ag [60] 3.85 0.425 2.68 0.346 107Ag(p, γ)108Cd [61] 3.63 0.231 3.45 0.220 109Ag(p, γ)110Cd [61, 62] 10.3 0.419 0.182 0.045 106Cd(p, γ)107In [63] 6.96 0.295 6.74 0.293 108Cd(p, γ)109In [59] 1.49 0.168 0.827 0.119 110Cd(p, γ)111In [59] 0.925 0.138 0.687 0.118 112Cd(p, γ)113In [64, 65] 5.18 0.253 8.02 0.346 113In(p, γ)114Sn [66] 7.07 0.301 0.596 0.110 115In(p, γ)116Sn [66] 10.5 0.952 1.48 0.136 121Sb(p, γ)122Te [67] 3.19 0.215 9.72 0.351 123Sb(p, γ)124Te [67] 2.46 0.233 5.87 0.329 120Te(p, γ)121I [68] 13.3 0.468 2.93 0.217 127I(p, γ)128Xe [69] 3.93 0.604 0.384 0.191 124Xe(p, γ)125Cs [70] 6.82 0.278 23.4 0.563 130Ba(p, γ)131La [71] 2.87 0.167 2.67 0.154 Table 3. The numerical analysis of the comparison between the TALYS model combinations and the measurements, using
$ \chi^2 $ and relative variance analysis. The model abbreviations mentioned above are detailed in Table 2. -
TALYS provides a user-friendly input framework in which parameters such as the projectile, target, and energy range must be specified. The calculated results are then compared with experimental data extracted from the EXFOR database [54] and with theoretical predictions from the NON-SMOKER database [18], which is available online.
In this work, a systematic investigation was conducted to analyze the influence of different nuclear input models, namely the photon strength function (PSF), nuclear level density (NLD), and optical model potential (OMP), on (p, γ) reactions involving Sn isotopes within the TALYS framework. This approach enables the identification of a set of nuclear model combinations that can reliably reproduce the available experimental cross sections.
The different model combinations used in this work are summarized in Table 2. Their compatibility with the experimental data was evaluated both visually and quantitatively. The model combination "TALYS I" refers to the standard default settings of the TALYS code. The model set "TALYS II" differs from TALYS I in the choice of NLD, employing the microscopic Skyrme-Hartree-Fock-Bogoliubov (Skyrme-HFB) model [29]. In "TALYS III," the semi-microscopic Jeukenne-Lejeune-Mahaux (JLM) [24] optical model potential is used instead of the phenomenological OMP of Koning and Delaroche (KD03) [23]. The model sets "TALYS IV" and "TALYS V" employ the semi-microscopic temperature-dependent HFB plus QRPA model using the D1M Gogny force (Gogny-HFB-QRPA) [46] for the PSF instead of the default phenomenological Simplified Modified Lorentzian (SMLO) model [25, 44]; the former uses the phenomenological KD03 OMP, whereas the latter uses the JLM potential. The model sets "TALYS VI" and "TALYS VII" differ from TALYS I in the choice of PSF model: TALYS VI employs the Generalized Lorentzian model of Kopecky and Uhl (KU-GLO) [40, 41], whereas TALYS VII uses the Brink-Axel Standard Lorentzian model (BA-SLO) [37, 38]. In addition, the TALYS VI model set is experimentally constrained by employing the NLD and PSF parameters from the systematic study of Sn isotopes by Markova et al. [26]. Using the Constant Temperature model (CTM) [30] for the NLD, the experimental average neutron resonance spacing (
$ D_0 $ ), nuclear temperature (T), and spin cut-off parameters evaluated at the neutron separation energy were reproduced consistently with the experimental values derived in Ref. [26]. Additionally, the low-energy dipole strength, including the pygmy dipole resonance observed in the experimental study, is explicitly incorporated. In the absence of direct measurements for the compound Sb nuclei, the PSF parameters were adopted from the neighboring Sn isotopes.Table 3 summarizes the
$ \chi^2 $ and D values obtained using Eqs. (7) and (8) for the different TALYS model combinations across Sn isotopes and neighboring nuclei. A comparison of the experimental cross sections with different model combinations in the TALYS framework is discussed in the following two subsections.Reaction TALYS I TALYS II TALYS III $ \chi^2 $ D $ \chi^2 $ D $ \chi^2 $ D 112Sn(p, γ)113Sb [15] 2.86 0.162 2.26 0.150 114Sn(p, γ)115Sb [17] 0.853 0.157 0.517 0.121 115Sn(p, γ)116Sb [20] 21.5 0.657 4.61 0.308 116Sn(p, γ)117Sb [16] 7.73 0.486 6.69 0.487 [17] 10.2 0.557 10.6 0.576 [19] 8.5 0.517 4.61 0.308 118Sn(p, γ)119Sb [19] 0.797 0.155 0.641 0.127 119Sn(p, γ)120Sb [15] 32.3 0.704 32.2 0.709 12.0 0.387 92Mo(p, γ)93Tc [55, 56] 21.5 0.657 4.61 0.308 94Mo(p, γ)95Tc [55, 56] 4.01 0.415 25.1 0.726 95Mo(p, γ)96Tc [56] 7.02 0.243 3.609 0.185 97Mo(p, γ)98Tc [55] 1.42 0.352 0.355 0.171 98Mo(p, γ)99Tc [55] 1.21 0.184 0.855 0.151 100Mo(p, γ)101Tc [55] 7.98 0.687 2.45 0.375 96Ru(p, γ)97Rh [57] 238 1.55 465 2.12 98Ru(p, γ)99Rh [57] 11.1 0.375 10.8 0.37 99Ru(p, γ)100Rh [57] 54.0 0.638 33.9 0.543 104Ru(p, γ)105Rh [57] 93.1 0.638 68.0 0.543 102Pd(p, γ) [58, 59] 4.81 0.265 4.75 0.259 2.34 0.19 104Pd(p, γ)105Ag [60] 5.42 0.298 4.57 0.235 105Pd(p, γ)106Ag [60] 3.85 0.425 2.68 0.346 107Ag(p, γ)108Cd [61] 3.63 0.231 3.45 0.220 109Ag(p, γ)110Cd [61, 62] 10.3 0.419 0.182 0.045 106Cd(p, γ)107In [63] 6.96 0.295 6.74 0.293 108Cd(p, γ)109In [59] 1.49 0.168 0.827 0.119 110Cd(p, γ)111In [59] 0.925 0.138 0.687 0.118 112Cd(p, γ)113In [64, 65] 5.18 0.253 8.02 0.346 113In(p, γ)114Sn [66] 7.07 0.301 0.596 0.110 115In(p, γ)116Sn [66] 10.5 0.952 1.48 0.136 121Sb(p, γ)122Te [67] 3.19 0.215 9.72 0.351 123Sb(p, γ)124Te [67] 2.46 0.233 5.87 0.329 120Te(p, γ)121I [68] 13.3 0.468 2.93 0.217 127I(p, γ)128Xe [69] 3.93 0.604 0.384 0.191 124Xe(p, γ)125Cs [70] 6.82 0.278 23.4 0.563 130Ba(p, γ)131La [71] 2.87 0.167 2.67 0.154 Table 3. The numerical analysis of the comparison between the TALYS model combinations and the measurements, using
$ \chi^2 $ and relative variance analysis. The model abbreviations mentioned above are detailed in Table 2. -
TALYS provides a user-friendly input framework in which parameters such as the projectile, target, and energy range must be specified. The calculated results are then compared with experimental data extracted from the EXFOR database [54] and with theoretical predictions from the NON-SMOKER database [18], which is available online.
In this work, a systematic investigation was conducted to analyze the influence of different nuclear input models, namely the photon strength function (PSF), nuclear level density (NLD), and optical model potential (OMP), on (p, γ) reactions involving Sn isotopes within the TALYS framework. This approach enables the identification of a set of nuclear model combinations that can reliably reproduce the available experimental cross sections.
The different model combinations used in this work are summarized in Table 2. Their compatibility with the experimental data was evaluated both visually and quantitatively. The model combination "TALYS I" refers to the standard default settings of the TALYS code. The model set "TALYS II" differs from TALYS I in the choice of NLD, employing the microscopic Skyrme-Hartree-Fock-Bogoliubov (Skyrme-HFB) model [29]. In "TALYS III," the semi-microscopic Jeukenne-Lejeune-Mahaux (JLM) [24] optical model potential is used instead of the phenomenological OMP of Koning and Delaroche (KD03) [23]. The model sets "TALYS IV" and "TALYS V" employ the semi-microscopic temperature-dependent HFB plus QRPA model using the D1M Gogny force (Gogny-HFB-QRPA) [46] for the PSF instead of the default phenomenological Simplified Modified Lorentzian (SMLO) model [25, 44]; the former uses the phenomenological KD03 OMP, whereas the latter uses the JLM potential. The model sets "TALYS VI" and "TALYS VII" differ from TALYS I in the choice of PSF model: TALYS VI employs the Generalized Lorentzian model of Kopecky and Uhl (KU-GLO) [40, 41], whereas TALYS VII uses the Brink-Axel Standard Lorentzian model (BA-SLO) [37, 38]. In addition, the TALYS VI model set is experimentally constrained by employing the NLD and PSF parameters from the systematic study of Sn isotopes by Markova et al. [26]. Using the Constant Temperature model (CTM) [30] for the NLD, the experimental average neutron resonance spacing (
$ D_0 $ ), nuclear temperature (T), and spin cut-off parameters evaluated at the neutron separation energy were reproduced consistently with the experimental values derived in Ref. [26]. Additionally, the low-energy dipole strength, including the pygmy dipole resonance observed in the experimental study, is explicitly incorporated. In the absence of direct measurements for the compound Sb nuclei, the PSF parameters were adopted from the neighboring Sn isotopes.Table 3 summarizes the
$ \chi^2 $ and D values obtained using Eqs. (7) and (8) for the different TALYS model combinations across Sn isotopes and neighboring nuclei. A comparison of the experimental cross sections with different model combinations in the TALYS framework is discussed in the following two subsections.Reaction TALYS I TALYS II TALYS III $ \chi^2 $ D $ \chi^2 $ D $ \chi^2 $ D 112Sn(p, γ)113Sb [15] 2.86 0.162 2.26 0.150 114Sn(p, γ)115Sb [17] 0.853 0.157 0.517 0.121 115Sn(p, γ)116Sb [20] 21.5 0.657 4.61 0.308 116Sn(p, γ)117Sb [16] 7.73 0.486 6.69 0.487 [17] 10.2 0.557 10.6 0.576 [19] 8.5 0.517 4.61 0.308 118Sn(p, γ)119Sb [19] 0.797 0.155 0.641 0.127 119Sn(p, γ)120Sb [15] 32.3 0.704 32.2 0.709 12.0 0.387 92Mo(p, γ)93Tc [55, 56] 21.5 0.657 4.61 0.308 94Mo(p, γ)95Tc [55, 56] 4.01 0.415 25.1 0.726 95Mo(p, γ)96Tc [56] 7.02 0.243 3.609 0.185 97Mo(p, γ)98Tc [55] 1.42 0.352 0.355 0.171 98Mo(p, γ)99Tc [55] 1.21 0.184 0.855 0.151 100Mo(p, γ)101Tc [55] 7.98 0.687 2.45 0.375 96Ru(p, γ)97Rh [57] 238 1.55 465 2.12 98Ru(p, γ)99Rh [57] 11.1 0.375 10.8 0.37 99Ru(p, γ)100Rh [57] 54.0 0.638 33.9 0.543 104Ru(p, γ)105Rh [57] 93.1 0.638 68.0 0.543 102Pd(p, γ) [58, 59] 4.81 0.265 4.75 0.259 2.34 0.19 104Pd(p, γ)105Ag [60] 5.42 0.298 4.57 0.235 105Pd(p, γ)106Ag [60] 3.85 0.425 2.68 0.346 107Ag(p, γ)108Cd [61] 3.63 0.231 3.45 0.220 109Ag(p, γ)110Cd [61, 62] 10.3 0.419 0.182 0.045 106Cd(p, γ)107In [63] 6.96 0.295 6.74 0.293 108Cd(p, γ)109In [59] 1.49 0.168 0.827 0.119 110Cd(p, γ)111In [59] 0.925 0.138 0.687 0.118 112Cd(p, γ)113In [64, 65] 5.18 0.253 8.02 0.346 113In(p, γ)114Sn [66] 7.07 0.301 0.596 0.110 115In(p, γ)116Sn [66] 10.5 0.952 1.48 0.136 121Sb(p, γ)122Te [67] 3.19 0.215 9.72 0.351 123Sb(p, γ)124Te [67] 2.46 0.233 5.87 0.329 120Te(p, γ)121I [68] 13.3 0.468 2.93 0.217 127I(p, γ)128Xe [69] 3.93 0.604 0.384 0.191 124Xe(p, γ)125Cs [70] 6.82 0.278 23.4 0.563 130Ba(p, γ)131La [71] 2.87 0.167 2.67 0.154 Table 3. The numerical analysis of the comparison between the TALYS model combinations and the measurements, using
$ \chi^2 $ and relative variance analysis. The model abbreviations mentioned above are detailed in Table 2. -
TALYS provides a user-friendly input framework in which parameters such as the projectile, target, and energy range must be specified. The calculated results are then compared with experimental data extracted from the EXFOR database [54] and with theoretical predictions from the NON-SMOKER database [18], which is available online.
In this work, a systematic investigation was conducted to analyze the influence of different nuclear input models, namely the photon strength function (PSF), nuclear level density (NLD), and optical model potential (OMP), on (p, γ) reactions involving Sn isotopes within the TALYS framework. This approach enables the identification of a set of nuclear model combinations that can reliably reproduce the available experimental cross sections.
The different model combinations used in this work are summarized in Table 2. Their compatibility with the experimental data was evaluated both visually and quantitatively. The model combination "TALYS I" refers to the standard default settings of the TALYS code. The model set "TALYS II" differs from TALYS I in the choice of NLD, employing the microscopic Skyrme-Hartree-Fock-Bogoliubov (Skyrme-HFB) model [29]. In "TALYS III," the semi-microscopic Jeukenne-Lejeune-Mahaux (JLM) [24] optical model potential is used instead of the phenomenological OMP of Koning and Delaroche (KD03) [23]. The model sets "TALYS IV" and "TALYS V" employ the semi-microscopic temperature-dependent HFB plus QRPA model using the D1M Gogny force (Gogny-HFB-QRPA) [46] for the PSF instead of the default phenomenological Simplified Modified Lorentzian (SMLO) model [25, 44]; the former uses the phenomenological KD03 OMP, whereas the latter uses the JLM potential. The model sets "TALYS VI" and "TALYS VII" differ from TALYS I in the choice of PSF model: TALYS VI employs the Generalized Lorentzian model of Kopecky and Uhl (KU-GLO) [40, 41], whereas TALYS VII uses the Brink-Axel Standard Lorentzian model (BA-SLO) [37, 38]. In addition, the TALYS VI model set is experimentally constrained by employing the NLD and PSF parameters from the systematic study of Sn isotopes by Markova et al. [26]. Using the Constant Temperature model (CTM) [30] for the NLD, the experimental average neutron resonance spacing (
$ D_0 $ ), nuclear temperature (T), and spin cut-off parameters evaluated at the neutron separation energy were reproduced consistently with the experimental values derived in Ref. [26]. Additionally, the low-energy dipole strength, including the pygmy dipole resonance observed in the experimental study, is explicitly incorporated. In the absence of direct measurements for the compound Sb nuclei, the PSF parameters were adopted from the neighboring Sn isotopes.Table 3 summarizes the
$ \chi^2 $ and D values obtained using Eqs. (7) and (8) for the different TALYS model combinations across Sn isotopes and neighboring nuclei. A comparison of the experimental cross sections with different model combinations in the TALYS framework is discussed in the following two subsections.Reaction TALYS I TALYS II TALYS III $ \chi^2 $ D $ \chi^2 $ D $ \chi^2 $ D 112Sn(p, γ)113Sb [15] 2.86 0.162 2.26 0.150 114Sn(p, γ)115Sb [17] 0.853 0.157 0.517 0.121 115Sn(p, γ)116Sb [20] 21.5 0.657 4.61 0.308 116Sn(p, γ)117Sb [16] 7.73 0.486 6.69 0.487 [17] 10.2 0.557 10.6 0.576 [19] 8.5 0.517 4.61 0.308 118Sn(p, γ)119Sb [19] 0.797 0.155 0.641 0.127 119Sn(p, γ)120Sb [15] 32.3 0.704 32.2 0.709 12.0 0.387 92Mo(p, γ)93Tc [55, 56] 21.5 0.657 4.61 0.308 94Mo(p, γ)95Tc [55, 56] 4.01 0.415 25.1 0.726 95Mo(p, γ)96Tc [56] 7.02 0.243 3.609 0.185 97Mo(p, γ)98Tc [55] 1.42 0.352 0.355 0.171 98Mo(p, γ)99Tc [55] 1.21 0.184 0.855 0.151 100Mo(p, γ)101Tc [55] 7.98 0.687 2.45 0.375 96Ru(p, γ)97Rh [57] 238 1.55 465 2.12 98Ru(p, γ)99Rh [57] 11.1 0.375 10.8 0.37 99Ru(p, γ)100Rh [57] 54.0 0.638 33.9 0.543 104Ru(p, γ)105Rh [57] 93.1 0.638 68.0 0.543 102Pd(p, γ) [58, 59] 4.81 0.265 4.75 0.259 2.34 0.19 104Pd(p, γ)105Ag [60] 5.42 0.298 4.57 0.235 105Pd(p, γ)106Ag [60] 3.85 0.425 2.68 0.346 107Ag(p, γ)108Cd [61] 3.63 0.231 3.45 0.220 109Ag(p, γ)110Cd [61, 62] 10.3 0.419 0.182 0.045 106Cd(p, γ)107In [63] 6.96 0.295 6.74 0.293 108Cd(p, γ)109In [59] 1.49 0.168 0.827 0.119 110Cd(p, γ)111In [59] 0.925 0.138 0.687 0.118 112Cd(p, γ)113In [64, 65] 5.18 0.253 8.02 0.346 113In(p, γ)114Sn [66] 7.07 0.301 0.596 0.110 115In(p, γ)116Sn [66] 10.5 0.952 1.48 0.136 121Sb(p, γ)122Te [67] 3.19 0.215 9.72 0.351 123Sb(p, γ)124Te [67] 2.46 0.233 5.87 0.329 120Te(p, γ)121I [68] 13.3 0.468 2.93 0.217 127I(p, γ)128Xe [69] 3.93 0.604 0.384 0.191 124Xe(p, γ)125Cs [70] 6.82 0.278 23.4 0.563 130Ba(p, γ)131La [71] 2.87 0.167 2.67 0.154 Table 3. The numerical analysis of the comparison between the TALYS model combinations and the measurements, using
$ \chi^2 $ and relative variance analysis. The model abbreviations mentioned above are detailed in Table 2. -
TALYS provides a user-friendly input framework in which parameters such as the projectile, target, and energy range must be specified. The calculated results are then compared with experimental data extracted from the EXFOR database [54] and with theoretical predictions from the NON-SMOKER database [18], which is available online.
In this work, a systematic investigation was conducted to analyze the influence of different nuclear input models, namely the photon strength function (PSF), nuclear level density (NLD), and optical model potential (OMP), on (p, γ) reactions involving Sn isotopes within the TALYS framework. This approach enables the identification of a set of nuclear model combinations that can reliably reproduce the available experimental cross sections.
The different model combinations used in this work are summarized in Table 2. Their compatibility with the experimental data was evaluated both visually and quantitatively. The model combination "TALYS I" refers to the standard default settings of the TALYS code. The model set "TALYS II" differs from TALYS I in the choice of NLD, employing the microscopic Skyrme-Hartree-Fock-Bogoliubov (Skyrme-HFB) model [29]. In "TALYS III," the semi-microscopic Jeukenne-Lejeune-Mahaux (JLM) [24] optical model potential is used instead of the phenomenological OMP of Koning and Delaroche (KD03) [23]. The model sets "TALYS IV" and "TALYS V" employ the semi-microscopic temperature-dependent HFB plus QRPA model using the D1M Gogny force (Gogny-HFB-QRPA) [46] for the PSF instead of the default phenomenological Simplified Modified Lorentzian (SMLO) model [25, 44]; the former uses the phenomenological KD03 OMP, whereas the latter uses the JLM potential. The model sets "TALYS VI" and "TALYS VII" differ from TALYS I in the choice of PSF model: TALYS VI employs the Generalized Lorentzian model of Kopecky and Uhl (KU-GLO) [40, 41], whereas TALYS VII uses the Brink-Axel Standard Lorentzian model (BA-SLO) [37, 38]. In addition, the TALYS VI model set is experimentally constrained by employing the NLD and PSF parameters from the systematic study of Sn isotopes by Markova et al. [26]. Using the Constant Temperature model (CTM) [30] for the NLD, the experimental average neutron resonance spacing (
$ D_0 $ ), nuclear temperature (T), and spin cut-off parameters evaluated at the neutron separation energy were reproduced consistently with the experimental values derived in Ref. [26]. Additionally, the low-energy dipole strength, including the pygmy dipole resonance observed in the experimental study, is explicitly incorporated. In the absence of direct measurements for the compound Sb nuclei, the PSF parameters were adopted from the neighboring Sn isotopes.Table 3 summarizes the
$ \chi^2 $ and D values obtained using Eqs. (7) and (8) for the different TALYS model combinations across Sn isotopes and neighboring nuclei. A comparison of the experimental cross sections with different model combinations in the TALYS framework is discussed in the following two subsections.Reaction TALYS I TALYS II TALYS III $ \chi^2 $ D $ \chi^2 $ D $ \chi^2 $ D 112Sn(p, γ)113Sb [15] 2.86 0.162 2.26 0.150 114Sn(p, γ)115Sb [17] 0.853 0.157 0.517 0.121 115Sn(p, γ)116Sb [20] 21.5 0.657 4.61 0.308 116Sn(p, γ)117Sb [16] 7.73 0.486 6.69 0.487 [17] 10.2 0.557 10.6 0.576 [19] 8.5 0.517 4.61 0.308 118Sn(p, γ)119Sb [19] 0.797 0.155 0.641 0.127 119Sn(p, γ)120Sb [15] 32.3 0.704 32.2 0.709 12.0 0.387 92Mo(p, γ)93Tc [55, 56] 21.5 0.657 4.61 0.308 94Mo(p, γ)95Tc [55, 56] 4.01 0.415 25.1 0.726 95Mo(p, γ)96Tc [56] 7.02 0.243 3.609 0.185 97Mo(p, γ)98Tc [55] 1.42 0.352 0.355 0.171 98Mo(p, γ)99Tc [55] 1.21 0.184 0.855 0.151 100Mo(p, γ)101Tc [55] 7.98 0.687 2.45 0.375 96Ru(p, γ)97Rh [57] 238 1.55 465 2.12 98Ru(p, γ)99Rh [57] 11.1 0.375 10.8 0.37 99Ru(p, γ)100Rh [57] 54.0 0.638 33.9 0.543 104Ru(p, γ)105Rh [57] 93.1 0.638 68.0 0.543 102Pd(p, γ) [58, 59] 4.81 0.265 4.75 0.259 2.34 0.19 104Pd(p, γ)105Ag [60] 5.42 0.298 4.57 0.235 105Pd(p, γ)106Ag [60] 3.85 0.425 2.68 0.346 107Ag(p, γ)108Cd [61] 3.63 0.231 3.45 0.220 109Ag(p, γ)110Cd [61, 62] 10.3 0.419 0.182 0.045 106Cd(p, γ)107In [63] 6.96 0.295 6.74 0.293 108Cd(p, γ)109In [59] 1.49 0.168 0.827 0.119 110Cd(p, γ)111In [59] 0.925 0.138 0.687 0.118 112Cd(p, γ)113In [64, 65] 5.18 0.253 8.02 0.346 113In(p, γ)114Sn [66] 7.07 0.301 0.596 0.110 115In(p, γ)116Sn [66] 10.5 0.952 1.48 0.136 121Sb(p, γ)122Te [67] 3.19 0.215 9.72 0.351 123Sb(p, γ)124Te [67] 2.46 0.233 5.87 0.329 120Te(p, γ)121I [68] 13.3 0.468 2.93 0.217 127I(p, γ)128Xe [69] 3.93 0.604 0.384 0.191 124Xe(p, γ)125Cs [70] 6.82 0.278 23.4 0.563 130Ba(p, γ)131La [71] 2.87 0.167 2.67 0.154 Table 3. The numerical analysis of the comparison between the TALYS model combinations and the measurements, using
$ \chi^2 $ and relative variance analysis. The model abbreviations mentioned above are detailed in Table 2. -
The measured (p, γ) cross sections for the 112,114,115,116,118,119Sn isotopes were taken from Refs. [15−17, 19, 20] and corrected for electron-screening effects. For astrophysical applications, it is convenient to express the cross section in terms of the astrophysical S-factor,
$ S(E) $ . The relationship between$ S(E) $ and the cross section$ \sigma(E) $ is given by$ \begin{aligned}[b] S(E)= \sigma(E)E{{\rm{e}}^{2 \pi \eta}} \end{aligned} $
(11) where η=
$ \dfrac{e^2 Z_1 Z_2}{4\pi\epsilon_0 \hbar v} $ is the Sommerfeld parameter;$ Z_1 $ and$ Z_2 $ are the atomic numbers of the two interacting nuclei (projectile and target), respectively; e is the elementary charge;$ \hbar $ is the reduced Planck constant; and v is the relative velocity between the two interacting nuclei. The exponential factor in Eq. (11) removes the effect of Coulomb-barrier penetration, thereby making$ S(E) $ a more smoothly varying function of energy.Because our main objective is to identify an appropriate combination of TALYS models for reproducing the Sn(p, γ) cross sections, the experimental cross sections and S-factors were compared with the calculated results obtained using different model sets within the TALYS framework. These comparisons are shown in Fig. 1 and Fig. 2. The gray shaded area in each figure represents the Gamow window for the corresponding reaction at stellar temperatures of 2−3 GK.
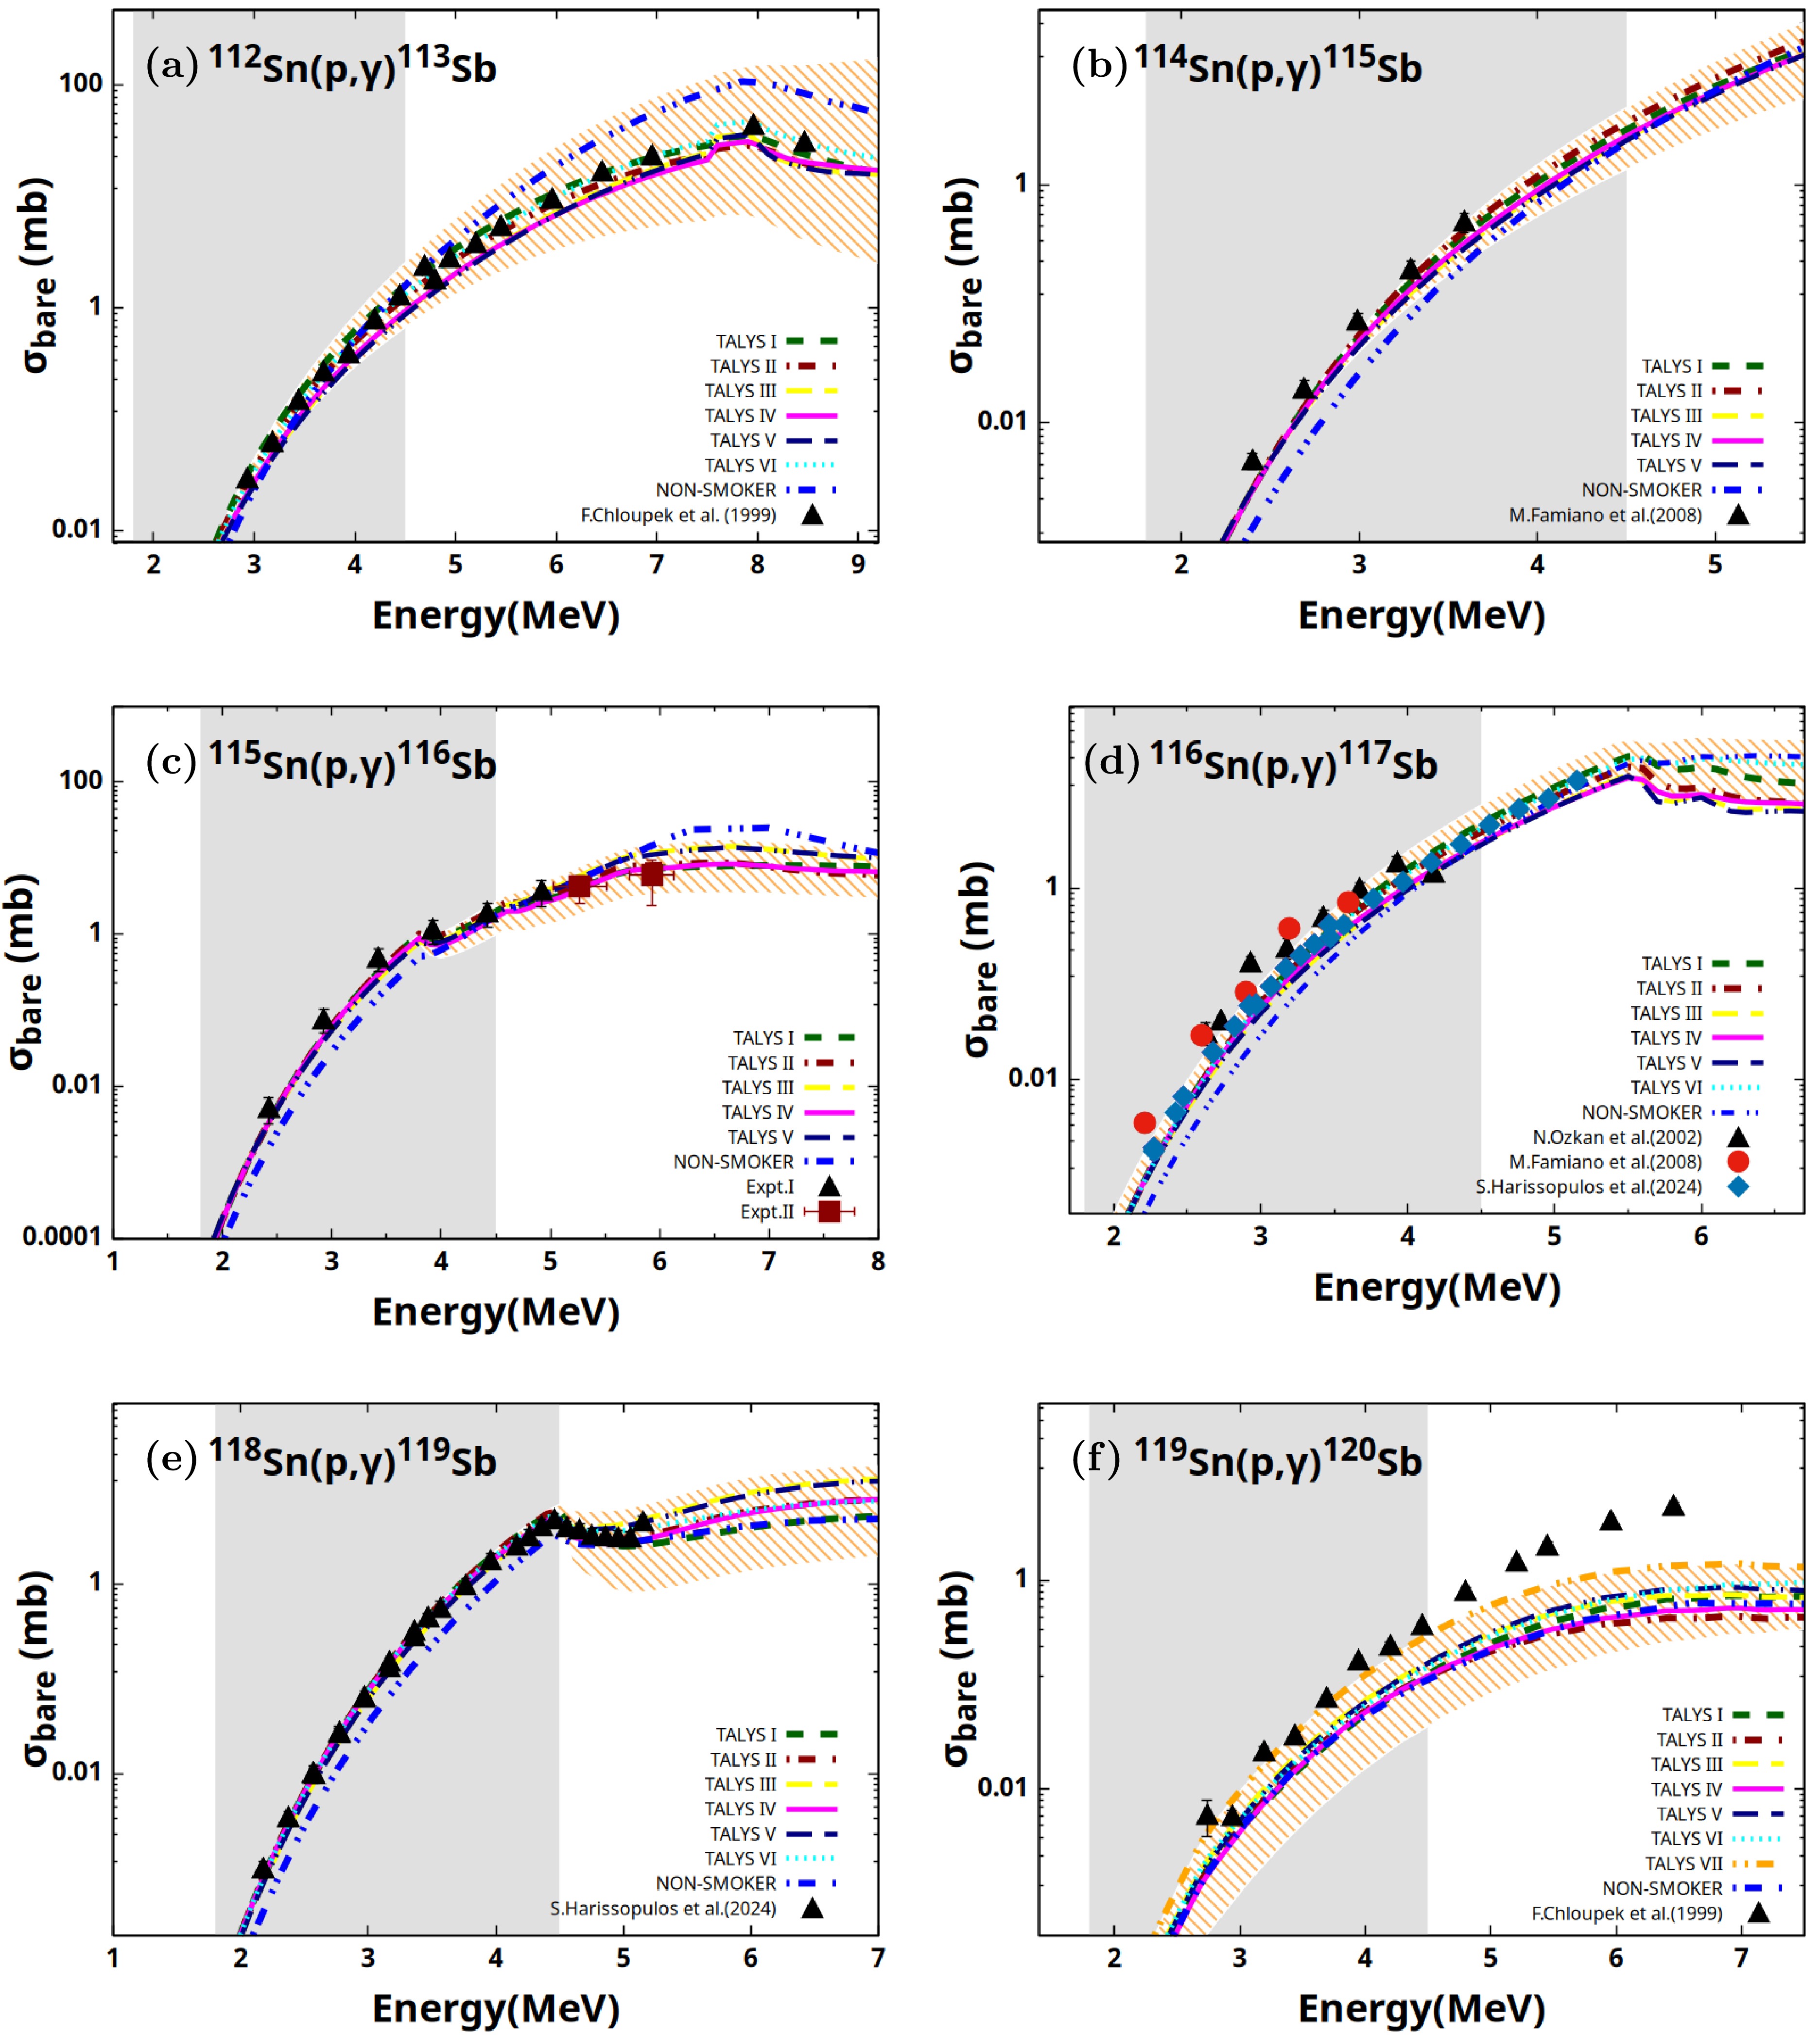
Figure 1. (color online) Comparison of the electron-screening-corrected cross sections for the 112,114,115,116,118,119Sn(p, γ)113,115,116,117,119,120Sb reactions [15−17, 19, 20] with the TALYS model combinations listed in Table 2. The hatched (////) band corresponds to all possible PSF and NLD model combinations using the phenomenological p-OMP of Koning and Delaroche (KD03; see Section II. 3). The NON-SMOKER and TALYS model calculations are identified in the legends and represented by different curve types (TALYS I by a dashed curve, TALYS II by a dot-dash curve, TALYS III by a dotted curve, and NON-SMOKER (web) by a dot-dot-dash curve). The gray shaded region represents the Gamow window for the respective reaction over the temperature range of 2−3 GK.
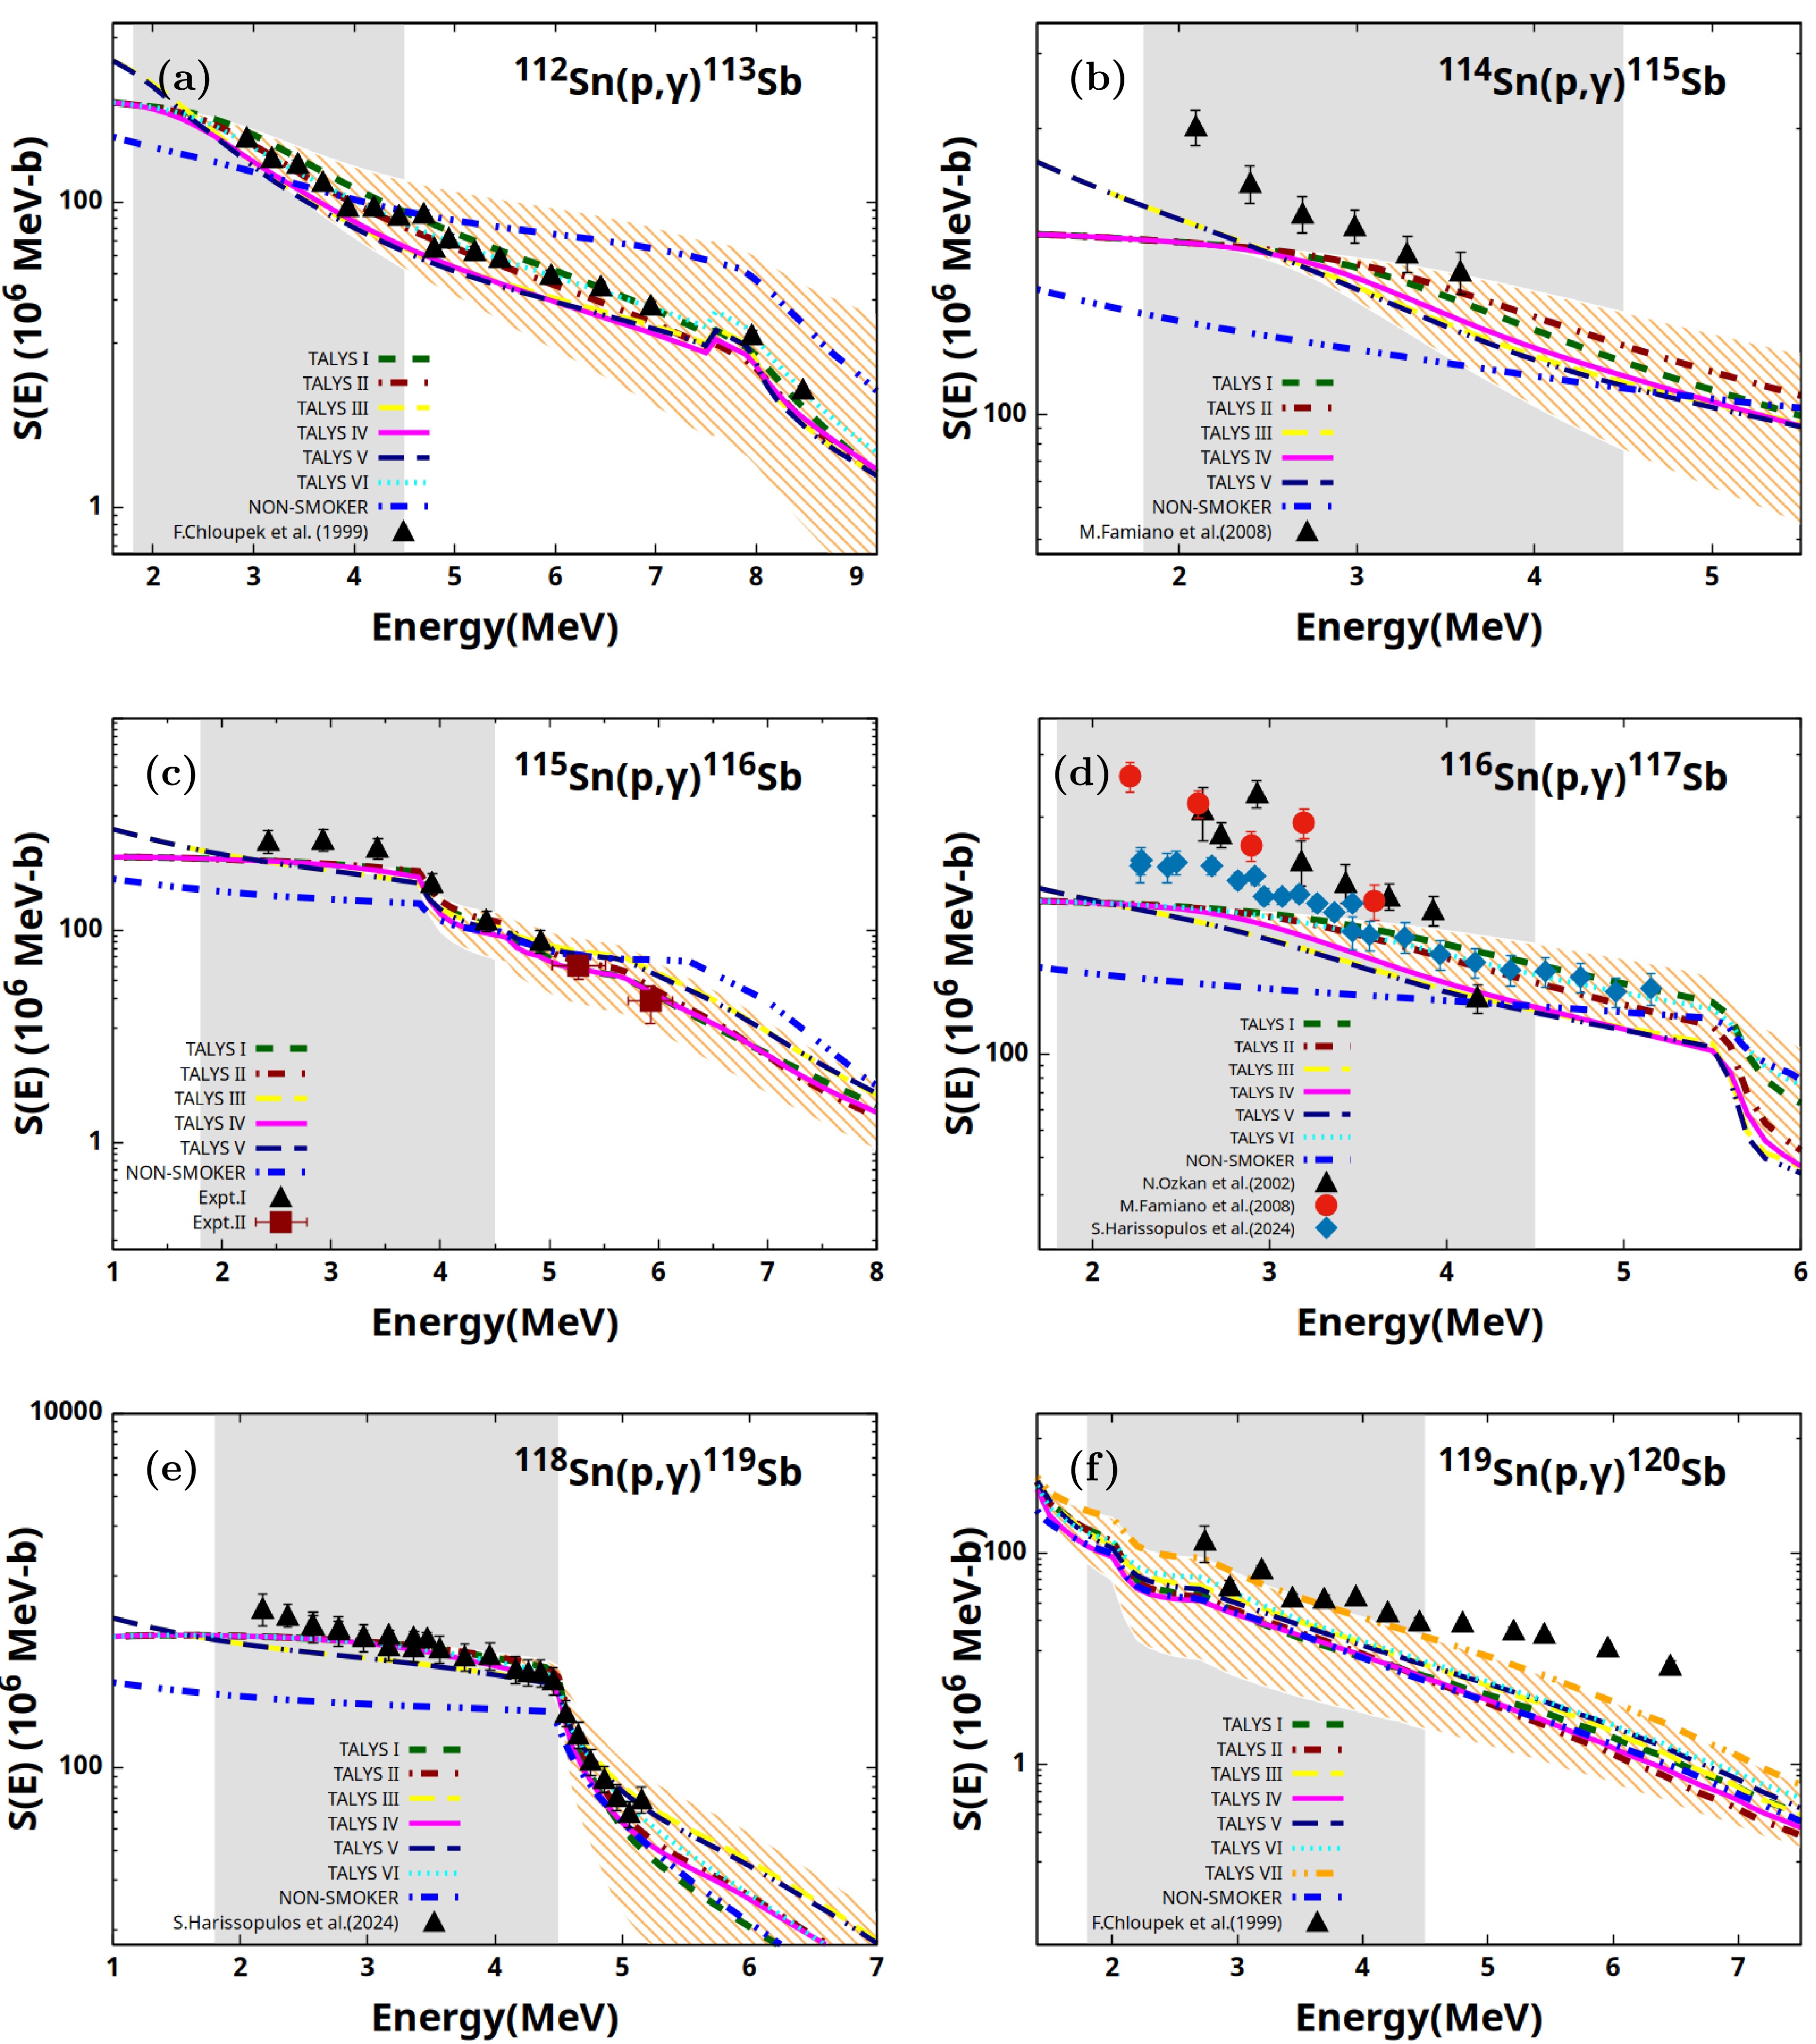
Figure 2. (color online) Comparison of S-factor values derived from the electron-screening-corrected cross sections for the 112,114,115,116,118,119Sn(p, γ)113,115,116,117,119,120Sb reactions [15−17, 19, 20] with the TALYS model combinations listed in Table 2. The gray-shaded region represents the Gamow window for each reaction at T=2−3 GK. The hatched (////) region indicates the range spanned by all combinations of the input nuclear models for PSF and NLD in TALYS using the KD03 OMP model.
-
The measured (p, γ) cross sections for the 112,114,115,116,118,119Sn isotopes were taken from Refs. [15−17, 19, 20] and corrected for electron-screening effects. For astrophysical applications, it is convenient to express the cross section in terms of the astrophysical S-factor,
$ S(E) $ . The relationship between$ S(E) $ and the cross section$ \sigma(E) $ is given by$ \begin{aligned}[b] S(E)= \sigma(E)E{{\rm{e}}^{2 \pi \eta}} \end{aligned} $
(11) where η=
$ \dfrac{e^2 Z_1 Z_2}{4\pi\epsilon_0 \hbar v} $ is the Sommerfeld parameter;$ Z_1 $ and$ Z_2 $ are the atomic numbers of the two interacting nuclei (projectile and target), respectively; e is the elementary charge;$ \hbar $ is the reduced Planck constant; and v is the relative velocity between the two interacting nuclei. The exponential factor in Eq. (11) removes the effect of Coulomb-barrier penetration, thereby making$ S(E) $ a more smoothly varying function of energy.Because our main objective is to identify an appropriate combination of TALYS models for reproducing the Sn(p, γ) cross sections, the experimental cross sections and S-factors were compared with the calculated results obtained using different model sets within the TALYS framework. These comparisons are shown in Fig. 1 and Fig. 2. The gray shaded area in each figure represents the Gamow window for the corresponding reaction at stellar temperatures of 2−3 GK.
Figure 1. (color online) Comparison of the electron-screening-corrected cross sections for the 112,114,115,116,118,119Sn(p, γ)113,115,116,117,119,120Sb reactions [15−17, 19, 20] with the TALYS model combinations listed in Table 2. The hatched (////) band corresponds to all possible PSF and NLD model combinations using the phenomenological p-OMP of Koning and Delaroche (KD03; see Section II. 3). The NON-SMOKER and TALYS model calculations are identified in the legends and represented by different curve types (TALYS I by a dashed curve, TALYS II by a dot-dash curve, TALYS III by a dotted curve, and NON-SMOKER (web) by a dot-dot-dash curve). The gray shaded region represents the Gamow window for the respective reaction over the temperature range of 2−3 GK.
Figure 2. (color online) Comparison of S-factor values derived from the electron-screening-corrected cross sections for the 112,114,115,116,118,119Sn(p, γ)113,115,116,117,119,120Sb reactions [15−17, 19, 20] with the TALYS model combinations listed in Table 2. The gray-shaded region represents the Gamow window for each reaction at T=2−3 GK. The hatched (////) region indicates the range spanned by all combinations of the input nuclear models for PSF and NLD in TALYS using the KD03 OMP model.
-
The measured (p, γ) cross sections for the 112,114,115,116,118,119Sn isotopes were taken from Refs. [15−17, 19, 20] and corrected for electron-screening effects. For astrophysical applications, it is convenient to express the cross section in terms of the astrophysical S-factor,
$ S(E) $ . The relationship between$ S(E) $ and the cross section$ \sigma(E) $ is given by$ \begin{aligned}[b] S(E)= \sigma(E)E{{\rm{e}}^{2 \pi \eta}} \end{aligned} $
(11) where η=
$ \dfrac{e^2 Z_1 Z_2}{4\pi\epsilon_0 \hbar v} $ is the Sommerfeld parameter;$ Z_1 $ and$ Z_2 $ are the atomic numbers of the two interacting nuclei (projectile and target), respectively; e is the elementary charge;$ \hbar $ is the reduced Planck constant; and v is the relative velocity between the two interacting nuclei. The exponential factor in Eq. (11) removes the effect of Coulomb-barrier penetration, thereby making$ S(E) $ a more smoothly varying function of energy.Because our main objective is to identify an appropriate combination of TALYS models for reproducing the Sn(p, γ) cross sections, the experimental cross sections and S-factors were compared with the calculated results obtained using different model sets within the TALYS framework. These comparisons are shown in Fig. 1 and Fig. 2. The gray shaded area in each figure represents the Gamow window for the corresponding reaction at stellar temperatures of 2−3 GK.
Figure 1. (color online) Comparison of the electron-screening-corrected cross sections for the 112,114,115,116,118,119Sn(p, γ)113,115,116,117,119,120Sb reactions [15−17, 19, 20] with the TALYS model combinations listed in Table 2. The hatched (////) band corresponds to all possible PSF and NLD model combinations using the phenomenological p-OMP of Koning and Delaroche (KD03; see Section II. 3). The NON-SMOKER and TALYS model calculations are identified in the legends and represented by different curve types (TALYS I by a dashed curve, TALYS II by a dot-dash curve, TALYS III by a dotted curve, and NON-SMOKER (web) by a dot-dot-dash curve). The gray shaded region represents the Gamow window for the respective reaction over the temperature range of 2−3 GK.
Figure 2. (color online) Comparison of S-factor values derived from the electron-screening-corrected cross sections for the 112,114,115,116,118,119Sn(p, γ)113,115,116,117,119,120Sb reactions [15−17, 19, 20] with the TALYS model combinations listed in Table 2. The gray-shaded region represents the Gamow window for each reaction at T=2−3 GK. The hatched (////) region indicates the range spanned by all combinations of the input nuclear models for PSF and NLD in TALYS using the KD03 OMP model.
-
The measured (p, γ) cross sections for the 112,114,115,116,118,119Sn isotopes were taken from Refs. [15−17, 19, 20] and corrected for electron-screening effects. For astrophysical applications, it is convenient to express the cross section in terms of the astrophysical S-factor,
$ S(E) $ . The relationship between$ S(E) $ and the cross section$ \sigma(E) $ is given by$ \begin{aligned}[b] S(E)= \sigma(E)E{{\rm{e}}^{2 \pi \eta}} \end{aligned} $
(11) where η=
$ \dfrac{e^2 Z_1 Z_2}{4\pi\epsilon_0 \hbar v} $ is the Sommerfeld parameter;$ Z_1 $ and$ Z_2 $ are the atomic numbers of the two interacting nuclei (projectile and target), respectively; e is the elementary charge;$ \hbar $ is the reduced Planck constant; and v is the relative velocity between the two interacting nuclei. The exponential factor in Eq. (11) removes the effect of Coulomb-barrier penetration, thereby making$ S(E) $ a more smoothly varying function of energy.Because our main objective is to identify an appropriate combination of TALYS models for reproducing the Sn(p, γ) cross sections, the experimental cross sections and S-factors were compared with the calculated results obtained using different model sets within the TALYS framework. These comparisons are shown in Fig. 1 and Fig. 2. The gray shaded area in each figure represents the Gamow window for the corresponding reaction at stellar temperatures of 2−3 GK.
Figure 1. (color online) Comparison of the electron-screening-corrected cross sections for the 112,114,115,116,118,119Sn(p, γ)113,115,116,117,119,120Sb reactions [15−17, 19, 20] with the TALYS model combinations listed in Table 2. The hatched (////) band corresponds to all possible PSF and NLD model combinations using the phenomenological p-OMP of Koning and Delaroche (KD03; see Section II. 3). The NON-SMOKER and TALYS model calculations are identified in the legends and represented by different curve types (TALYS I by a dashed curve, TALYS II by a dot-dash curve, TALYS III by a dotted curve, and NON-SMOKER (web) by a dot-dot-dash curve). The gray shaded region represents the Gamow window for the respective reaction over the temperature range of 2−3 GK.
Figure 2. (color online) Comparison of S-factor values derived from the electron-screening-corrected cross sections for the 112,114,115,116,118,119Sn(p, γ)113,115,116,117,119,120Sb reactions [15−17, 19, 20] with the TALYS model combinations listed in Table 2. The gray-shaded region represents the Gamow window for each reaction at T=2−3 GK. The hatched (////) region indicates the range spanned by all combinations of the input nuclear models for PSF and NLD in TALYS using the KD03 OMP model.
-
The measured (p, γ) cross sections for the 112,114,115,116,118,119Sn isotopes were taken from Refs. [15−17, 19, 20] and corrected for electron-screening effects. For astrophysical applications, it is convenient to express the cross section in terms of the astrophysical S-factor,
$ S(E) $ . The relationship between$ S(E) $ and the cross section$ \sigma(E) $ is given by$ \begin{aligned}[b] S(E)= \sigma(E)E{{\rm{e}}^{2 \pi \eta}} \end{aligned} $
(11) where η=
$ \dfrac{e^2 Z_1 Z_2}{4\pi\epsilon_0 \hbar v} $ is the Sommerfeld parameter;$ Z_1 $ and$ Z_2 $ are the atomic numbers of the two interacting nuclei (projectile and target), respectively; e is the elementary charge;$ \hbar $ is the reduced Planck constant; and v is the relative velocity between the two interacting nuclei. The exponential factor in Eq. (11) removes the effect of Coulomb-barrier penetration, thereby making$ S(E) $ a more smoothly varying function of energy.Because our main objective is to identify an appropriate combination of TALYS models for reproducing the Sn(p, γ) cross sections, the experimental cross sections and S-factors were compared with the calculated results obtained using different model sets within the TALYS framework. These comparisons are shown in Fig. 1 and Fig. 2. The gray shaded area in each figure represents the Gamow window for the corresponding reaction at stellar temperatures of 2−3 GK.
Figure 1. (color online) Comparison of the electron-screening-corrected cross sections for the 112,114,115,116,118,119Sn(p, γ)113,115,116,117,119,120Sb reactions [15−17, 19, 20] with the TALYS model combinations listed in Table 2. The hatched (////) band corresponds to all possible PSF and NLD model combinations using the phenomenological p-OMP of Koning and Delaroche (KD03; see Section II. 3). The NON-SMOKER and TALYS model calculations are identified in the legends and represented by different curve types (TALYS I by a dashed curve, TALYS II by a dot-dash curve, TALYS III by a dotted curve, and NON-SMOKER (web) by a dot-dot-dash curve). The gray shaded region represents the Gamow window for the respective reaction over the temperature range of 2−3 GK.
Figure 2. (color online) Comparison of S-factor values derived from the electron-screening-corrected cross sections for the 112,114,115,116,118,119Sn(p, γ)113,115,116,117,119,120Sb reactions [15−17, 19, 20] with the TALYS model combinations listed in Table 2. The gray-shaded region represents the Gamow window for each reaction at T=2−3 GK. The hatched (////) region indicates the range spanned by all combinations of the input nuclear models for PSF and NLD in TALYS using the KD03 OMP model.
-
The measured cross sections and corresponding S-factor values for 112Sn(p, γ)113Sb [15] are shown in Figs. 1(a) and 2(a), respectively. The experimentally derived S-factors [15] lie well within the range of TALYS predictions obtained using different combinations of NLD and PSF models with the phenomenological KD03 OMP across the full energy range. This spread is indicated in the figures by the hatched band. To systematically investigate the sensitivity to nuclear input parameters, calculations were first performed by varying the available PSF models in TALYS while keeping the NLD and OMP fixed at their default choices, namely, the Gilbert–Cameron Constant Temperature model [30] and the KD03 potential [23]. Among the different PSF options implemented in TALYS, the SMLO model [25, 44] provides the best overall reproduction of the experimental trend. Subsequently, with the PSF model fixed, different NLD prescriptions were explored. The Skyrme-HFB model [29] yields improved agreement at lower energies (up to ~5 MeV), whereas at higher energies, the Gilbert–Cameron formulation provides a better description. In addition, comparison of the optical model potentials confirms that the KD03 phenomenological OMP gives substantially better agreement than the semi-microscopic JLM potential in reproducing the measured data. By contrast, the NON-SMOKER(web) calculations deviate significantly across the entire energy range. The TALYS VI model set, which incorporates experimentally constrained NLD and PSF parameters from Ref. [26], reproduces both the measured cross sections and corresponding S-factors very well, demonstrating the effectiveness of locally optimized inputs in describing the reaction. However, a comparable level of agreement is also obtained with the TALYS model sets, particularly the TALYS I and TALYS II model combinations for the 112Sn(p, γ)113Sb reaction, as evidenced by both the visual comparison in Figs. 1(a) and 2(a) and the quantitative
$ \chi^2 $ and relative variance (D) analysis presented in Table 3. -
The measured cross sections and corresponding S-factor values for 112Sn(p, γ)113Sb [15] are shown in Figs. 1(a) and 2(a), respectively. The experimentally derived S-factors [15] lie well within the range of TALYS predictions obtained using different combinations of NLD and PSF models with the phenomenological KD03 OMP across the full energy range. This spread is indicated in the figures by the hatched band. To systematically investigate the sensitivity to nuclear input parameters, calculations were first performed by varying the available PSF models in TALYS while keeping the NLD and OMP fixed at their default choices, namely, the Gilbert–Cameron Constant Temperature model [30] and the KD03 potential [23]. Among the different PSF options implemented in TALYS, the SMLO model [25, 44] provides the best overall reproduction of the experimental trend. Subsequently, with the PSF model fixed, different NLD prescriptions were explored. The Skyrme-HFB model [29] yields improved agreement at lower energies (up to ~5 MeV), whereas at higher energies, the Gilbert–Cameron formulation provides a better description. In addition, comparison of the optical model potentials confirms that the KD03 phenomenological OMP gives substantially better agreement than the semi-microscopic JLM potential in reproducing the measured data. By contrast, the NON-SMOKER(web) calculations deviate significantly across the entire energy range. The TALYS VI model set, which incorporates experimentally constrained NLD and PSF parameters from Ref. [26], reproduces both the measured cross sections and corresponding S-factors very well, demonstrating the effectiveness of locally optimized inputs in describing the reaction. However, a comparable level of agreement is also obtained with the TALYS model sets, particularly the TALYS I and TALYS II model combinations for the 112Sn(p, γ)113Sb reaction, as evidenced by both the visual comparison in Figs. 1(a) and 2(a) and the quantitative
$ \chi^2 $ and relative variance (D) analysis presented in Table 3. -
The measured cross sections and corresponding S-factor values for 112Sn(p, γ)113Sb [15] are shown in Figs. 1(a) and 2(a), respectively. The experimentally derived S-factors [15] lie well within the range of TALYS predictions obtained using different combinations of NLD and PSF models with the phenomenological KD03 OMP across the full energy range. This spread is indicated in the figures by the hatched band. To systematically investigate the sensitivity to nuclear input parameters, calculations were first performed by varying the available PSF models in TALYS while keeping the NLD and OMP fixed at their default choices, namely, the Gilbert–Cameron Constant Temperature model [30] and the KD03 potential [23]. Among the different PSF options implemented in TALYS, the SMLO model [25, 44] provides the best overall reproduction of the experimental trend. Subsequently, with the PSF model fixed, different NLD prescriptions were explored. The Skyrme-HFB model [29] yields improved agreement at lower energies (up to ~5 MeV), whereas at higher energies, the Gilbert–Cameron formulation provides a better description. In addition, comparison of the optical model potentials confirms that the KD03 phenomenological OMP gives substantially better agreement than the semi-microscopic JLM potential in reproducing the measured data. By contrast, the NON-SMOKER(web) calculations deviate significantly across the entire energy range. The TALYS VI model set, which incorporates experimentally constrained NLD and PSF parameters from Ref. [26], reproduces both the measured cross sections and corresponding S-factors very well, demonstrating the effectiveness of locally optimized inputs in describing the reaction. However, a comparable level of agreement is also obtained with the TALYS model sets, particularly the TALYS I and TALYS II model combinations for the 112Sn(p, γ)113Sb reaction, as evidenced by both the visual comparison in Figs. 1(a) and 2(a) and the quantitative
$ \chi^2 $ and relative variance (D) analysis presented in Table 3. -
The measured cross sections and corresponding S-factor values for 112Sn(p, γ)113Sb [15] are shown in Figs. 1(a) and 2(a), respectively. The experimentally derived S-factors [15] lie well within the range of TALYS predictions obtained using different combinations of NLD and PSF models with the phenomenological KD03 OMP across the full energy range. This spread is indicated in the figures by the hatched band. To systematically investigate the sensitivity to nuclear input parameters, calculations were first performed by varying the available PSF models in TALYS while keeping the NLD and OMP fixed at their default choices, namely, the Gilbert–Cameron Constant Temperature model [30] and the KD03 potential [23]. Among the different PSF options implemented in TALYS, the SMLO model [25, 44] provides the best overall reproduction of the experimental trend. Subsequently, with the PSF model fixed, different NLD prescriptions were explored. The Skyrme-HFB model [29] yields improved agreement at lower energies (up to ~5 MeV), whereas at higher energies, the Gilbert–Cameron formulation provides a better description. In addition, comparison of the optical model potentials confirms that the KD03 phenomenological OMP gives substantially better agreement than the semi-microscopic JLM potential in reproducing the measured data. By contrast, the NON-SMOKER(web) calculations deviate significantly across the entire energy range. The TALYS VI model set, which incorporates experimentally constrained NLD and PSF parameters from Ref. [26], reproduces both the measured cross sections and corresponding S-factors very well, demonstrating the effectiveness of locally optimized inputs in describing the reaction. However, a comparable level of agreement is also obtained with the TALYS model sets, particularly the TALYS I and TALYS II model combinations for the 112Sn(p, γ)113Sb reaction, as evidenced by both the visual comparison in Figs. 1(a) and 2(a) and the quantitative
$ \chi^2 $ and relative variance (D) analysis presented in Table 3. -
The measured cross sections and corresponding S-factor values for 112Sn(p, γ)113Sb [15] are shown in Figs. 1(a) and 2(a), respectively. The experimentally derived S-factors [15] lie well within the range of TALYS predictions obtained using different combinations of NLD and PSF models with the phenomenological KD03 OMP across the full energy range. This spread is indicated in the figures by the hatched band. To systematically investigate the sensitivity to nuclear input parameters, calculations were first performed by varying the available PSF models in TALYS while keeping the NLD and OMP fixed at their default choices, namely, the Gilbert–Cameron Constant Temperature model [30] and the KD03 potential [23]. Among the different PSF options implemented in TALYS, the SMLO model [25, 44] provides the best overall reproduction of the experimental trend. Subsequently, with the PSF model fixed, different NLD prescriptions were explored. The Skyrme-HFB model [29] yields improved agreement at lower energies (up to ~5 MeV), whereas at higher energies, the Gilbert–Cameron formulation provides a better description. In addition, comparison of the optical model potentials confirms that the KD03 phenomenological OMP gives substantially better agreement than the semi-microscopic JLM potential in reproducing the measured data. By contrast, the NON-SMOKER(web) calculations deviate significantly across the entire energy range. The TALYS VI model set, which incorporates experimentally constrained NLD and PSF parameters from Ref. [26], reproduces both the measured cross sections and corresponding S-factors very well, demonstrating the effectiveness of locally optimized inputs in describing the reaction. However, a comparable level of agreement is also obtained with the TALYS model sets, particularly the TALYS I and TALYS II model combinations for the 112Sn(p, γ)113Sb reaction, as evidenced by both the visual comparison in Figs. 1(a) and 2(a) and the quantitative
$ \chi^2 $ and relative variance (D) analysis presented in Table 3. -
The
$ \sigma_{\mathrm{bare}} $ values and corresponding S-factors for 114Sn(p, γ)115Sb are shown in Figs. 1(b) and 2(b). As is evident from the figures, the experimental S-factors exhibit weak sensitivity to variations in the PSF and NLD models within the measured energy range. Most data points fall outside the TALYS prediction band, except for the two data points at higher energies. Because experimentally constrained NLD and PSF parameters are unavailable, comparison with the constrained TALYS VI model was not performed. The TALYS II model set provides marginally better agreement, although significant deviations remain at energies ≤ 3 MeV. The TALYS II model predictions are very close to those of the TALYS I calculations. Calculations using the KD03 OMP perform better than those using the JLM OMP. The NON-SMOKER (web) predictions show significant deviations throughout the energy range. -
The
$ \sigma_{\mathrm{bare}} $ values and corresponding S-factors for 114Sn(p, γ)115Sb are shown in Figs. 1(b) and 2(b). As is evident from the figures, the experimental S-factors exhibit weak sensitivity to variations in the PSF and NLD models within the measured energy range. Most data points fall outside the TALYS prediction band, except for the two data points at higher energies. Because experimentally constrained NLD and PSF parameters are unavailable, comparison with the constrained TALYS VI model was not performed. The TALYS II model set provides marginally better agreement, although significant deviations remain at energies ≤ 3 MeV. The TALYS II model predictions are very close to those of the TALYS I calculations. Calculations using the KD03 OMP perform better than those using the JLM OMP. The NON-SMOKER (web) predictions show significant deviations throughout the energy range. -
The
$ \sigma_{\mathrm{bare}} $ values and corresponding S-factors for 114Sn(p, γ)115Sb are shown in Figs. 1(b) and 2(b). As is evident from the figures, the experimental S-factors exhibit weak sensitivity to variations in the PSF and NLD models within the measured energy range. Most data points fall outside the TALYS prediction band, except for the two data points at higher energies. Because experimentally constrained NLD and PSF parameters are unavailable, comparison with the constrained TALYS VI model was not performed. The TALYS II model set provides marginally better agreement, although significant deviations remain at energies ≤ 3 MeV. The TALYS II model predictions are very close to those of the TALYS I calculations. Calculations using the KD03 OMP perform better than those using the JLM OMP. The NON-SMOKER (web) predictions show significant deviations throughout the energy range. -
The
$ \sigma_{\mathrm{bare}} $ values and corresponding S-factors for 114Sn(p, γ)115Sb are shown in Figs. 1(b) and 2(b). As is evident from the figures, the experimental S-factors exhibit weak sensitivity to variations in the PSF and NLD models within the measured energy range. Most data points fall outside the TALYS prediction band, except for the two data points at higher energies. Because experimentally constrained NLD and PSF parameters are unavailable, comparison with the constrained TALYS VI model was not performed. The TALYS II model set provides marginally better agreement, although significant deviations remain at energies ≤ 3 MeV. The TALYS II model predictions are very close to those of the TALYS I calculations. Calculations using the KD03 OMP perform better than those using the JLM OMP. The NON-SMOKER (web) predictions show significant deviations throughout the energy range. -
The
$ \sigma_{\mathrm{bare}} $ values and corresponding S-factors for 114Sn(p, γ)115Sb are shown in Figs. 1(b) and 2(b). As is evident from the figures, the experimental S-factors exhibit weak sensitivity to variations in the PSF and NLD models within the measured energy range. Most data points fall outside the TALYS prediction band, except for the two data points at higher energies. Because experimentally constrained NLD and PSF parameters are unavailable, comparison with the constrained TALYS VI model was not performed. The TALYS II model set provides marginally better agreement, although significant deviations remain at energies ≤ 3 MeV. The TALYS II model predictions are very close to those of the TALYS I calculations. Calculations using the KD03 OMP perform better than those using the JLM OMP. The NON-SMOKER (web) predictions show significant deviations throughout the energy range. -
Figures 1(c) and 2(c) present the experimental cross sections and S-factors for 115Sn(p, γ)116Sb. As shown in the figures, the measurements agree with the TALYS predictions obtained using the model combinations TALYS I, TALYS II, and TALYS IV. However, as evident from Table 3, TALYS II has smaller
$ \chi^2 $ and D values. The NON-SMOKER (web) predictions deviate from both the measurements and the TALYS calculations. As in the case of 114Sn, experimentally constrained NLD and PSF parameters were not available for 115Sn; therefore, the TALYS VI model comparison was not performed for this reaction. -
Figures 1(c) and 2(c) present the experimental cross sections and S-factors for 115Sn(p, γ)116Sb. As shown in the figures, the measurements agree with the TALYS predictions obtained using the model combinations TALYS I, TALYS II, and TALYS IV. However, as evident from Table 3, TALYS II has smaller
$ \chi^2 $ and D values. The NON-SMOKER (web) predictions deviate from both the measurements and the TALYS calculations. As in the case of 114Sn, experimentally constrained NLD and PSF parameters were not available for 115Sn; therefore, the TALYS VI model comparison was not performed for this reaction. -
Figures 1(c) and 2(c) present the experimental cross sections and S-factors for 115Sn(p, γ)116Sb. As shown in the figures, the measurements agree with the TALYS predictions obtained using the model combinations TALYS I, TALYS II, and TALYS IV. However, as evident from Table 3, TALYS II has smaller
$ \chi^2 $ and D values. The NON-SMOKER (web) predictions deviate from both the measurements and the TALYS calculations. As in the case of 114Sn, experimentally constrained NLD and PSF parameters were not available for 115Sn; therefore, the TALYS VI model comparison was not performed for this reaction. -
Figures 1(c) and 2(c) present the experimental cross sections and S-factors for 115Sn(p, γ)116Sb. As shown in the figures, the measurements agree with the TALYS predictions obtained using the model combinations TALYS I, TALYS II, and TALYS IV. However, as evident from Table 3, TALYS II has smaller
$ \chi^2 $ and D values. The NON-SMOKER (web) predictions deviate from both the measurements and the TALYS calculations. As in the case of 114Sn, experimentally constrained NLD and PSF parameters were not available for 115Sn; therefore, the TALYS VI model comparison was not performed for this reaction. -
Figures 1(c) and 2(c) present the experimental cross sections and S-factors for 115Sn(p, γ)116Sb. As shown in the figures, the measurements agree with the TALYS predictions obtained using the model combinations TALYS I, TALYS II, and TALYS IV. However, as evident from Table 3, TALYS II has smaller
$ \chi^2 $ and D values. The NON-SMOKER (web) predictions deviate from both the measurements and the TALYS calculations. As in the case of 114Sn, experimentally constrained NLD and PSF parameters were not available for 115Sn; therefore, the TALYS VI model comparison was not performed for this reaction. -
The electron-screening-corrected cross sections and S-factor values for 116Sn(p, γ)117Sb are shown in Figs. 1(d) and 2(d). As in the case of 114Sn, the S-factor values derived from the measured (p, γ) cross sections [16, 17, 19] show minimal sensitivity to variations in model inputs, owing to the relatively small spread among the calculated S-factors for all NLD and PSF models considered. Fig. 2(c) shows that neither the TALYS I nor the TALYS II model set fully reproduces the experimental data of Refs. [16, 17], although both provide a better description than NON-SMOKER (web). The most recent measurements reported in Ref. [19] show improved agreement with the TALYS II and TALYS VI model sets at energies ≥ 3.2 MeV. Because the TALYS VI model set incorporates experimentally constrained NLD and PSF parameters from Ref. [26], the consistency of the measured data with both TALYS II and TALYS VI further supports the reliability of the standard TALYS input models. The
$ \chi^2 $ analysis and relative variance (D) values for the three measurements are given in Table 3. Interestingly, the cross sections reported in Ref. [19] are considerably lower than the earlier measurements [16, 17] and more consistent with TALYS predictions. However, none of the model combinations employing microscopic, semi-microscopic, or experimentally constrained nuclear inputs can reproduce the measured values at energies ≤ 3.2 MeV (see Fig. 2(c)). It should be noted that significant discrepancies exist among different experimental datasets at lower energies, complicating model validation in this energy region. -
The electron-screening-corrected cross sections and S-factor values for 116Sn(p, γ)117Sb are shown in Figs. 1(d) and 2(d). As in the case of 114Sn, the S-factor values derived from the measured (p, γ) cross sections [16, 17, 19] show minimal sensitivity to variations in model inputs, owing to the relatively small spread among the calculated S-factors for all NLD and PSF models considered. Fig. 2(c) shows that neither the TALYS I nor the TALYS II model set fully reproduces the experimental data of Refs. [16, 17], although both provide a better description than NON-SMOKER (web). The most recent measurements reported in Ref. [19] show improved agreement with the TALYS II and TALYS VI model sets at energies ≥ 3.2 MeV. Because the TALYS VI model set incorporates experimentally constrained NLD and PSF parameters from Ref. [26], the consistency of the measured data with both TALYS II and TALYS VI further supports the reliability of the standard TALYS input models. The
$ \chi^2 $ analysis and relative variance (D) values for the three measurements are given in Table 3. Interestingly, the cross sections reported in Ref. [19] are considerably lower than the earlier measurements [16, 17] and more consistent with TALYS predictions. However, none of the model combinations employing microscopic, semi-microscopic, or experimentally constrained nuclear inputs can reproduce the measured values at energies ≤ 3.2 MeV (see Fig. 2(c)). It should be noted that significant discrepancies exist among different experimental datasets at lower energies, complicating model validation in this energy region. -
The electron-screening-corrected cross sections and S-factor values for 116Sn(p, γ)117Sb are shown in Figs. 1(d) and 2(d). As in the case of 114Sn, the S-factor values derived from the measured (p, γ) cross sections [16, 17, 19] show minimal sensitivity to variations in model inputs, owing to the relatively small spread among the calculated S-factors for all NLD and PSF models considered. Fig. 2(c) shows that neither the TALYS I nor the TALYS II model set fully reproduces the experimental data of Refs. [16, 17], although both provide a better description than NON-SMOKER (web). The most recent measurements reported in Ref. [19] show improved agreement with the TALYS II and TALYS VI model sets at energies ≥ 3.2 MeV. Because the TALYS VI model set incorporates experimentally constrained NLD and PSF parameters from Ref. [26], the consistency of the measured data with both TALYS II and TALYS VI further supports the reliability of the standard TALYS input models. The
$ \chi^2 $ analysis and relative variance (D) values for the three measurements are given in Table 3. Interestingly, the cross sections reported in Ref. [19] are considerably lower than the earlier measurements [16, 17] and more consistent with TALYS predictions. However, none of the model combinations employing microscopic, semi-microscopic, or experimentally constrained nuclear inputs can reproduce the measured values at energies ≤ 3.2 MeV (see Fig. 2(c)). It should be noted that significant discrepancies exist among different experimental datasets at lower energies, complicating model validation in this energy region. -
The electron-screening-corrected cross sections and S-factor values for 116Sn(p, γ)117Sb are shown in Figs. 1(d) and 2(d). As in the case of 114Sn, the S-factor values derived from the measured (p, γ) cross sections [16, 17, 19] show minimal sensitivity to variations in model inputs, owing to the relatively small spread among the calculated S-factors for all NLD and PSF models considered. Fig. 2(c) shows that neither the TALYS I nor the TALYS II model set fully reproduces the experimental data of Refs. [16, 17], although both provide a better description than NON-SMOKER (web). The most recent measurements reported in Ref. [19] show improved agreement with the TALYS II and TALYS VI model sets at energies ≥ 3.2 MeV. Because the TALYS VI model set incorporates experimentally constrained NLD and PSF parameters from Ref. [26], the consistency of the measured data with both TALYS II and TALYS VI further supports the reliability of the standard TALYS input models. The
$ \chi^2 $ analysis and relative variance (D) values for the three measurements are given in Table 3. Interestingly, the cross sections reported in Ref. [19] are considerably lower than the earlier measurements [16, 17] and more consistent with TALYS predictions. However, none of the model combinations employing microscopic, semi-microscopic, or experimentally constrained nuclear inputs can reproduce the measured values at energies ≤ 3.2 MeV (see Fig. 2(c)). It should be noted that significant discrepancies exist among different experimental datasets at lower energies, complicating model validation in this energy region. -
The electron-screening-corrected cross sections and S-factor values for 116Sn(p, γ)117Sb are shown in Figs. 1(d) and 2(d). As in the case of 114Sn, the S-factor values derived from the measured (p, γ) cross sections [16, 17, 19] show minimal sensitivity to variations in model inputs, owing to the relatively small spread among the calculated S-factors for all NLD and PSF models considered. Fig. 2(c) shows that neither the TALYS I nor the TALYS II model set fully reproduces the experimental data of Refs. [16, 17], although both provide a better description than NON-SMOKER (web). The most recent measurements reported in Ref. [19] show improved agreement with the TALYS II and TALYS VI model sets at energies ≥ 3.2 MeV. Because the TALYS VI model set incorporates experimentally constrained NLD and PSF parameters from Ref. [26], the consistency of the measured data with both TALYS II and TALYS VI further supports the reliability of the standard TALYS input models. The
$ \chi^2 $ analysis and relative variance (D) values for the three measurements are given in Table 3. Interestingly, the cross sections reported in Ref. [19] are considerably lower than the earlier measurements [16, 17] and more consistent with TALYS predictions. However, none of the model combinations employing microscopic, semi-microscopic, or experimentally constrained nuclear inputs can reproduce the measured values at energies ≤ 3.2 MeV (see Fig. 2(c)). It should be noted that significant discrepancies exist among different experimental datasets at lower energies, complicating model validation in this energy region. -
The measured cross sections and corresponding S-factor values for 118Sn(p, γ)119Sb are presented in Figs. 1(e) and 2(e). The hatched shaded region shows that the spread in the theoretical predictions is negligible up to ~ 4.5 MeV but increases significantly above this energy. This suggests that the calculated S-factor values are only weakly sensitive to the choice of NLD and PSF models below 4.5 MeV, whereas the model dependence becomes more pronounced at higher energies. The standard TALYS model sets, TALYS I, TALYS II, and TALYS IV, all of which employ the KD03 OMP with different PSF models, together with the experimentally constrained TALYS VI model set, provide a better description of the measured cross sections [19] than the NON-SMOKER database predictions [18]. However, the TALYS calculations also deviate from the measured data at the lowest energies, consistent with the trends observed for the 114Sn(p, γ)115Sb and 116Sn(p, γ)117Sb reactions.
-
The measured cross sections and corresponding S-factor values for 118Sn(p, γ)119Sb are presented in Figs. 1(e) and 2(e). The hatched shaded region shows that the spread in the theoretical predictions is negligible up to ~ 4.5 MeV but increases significantly above this energy. This suggests that the calculated S-factor values are only weakly sensitive to the choice of NLD and PSF models below 4.5 MeV, whereas the model dependence becomes more pronounced at higher energies. The standard TALYS model sets, TALYS I, TALYS II, and TALYS IV, all of which employ the KD03 OMP with different PSF models, together with the experimentally constrained TALYS VI model set, provide a better description of the measured cross sections [19] than the NON-SMOKER database predictions [18]. However, the TALYS calculations also deviate from the measured data at the lowest energies, consistent with the trends observed for the 114Sn(p, γ)115Sb and 116Sn(p, γ)117Sb reactions.
-
The measured cross sections and corresponding S-factor values for 118Sn(p, γ)119Sb are presented in Figs. 1(e) and 2(e). The hatched shaded region shows that the spread in the theoretical predictions is negligible up to ~ 4.5 MeV but increases significantly above this energy. This suggests that the calculated S-factor values are only weakly sensitive to the choice of NLD and PSF models below 4.5 MeV, whereas the model dependence becomes more pronounced at higher energies. The standard TALYS model sets, TALYS I, TALYS II, and TALYS IV, all of which employ the KD03 OMP with different PSF models, together with the experimentally constrained TALYS VI model set, provide a better description of the measured cross sections [19] than the NON-SMOKER database predictions [18]. However, the TALYS calculations also deviate from the measured data at the lowest energies, consistent with the trends observed for the 114Sn(p, γ)115Sb and 116Sn(p, γ)117Sb reactions.
-
The measured cross sections and corresponding S-factor values for 118Sn(p, γ)119Sb are presented in Figs. 1(e) and 2(e). The hatched shaded region shows that the spread in the theoretical predictions is negligible up to ~ 4.5 MeV but increases significantly above this energy. This suggests that the calculated S-factor values are only weakly sensitive to the choice of NLD and PSF models below 4.5 MeV, whereas the model dependence becomes more pronounced at higher energies. The standard TALYS model sets, TALYS I, TALYS II, and TALYS IV, all of which employ the KD03 OMP with different PSF models, together with the experimentally constrained TALYS VI model set, provide a better description of the measured cross sections [19] than the NON-SMOKER database predictions [18]. However, the TALYS calculations also deviate from the measured data at the lowest energies, consistent with the trends observed for the 114Sn(p, γ)115Sb and 116Sn(p, γ)117Sb reactions.
-
The measured cross sections and corresponding S-factor values for 118Sn(p, γ)119Sb are presented in Figs. 1(e) and 2(e). The hatched shaded region shows that the spread in the theoretical predictions is negligible up to ~ 4.5 MeV but increases significantly above this energy. This suggests that the calculated S-factor values are only weakly sensitive to the choice of NLD and PSF models below 4.5 MeV, whereas the model dependence becomes more pronounced at higher energies. The standard TALYS model sets, TALYS I, TALYS II, and TALYS IV, all of which employ the KD03 OMP with different PSF models, together with the experimentally constrained TALYS VI model set, provide a better description of the measured cross sections [19] than the NON-SMOKER database predictions [18]. However, the TALYS calculations also deviate from the measured data at the lowest energies, consistent with the trends observed for the 114Sn(p, γ)115Sb and 116Sn(p, γ)117Sb reactions.
-
Figs. 1(f) and 2(f) show the
$ \sigma{_{\rm bare}} $ values and the corresponding S-factors for the 119Sn(p, γ)120Sb reaction. Unlike for the other isotopes, the Brink-Axel PSF model yields better agreement in this case than the SMLO PSF model. Both the KD03 and JLM OMPs yield comparable results. However, the experimentally constrained TALYS VI model set, as well as the other standard TALYS model sets, does not satisfactorily reproduce the measured cross sections. With the phenomenological KD03 OMP, the measured cross-section data [15] are best reproduced by the TALYS III model set using the Constant Temperature NLD model in combination with the Brink-Axel PSF model, up to approximately 5 MeV, consistent with the observations of S. Harissopulos et al. [19]. Beyond 5 MeV, the cross-section predictions from both TALYS and NON-SMOKER underestimate the measured data. It should be noted that TALYS II does not perform well for 119Sn, unlike for the other Sn isotopes. The$ \chi^2 $ analysis and relative variance (D) values for the three model combinations for this reaction are given in Table 3.The present study of (p, γ) reactions on Sn isotopes demonstrates that TALYS calculations generally provide a better description of measured (p, γ) cross sections than NON-SMOKER (web) predictions. A systematic comparison of different TALYS model combinations further reveals that the phenomenological KD03 OMP consistently yields better agreement with experimental data for Sn(p, γ) reactions than the semi-microscopic JLM potential [24]. Moreover, the comparison of measurements with the TALYS II and TALYS IV model sets suggests that the phenomenological SMLO PSF model provides better agreement than the microscopic Gogny-HFB-QRPA model for Sn isotopes. Complementary calculations employing experimentally constrained NLD and PSF inputs from the systematic study of Markova et al. [26] also reproduce the measured cross sections reasonably well in the Sn region, except for 119Sn(p, γ)120Sb. Notably, these locally constrained results are consistent with those obtained using the TALYS II model combination, indicating that the latter effectively captures the essential nuclear physics governing the reaction mechanism.
Given that the primary objective of this work is a systematic investigation over a broader mass region, a model combination that maintains global consistency is required, because reliance on local experimental parameters is not feasible for all the nuclei involved. The demonstrated consistency between the experimentally constrained calculations and the TALYS II predictions within the Sn isotopic chain provides confidence in adopting the TALYS II model set as a reliable and globally applicable framework. Accordingly, the TALYS II model combination, together with the default TALYS I set, has been employed to extend the calculations to neighboring nuclei across the atomic number range
$ Z=42-56 $ .It is important to emphasize that no single model or parameter set can consistently reproduce (p, γ) cross sections across all nuclei, even within a limited isotopic chain such as Sn. This limitation arises from inherent uncertainties in the nuclear input ingredients, such as NLD, PSF, and OMP, as well as from approximations in the Hauser–Feshbach statistical framework. Consequently, direct extrapolation of any single model to unexplored regions of the nuclear chart remains nontrivial. At the same time, because experimental cross-section data of astrophysical relevance are scarce, Hauser–Feshbach models remain the primary tool for generating the large sets of reaction rates required for reaction network calculations. However, their predictive reliability must be systematically validated against available experimental data before they are extended to unknown regions.
Nevertheless, the overall agreement achieved with the TALYS II set appears to be sufficient for astrophysical applications, particularly for reaction network calculations, where uncertainties of a factor of approximately two are generally acceptable [48, 72]. For predictive purposes, establishing a direction toward a consistent set of models and parameters that can reasonably reproduce experimental (p, γ) cross sections for isotopes across a broad range of atomic numbers could provide a useful starting point.
-
Figs. 1(f) and 2(f) show the
$ \sigma{_{\rm bare}} $ values and the corresponding S-factors for the 119Sn(p, γ)120Sb reaction. Unlike for the other isotopes, the Brink-Axel PSF model yields better agreement in this case than the SMLO PSF model. Both the KD03 and JLM OMPs yield comparable results. However, the experimentally constrained TALYS VI model set, as well as the other standard TALYS model sets, does not satisfactorily reproduce the measured cross sections. With the phenomenological KD03 OMP, the measured cross-section data [15] are best reproduced by the TALYS III model set using the Constant Temperature NLD model in combination with the Brink-Axel PSF model, up to approximately 5 MeV, consistent with the observations of S. Harissopulos et al. [19]. Beyond 5 MeV, the cross-section predictions from both TALYS and NON-SMOKER underestimate the measured data. It should be noted that TALYS II does not perform well for 119Sn, unlike for the other Sn isotopes. The$ \chi^2 $ analysis and relative variance (D) values for the three model combinations for this reaction are given in Table 3.The present study of (p, γ) reactions on Sn isotopes demonstrates that TALYS calculations generally provide a better description of measured (p, γ) cross sections than NON-SMOKER (web) predictions. A systematic comparison of different TALYS model combinations further reveals that the phenomenological KD03 OMP consistently yields better agreement with experimental data for Sn(p, γ) reactions than the semi-microscopic JLM potential [24]. Moreover, the comparison of measurements with the TALYS II and TALYS IV model sets suggests that the phenomenological SMLO PSF model provides better agreement than the microscopic Gogny-HFB-QRPA model for Sn isotopes. Complementary calculations employing experimentally constrained NLD and PSF inputs from the systematic study of Markova et al. [26] also reproduce the measured cross sections reasonably well in the Sn region, except for 119Sn(p, γ)120Sb. Notably, these locally constrained results are consistent with those obtained using the TALYS II model combination, indicating that the latter effectively captures the essential nuclear physics governing the reaction mechanism.
Given that the primary objective of this work is a systematic investigation over a broader mass region, a model combination that maintains global consistency is required, because reliance on local experimental parameters is not feasible for all the nuclei involved. The demonstrated consistency between the experimentally constrained calculations and the TALYS II predictions within the Sn isotopic chain provides confidence in adopting the TALYS II model set as a reliable and globally applicable framework. Accordingly, the TALYS II model combination, together with the default TALYS I set, has been employed to extend the calculations to neighboring nuclei across the atomic number range
$ Z=42-56 $ .It is important to emphasize that no single model or parameter set can consistently reproduce (p, γ) cross sections across all nuclei, even within a limited isotopic chain such as Sn. This limitation arises from inherent uncertainties in the nuclear input ingredients, such as NLD, PSF, and OMP, as well as from approximations in the Hauser–Feshbach statistical framework. Consequently, direct extrapolation of any single model to unexplored regions of the nuclear chart remains nontrivial. At the same time, because experimental cross-section data of astrophysical relevance are scarce, Hauser–Feshbach models remain the primary tool for generating the large sets of reaction rates required for reaction network calculations. However, their predictive reliability must be systematically validated against available experimental data before they are extended to unknown regions.
Nevertheless, the overall agreement achieved with the TALYS II set appears to be sufficient for astrophysical applications, particularly for reaction network calculations, where uncertainties of a factor of approximately two are generally acceptable [48, 72]. For predictive purposes, establishing a direction toward a consistent set of models and parameters that can reasonably reproduce experimental (p, γ) cross sections for isotopes across a broad range of atomic numbers could provide a useful starting point.
-
Figs. 1(f) and 2(f) show the
$ \sigma{_{\rm bare}} $ values and the corresponding S-factors for the 119Sn(p, γ)120Sb reaction. Unlike for the other isotopes, the Brink-Axel PSF model yields better agreement in this case than the SMLO PSF model. Both the KD03 and JLM OMPs yield comparable results. However, the experimentally constrained TALYS VI model set, as well as the other standard TALYS model sets, does not satisfactorily reproduce the measured cross sections. With the phenomenological KD03 OMP, the measured cross-section data [15] are best reproduced by the TALYS III model set using the Constant Temperature NLD model in combination with the Brink-Axel PSF model, up to approximately 5 MeV, consistent with the observations of S. Harissopulos et al. [19]. Beyond 5 MeV, the cross-section predictions from both TALYS and NON-SMOKER underestimate the measured data. It should be noted that TALYS II does not perform well for 119Sn, unlike for the other Sn isotopes. The$ \chi^2 $ analysis and relative variance (D) values for the three model combinations for this reaction are given in Table 3.The present study of (p, γ) reactions on Sn isotopes demonstrates that TALYS calculations generally provide a better description of measured (p, γ) cross sections than NON-SMOKER (web) predictions. A systematic comparison of different TALYS model combinations further reveals that the phenomenological KD03 OMP consistently yields better agreement with experimental data for Sn(p, γ) reactions than the semi-microscopic JLM potential [24]. Moreover, the comparison of measurements with the TALYS II and TALYS IV model sets suggests that the phenomenological SMLO PSF model provides better agreement than the microscopic Gogny-HFB-QRPA model for Sn isotopes. Complementary calculations employing experimentally constrained NLD and PSF inputs from the systematic study of Markova et al. [26] also reproduce the measured cross sections reasonably well in the Sn region, except for 119Sn(p, γ)120Sb. Notably, these locally constrained results are consistent with those obtained using the TALYS II model combination, indicating that the latter effectively captures the essential nuclear physics governing the reaction mechanism.
Given that the primary objective of this work is a systematic investigation over a broader mass region, a model combination that maintains global consistency is required, because reliance on local experimental parameters is not feasible for all the nuclei involved. The demonstrated consistency between the experimentally constrained calculations and the TALYS II predictions within the Sn isotopic chain provides confidence in adopting the TALYS II model set as a reliable and globally applicable framework. Accordingly, the TALYS II model combination, together with the default TALYS I set, has been employed to extend the calculations to neighboring nuclei across the atomic number range
$ Z=42-56 $ .It is important to emphasize that no single model or parameter set can consistently reproduce (p, γ) cross sections across all nuclei, even within a limited isotopic chain such as Sn. This limitation arises from inherent uncertainties in the nuclear input ingredients, such as NLD, PSF, and OMP, as well as from approximations in the Hauser–Feshbach statistical framework. Consequently, direct extrapolation of any single model to unexplored regions of the nuclear chart remains nontrivial. At the same time, because experimental cross-section data of astrophysical relevance are scarce, Hauser–Feshbach models remain the primary tool for generating the large sets of reaction rates required for reaction network calculations. However, their predictive reliability must be systematically validated against available experimental data before they are extended to unknown regions.
Nevertheless, the overall agreement achieved with the TALYS II set appears to be sufficient for astrophysical applications, particularly for reaction network calculations, where uncertainties of a factor of approximately two are generally acceptable [48, 72]. For predictive purposes, establishing a direction toward a consistent set of models and parameters that can reasonably reproduce experimental (p, γ) cross sections for isotopes across a broad range of atomic numbers could provide a useful starting point.
-
Figs. 1(f) and 2(f) show the
$ \sigma{_{\rm bare}} $ values and the corresponding S-factors for the 119Sn(p, γ)120Sb reaction. Unlike for the other isotopes, the Brink-Axel PSF model yields better agreement in this case than the SMLO PSF model. Both the KD03 and JLM OMPs yield comparable results. However, the experimentally constrained TALYS VI model set, as well as the other standard TALYS model sets, does not satisfactorily reproduce the measured cross sections. With the phenomenological KD03 OMP, the measured cross-section data [15] are best reproduced by the TALYS III model set using the Constant Temperature NLD model in combination with the Brink-Axel PSF model, up to approximately 5 MeV, consistent with the observations of S. Harissopulos et al. [19]. Beyond 5 MeV, the cross-section predictions from both TALYS and NON-SMOKER underestimate the measured data. It should be noted that TALYS II does not perform well for 119Sn, unlike for the other Sn isotopes. The$ \chi^2 $ analysis and relative variance (D) values for the three model combinations for this reaction are given in Table 3.The present study of (p, γ) reactions on Sn isotopes demonstrates that TALYS calculations generally provide a better description of measured (p, γ) cross sections than NON-SMOKER (web) predictions. A systematic comparison of different TALYS model combinations further reveals that the phenomenological KD03 OMP consistently yields better agreement with experimental data for Sn(p, γ) reactions than the semi-microscopic JLM potential [24]. Moreover, the comparison of measurements with the TALYS II and TALYS IV model sets suggests that the phenomenological SMLO PSF model provides better agreement than the microscopic Gogny-HFB-QRPA model for Sn isotopes. Complementary calculations employing experimentally constrained NLD and PSF inputs from the systematic study of Markova et al. [26] also reproduce the measured cross sections reasonably well in the Sn region, except for 119Sn(p, γ)120Sb. Notably, these locally constrained results are consistent with those obtained using the TALYS II model combination, indicating that the latter effectively captures the essential nuclear physics governing the reaction mechanism.
Given that the primary objective of this work is a systematic investigation over a broader mass region, a model combination that maintains global consistency is required, because reliance on local experimental parameters is not feasible for all the nuclei involved. The demonstrated consistency between the experimentally constrained calculations and the TALYS II predictions within the Sn isotopic chain provides confidence in adopting the TALYS II model set as a reliable and globally applicable framework. Accordingly, the TALYS II model combination, together with the default TALYS I set, has been employed to extend the calculations to neighboring nuclei across the atomic number range
$ Z=42-56 $ .It is important to emphasize that no single model or parameter set can consistently reproduce (p, γ) cross sections across all nuclei, even within a limited isotopic chain such as Sn. This limitation arises from inherent uncertainties in the nuclear input ingredients, such as NLD, PSF, and OMP, as well as from approximations in the Hauser–Feshbach statistical framework. Consequently, direct extrapolation of any single model to unexplored regions of the nuclear chart remains nontrivial. At the same time, because experimental cross-section data of astrophysical relevance are scarce, Hauser–Feshbach models remain the primary tool for generating the large sets of reaction rates required for reaction network calculations. However, their predictive reliability must be systematically validated against available experimental data before they are extended to unknown regions.
Nevertheless, the overall agreement achieved with the TALYS II set appears to be sufficient for astrophysical applications, particularly for reaction network calculations, where uncertainties of a factor of approximately two are generally acceptable [48, 72]. For predictive purposes, establishing a direction toward a consistent set of models and parameters that can reasonably reproduce experimental (p, γ) cross sections for isotopes across a broad range of atomic numbers could provide a useful starting point.
-
Figs. 1(f) and 2(f) show the
$ \sigma{_{\rm bare}} $ values and the corresponding S-factors for the 119Sn(p, γ)120Sb reaction. Unlike for the other isotopes, the Brink-Axel PSF model yields better agreement in this case than the SMLO PSF model. Both the KD03 and JLM OMPs yield comparable results. However, the experimentally constrained TALYS VI model set, as well as the other standard TALYS model sets, does not satisfactorily reproduce the measured cross sections. With the phenomenological KD03 OMP, the measured cross-section data [15] are best reproduced by the TALYS III model set using the Constant Temperature NLD model in combination with the Brink-Axel PSF model, up to approximately 5 MeV, consistent with the observations of S. Harissopulos et al. [19]. Beyond 5 MeV, the cross-section predictions from both TALYS and NON-SMOKER underestimate the measured data. It should be noted that TALYS II does not perform well for 119Sn, unlike for the other Sn isotopes. The$ \chi^2 $ analysis and relative variance (D) values for the three model combinations for this reaction are given in Table 3.The present study of (p, γ) reactions on Sn isotopes demonstrates that TALYS calculations generally provide a better description of measured (p, γ) cross sections than NON-SMOKER (web) predictions. A systematic comparison of different TALYS model combinations further reveals that the phenomenological KD03 OMP consistently yields better agreement with experimental data for Sn(p, γ) reactions than the semi-microscopic JLM potential [24]. Moreover, the comparison of measurements with the TALYS II and TALYS IV model sets suggests that the phenomenological SMLO PSF model provides better agreement than the microscopic Gogny-HFB-QRPA model for Sn isotopes. Complementary calculations employing experimentally constrained NLD and PSF inputs from the systematic study of Markova et al. [26] also reproduce the measured cross sections reasonably well in the Sn region, except for 119Sn(p, γ)120Sb. Notably, these locally constrained results are consistent with those obtained using the TALYS II model combination, indicating that the latter effectively captures the essential nuclear physics governing the reaction mechanism.
Given that the primary objective of this work is a systematic investigation over a broader mass region, a model combination that maintains global consistency is required, because reliance on local experimental parameters is not feasible for all the nuclei involved. The demonstrated consistency between the experimentally constrained calculations and the TALYS II predictions within the Sn isotopic chain provides confidence in adopting the TALYS II model set as a reliable and globally applicable framework. Accordingly, the TALYS II model combination, together with the default TALYS I set, has been employed to extend the calculations to neighboring nuclei across the atomic number range
$ Z=42-56 $ .It is important to emphasize that no single model or parameter set can consistently reproduce (p, γ) cross sections across all nuclei, even within a limited isotopic chain such as Sn. This limitation arises from inherent uncertainties in the nuclear input ingredients, such as NLD, PSF, and OMP, as well as from approximations in the Hauser–Feshbach statistical framework. Consequently, direct extrapolation of any single model to unexplored regions of the nuclear chart remains nontrivial. At the same time, because experimental cross-section data of astrophysical relevance are scarce, Hauser–Feshbach models remain the primary tool for generating the large sets of reaction rates required for reaction network calculations. However, their predictive reliability must be systematically validated against available experimental data before they are extended to unknown regions.
Nevertheless, the overall agreement achieved with the TALYS II set appears to be sufficient for astrophysical applications, particularly for reaction network calculations, where uncertainties of a factor of approximately two are generally acceptable [48, 72]. For predictive purposes, establishing a direction toward a consistent set of models and parameters that can reasonably reproduce experimental (p, γ) cross sections for isotopes across a broad range of atomic numbers could provide a useful starting point.
-
Having established suitable TALYS model combinations for Sn isotopes, we applied the same model sets to neighboring nuclei in the atomic number range
$ Z=42-56 $ . Our aim was to limit the systematic study to a narrow$ \Delta Z $ region, approximately$ \Delta Z = \pm 6 $ , because no single model combination is expected to reproduce the (p, γ) cross sections across the entire nuclear chart. However, because molybdenum ($ Z=42 $ ) is of astrophysical interest, we also extended the study to molybdenum isotopes.All experimental cross sections used in this analysis were corrected for electron screening effects. The results are presented in Figs. 3, 4, 5, 6, and 7. The gray shaded regions in these figures indicate the corresponding Gamow windows for each reaction over a temperature range of 2−3 GK. For a quantitative assessment of the best model fit, the calculated
$ \chi^2 $ values and relative variances (D) are summarized in Table 3.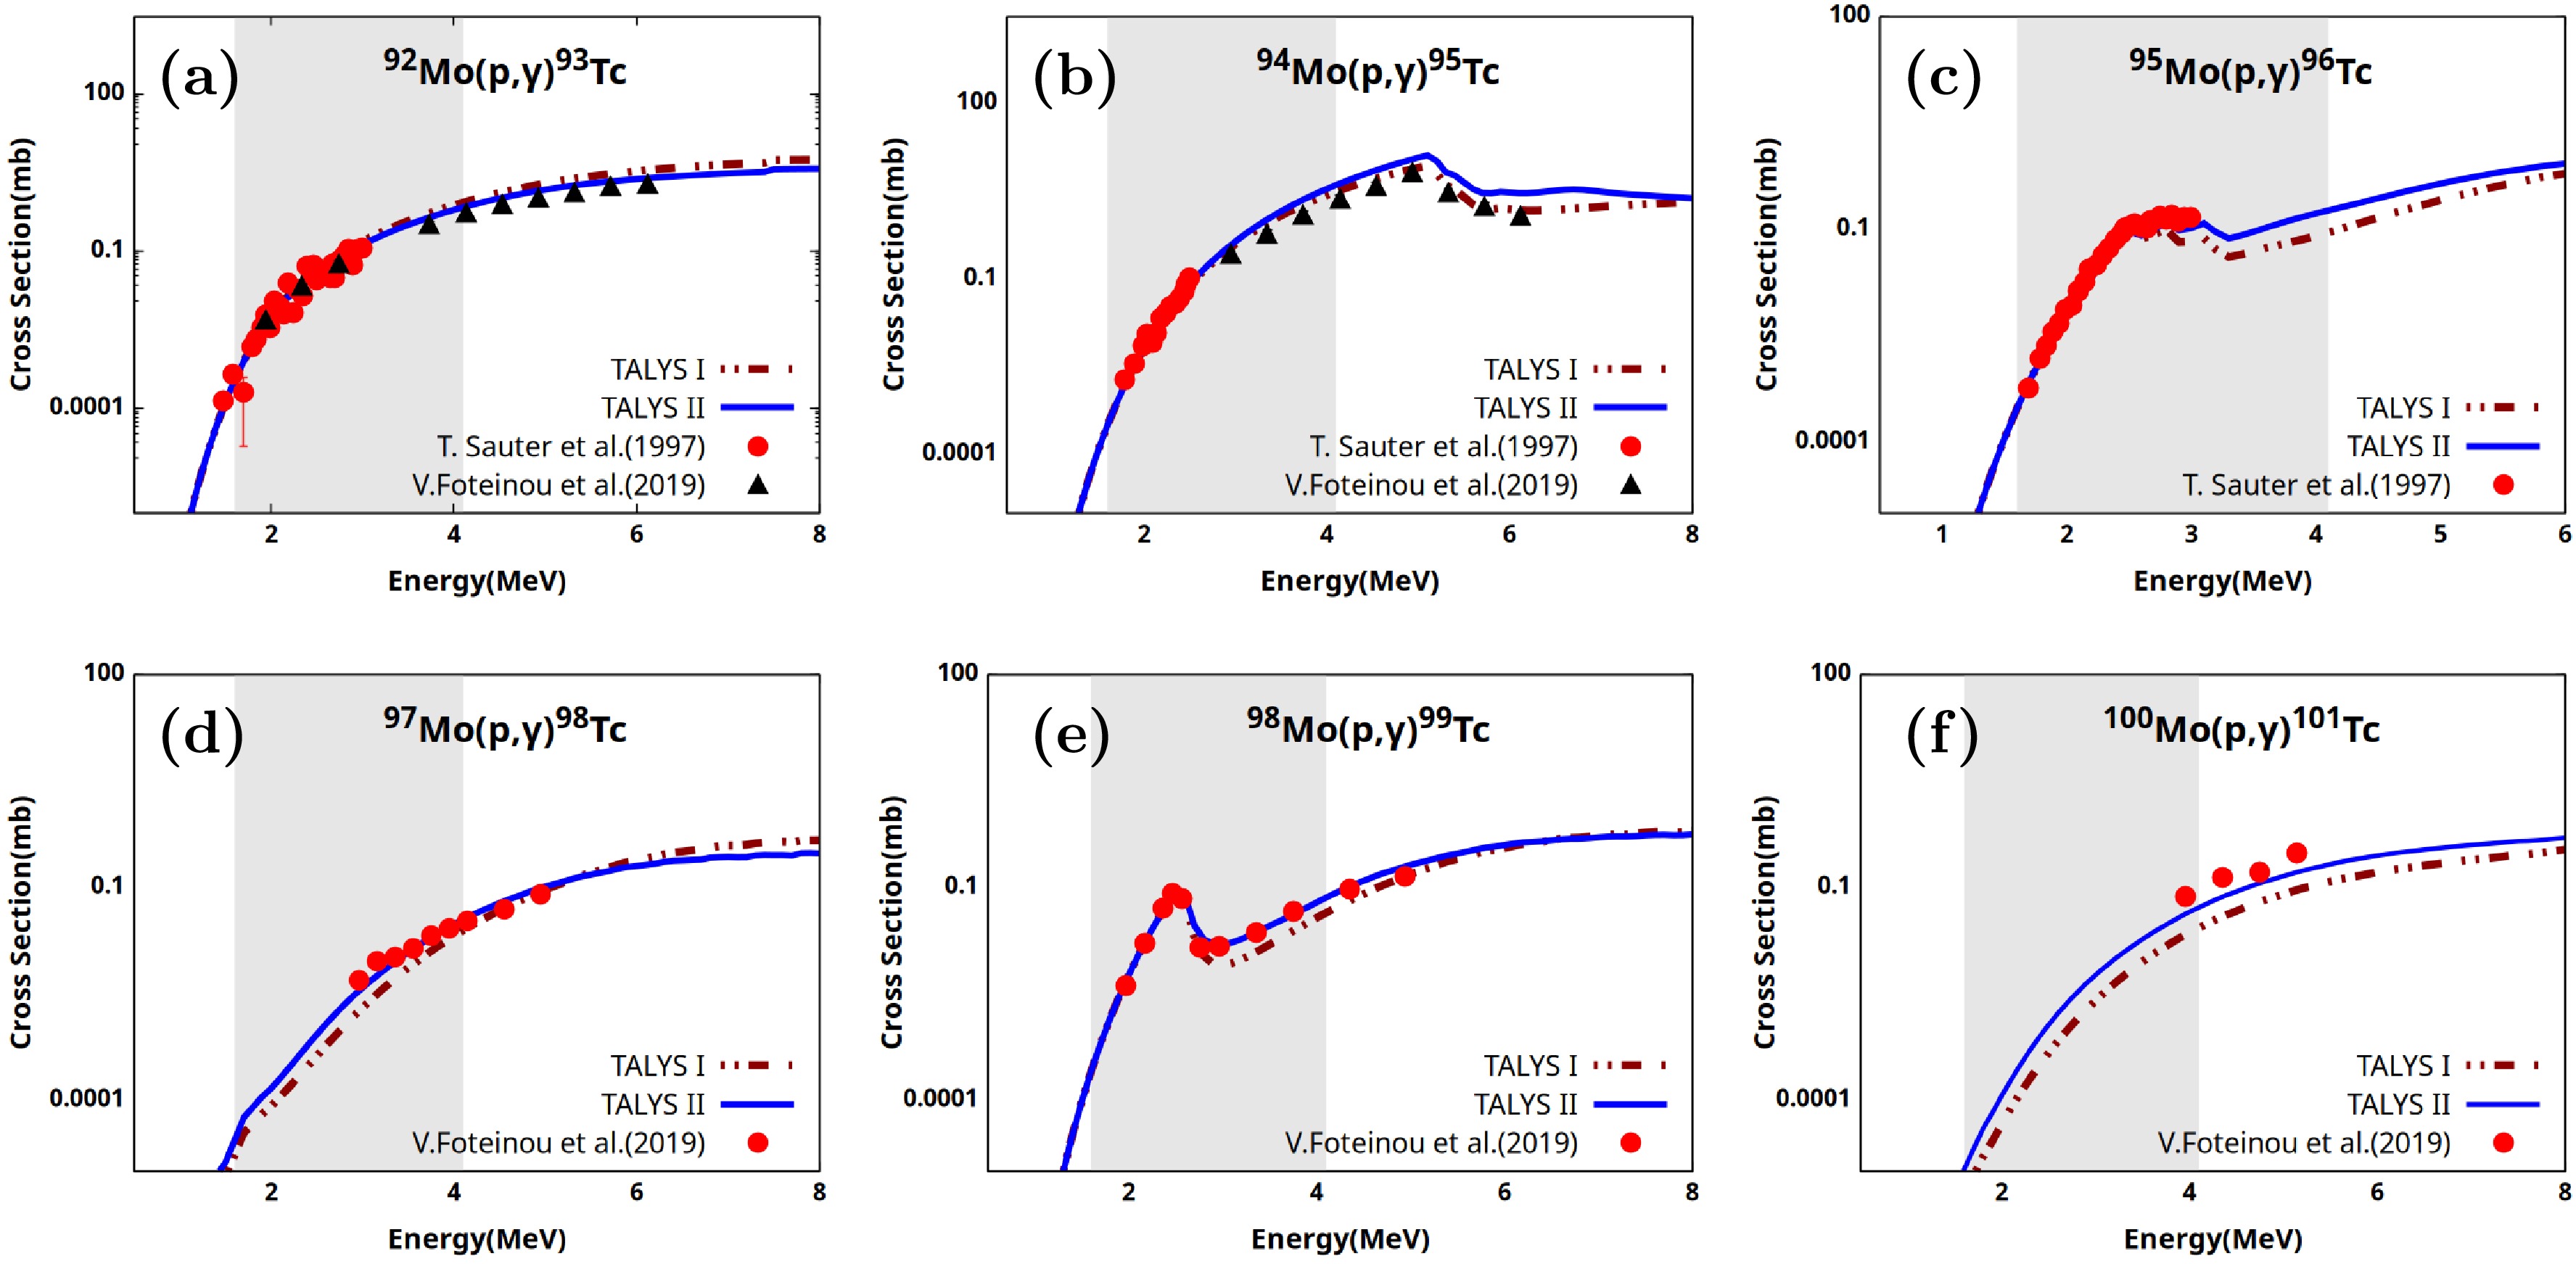
Figure 3. (color online) Comparison of the measured cross sections for radiative proton-capture reactions on molybdenum isotopes (
$Z=42 $ ) with TALYS predictions obtained using the TALYS I (dot–dot–dash) and TALYS II (solid line) parameter sets. The gray shaded areas represent the Gamow windows for the respective reactions at temperatures of 2−3 GK.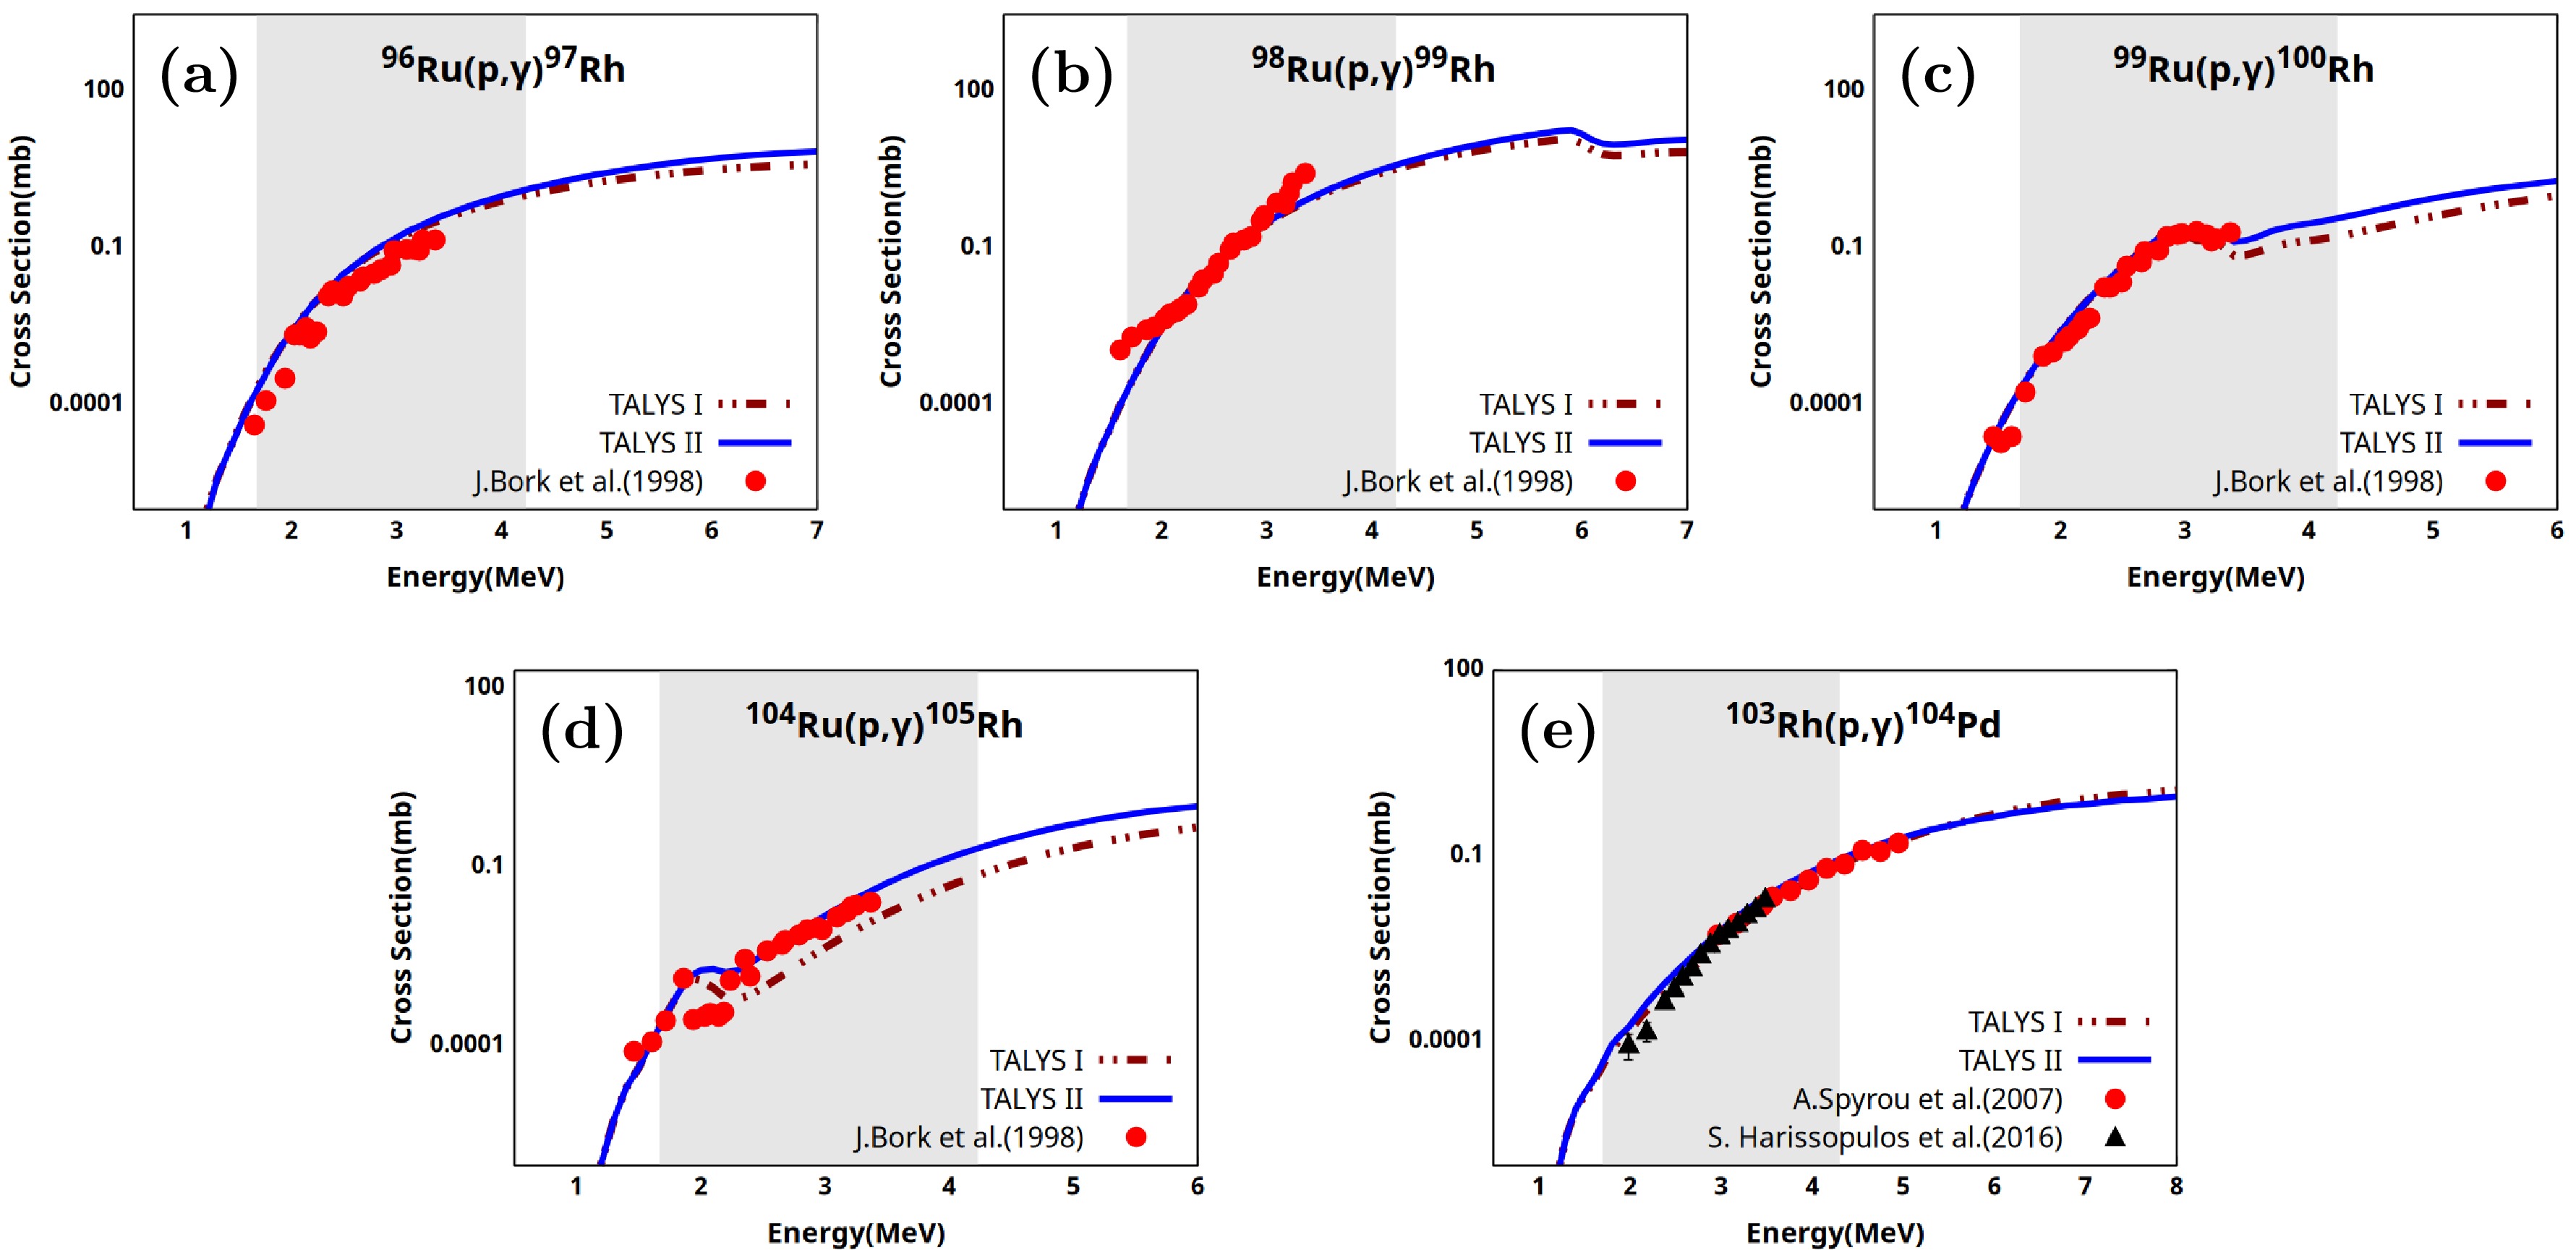
Figure 4. (color online) Comparison of measured (p, γ) cross sections for elements with Z=44−45 with TALYS predictions obtained using the TALYS I (dot-dot-dash) and TALYS II (solid line) parameter sets. The gray shaded areas indicate the Gamow windows for the respective reactions at temperatures of 2−3 GK.
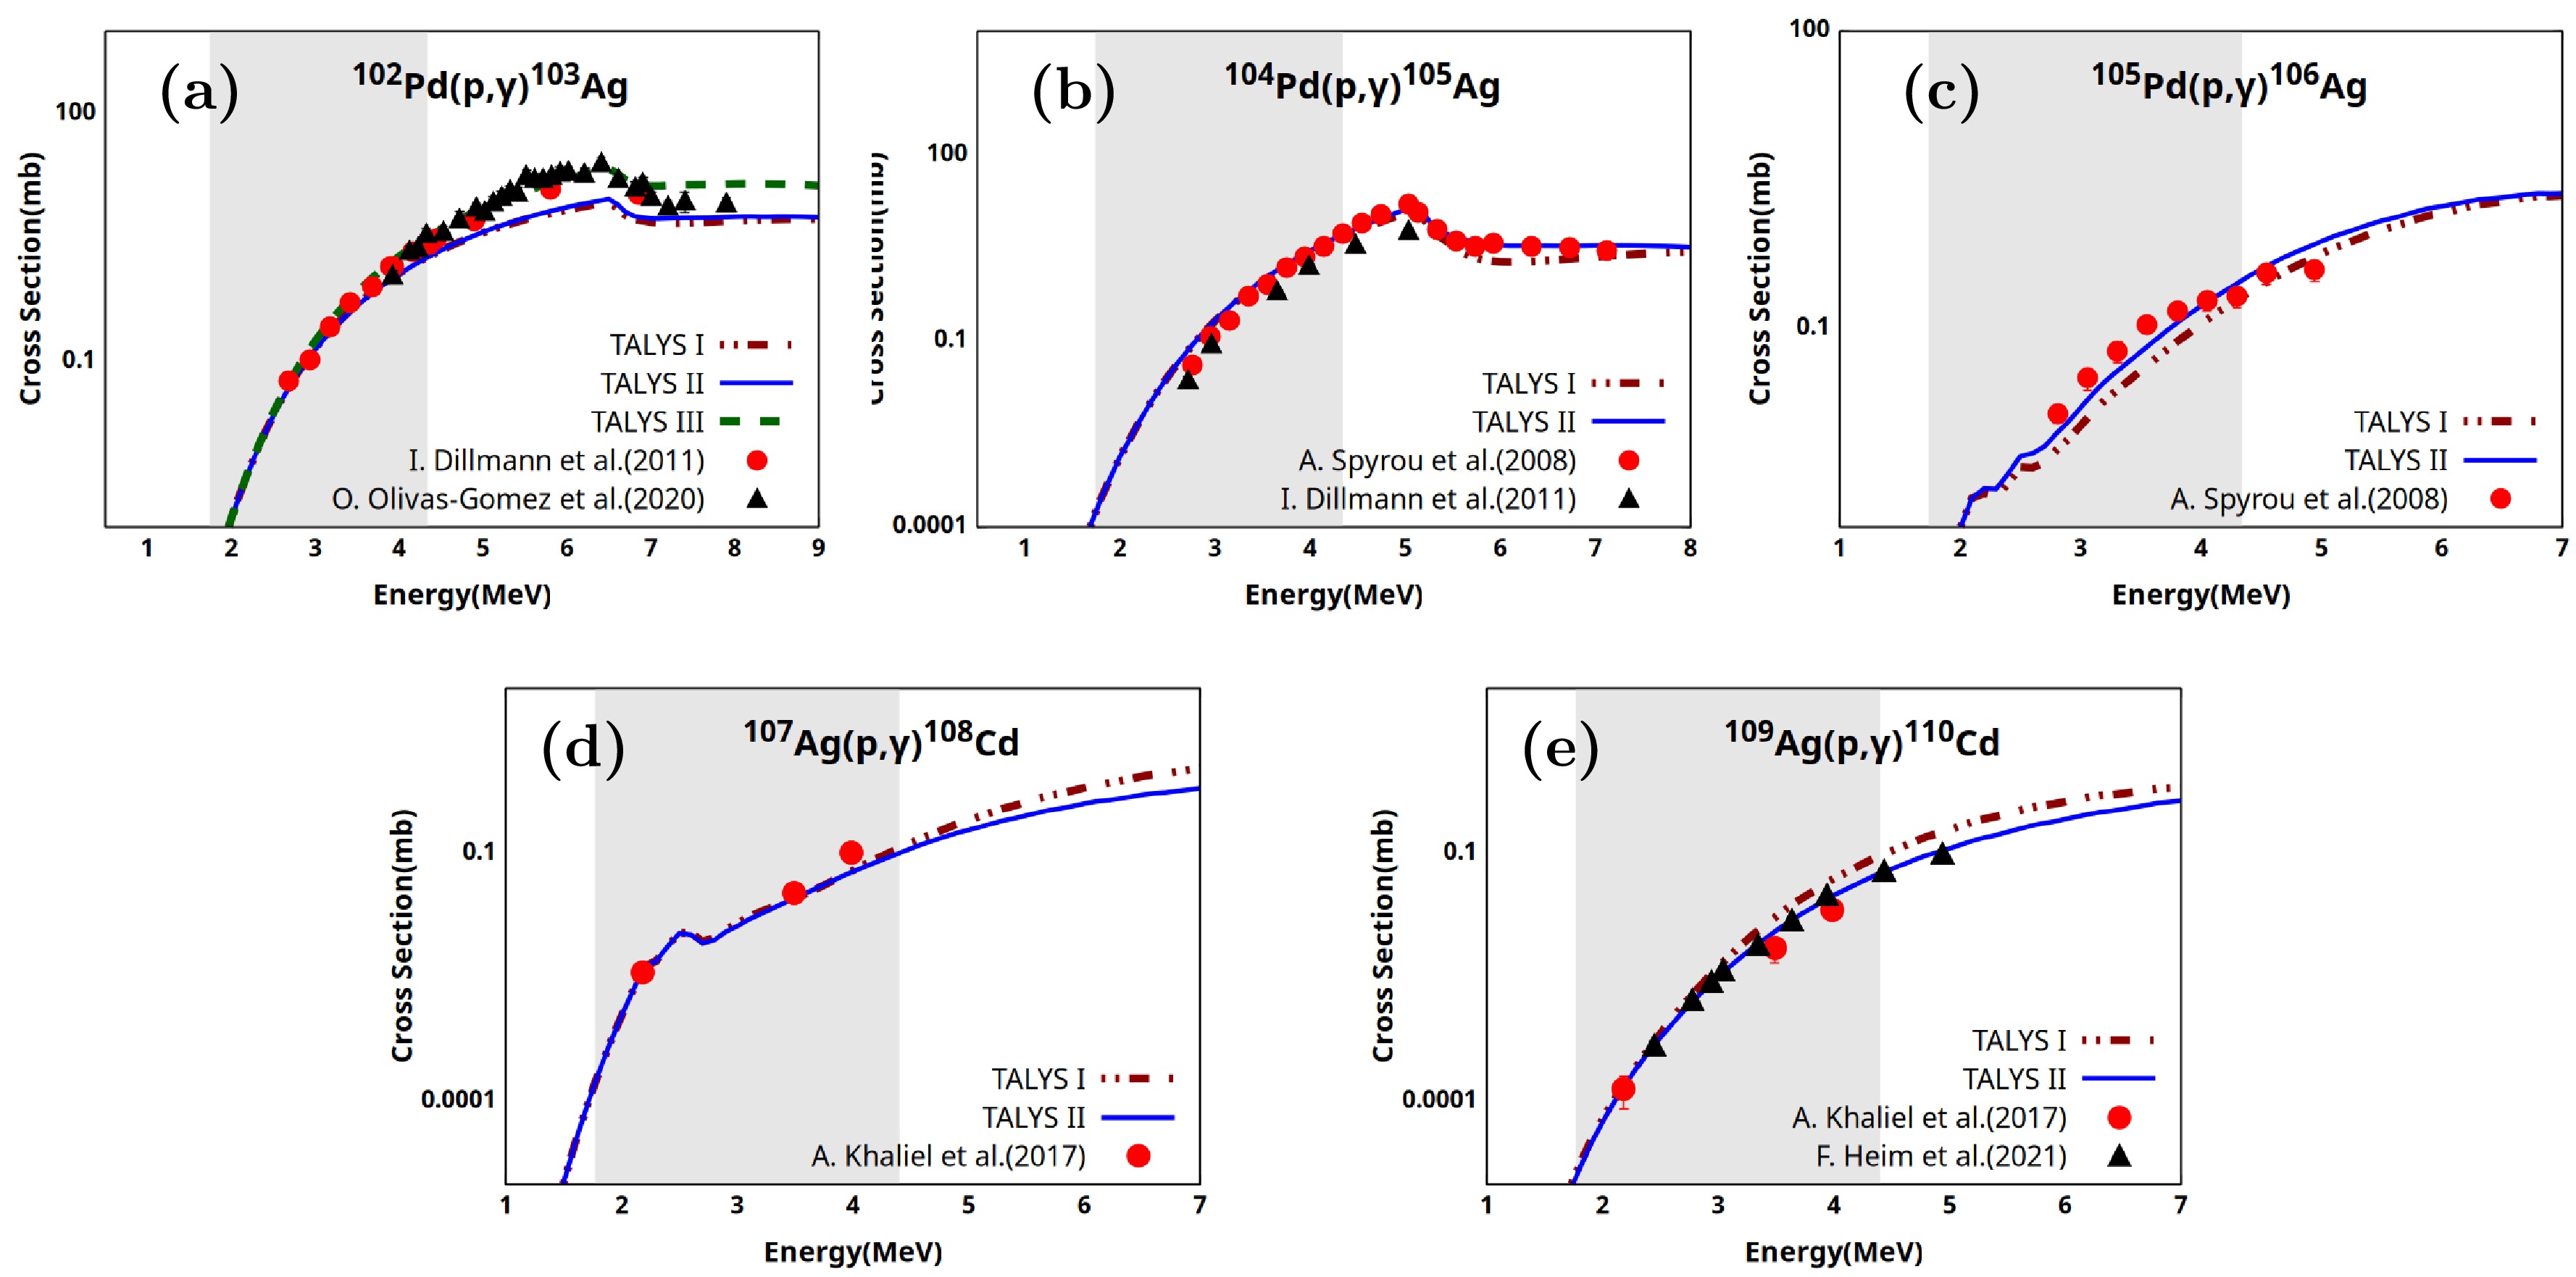
Figure 5. (color online) Experimental (p, γ) reaction cross sections for elements with Z=46−47 are compared with TALYS predictions obtained using the TALYS I (dot–dot–dash) and TALYS II (solid line) parameter sets. The gray shaded area represents the Gamow window for each reaction at temperatures of 2−3 GK.
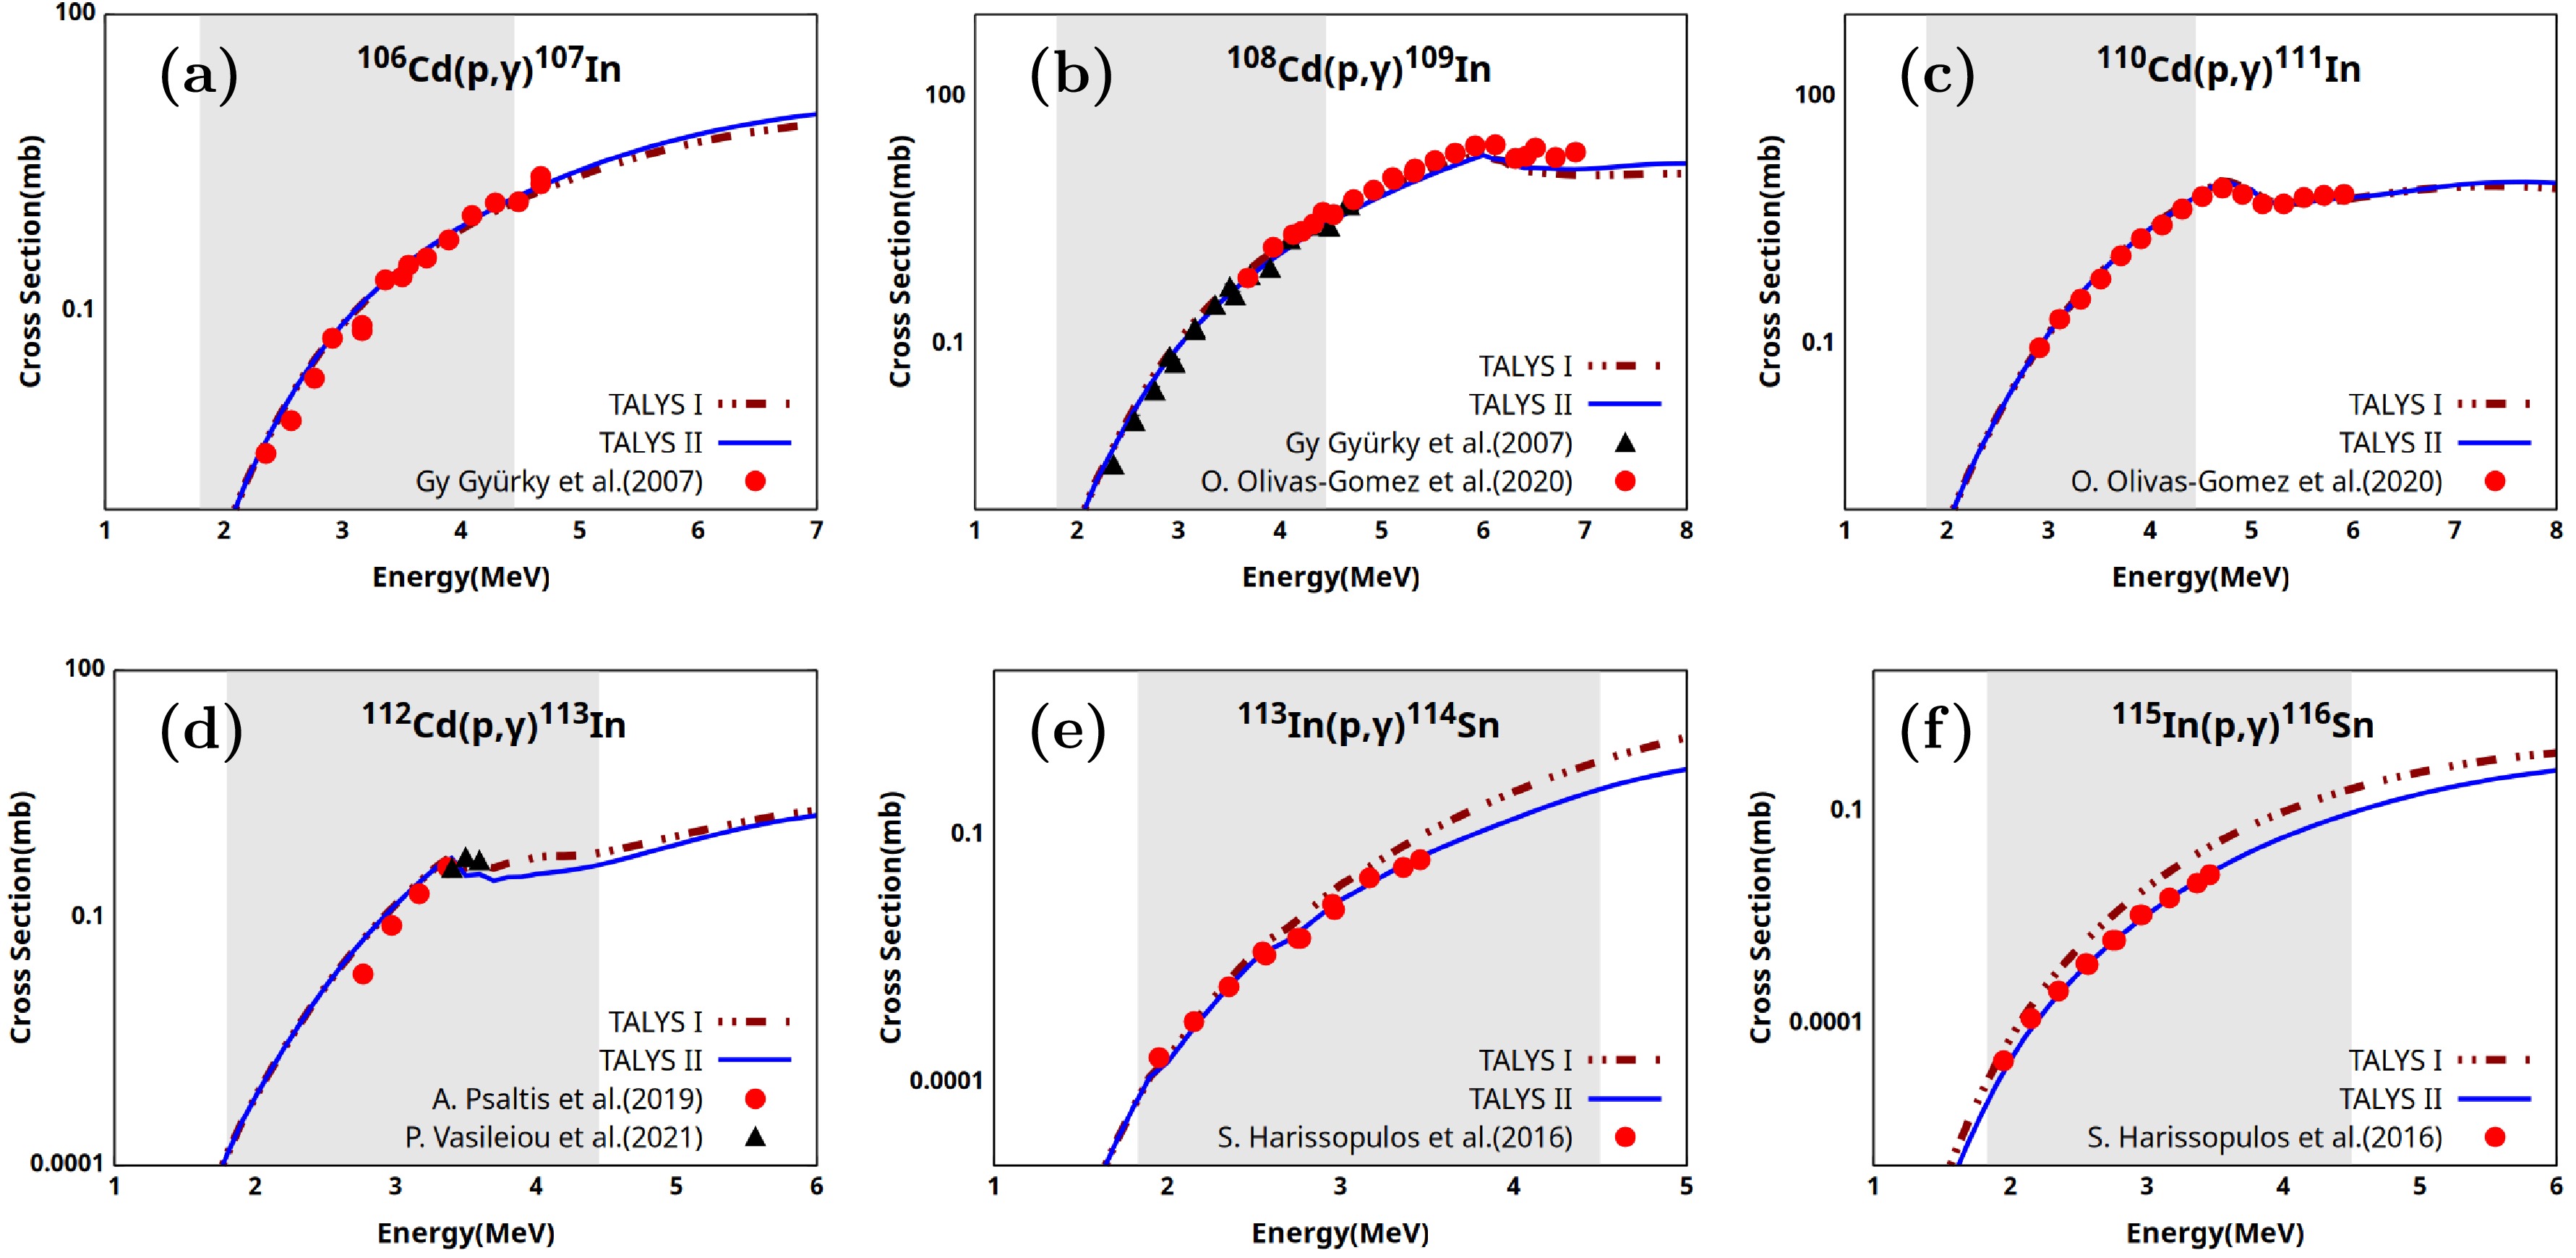
Figure 6. (color online) Comparison of measured cross sections for radiative proton-capture reactions on elements with Z=48−49 with TALYS predictions obtained using the TALYS I (dot–dot–dash) and TALYS II (solid line) parameter sets. The gray shaded area represents the Gamow window for each reaction at temperatures of 2−3 GK.
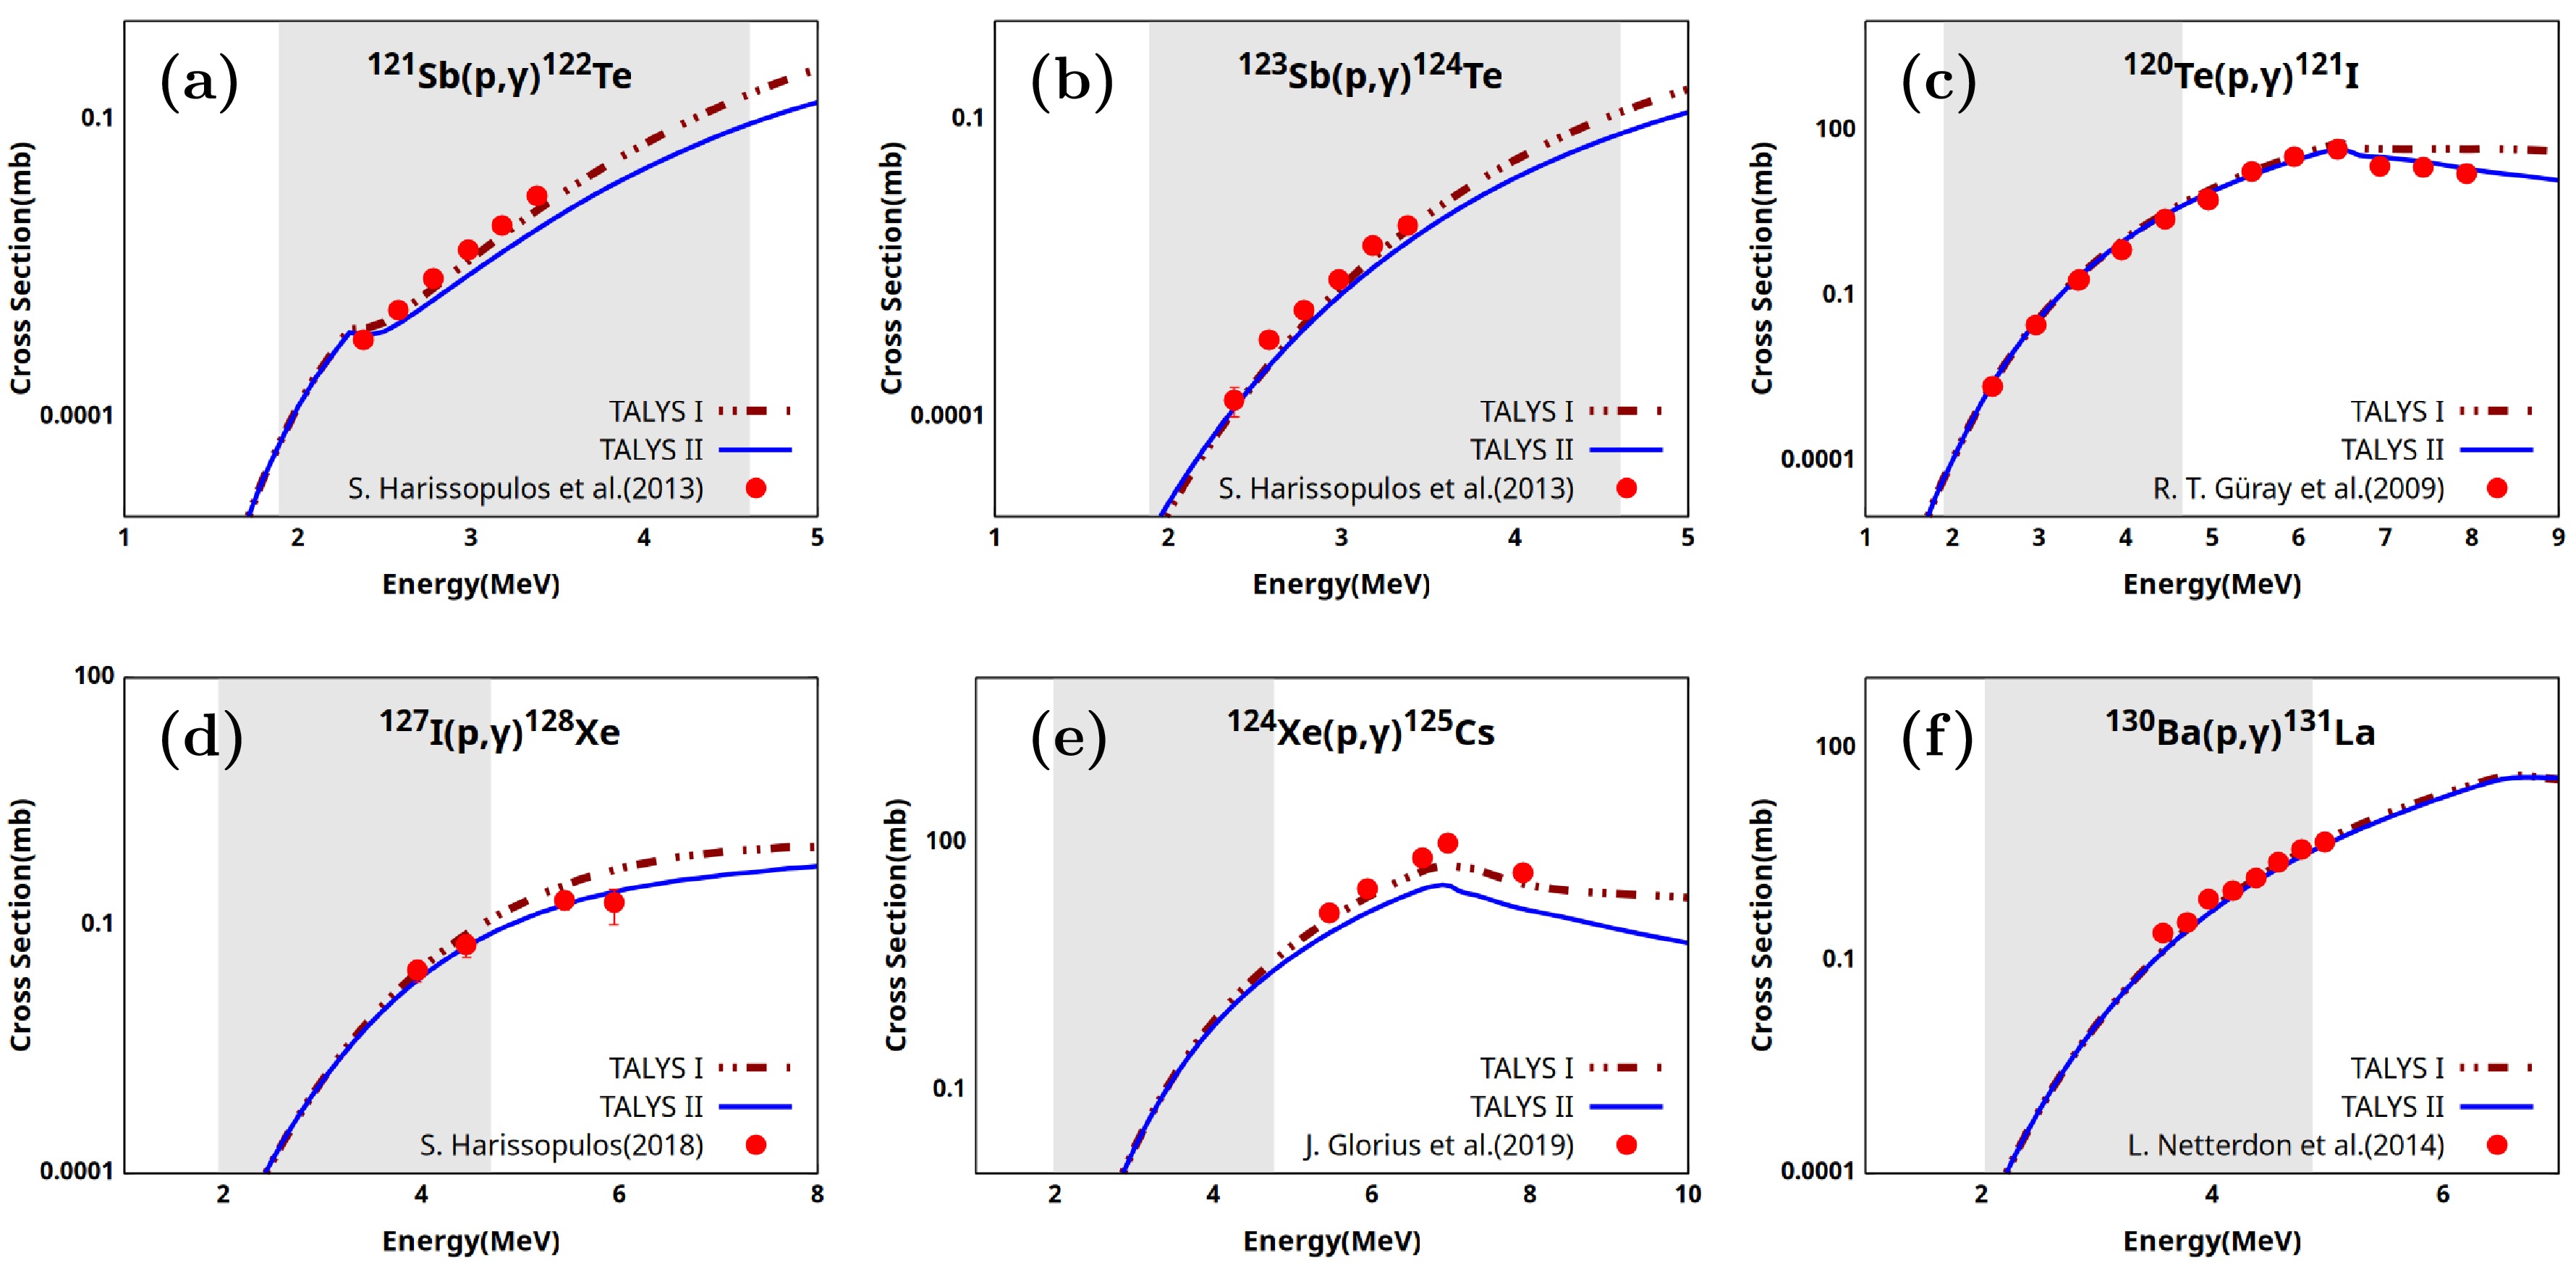
Figure 7. (color online) Comparison of measured proton-capture reaction cross sections for elements with Z=51−56 with TALYS predictions obtained using the TALYS I (dot-dot-dash) and TALYS II (solid line) parameter sets. The gray shaded area represents the Gamow window corresponding to temperatures of 2−3 GK.
-
Having established suitable TALYS model combinations for Sn isotopes, we applied the same model sets to neighboring nuclei in the atomic number range
$ Z=42-56 $ . Our aim was to limit the systematic study to a narrow$ \Delta Z $ region, approximately$ \Delta Z = \pm 6 $ , because no single model combination is expected to reproduce the (p, γ) cross sections across the entire nuclear chart. However, because molybdenum ($ Z=42 $ ) is of astrophysical interest, we also extended the study to molybdenum isotopes.All experimental cross sections used in this analysis were corrected for electron screening effects. The results are presented in Figs. 3, 4, 5, 6, and 7. The gray shaded regions in these figures indicate the corresponding Gamow windows for each reaction over a temperature range of 2−3 GK. For a quantitative assessment of the best model fit, the calculated
$ \chi^2 $ values and relative variances (D) are summarized in Table 3.
Figure 3. (color online) Comparison of the measured cross sections for radiative proton-capture reactions on molybdenum isotopes (
$Z=42 $ ) with TALYS predictions obtained using the TALYS I (dot–dot–dash) and TALYS II (solid line) parameter sets. The gray shaded areas represent the Gamow windows for the respective reactions at temperatures of 2−3 GK.
Figure 4. (color online) Comparison of measured (p, γ) cross sections for elements with Z=44−45 with TALYS predictions obtained using the TALYS I (dot-dot-dash) and TALYS II (solid line) parameter sets. The gray shaded areas indicate the Gamow windows for the respective reactions at temperatures of 2−3 GK.
Figure 5. (color online) Experimental (p, γ) reaction cross sections for elements with Z=46−47 are compared with TALYS predictions obtained using the TALYS I (dot–dot–dash) and TALYS II (solid line) parameter sets. The gray shaded area represents the Gamow window for each reaction at temperatures of 2−3 GK.
Figure 6. (color online) Comparison of measured cross sections for radiative proton-capture reactions on elements with Z=48−49 with TALYS predictions obtained using the TALYS I (dot–dot–dash) and TALYS II (solid line) parameter sets. The gray shaded area represents the Gamow window for each reaction at temperatures of 2−3 GK.
Figure 7. (color online) Comparison of measured proton-capture reaction cross sections for elements with Z=51−56 with TALYS predictions obtained using the TALYS I (dot-dot-dash) and TALYS II (solid line) parameter sets. The gray shaded area represents the Gamow window corresponding to temperatures of 2−3 GK.
-
Having established suitable TALYS model combinations for Sn isotopes, we applied the same model sets to neighboring nuclei in the atomic number range
$ Z=42-56 $ . Our aim was to limit the systematic study to a narrow$ \Delta Z $ region, approximately$ \Delta Z = \pm 6 $ , because no single model combination is expected to reproduce the (p, γ) cross sections across the entire nuclear chart. However, because molybdenum ($ Z=42 $ ) is of astrophysical interest, we also extended the study to molybdenum isotopes.All experimental cross sections used in this analysis were corrected for electron screening effects. The results are presented in Figs. 3, 4, 5, 6, and 7. The gray shaded regions in these figures indicate the corresponding Gamow windows for each reaction over a temperature range of 2−3 GK. For a quantitative assessment of the best model fit, the calculated
$ \chi^2 $ values and relative variances (D) are summarized in Table 3.
Figure 3. (color online) Comparison of the measured cross sections for radiative proton-capture reactions on molybdenum isotopes (
$Z=42 $ ) with TALYS predictions obtained using the TALYS I (dot–dot–dash) and TALYS II (solid line) parameter sets. The gray shaded areas represent the Gamow windows for the respective reactions at temperatures of 2−3 GK.
Figure 4. (color online) Comparison of measured (p, γ) cross sections for elements with Z=44−45 with TALYS predictions obtained using the TALYS I (dot-dot-dash) and TALYS II (solid line) parameter sets. The gray shaded areas indicate the Gamow windows for the respective reactions at temperatures of 2−3 GK.
Figure 5. (color online) Experimental (p, γ) reaction cross sections for elements with Z=46−47 are compared with TALYS predictions obtained using the TALYS I (dot–dot–dash) and TALYS II (solid line) parameter sets. The gray shaded area represents the Gamow window for each reaction at temperatures of 2−3 GK.
Figure 6. (color online) Comparison of measured cross sections for radiative proton-capture reactions on elements with Z=48−49 with TALYS predictions obtained using the TALYS I (dot–dot–dash) and TALYS II (solid line) parameter sets. The gray shaded area represents the Gamow window for each reaction at temperatures of 2−3 GK.
Figure 7. (color online) Comparison of measured proton-capture reaction cross sections for elements with Z=51−56 with TALYS predictions obtained using the TALYS I (dot-dot-dash) and TALYS II (solid line) parameter sets. The gray shaded area represents the Gamow window corresponding to temperatures of 2−3 GK.
-
Having established suitable TALYS model combinations for Sn isotopes, we applied the same model sets to neighboring nuclei in the atomic number range
$ Z=42-56 $ . Our aim was to limit the systematic study to a narrow$ \Delta Z $ region, approximately$ \Delta Z = \pm 6 $ , because no single model combination is expected to reproduce the (p, γ) cross sections across the entire nuclear chart. However, because molybdenum ($ Z=42 $ ) is of astrophysical interest, we also extended the study to molybdenum isotopes.All experimental cross sections used in this analysis were corrected for electron screening effects. The results are presented in Figs. 3, 4, 5, 6, and 7. The gray shaded regions in these figures indicate the corresponding Gamow windows for each reaction over a temperature range of 2−3 GK. For a quantitative assessment of the best model fit, the calculated
$ \chi^2 $ values and relative variances (D) are summarized in Table 3.
Figure 3. (color online) Comparison of the measured cross sections for radiative proton-capture reactions on molybdenum isotopes (
$Z=42 $ ) with TALYS predictions obtained using the TALYS I (dot–dot–dash) and TALYS II (solid line) parameter sets. The gray shaded areas represent the Gamow windows for the respective reactions at temperatures of 2−3 GK.
Figure 4. (color online) Comparison of measured (p, γ) cross sections for elements with Z=44−45 with TALYS predictions obtained using the TALYS I (dot-dot-dash) and TALYS II (solid line) parameter sets. The gray shaded areas indicate the Gamow windows for the respective reactions at temperatures of 2−3 GK.
Figure 5. (color online) Experimental (p, γ) reaction cross sections for elements with Z=46−47 are compared with TALYS predictions obtained using the TALYS I (dot–dot–dash) and TALYS II (solid line) parameter sets. The gray shaded area represents the Gamow window for each reaction at temperatures of 2−3 GK.
Figure 6. (color online) Comparison of measured cross sections for radiative proton-capture reactions on elements with Z=48−49 with TALYS predictions obtained using the TALYS I (dot–dot–dash) and TALYS II (solid line) parameter sets. The gray shaded area represents the Gamow window for each reaction at temperatures of 2−3 GK.
Figure 7. (color online) Comparison of measured proton-capture reaction cross sections for elements with Z=51−56 with TALYS predictions obtained using the TALYS I (dot-dot-dash) and TALYS II (solid line) parameter sets. The gray shaded area represents the Gamow window corresponding to temperatures of 2−3 GK.
-
Having established suitable TALYS model combinations for Sn isotopes, we applied the same model sets to neighboring nuclei in the atomic number range
$ Z=42-56 $ . Our aim was to limit the systematic study to a narrow$ \Delta Z $ region, approximately$ \Delta Z = \pm 6 $ , because no single model combination is expected to reproduce the (p, γ) cross sections across the entire nuclear chart. However, because molybdenum ($ Z=42 $ ) is of astrophysical interest, we also extended the study to molybdenum isotopes.All experimental cross sections used in this analysis were corrected for electron screening effects. The results are presented in Figs. 3, 4, 5, 6, and 7. The gray shaded regions in these figures indicate the corresponding Gamow windows for each reaction over a temperature range of 2−3 GK. For a quantitative assessment of the best model fit, the calculated
$ \chi^2 $ values and relative variances (D) are summarized in Table 3.
Figure 3. (color online) Comparison of the measured cross sections for radiative proton-capture reactions on molybdenum isotopes (
$Z=42 $ ) with TALYS predictions obtained using the TALYS I (dot–dot–dash) and TALYS II (solid line) parameter sets. The gray shaded areas represent the Gamow windows for the respective reactions at temperatures of 2−3 GK.
Figure 4. (color online) Comparison of measured (p, γ) cross sections for elements with Z=44−45 with TALYS predictions obtained using the TALYS I (dot-dot-dash) and TALYS II (solid line) parameter sets. The gray shaded areas indicate the Gamow windows for the respective reactions at temperatures of 2−3 GK.
Figure 5. (color online) Experimental (p, γ) reaction cross sections for elements with Z=46−47 are compared with TALYS predictions obtained using the TALYS I (dot–dot–dash) and TALYS II (solid line) parameter sets. The gray shaded area represents the Gamow window for each reaction at temperatures of 2−3 GK.
Figure 6. (color online) Comparison of measured cross sections for radiative proton-capture reactions on elements with Z=48−49 with TALYS predictions obtained using the TALYS I (dot–dot–dash) and TALYS II (solid line) parameter sets. The gray shaded area represents the Gamow window for each reaction at temperatures of 2−3 GK.
Figure 7. (color online) Comparison of measured proton-capture reaction cross sections for elements with Z=51−56 with TALYS predictions obtained using the TALYS I (dot-dot-dash) and TALYS II (solid line) parameter sets. The gray shaded area represents the Gamow window corresponding to temperatures of 2−3 GK.
-
Molybdenum has two p-nuclei, 92,94Mo, and relatively abundant experimental data are available [55, 56]. The proximity of Mo isotopes to the
$ N=50 $ shell closure, which affects nuclear structure and reaction rates, likely accounts for the large number of measurements on these isotopes. The pivotal role of this region in testing and refining Hauser-Feshbach (HF) statistical models makes it particularly sensitive to nuclear physics input. As shown in Figs. 3(a–g), the cross sections for all Mo isotopes, except those for 94,100Mo, are well described by the TALYS calculations using TALYS II parameters across all measured energies. The cross sections for 94Mo(p, γ)95Tc are better represented by the TALYS I configuration, whereas TALYS II slightly overestimates the data at higher energies. The (p, γ) cross sections for 100Mo are not reproduced by either the TALYS I or TALYS II results. However, because only four data points are available for 100Mo, no definite conclusion can be drawn about the model fit. Further measurements are therefore required for the 100Mo(p, γ)101Tc reaction before a firm conclusion can be reached. The strong agreement between the two experimental datasets [55, 56] for 92,94Mo, especially at low energies, enhances confidence in the measured cross sections and supports the reliability of TALYS for modeling radiative proton capture reactions in this region. -
Molybdenum has two p-nuclei, 92,94Mo, and relatively abundant experimental data are available [55, 56]. The proximity of Mo isotopes to the
$ N=50 $ shell closure, which affects nuclear structure and reaction rates, likely accounts for the large number of measurements on these isotopes. The pivotal role of this region in testing and refining Hauser-Feshbach (HF) statistical models makes it particularly sensitive to nuclear physics input. As shown in Figs. 3(a–g), the cross sections for all Mo isotopes, except those for 94,100Mo, are well described by the TALYS calculations using TALYS II parameters across all measured energies. The cross sections for 94Mo(p, γ)95Tc are better represented by the TALYS I configuration, whereas TALYS II slightly overestimates the data at higher energies. The (p, γ) cross sections for 100Mo are not reproduced by either the TALYS I or TALYS II results. However, because only four data points are available for 100Mo, no definite conclusion can be drawn about the model fit. Further measurements are therefore required for the 100Mo(p, γ)101Tc reaction before a firm conclusion can be reached. The strong agreement between the two experimental datasets [55, 56] for 92,94Mo, especially at low energies, enhances confidence in the measured cross sections and supports the reliability of TALYS for modeling radiative proton capture reactions in this region. -
Molybdenum has two p-nuclei, 92,94Mo, and relatively abundant experimental data are available [55, 56]. The proximity of Mo isotopes to the
$ N=50 $ shell closure, which affects nuclear structure and reaction rates, likely accounts for the large number of measurements on these isotopes. The pivotal role of this region in testing and refining Hauser-Feshbach (HF) statistical models makes it particularly sensitive to nuclear physics input. As shown in Figs. 3(a–g), the cross sections for all Mo isotopes, except those for 94,100Mo, are well described by the TALYS calculations using TALYS II parameters across all measured energies. The cross sections for 94Mo(p, γ)95Tc are better represented by the TALYS I configuration, whereas TALYS II slightly overestimates the data at higher energies. The (p, γ) cross sections for 100Mo are not reproduced by either the TALYS I or TALYS II results. However, because only four data points are available for 100Mo, no definite conclusion can be drawn about the model fit. Further measurements are therefore required for the 100Mo(p, γ)101Tc reaction before a firm conclusion can be reached. The strong agreement between the two experimental datasets [55, 56] for 92,94Mo, especially at low energies, enhances confidence in the measured cross sections and supports the reliability of TALYS for modeling radiative proton capture reactions in this region. -
Molybdenum has two p-nuclei, 92,94Mo, and relatively abundant experimental data are available [55, 56]. The proximity of Mo isotopes to the
$ N=50 $ shell closure, which affects nuclear structure and reaction rates, likely accounts for the large number of measurements on these isotopes. The pivotal role of this region in testing and refining Hauser-Feshbach (HF) statistical models makes it particularly sensitive to nuclear physics input. As shown in Figs. 3(a–g), the cross sections for all Mo isotopes, except those for 94,100Mo, are well described by the TALYS calculations using TALYS II parameters across all measured energies. The cross sections for 94Mo(p, γ)95Tc are better represented by the TALYS I configuration, whereas TALYS II slightly overestimates the data at higher energies. The (p, γ) cross sections for 100Mo are not reproduced by either the TALYS I or TALYS II results. However, because only four data points are available for 100Mo, no definite conclusion can be drawn about the model fit. Further measurements are therefore required for the 100Mo(p, γ)101Tc reaction before a firm conclusion can be reached. The strong agreement between the two experimental datasets [55, 56] for 92,94Mo, especially at low energies, enhances confidence in the measured cross sections and supports the reliability of TALYS for modeling radiative proton capture reactions in this region. -
Molybdenum has two p-nuclei, 92,94Mo, and relatively abundant experimental data are available [55, 56]. The proximity of Mo isotopes to the
$ N=50 $ shell closure, which affects nuclear structure and reaction rates, likely accounts for the large number of measurements on these isotopes. The pivotal role of this region in testing and refining Hauser-Feshbach (HF) statistical models makes it particularly sensitive to nuclear physics input. As shown in Figs. 3(a–g), the cross sections for all Mo isotopes, except those for 94,100Mo, are well described by the TALYS calculations using TALYS II parameters across all measured energies. The cross sections for 94Mo(p, γ)95Tc are better represented by the TALYS I configuration, whereas TALYS II slightly overestimates the data at higher energies. The (p, γ) cross sections for 100Mo are not reproduced by either the TALYS I or TALYS II results. However, because only four data points are available for 100Mo, no definite conclusion can be drawn about the model fit. Further measurements are therefore required for the 100Mo(p, γ)101Tc reaction before a firm conclusion can be reached. The strong agreement between the two experimental datasets [55, 56] for 92,94Mo, especially at low energies, enhances confidence in the measured cross sections and supports the reliability of TALYS for modeling radiative proton capture reactions in this region. -
Among ruthenium isotopes, 96,98Ru are classified as p-nuclei. The (p, γ) cross sections have been measured for four Ru isotopes [57]. For the 96Ru(p, γ)97Rh reaction, TALYS predictions fail to reproduce the measured data with either model combination, as is evident from Fig. 4(a), although the calculated values only slightly overestimate the data. The energy dependence of the measured excitation function for the 98Ru(p, γ)99Rh reaction is not consistent with the TALYS predictions, as shown in Fig. 4(b). Therefore, no definitive conclusion can be drawn for this reaction. More measurements are needed for both reactions within the Gamow window, as only one measurement set is available. As shown in Fig. 4(c, d), TALYS II successfully describes the (p, γ) cross sections for the Ru isotopes 99,104Ru.
-
Among ruthenium isotopes, 96,98Ru are classified as p-nuclei. The (p, γ) cross sections have been measured for four Ru isotopes [57]. For the 96Ru(p, γ)97Rh reaction, TALYS predictions fail to reproduce the measured data with either model combination, as is evident from Fig. 4(a), although the calculated values only slightly overestimate the data. The energy dependence of the measured excitation function for the 98Ru(p, γ)99Rh reaction is not consistent with the TALYS predictions, as shown in Fig. 4(b). Therefore, no definitive conclusion can be drawn for this reaction. More measurements are needed for both reactions within the Gamow window, as only one measurement set is available. As shown in Fig. 4(c, d), TALYS II successfully describes the (p, γ) cross sections for the Ru isotopes 99,104Ru.
-
Among ruthenium isotopes, 96,98Ru are classified as p-nuclei. The (p, γ) cross sections have been measured for four Ru isotopes [57]. For the 96Ru(p, γ)97Rh reaction, TALYS predictions fail to reproduce the measured data with either model combination, as is evident from Fig. 4(a), although the calculated values only slightly overestimate the data. The energy dependence of the measured excitation function for the 98Ru(p, γ)99Rh reaction is not consistent with the TALYS predictions, as shown in Fig. 4(b). Therefore, no definitive conclusion can be drawn for this reaction. More measurements are needed for both reactions within the Gamow window, as only one measurement set is available. As shown in Fig. 4(c, d), TALYS II successfully describes the (p, γ) cross sections for the Ru isotopes 99,104Ru.
-
Among ruthenium isotopes, 96,98Ru are classified as p-nuclei. The (p, γ) cross sections have been measured for four Ru isotopes [57]. For the 96Ru(p, γ)97Rh reaction, TALYS predictions fail to reproduce the measured data with either model combination, as is evident from Fig. 4(a), although the calculated values only slightly overestimate the data. The energy dependence of the measured excitation function for the 98Ru(p, γ)99Rh reaction is not consistent with the TALYS predictions, as shown in Fig. 4(b). Therefore, no definitive conclusion can be drawn for this reaction. More measurements are needed for both reactions within the Gamow window, as only one measurement set is available. As shown in Fig. 4(c, d), TALYS II successfully describes the (p, γ) cross sections for the Ru isotopes 99,104Ru.
-
Among ruthenium isotopes, 96,98Ru are classified as p-nuclei. The (p, γ) cross sections have been measured for four Ru isotopes [57]. For the 96Ru(p, γ)97Rh reaction, TALYS predictions fail to reproduce the measured data with either model combination, as is evident from Fig. 4(a), although the calculated values only slightly overestimate the data. The energy dependence of the measured excitation function for the 98Ru(p, γ)99Rh reaction is not consistent with the TALYS predictions, as shown in Fig. 4(b). Therefore, no definitive conclusion can be drawn for this reaction. More measurements are needed for both reactions within the Gamow window, as only one measurement set is available. As shown in Fig. 4(c, d), TALYS II successfully describes the (p, γ) cross sections for the Ru isotopes 99,104Ru.
-
The cross sections for 103Rh(p, γ)104Pd [66, 73] are well described by the TALYS predictions from both TALYS I and TALYS II, as shown in Fig. 4(e).
-
The cross sections for 103Rh(p, γ)104Pd [66, 73] are well described by the TALYS predictions from both TALYS I and TALYS II, as shown in Fig. 4(e).
-
The cross sections for 103Rh(p, γ)104Pd [66, 73] are well described by the TALYS predictions from both TALYS I and TALYS II, as shown in Fig. 4(e).
-
The cross sections for 103Rh(p, γ)104Pd [66, 73] are well described by the TALYS predictions from both TALYS I and TALYS II, as shown in Fig. 4(e).
-
The cross sections for 103Rh(p, γ)104Pd [66, 73] are well described by the TALYS predictions from both TALYS I and TALYS II, as shown in Fig. 4(e).
-
The next element is palladium, for which (p, γ) cross sections have been measured for four Pd isotopes [58−60]. The Pd isotopic chain includes one p-nucleus, 102Pd, for which TALYS I and TALYS II underpredict the cross sections, as shown in Fig. 5(a). However, the TALYS III set (see Table 2) provides satisfactory agreement with the measured data in this case, as indicated by the
$ \chi^2 $ and D values in Table 3. For 104Pd, the cross sections are fairly well reproduced by TALYS II, as shown in Fig. 5(b). The energy dependence of the cross sections for the reaction 105Pd(p, γ)106Ag shows a trend that does not align with any of the TALYS predictions, as shown in Fig. 5(c). -
The next element is palladium, for which (p, γ) cross sections have been measured for four Pd isotopes [58−60]. The Pd isotopic chain includes one p-nucleus, 102Pd, for which TALYS I and TALYS II underpredict the cross sections, as shown in Fig. 5(a). However, the TALYS III set (see Table 2) provides satisfactory agreement with the measured data in this case, as indicated by the
$ \chi^2 $ and D values in Table 3. For 104Pd, the cross sections are fairly well reproduced by TALYS II, as shown in Fig. 5(b). The energy dependence of the cross sections for the reaction 105Pd(p, γ)106Ag shows a trend that does not align with any of the TALYS predictions, as shown in Fig. 5(c). -
The next element is palladium, for which (p, γ) cross sections have been measured for four Pd isotopes [58−60]. The Pd isotopic chain includes one p-nucleus, 102Pd, for which TALYS I and TALYS II underpredict the cross sections, as shown in Fig. 5(a). However, the TALYS III set (see Table 2) provides satisfactory agreement with the measured data in this case, as indicated by the
$ \chi^2 $ and D values in Table 3. For 104Pd, the cross sections are fairly well reproduced by TALYS II, as shown in Fig. 5(b). The energy dependence of the cross sections for the reaction 105Pd(p, γ)106Ag shows a trend that does not align with any of the TALYS predictions, as shown in Fig. 5(c). -
The next element is palladium, for which (p, γ) cross sections have been measured for four Pd isotopes [58−60]. The Pd isotopic chain includes one p-nucleus, 102Pd, for which TALYS I and TALYS II underpredict the cross sections, as shown in Fig. 5(a). However, the TALYS III set (see Table 2) provides satisfactory agreement with the measured data in this case, as indicated by the
$ \chi^2 $ and D values in Table 3. For 104Pd, the cross sections are fairly well reproduced by TALYS II, as shown in Fig. 5(b). The energy dependence of the cross sections for the reaction 105Pd(p, γ)106Ag shows a trend that does not align with any of the TALYS predictions, as shown in Fig. 5(c). -
The next element is palladium, for which (p, γ) cross sections have been measured for four Pd isotopes [58−60]. The Pd isotopic chain includes one p-nucleus, 102Pd, for which TALYS I and TALYS II underpredict the cross sections, as shown in Fig. 5(a). However, the TALYS III set (see Table 2) provides satisfactory agreement with the measured data in this case, as indicated by the
$ \chi^2 $ and D values in Table 3. For 104Pd, the cross sections are fairly well reproduced by TALYS II, as shown in Fig. 5(b). The energy dependence of the cross sections for the reaction 105Pd(p, γ)106Ag shows a trend that does not align with any of the TALYS predictions, as shown in Fig. 5(c). -
Silver consists of two stable isotopes, 107,109Ag. The cross sections for radiative proton capture on Ag isotopes have been measured in Refs. [61, 62]. The experimental cross sections for the 107,109Ag(p, γ)108,110Cd reactions are reasonably well reproduced by the TALYS II model set, as shown in Fig. 5(d, e). For 107Ag, only three data points are available; therefore, the existing dataset is insufficient for firm conclusions, underscoring the need for additional 107Ag(p, γ)108Cd measurements.
-
Silver consists of two stable isotopes, 107,109Ag. The cross sections for radiative proton capture on Ag isotopes have been measured in Refs. [61, 62]. The experimental cross sections for the 107,109Ag(p, γ)108,110Cd reactions are reasonably well reproduced by the TALYS II model set, as shown in Fig. 5(d, e). For 107Ag, only three data points are available; therefore, the existing dataset is insufficient for firm conclusions, underscoring the need for additional 107Ag(p, γ)108Cd measurements.
-
Silver consists of two stable isotopes, 107,109Ag. The cross sections for radiative proton capture on Ag isotopes have been measured in Refs. [61, 62]. The experimental cross sections for the 107,109Ag(p, γ)108,110Cd reactions are reasonably well reproduced by the TALYS II model set, as shown in Fig. 5(d, e). For 107Ag, only three data points are available; therefore, the existing dataset is insufficient for firm conclusions, underscoring the need for additional 107Ag(p, γ)108Cd measurements.
-
Silver consists of two stable isotopes, 107,109Ag. The cross sections for radiative proton capture on Ag isotopes have been measured in Refs. [61, 62]. The experimental cross sections for the 107,109Ag(p, γ)108,110Cd reactions are reasonably well reproduced by the TALYS II model set, as shown in Fig. 5(d, e). For 107Ag, only three data points are available; therefore, the existing dataset is insufficient for firm conclusions, underscoring the need for additional 107Ag(p, γ)108Cd measurements.
-
Silver consists of two stable isotopes, 107,109Ag. The cross sections for radiative proton capture on Ag isotopes have been measured in Refs. [61, 62]. The experimental cross sections for the 107,109Ag(p, γ)108,110Cd reactions are reasonably well reproduced by the TALYS II model set, as shown in Fig. 5(d, e). For 107Ag, only three data points are available; therefore, the existing dataset is insufficient for firm conclusions, underscoring the need for additional 107Ag(p, γ)108Cd measurements.
-
Among the eight cadmium isotopes, two, 106,108Cd, are classified as p-nuclei. The (p, γ) reaction cross sections have been measured for the isotopes 106,108,110,112Cd [59, 63−65]. The TALYS II model describes all the measured cross sections well, except for 112Cd, as shown in Figs. 6(a)–(d). Both TALYS I and TALYS II calculations reproduce the general trend of the experimental 112Cd(p, γ)113In cross sections. However, TALYS II shows slightly better agreement with the data in the measured energy range, whereas TALYS I tends to marginally overestimate the cross section at higher energies. Only a few measured cross sections are available for this reaction, and they are restricted to a narrow energy region. Therefore, additional measurements, at least covering the Gamow window region, are needed before any definitive conclusions can be drawn about the model combinations.
-
Among the eight cadmium isotopes, two, 106,108Cd, are classified as p-nuclei. The (p, γ) reaction cross sections have been measured for the isotopes 106,108,110,112Cd [59, 63−65]. The TALYS II model describes all the measured cross sections well, except for 112Cd, as shown in Figs. 6(a)–(d). Both TALYS I and TALYS II calculations reproduce the general trend of the experimental 112Cd(p, γ)113In cross sections. However, TALYS II shows slightly better agreement with the data in the measured energy range, whereas TALYS I tends to marginally overestimate the cross section at higher energies. Only a few measured cross sections are available for this reaction, and they are restricted to a narrow energy region. Therefore, additional measurements, at least covering the Gamow window region, are needed before any definitive conclusions can be drawn about the model combinations.
-
Among the eight cadmium isotopes, two, 106,108Cd, are classified as p-nuclei. The (p, γ) reaction cross sections have been measured for the isotopes 106,108,110,112Cd [59, 63−65]. The TALYS II model describes all the measured cross sections well, except for 112Cd, as shown in Figs. 6(a)–(d). Both TALYS I and TALYS II calculations reproduce the general trend of the experimental 112Cd(p, γ)113In cross sections. However, TALYS II shows slightly better agreement with the data in the measured energy range, whereas TALYS I tends to marginally overestimate the cross section at higher energies. Only a few measured cross sections are available for this reaction, and they are restricted to a narrow energy region. Therefore, additional measurements, at least covering the Gamow window region, are needed before any definitive conclusions can be drawn about the model combinations.
-
Among the eight cadmium isotopes, two, 106,108Cd, are classified as p-nuclei. The (p, γ) reaction cross sections have been measured for the isotopes 106,108,110,112Cd [59, 63−65]. The TALYS II model describes all the measured cross sections well, except for 112Cd, as shown in Figs. 6(a)–(d). Both TALYS I and TALYS II calculations reproduce the general trend of the experimental 112Cd(p, γ)113In cross sections. However, TALYS II shows slightly better agreement with the data in the measured energy range, whereas TALYS I tends to marginally overestimate the cross section at higher energies. Only a few measured cross sections are available for this reaction, and they are restricted to a narrow energy region. Therefore, additional measurements, at least covering the Gamow window region, are needed before any definitive conclusions can be drawn about the model combinations.
-
Among the eight cadmium isotopes, two, 106,108Cd, are classified as p-nuclei. The (p, γ) reaction cross sections have been measured for the isotopes 106,108,110,112Cd [59, 63−65]. The TALYS II model describes all the measured cross sections well, except for 112Cd, as shown in Figs. 6(a)–(d). Both TALYS I and TALYS II calculations reproduce the general trend of the experimental 112Cd(p, γ)113In cross sections. However, TALYS II shows slightly better agreement with the data in the measured energy range, whereas TALYS I tends to marginally overestimate the cross section at higher energies. Only a few measured cross sections are available for this reaction, and they are restricted to a narrow energy region. Therefore, additional measurements, at least covering the Gamow window region, are needed before any definitive conclusions can be drawn about the model combinations.
-
The two neighboring elements of Sn are indium and antimony. Both elements have two isotopes each, and (p, γ) cross-section measurements have been reported for both isotopes of each nucleus: 113,115In [66] and 121,123Sb [67]. The nuclei 113In and 115Sn are the two odd-A p-nuclei, and their origin remains a long-standing puzzle in nuclear astrophysics. The TALYS II model adequately describes the (p, γ) cross sections for the 113,115In isotopes, as shown in Figs. 6(e, f). However, for Sb, Figs. 7(a, b) show that the TALYS I (default) model settings reproduce the cross sections for (p, γ) reactions on 121,123Sb better than TALYS II. The TALYS II model slightly underestimates the cross sections while still accurately capturing the energy dependence of the excitation function.
-
The two neighboring elements of Sn are indium and antimony. Both elements have two isotopes each, and (p, γ) cross-section measurements have been reported for both isotopes of each nucleus: 113,115In [66] and 121,123Sb [67]. The nuclei 113In and 115Sn are the two odd-A p-nuclei, and their origin remains a long-standing puzzle in nuclear astrophysics. The TALYS II model adequately describes the (p, γ) cross sections for the 113,115In isotopes, as shown in Figs. 6(e, f). However, for Sb, Figs. 7(a, b) show that the TALYS I (default) model settings reproduce the cross sections for (p, γ) reactions on 121,123Sb better than TALYS II. The TALYS II model slightly underestimates the cross sections while still accurately capturing the energy dependence of the excitation function.
-
The two neighboring elements of Sn are indium and antimony. Both elements have two isotopes each, and (p, γ) cross-section measurements have been reported for both isotopes of each nucleus: 113,115In [66] and 121,123Sb [67]. The nuclei 113In and 115Sn are the two odd-A p-nuclei, and their origin remains a long-standing puzzle in nuclear astrophysics. The TALYS II model adequately describes the (p, γ) cross sections for the 113,115In isotopes, as shown in Figs. 6(e, f). However, for Sb, Figs. 7(a, b) show that the TALYS I (default) model settings reproduce the cross sections for (p, γ) reactions on 121,123Sb better than TALYS II. The TALYS II model slightly underestimates the cross sections while still accurately capturing the energy dependence of the excitation function.
-
The two neighboring elements of Sn are indium and antimony. Both elements have two isotopes each, and (p, γ) cross-section measurements have been reported for both isotopes of each nucleus: 113,115In [66] and 121,123Sb [67]. The nuclei 113In and 115Sn are the two odd-A p-nuclei, and their origin remains a long-standing puzzle in nuclear astrophysics. The TALYS II model adequately describes the (p, γ) cross sections for the 113,115In isotopes, as shown in Figs. 6(e, f). However, for Sb, Figs. 7(a, b) show that the TALYS I (default) model settings reproduce the cross sections for (p, γ) reactions on 121,123Sb better than TALYS II. The TALYS II model slightly underestimates the cross sections while still accurately capturing the energy dependence of the excitation function.
-
The two neighboring elements of Sn are indium and antimony. Both elements have two isotopes each, and (p, γ) cross-section measurements have been reported for both isotopes of each nucleus: 113,115In [66] and 121,123Sb [67]. The nuclei 113In and 115Sn are the two odd-A p-nuclei, and their origin remains a long-standing puzzle in nuclear astrophysics. The TALYS II model adequately describes the (p, γ) cross sections for the 113,115In isotopes, as shown in Figs. 6(e, f). However, for Sb, Figs. 7(a, b) show that the TALYS I (default) model settings reproduce the cross sections for (p, γ) reactions on 121,123Sb better than TALYS II. The TALYS II model slightly underestimates the cross sections while still accurately capturing the energy dependence of the excitation function.
-
Tellurium has eight isotopes, one of which, 120Te, is a p-nucleus. Cross-section measurements for 120Te(p, γ) have been reported [68]. The measured cross sections for 120Te are reproduced reasonably well by TALYS using the TALYS II model combination, as shown in Fig. 7(c).
-
Tellurium has eight isotopes, one of which, 120Te, is a p-nucleus. Cross-section measurements for 120Te(p, γ) have been reported [68]. The measured cross sections for 120Te are reproduced reasonably well by TALYS using the TALYS II model combination, as shown in Fig. 7(c).
-
Tellurium has eight isotopes, one of which, 120Te, is a p-nucleus. Cross-section measurements for 120Te(p, γ) have been reported [68]. The measured cross sections for 120Te are reproduced reasonably well by TALYS using the TALYS II model combination, as shown in Fig. 7(c).
-
Tellurium has eight isotopes, one of which, 120Te, is a p-nucleus. Cross-section measurements for 120Te(p, γ) have been reported [68]. The measured cross sections for 120Te are reproduced reasonably well by TALYS using the TALYS II model combination, as shown in Fig. 7(c).
-
Tellurium has eight isotopes, one of which, 120Te, is a p-nucleus. Cross-section measurements for 120Te(p, γ) have been reported [68]. The measured cross sections for 120Te are reproduced reasonably well by TALYS using the TALYS II model combination, as shown in Fig. 7(c).
-
The excitation functions for the (p, γ) reactions on isotopes of I, Xe, and Ba are presented in Figs. 7(d–f). As shown in the figures, the TALYS II model set underpredicts the (p, γ) cross sections for 124Xe [70], whereas calculations using TALYS I agree well with the experimental data. Conversely, the TALYS II predictions reproduce the measured cross sections for 127I [69] and 130Ba [71] fairly well. Among these nuclei, 124Xe and 130Ba are p-nuclei, and the Gamow window is partially covered for 130Ba. For 124Xe, no experimental cross-section data are available within the Gamow window. Therefore, cross-section measurements are needed for the 124Xe(p, γ)125Cs reaction covering the Gamow-window region. Similarly, additional measurements of the 127I(p, γ)128Xe reaction cross sections could help support a conclusive assessment of the TALYS model choice.
-
The excitation functions for the (p, γ) reactions on isotopes of I, Xe, and Ba are presented in Figs. 7(d–f). As shown in the figures, the TALYS II model set underpredicts the (p, γ) cross sections for 124Xe [70], whereas calculations using TALYS I agree well with the experimental data. Conversely, the TALYS II predictions reproduce the measured cross sections for 127I [69] and 130Ba [71] fairly well. Among these nuclei, 124Xe and 130Ba are p-nuclei, and the Gamow window is partially covered for 130Ba. For 124Xe, no experimental cross-section data are available within the Gamow window. Therefore, cross-section measurements are needed for the 124Xe(p, γ)125Cs reaction covering the Gamow-window region. Similarly, additional measurements of the 127I(p, γ)128Xe reaction cross sections could help support a conclusive assessment of the TALYS model choice.
-
The excitation functions for the (p, γ) reactions on isotopes of I, Xe, and Ba are presented in Figs. 7(d–f). As shown in the figures, the TALYS II model set underpredicts the (p, γ) cross sections for 124Xe [70], whereas calculations using TALYS I agree well with the experimental data. Conversely, the TALYS II predictions reproduce the measured cross sections for 127I [69] and 130Ba [71] fairly well. Among these nuclei, 124Xe and 130Ba are p-nuclei, and the Gamow window is partially covered for 130Ba. For 124Xe, no experimental cross-section data are available within the Gamow window. Therefore, cross-section measurements are needed for the 124Xe(p, γ)125Cs reaction covering the Gamow-window region. Similarly, additional measurements of the 127I(p, γ)128Xe reaction cross sections could help support a conclusive assessment of the TALYS model choice.
-
The excitation functions for the (p, γ) reactions on isotopes of I, Xe, and Ba are presented in Figs. 7(d–f). As shown in the figures, the TALYS II model set underpredicts the (p, γ) cross sections for 124Xe [70], whereas calculations using TALYS I agree well with the experimental data. Conversely, the TALYS II predictions reproduce the measured cross sections for 127I [69] and 130Ba [71] fairly well. Among these nuclei, 124Xe and 130Ba are p-nuclei, and the Gamow window is partially covered for 130Ba. For 124Xe, no experimental cross-section data are available within the Gamow window. Therefore, cross-section measurements are needed for the 124Xe(p, γ)125Cs reaction covering the Gamow-window region. Similarly, additional measurements of the 127I(p, γ)128Xe reaction cross sections could help support a conclusive assessment of the TALYS model choice.
-
The excitation functions for the (p, γ) reactions on isotopes of I, Xe, and Ba are presented in Figs. 7(d–f). As shown in the figures, the TALYS II model set underpredicts the (p, γ) cross sections for 124Xe [70], whereas calculations using TALYS I agree well with the experimental data. Conversely, the TALYS II predictions reproduce the measured cross sections for 127I [69] and 130Ba [71] fairly well. Among these nuclei, 124Xe and 130Ba are p-nuclei, and the Gamow window is partially covered for 130Ba. For 124Xe, no experimental cross-section data are available within the Gamow window. Therefore, cross-section measurements are needed for the 124Xe(p, γ)125Cs reaction covering the Gamow-window region. Similarly, additional measurements of the 127I(p, γ)128Xe reaction cross sections could help support a conclusive assessment of the TALYS model choice.
-
The primary objective of the present work was to assess the predictive capability of the updated TALYS nuclear reaction code (version 2.0) by comparing experimental Sn(p, γ) cross sections with TALYS predictions obtained using different combinations of nuclear input models. The measurements were also compared with the NON-SMOKER (web) cross-section database. The TALYS model combinations that best reproduced the Sn(p, γ) excitation functions were subsequently used to evaluate their applicability to (p, γ) reactions on neighboring nuclei in the atomic number range
$ Z=42-56 $ .All experimental (p, γ) cross sections considered in this work were corrected for electron-screening effects to obtain bare-nucleus values appropriate for astrophysical applications. A systematic comparison was then performed using seven different TALYS model combinations (TALYS I–VII), incorporating various prescriptions for nuclear level density (NLD), photon strength function (PSF), and optical model potential (OMP). Among these, the TALYS VI model set, which employs experimentally constrained NLD and PSF parameters derived from recent systematics for Sn isotopes, was found to reproduce the measured Sn(p, γ)Sb cross sections and S-factors remarkably well. This result demonstrates the importance of incorporating locally constrained nuclear-structure information into statistical model calculations.
However, based on the overall agreement with the Sn data, the TALYS predictions obtained using the theoretical TALYS II model set were found to be very close to those obtained with the experimentally constrained parameters in the TALYS VI model combination. For a globally predictive framework, reliance on experimentally constrained parameters is not always feasible, especially across a wide range of nuclei. Therefore, a comprehensive evaluation based on both visual comparison and quantitative analysis (
$ \chi^2 $ and relative variance D) was carried out in this work using different theoretical model combinations, and TALYS II was found to be the most reliable set overall. This model set consistently reproduced the experimental cross sections and S-factors for all the Sn(p, γ)Sb reactions, except for the 119Sn(p, γ)120Sb reaction.The validated TALYS II model set and the default TALYS I option were subsequently applied to a broader set of 34 (p, γ) reactions on neighboring nuclei in the atomic number range
$ Z=42-56 $ . Among these, 23 reactions are reproduced well or reasonably well using the TALYS II model combination, demonstrating its strong predictive capability. Four reactions, namely 94Mo(p, γ)95Tc, 121,123Sb(p, γ)122,124Te, and 124Xe(p, γ)125Cs, are better described by the default TALYS I model, while two reactions (119Sn(p, γ)120Sb and 102Pd(p, γ)103Ag) are satisfactorily described only by the TALYS III model set. For five reactions involving the 100Mo, 96,98Ru, 105Pd, and 112Cd isotopes, none of the employed model combinations reproduced the experimental data satisfactorily. This study indicates that more extensive measurements are required, particularly for reactions such as 100Mo(p, γ)101Tc, 96Ru(p, γ)97Rh, 98Ru(p, γ)99Rh, 105Pd(p, γ)106Ag, 107Ag(p, γ)108Cd, 112Cd(p, γ)113In, and 124Xe(p, γ)125Cs.Both TALYS I and TALYS II employ the same PSF, namely the SMLO model, indicating that this PSF model provides an effective description of γ-ray emission in radiative proton-capture reactions in the Sn region. This observation is consistent with earlier findings reported in the literature by Koning et al. [14]. By contrast, the NON-SMOKER predictions for Sn isotopes systematically underestimate the experimental cross sections, whereas the TALYS calculations show better overall agreement with the measured data.
In general, the TALYS II model set may therefore be regarded as a useful initial approach for predicting (p, γ) cross sections for nuclei in the region
$ Z=42-56 $ , particularly for reactions where measurements are difficult or unavailable. Although it does not provide a perfect description in all cases, it yields a reliable level of agreement between experimental and theoretical cross sections over a broad range of nuclei. At the same time, the results clearly indicate that no single global parameter set can accurately describe all isotopes, even within the same isotopic chain, thus highlighting the need for further refinement of nuclear input models.Finally, this study highlights the critical role of high-quality experimental data in constraining and validating statistical model calculations used in p-process nucleosynthesis studies. Because reaction networks involve a sensitive balance between production and destruction pathways, precise (p, γ) cross sections with reduced uncertainties are essential. Continued experimental efforts are therefore imperative to expand the existing database and improve the reliability of theoretical predictions used in astrophysical reaction-rate calculations.
-
The primary objective of the present work was to assess the predictive capability of the updated TALYS nuclear reaction code (version 2.0) by comparing experimental Sn(p, γ) cross sections with TALYS predictions obtained using different combinations of nuclear input models. The measurements were also compared with the NON-SMOKER (web) cross-section database. The TALYS model combinations that best reproduced the Sn(p, γ) excitation functions were subsequently used to evaluate their applicability to (p, γ) reactions on neighboring nuclei in the atomic number range
$ Z=42-56 $ .All experimental (p, γ) cross sections considered in this work were corrected for electron-screening effects to obtain bare-nucleus values appropriate for astrophysical applications. A systematic comparison was then performed using seven different TALYS model combinations (TALYS I–VII), incorporating various prescriptions for nuclear level density (NLD), photon strength function (PSF), and optical model potential (OMP). Among these, the TALYS VI model set, which employs experimentally constrained NLD and PSF parameters derived from recent systematics for Sn isotopes, was found to reproduce the measured Sn(p, γ)Sb cross sections and S-factors remarkably well. This result demonstrates the importance of incorporating locally constrained nuclear-structure information into statistical model calculations.
However, based on the overall agreement with the Sn data, the TALYS predictions obtained using the theoretical TALYS II model set were found to be very close to those obtained with the experimentally constrained parameters in the TALYS VI model combination. For a globally predictive framework, reliance on experimentally constrained parameters is not always feasible, especially across a wide range of nuclei. Therefore, a comprehensive evaluation based on both visual comparison and quantitative analysis (
$ \chi^2 $ and relative variance D) was carried out in this work using different theoretical model combinations, and TALYS II was found to be the most reliable set overall. This model set consistently reproduced the experimental cross sections and S-factors for all the Sn(p, γ)Sb reactions, except for the 119Sn(p, γ)120Sb reaction.The validated TALYS II model set and the default TALYS I option were subsequently applied to a broader set of 34 (p, γ) reactions on neighboring nuclei in the atomic number range
$ Z=42-56 $ . Among these, 23 reactions are reproduced well or reasonably well using the TALYS II model combination, demonstrating its strong predictive capability. Four reactions, namely 94Mo(p, γ)95Tc, 121,123Sb(p, γ)122,124Te, and 124Xe(p, γ)125Cs, are better described by the default TALYS I model, while two reactions (119Sn(p, γ)120Sb and 102Pd(p, γ)103Ag) are satisfactorily described only by the TALYS III model set. For five reactions involving the 100Mo, 96,98Ru, 105Pd, and 112Cd isotopes, none of the employed model combinations reproduced the experimental data satisfactorily. This study indicates that more extensive measurements are required, particularly for reactions such as 100Mo(p, γ)101Tc, 96Ru(p, γ)97Rh, 98Ru(p, γ)99Rh, 105Pd(p, γ)106Ag, 107Ag(p, γ)108Cd, 112Cd(p, γ)113In, and 124Xe(p, γ)125Cs.Both TALYS I and TALYS II employ the same PSF, namely the SMLO model, indicating that this PSF model provides an effective description of γ-ray emission in radiative proton-capture reactions in the Sn region. This observation is consistent with earlier findings reported in the literature by Koning et al. [14]. By contrast, the NON-SMOKER predictions for Sn isotopes systematically underestimate the experimental cross sections, whereas the TALYS calculations show better overall agreement with the measured data.
In general, the TALYS II model set may therefore be regarded as a useful initial approach for predicting (p, γ) cross sections for nuclei in the region
$ Z=42-56 $ , particularly for reactions where measurements are difficult or unavailable. Although it does not provide a perfect description in all cases, it yields a reliable level of agreement between experimental and theoretical cross sections over a broad range of nuclei. At the same time, the results clearly indicate that no single global parameter set can accurately describe all isotopes, even within the same isotopic chain, thus highlighting the need for further refinement of nuclear input models.Finally, this study highlights the critical role of high-quality experimental data in constraining and validating statistical model calculations used in p-process nucleosynthesis studies. Because reaction networks involve a sensitive balance between production and destruction pathways, precise (p, γ) cross sections with reduced uncertainties are essential. Continued experimental efforts are therefore imperative to expand the existing database and improve the reliability of theoretical predictions used in astrophysical reaction-rate calculations.
-
The primary objective of the present work was to assess the predictive capability of the updated TALYS nuclear reaction code (version 2.0) by comparing experimental Sn(p, γ) cross sections with TALYS predictions obtained using different combinations of nuclear input models. The measurements were also compared with the NON-SMOKER (web) cross-section database. The TALYS model combinations that best reproduced the Sn(p, γ) excitation functions were subsequently used to evaluate their applicability to (p, γ) reactions on neighboring nuclei in the atomic number range
$ Z=42-56 $ .All experimental (p, γ) cross sections considered in this work were corrected for electron-screening effects to obtain bare-nucleus values appropriate for astrophysical applications. A systematic comparison was then performed using seven different TALYS model combinations (TALYS I–VII), incorporating various prescriptions for nuclear level density (NLD), photon strength function (PSF), and optical model potential (OMP). Among these, the TALYS VI model set, which employs experimentally constrained NLD and PSF parameters derived from recent systematics for Sn isotopes, was found to reproduce the measured Sn(p, γ)Sb cross sections and S-factors remarkably well. This result demonstrates the importance of incorporating locally constrained nuclear-structure information into statistical model calculations.
However, based on the overall agreement with the Sn data, the TALYS predictions obtained using the theoretical TALYS II model set were found to be very close to those obtained with the experimentally constrained parameters in the TALYS VI model combination. For a globally predictive framework, reliance on experimentally constrained parameters is not always feasible, especially across a wide range of nuclei. Therefore, a comprehensive evaluation based on both visual comparison and quantitative analysis (
$ \chi^2 $ and relative variance D) was carried out in this work using different theoretical model combinations, and TALYS II was found to be the most reliable set overall. This model set consistently reproduced the experimental cross sections and S-factors for all the Sn(p, γ)Sb reactions, except for the 119Sn(p, γ)120Sb reaction.The validated TALYS II model set and the default TALYS I option were subsequently applied to a broader set of 34 (p, γ) reactions on neighboring nuclei in the atomic number range
$ Z=42-56 $ . Among these, 23 reactions are reproduced well or reasonably well using the TALYS II model combination, demonstrating its strong predictive capability. Four reactions, namely 94Mo(p, γ)95Tc, 121,123Sb(p, γ)122,124Te, and 124Xe(p, γ)125Cs, are better described by the default TALYS I model, while two reactions (119Sn(p, γ)120Sb and 102Pd(p, γ)103Ag) are satisfactorily described only by the TALYS III model set. For five reactions involving the 100Mo, 96,98Ru, 105Pd, and 112Cd isotopes, none of the employed model combinations reproduced the experimental data satisfactorily. This study indicates that more extensive measurements are required, particularly for reactions such as 100Mo(p, γ)101Tc, 96Ru(p, γ)97Rh, 98Ru(p, γ)99Rh, 105Pd(p, γ)106Ag, 107Ag(p, γ)108Cd, 112Cd(p, γ)113In, and 124Xe(p, γ)125Cs.Both TALYS I and TALYS II employ the same PSF, namely the SMLO model, indicating that this PSF model provides an effective description of γ-ray emission in radiative proton-capture reactions in the Sn region. This observation is consistent with earlier findings reported in the literature by Koning et al. [14]. By contrast, the NON-SMOKER predictions for Sn isotopes systematically underestimate the experimental cross sections, whereas the TALYS calculations show better overall agreement with the measured data.
In general, the TALYS II model set may therefore be regarded as a useful initial approach for predicting (p, γ) cross sections for nuclei in the region
$ Z=42-56 $ , particularly for reactions where measurements are difficult or unavailable. Although it does not provide a perfect description in all cases, it yields a reliable level of agreement between experimental and theoretical cross sections over a broad range of nuclei. At the same time, the results clearly indicate that no single global parameter set can accurately describe all isotopes, even within the same isotopic chain, thus highlighting the need for further refinement of nuclear input models.Finally, this study highlights the critical role of high-quality experimental data in constraining and validating statistical model calculations used in p-process nucleosynthesis studies. Because reaction networks involve a sensitive balance between production and destruction pathways, precise (p, γ) cross sections with reduced uncertainties are essential. Continued experimental efforts are therefore imperative to expand the existing database and improve the reliability of theoretical predictions used in astrophysical reaction-rate calculations.
-
The primary objective of the present work was to assess the predictive capability of the updated TALYS nuclear reaction code (version 2.0) by comparing experimental Sn(p, γ) cross sections with TALYS predictions obtained using different combinations of nuclear input models. The measurements were also compared with the NON-SMOKER (web) cross-section database. The TALYS model combinations that best reproduced the Sn(p, γ) excitation functions were subsequently used to evaluate their applicability to (p, γ) reactions on neighboring nuclei in the atomic number range
$ Z=42-56 $ .All experimental (p, γ) cross sections considered in this work were corrected for electron-screening effects to obtain bare-nucleus values appropriate for astrophysical applications. A systematic comparison was then performed using seven different TALYS model combinations (TALYS I–VII), incorporating various prescriptions for nuclear level density (NLD), photon strength function (PSF), and optical model potential (OMP). Among these, the TALYS VI model set, which employs experimentally constrained NLD and PSF parameters derived from recent systematics for Sn isotopes, was found to reproduce the measured Sn(p, γ)Sb cross sections and S-factors remarkably well. This result demonstrates the importance of incorporating locally constrained nuclear-structure information into statistical model calculations.
However, based on the overall agreement with the Sn data, the TALYS predictions obtained using the theoretical TALYS II model set were found to be very close to those obtained with the experimentally constrained parameters in the TALYS VI model combination. For a globally predictive framework, reliance on experimentally constrained parameters is not always feasible, especially across a wide range of nuclei. Therefore, a comprehensive evaluation based on both visual comparison and quantitative analysis (
$ \chi^2 $ and relative variance D) was carried out in this work using different theoretical model combinations, and TALYS II was found to be the most reliable set overall. This model set consistently reproduced the experimental cross sections and S-factors for all the Sn(p, γ)Sb reactions, except for the 119Sn(p, γ)120Sb reaction.The validated TALYS II model set and the default TALYS I option were subsequently applied to a broader set of 34 (p, γ) reactions on neighboring nuclei in the atomic number range
$ Z=42-56 $ . Among these, 23 reactions are reproduced well or reasonably well using the TALYS II model combination, demonstrating its strong predictive capability. Four reactions, namely 94Mo(p, γ)95Tc, 121,123Sb(p, γ)122,124Te, and 124Xe(p, γ)125Cs, are better described by the default TALYS I model, while two reactions (119Sn(p, γ)120Sb and 102Pd(p, γ)103Ag) are satisfactorily described only by the TALYS III model set. For five reactions involving the 100Mo, 96,98Ru, 105Pd, and 112Cd isotopes, none of the employed model combinations reproduced the experimental data satisfactorily. This study indicates that more extensive measurements are required, particularly for reactions such as 100Mo(p, γ)101Tc, 96Ru(p, γ)97Rh, 98Ru(p, γ)99Rh, 105Pd(p, γ)106Ag, 107Ag(p, γ)108Cd, 112Cd(p, γ)113In, and 124Xe(p, γ)125Cs.Both TALYS I and TALYS II employ the same PSF, namely the SMLO model, indicating that this PSF model provides an effective description of γ-ray emission in radiative proton-capture reactions in the Sn region. This observation is consistent with earlier findings reported in the literature by Koning et al. [14]. By contrast, the NON-SMOKER predictions for Sn isotopes systematically underestimate the experimental cross sections, whereas the TALYS calculations show better overall agreement with the measured data.
In general, the TALYS II model set may therefore be regarded as a useful initial approach for predicting (p, γ) cross sections for nuclei in the region
$ Z=42-56 $ , particularly for reactions where measurements are difficult or unavailable. Although it does not provide a perfect description in all cases, it yields a reliable level of agreement between experimental and theoretical cross sections over a broad range of nuclei. At the same time, the results clearly indicate that no single global parameter set can accurately describe all isotopes, even within the same isotopic chain, thus highlighting the need for further refinement of nuclear input models.Finally, this study highlights the critical role of high-quality experimental data in constraining and validating statistical model calculations used in p-process nucleosynthesis studies. Because reaction networks involve a sensitive balance between production and destruction pathways, precise (p, γ) cross sections with reduced uncertainties are essential. Continued experimental efforts are therefore imperative to expand the existing database and improve the reliability of theoretical predictions used in astrophysical reaction-rate calculations.
-
The primary objective of the present work was to assess the predictive capability of the updated TALYS nuclear reaction code (version 2.0) by comparing experimental Sn(p, γ) cross sections with TALYS predictions obtained using different combinations of nuclear input models. The measurements were also compared with the NON-SMOKER (web) cross-section database. The TALYS model combinations that best reproduced the Sn(p, γ) excitation functions were subsequently used to evaluate their applicability to (p, γ) reactions on neighboring nuclei in the atomic number range
$ Z=42-56 $ .All experimental (p, γ) cross sections considered in this work were corrected for electron-screening effects to obtain bare-nucleus values appropriate for astrophysical applications. A systematic comparison was then performed using seven different TALYS model combinations (TALYS I–VII), incorporating various prescriptions for nuclear level density (NLD), photon strength function (PSF), and optical model potential (OMP). Among these, the TALYS VI model set, which employs experimentally constrained NLD and PSF parameters derived from recent systematics for Sn isotopes, was found to reproduce the measured Sn(p, γ)Sb cross sections and S-factors remarkably well. This result demonstrates the importance of incorporating locally constrained nuclear-structure information into statistical model calculations.
However, based on the overall agreement with the Sn data, the TALYS predictions obtained using the theoretical TALYS II model set were found to be very close to those obtained with the experimentally constrained parameters in the TALYS VI model combination. For a globally predictive framework, reliance on experimentally constrained parameters is not always feasible, especially across a wide range of nuclei. Therefore, a comprehensive evaluation based on both visual comparison and quantitative analysis (
$ \chi^2 $ and relative variance D) was carried out in this work using different theoretical model combinations, and TALYS II was found to be the most reliable set overall. This model set consistently reproduced the experimental cross sections and S-factors for all the Sn(p, γ)Sb reactions, except for the 119Sn(p, γ)120Sb reaction.The validated TALYS II model set and the default TALYS I option were subsequently applied to a broader set of 34 (p, γ) reactions on neighboring nuclei in the atomic number range
$ Z=42-56 $ . Among these, 23 reactions are reproduced well or reasonably well using the TALYS II model combination, demonstrating its strong predictive capability. Four reactions, namely 94Mo(p, γ)95Tc, 121,123Sb(p, γ)122,124Te, and 124Xe(p, γ)125Cs, are better described by the default TALYS I model, while two reactions (119Sn(p, γ)120Sb and 102Pd(p, γ)103Ag) are satisfactorily described only by the TALYS III model set. For five reactions involving the 100Mo, 96,98Ru, 105Pd, and 112Cd isotopes, none of the employed model combinations reproduced the experimental data satisfactorily. This study indicates that more extensive measurements are required, particularly for reactions such as 100Mo(p, γ)101Tc, 96Ru(p, γ)97Rh, 98Ru(p, γ)99Rh, 105Pd(p, γ)106Ag, 107Ag(p, γ)108Cd, 112Cd(p, γ)113In, and 124Xe(p, γ)125Cs.Both TALYS I and TALYS II employ the same PSF, namely the SMLO model, indicating that this PSF model provides an effective description of γ-ray emission in radiative proton-capture reactions in the Sn region. This observation is consistent with earlier findings reported in the literature by Koning et al. [14]. By contrast, the NON-SMOKER predictions for Sn isotopes systematically underestimate the experimental cross sections, whereas the TALYS calculations show better overall agreement with the measured data.
In general, the TALYS II model set may therefore be regarded as a useful initial approach for predicting (p, γ) cross sections for nuclei in the region
$ Z=42-56 $ , particularly for reactions where measurements are difficult or unavailable. Although it does not provide a perfect description in all cases, it yields a reliable level of agreement between experimental and theoretical cross sections over a broad range of nuclei. At the same time, the results clearly indicate that no single global parameter set can accurately describe all isotopes, even within the same isotopic chain, thus highlighting the need for further refinement of nuclear input models.Finally, this study highlights the critical role of high-quality experimental data in constraining and validating statistical model calculations used in p-process nucleosynthesis studies. Because reaction networks involve a sensitive balance between production and destruction pathways, precise (p, γ) cross sections with reduced uncertainties are essential. Continued experimental efforts are therefore imperative to expand the existing database and improve the reliability of theoretical predictions used in astrophysical reaction-rate calculations.
Systematic study of (p, γ) reaction cross sections for Sn isotopes and nuclei around Sn via statistical approach
- Received Date: 2026-01-22
- Available Online: 2026-10-15
Abstract: A systematic study of radiative proton-capture (p, γ) cross sections on Sn isotopes and neighboring nuclei was performed within the framework of the Hauser–Feshbach statistical model using the TALYS 2.0 code. The available experimental (p, γ) cross sections for the isotopes 112,114,115,116,118,119Sn were corrected for electron screening effects, and the corresponding astrophysical S-factors were derived. These corrected data were then compared with TALYS calculations to assess the predictive capability of the code for modeling (p, γ) reactions on Sn isotopes. Different combinations of nuclear input models, including photon strength functions (PSF), nuclear level densities (NLD), and optical model potentials (OMP), were systematically explored to reproduce the measured cross sections and corresponding S-factors. In addition, calculations were performed using experimentally constrained NLD and PSF parameters from a recent systematic study of Sn isotopes. These calculations successfully reproduced the measured Sn(p, γ) data and provided a stringent test of the theoretical inputs used in TALYS. The results were further compared with predictions from the NON-SMOKER(web) database. The model combinations within the TALYS framework that showed reasonable agreement with the experimental data for Sn isotopes were subsequently used to evaluate their predictive performance for existing (p, γ) cross sections of neighboring nuclei in the atomic number range $ Z=42-56 $, after applying electron screening corrections. The present study establishes a reliable modeling framework for describing proton-capture reactions and improving astrophysical reaction-rate predictions in this region.



 DownLoad: