


 Abstract
 HTML
 Reference
 Related
 PDF



-
Since the discovery of the EMC effect [1−3], a series of models have been developed to interpret that effect [4−23]. However, to date no widely accepted model has been proposed. Nowadays, it is believed that the EMC effect arises primarily from the nucleon-nucleon short-range correlation (N-N SRC) [24−28], which was identified experimentally as the nucleon pair with a high relative momentum between the two nucleons and a small center-of-mass momentum of the pair [29, 30]. However, a recent study revealed that there is not a causal connection between the N-N SRC and EMC effect [31]. Therefore, the physical mechanism of the EMC effect remains an open question. Certainly, the relationship between the N-N SRC and EMC effect should be further examined. Moreover, it is necessary to further explore the correlations between other nuclear environments and the EMC effect.
The nucleon density distribution of finite nuclei is one of the most important nuclear media. Decades ago, it was found that the strength of the EMC effect is proportional to the average nuclear density [20, 21, 23]. However, the measurement of 3He and 9Be suggested that the EMC effect is dependent on the local density of a nucleus [32]. Generally, the nucleon density distribution exhibits a characteristic pattern of being dense in the interior and diffuse on the surface. So, it is necessary to explore the correlation between the local nuclear density and EMC effect.
Very recently, a correlation between the nuclear diffuseness and EMC effect has been explored within the T. D. Lee's soliton bag model and double Q2-rescaling model [33], which showed that the average nucleon swelling factor gets smaller and smaller with the increase of diffusion parameter and thus weakens the slope of the EMC ratio [33]. In fact, the central density is more significant for the EMC effect, which is attributed to the following three reasons: (i) At high density, the nucleons overlap more heavily with each other, leading to the temporary high-momentum nucleon pairs and altering the quark distributions. (ii) In denser nuclei, the meson exchange may be enhanced, affecting the quark confinement. (iii) The nucleon swelling is enhanced at high densities.
Nevertheless, researchers have predicted the existence of exotic nuclei exhibiting either a complete vanishing or a substantially reduced central density relative to the nuclear saturation density (
$ \rho_0\approx0.16\mathrm{\ fm}^{-3} $ ) [34−41]. These peculiar nuclear systems are conventionally termed as bubble nuclei due to their distinctive density distributions. Studies indicate that bubble structures arise from the low occupation probability of the s state. The absence of the l=0 orbital contribution leads to a strong drop in the nuclear central density [34−41]. Experimentally, the possible existence of a proton bubble structure was first reported in the doubly magic nucleus 34Si by Mutschler et al. [42], based on the observation of an almost empty proton 2s1/2 orbital. This finding suggests that a depleted central density can significantly affect the nuclear spin-orbit interaction, motivating further investigations of how such exotic density profiles influence the internal quark-gluon structure of nucleons. Therefore, it is interesting to explore the EMC effect caused by modifying the central nucleon density, which not only reveals how the internal quark-gluon structure of nucleons is altered in low-density nuclear environments, but also provides experimental benchmarks for lattice QCD calculations under non-uniform density conditions. Therefore, such a study bridges nuclear structure physics and quark-level dynamics, offering a new perspective on how quark confinement and many-body effects manifest in exotic nuclear geometries. So, based on our recent work for the EMC effect influenced by the nuclear diffuseness [33], in this letter we will discuss the correlation between the EMC effect and depleted central density within the soliton bag model proposed by T. D. Lee [43] and double Q2-rescaling model [44, 45].In the T. D. Lee's soliton bag model, it is assumed that there exists a phenomenological scalar field [43]
$ \begin{split} \sigma = \sigma_{{\rm{vac}}}(1 - \kappa), \end{split} $
(1) where outside the nucleon bag, the color dielectric constant
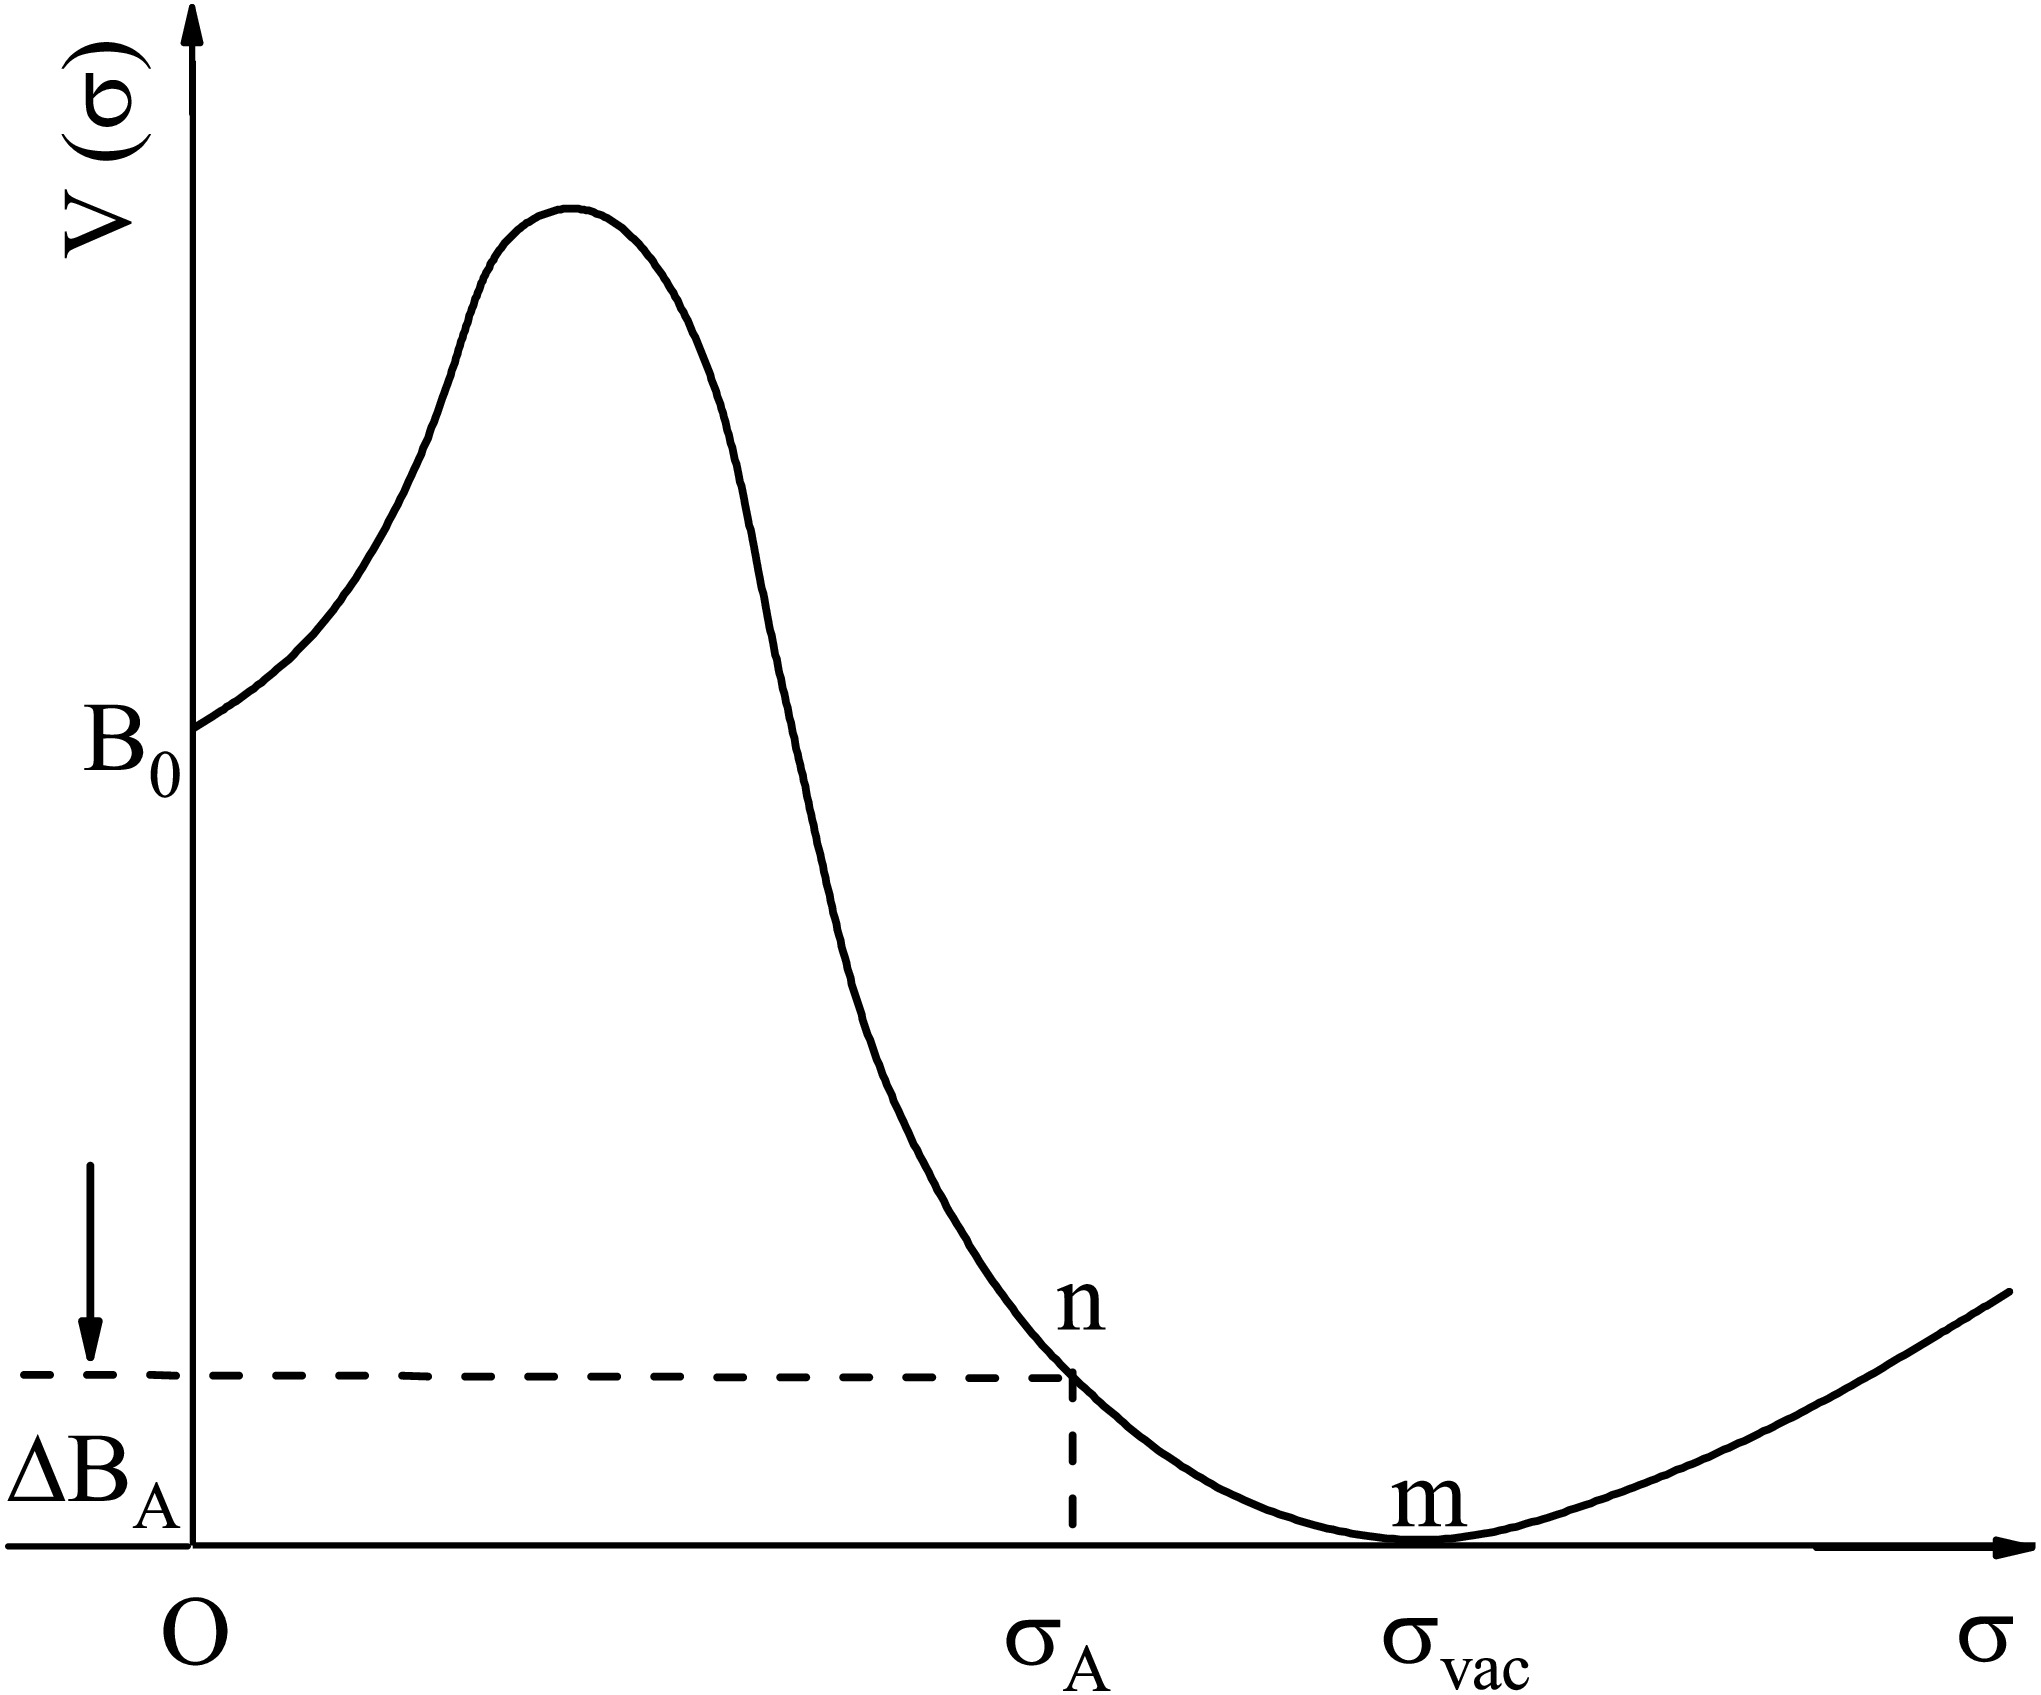
$ \kappa = 0 $ and$ \sigma = \sigma_{{\rm{vac}}} $ ; inside the bag,$ \kappa = 1 $ and$ \sigma = 0 $ . The potential energy of the σ field satisfies$ V(\sigma_{{\rm{vac}}}) = 0 $ and$ V(0) = B_0 $ [43], which is shown in Fig. 1. The pressure difference$ B_0 $ between the interior and exterior balances the pressure from the color field inside the bag, determining the free nucleon bag radius.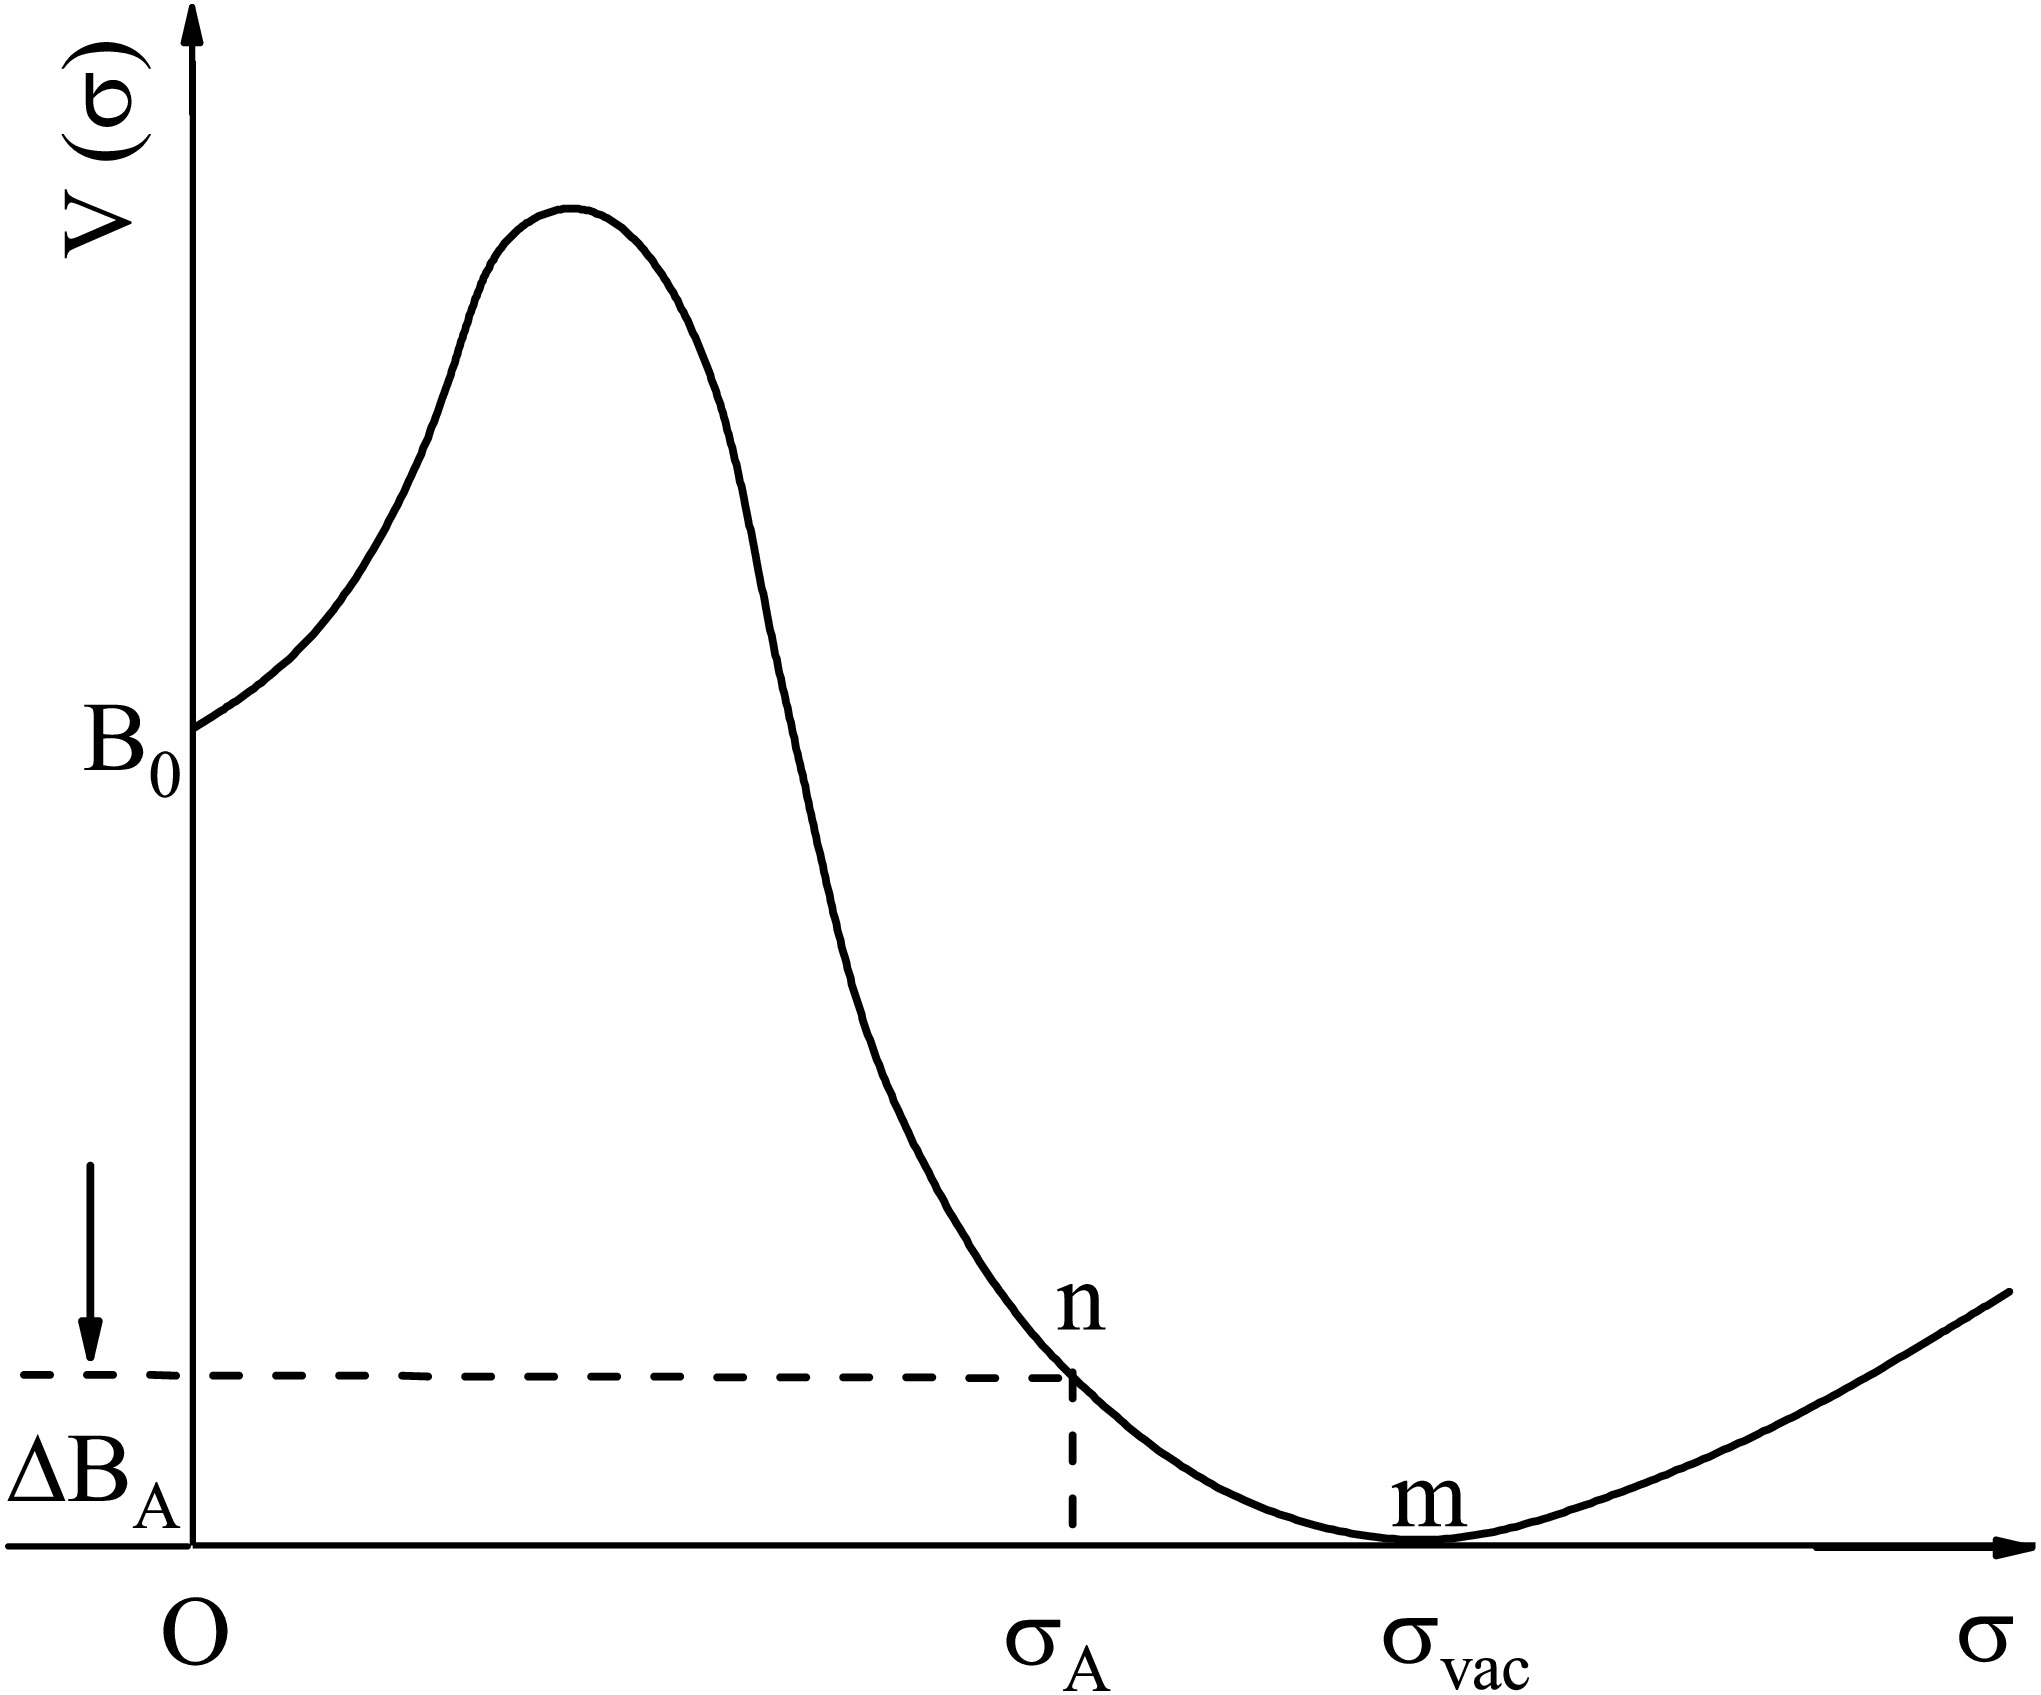
Figure 1. The potential energy curve V(σ) of the scalar field σ.
In a nucleus, the color dielectric constant outside the nucleon bag under investigation is no longer
$ \kappa = 0 $ , but rather the volume-weighted average of the space occupied by the remaining (A-1) nucleon bags ($ \kappa = 1 $ ) and the space unoccupied by the nucleons ($ \kappa = 0 $ ). The effective color dielectric constant$ \kappa_A $ is determined by [46−48]$ \begin{split} \kappa _{A}=\dfrac{A^{\alpha }-1}{\dfrac{3A^{\alpha }}{4\pi \rho _{A}R_{A}^{3}} -1}, \end{split} $
(2) where
$ \rho _{A} $ is the average density of the nucleon number and α is a parameter that is less than 1.0.The nucleon density inside a nucleus can be described by the following three-parameter Fermi type distribution
$ \begin{split} \rho _{A}(r)=\dfrac{(1+\dfrac{\omega r^{2}}{c^{2}})\rho _{0}}{1+\exp (\dfrac{r-c }{a_{d}})}, \end{split} $
(3) where
$ \rho_0 $ is the saturation density, the diffusion parameter ad is taken as 0.54 fm and the half-density radius$ c=r_{0}A^{1/3}\left( 1-\dfrac{\pi ^{2}a_{d}^{2}}{3r_{0}^{2}}A^{-2/3}\right) $ with$ r_{0}=1.07 $ fm. The parameter ω (>0) affects the central density and the depression in the central density increases with the ω rising.Moreover, the nuclear mass is conserved by the following condition
$ \begin{split}4\pi\int_0^{+\infty}\rho_A(r)r^2\mathrm{d}r=A.\end{split} $
(4) Usually, the bubble structure is quantified by the depletion fraction (DF) [34−41].
$ \begin{split} DF=\frac{\rho _{\max }-\rho _{c}}{\rho _{\max }}, \end{split} $
(5) where
$ \rho _{\max } $ and$ \rho _{c} $ denote the nucleon densities at the maximum and at the nuclear center (r = 0), respectively.Furthermore, the nucleon density distribution of a nucleus can be calculated consistently using microscopic nuclear many-body theories [34−41].
Considering the saturation property and short-range nature of the nuclear force, it is assumed that a nucleon at a distance r from the nuclear center is influenced only by the surrounding nucleons and the physical vacuum within a small spherical volume
$ \Delta V $ . The$ \kappa_A $ value outside this nucleon is the average over the$ \kappa = 1 $ and$ \kappa = 0 $ regions within$ \Delta V $ .$ \begin{split} \kappa _{A}(r)= &\frac{1}{\Delta V}\int_{\Delta V}\frac{4\pi }{3}R_{A}^{3}( {\boldsymbol{r}}+{\boldsymbol{r}}_{1})\rho _{A}({\boldsymbol{r}}+{\boldsymbol{r}}_{1}){\mathrm{d}}\tau \\ =& \frac{4\pi }{3}R_{A}^{3}(r)\rho _{A}(r). \end{split} $
(6) Thus,
$ \kappa_A(r) $ is proportional to the local nucleon density$ \rho_A(r) $ and the nucleon bag volume.In the nuclear interior, the effective scalar field outside the nucleon bag decreases from
$ \sigma_{{\rm{vac}}} $ to$ \sigma_A $ [46−48], as shown in Fig. 1. Correspondingly, the V(σ) outside the bag changes from m to n. The difference between the value of V(σ) at$ \sigma=\sigma_A $ and that at$ \sigma=0 $ (BA=B0–$ \Delta B_{A} $ ) is the effective bag constant, which is reduced by$ \Delta B_A $ relative to that of a free nucleon. This implies that the external pressure is reduced by$ \Delta B_A $ , causing the bag to expand.Expanding
$ V(\sigma_A) $ in a Taylor series about$ \sigma_{{\rm{vac}}} $ and retaining the first two non-zero terms yield$ \begin{split} V(\sigma_A)= & \Delta B_A=b_1(\sigma_A-\sigma_{\mathrm{vac}})^2+b_2(\sigma_A-\sigma_{\mathrm{vac}})^3 \\ = & G_1\kappa_A^2(r)-G_2\kappa_A^3(r). \end{split} $
(7) The pressure balance condition between the interior and exterior of the bag is given by [46−48].
$ \begin{split} \Delta B_A = \frac{3M_0 R_0}{16\pi} \left(\frac{1}{R_0^4} - \frac{1}{R_A^4}\right). \end{split} $
(8) Using Eqs. (6)–(8), the following equation can be derived.
$ \begin{split} \frac{1024\pi ^{4}}{81M_{0}}B_{2}\rho _{A}^{3}(r)a_{A}^{13}(r)-\frac{256\pi ^{3}}{27M_{0}}B_{1}\rho _{A}^{2}(r)a_{A}^{10}(r)+a_{A}^{4}(r)-1=0, \end{split} $
(9) where B1=G1
$ R_{0}^{9} $ =0.0504 GeV fm6 and B2=G2$ R_{0}^{12} $ =0.0260 GeV fm9 [48], and$ a_A(r) = R_A(r)/R_0 $ is the nucleon swelling factor. By solving Eq. (9),$ a_{A}(r) $ can be determined.Furthermore, the average
$ a_{A}(r) $ is defined as$ \begin{split}\overline{a_A}=\frac{1}{A}\int_0^{\infty}4\pi r^2\rho_A(r)a_A(r)\, \mathrm{d}r.\end{split} $
(10) In the framework of the double Q2-rescaling model [44, 45], the average nucleon structure function in a nucleus is
$ \begin{split} F_{2}^{A}(x, Q^{2}) =& \sum_{i} e_{i}^{2} x \left[ q_{Vi}^{N}(x, \xi_{V}Q^{2}) + q_{Si}^{N}(x, \xi_{S}Q^{2}) \right.\\&\left.+ \bar{q}_{Si}^{N}(x, \xi_{S}Q^{2}) \right], \end{split} $
(11) where
$ q_{Vi}^{N}(x,\xi _{V}Q^{2}) $ ,$ q_{Si}^{N}(x,\xi _{S}Q^{2}) $ , and$ \overline{\mathit{q}}_{Si}^{N}(x,\xi _{S}Q^{2}) $ denote the momentum distribution functions of valence quarks, sea quarks, and anti-sea quarks of flavor i in a bound nucleon. x denotes the Bjorken scaling variable.$ \xi _{V} $ and$ \xi _{S} $ are rescaling parameters whose values are estimated using the following empirical formulas [33]$ \begin{split} \xi _{V} &=9.3393\left( 1-\frac{1}{\overline{a_{A}}}\right) ^{1/2}+0.0333\ln A-0.2731, \end{split} $
(12) $ \begin{split} \xi _{S} &=-0.0175\left( 1-\frac{1}{\overline{a_{A}}}\right)^{-1/2} -0.0230\ln A+0.2117. \end{split} $
(13) The empirical parameters in Eqs. (12) and (13) were obtained by fitting the experimental EMC ratios for several medium-to-heavy nuclei within the double Q2-rescaling model, as described in Ref. [33].
The EMC effect can be quantified by the following ratio
$ \begin{split} R^{A/D}(x, Q^{2}) = \frac{F_{2}^{A}(x, Q^{2})}{F_{2}^{D}(x, Q^{2})}. \end{split} $
(14) Here, the denominator is the deuteron nucleon structure function.
From the above discussion, it can be seen that the value of
$ \overline{a_{A}} $ changes as the parameter ω varies. As a result, the corresponding rescaling parameters$ \xi _{V} $ and$ \xi _{S} $ , as well as the EMC ratio, also change.First, taking 27Al as an example, we calculate the nucleon density distributions with Eq. (3) and the corresponding
$ a_{A}(r) $ distributions for different values of ω, which are plotted in Figs. 2(a) and 2(b), respectively. It should be emphasized that 27Al is not predicted to be a bubble nucleus. The parameter ω introduced in Eq. (3) can phenomenologically modify the central density, allowing us to explore the sensitivity of the EMC effect to density depletion in a well-controlled manner. The bubble structure obtained at some values of ω should not be interpreted as a physical realization in 27Al. Using Eq. (5), the DF values are calculated and shown in column 2 of Table 1. From Table 1, one can see that the DF values rise gradually with increasing ω. This indicates that the bubble structure of 27Al becomes progressively more evident.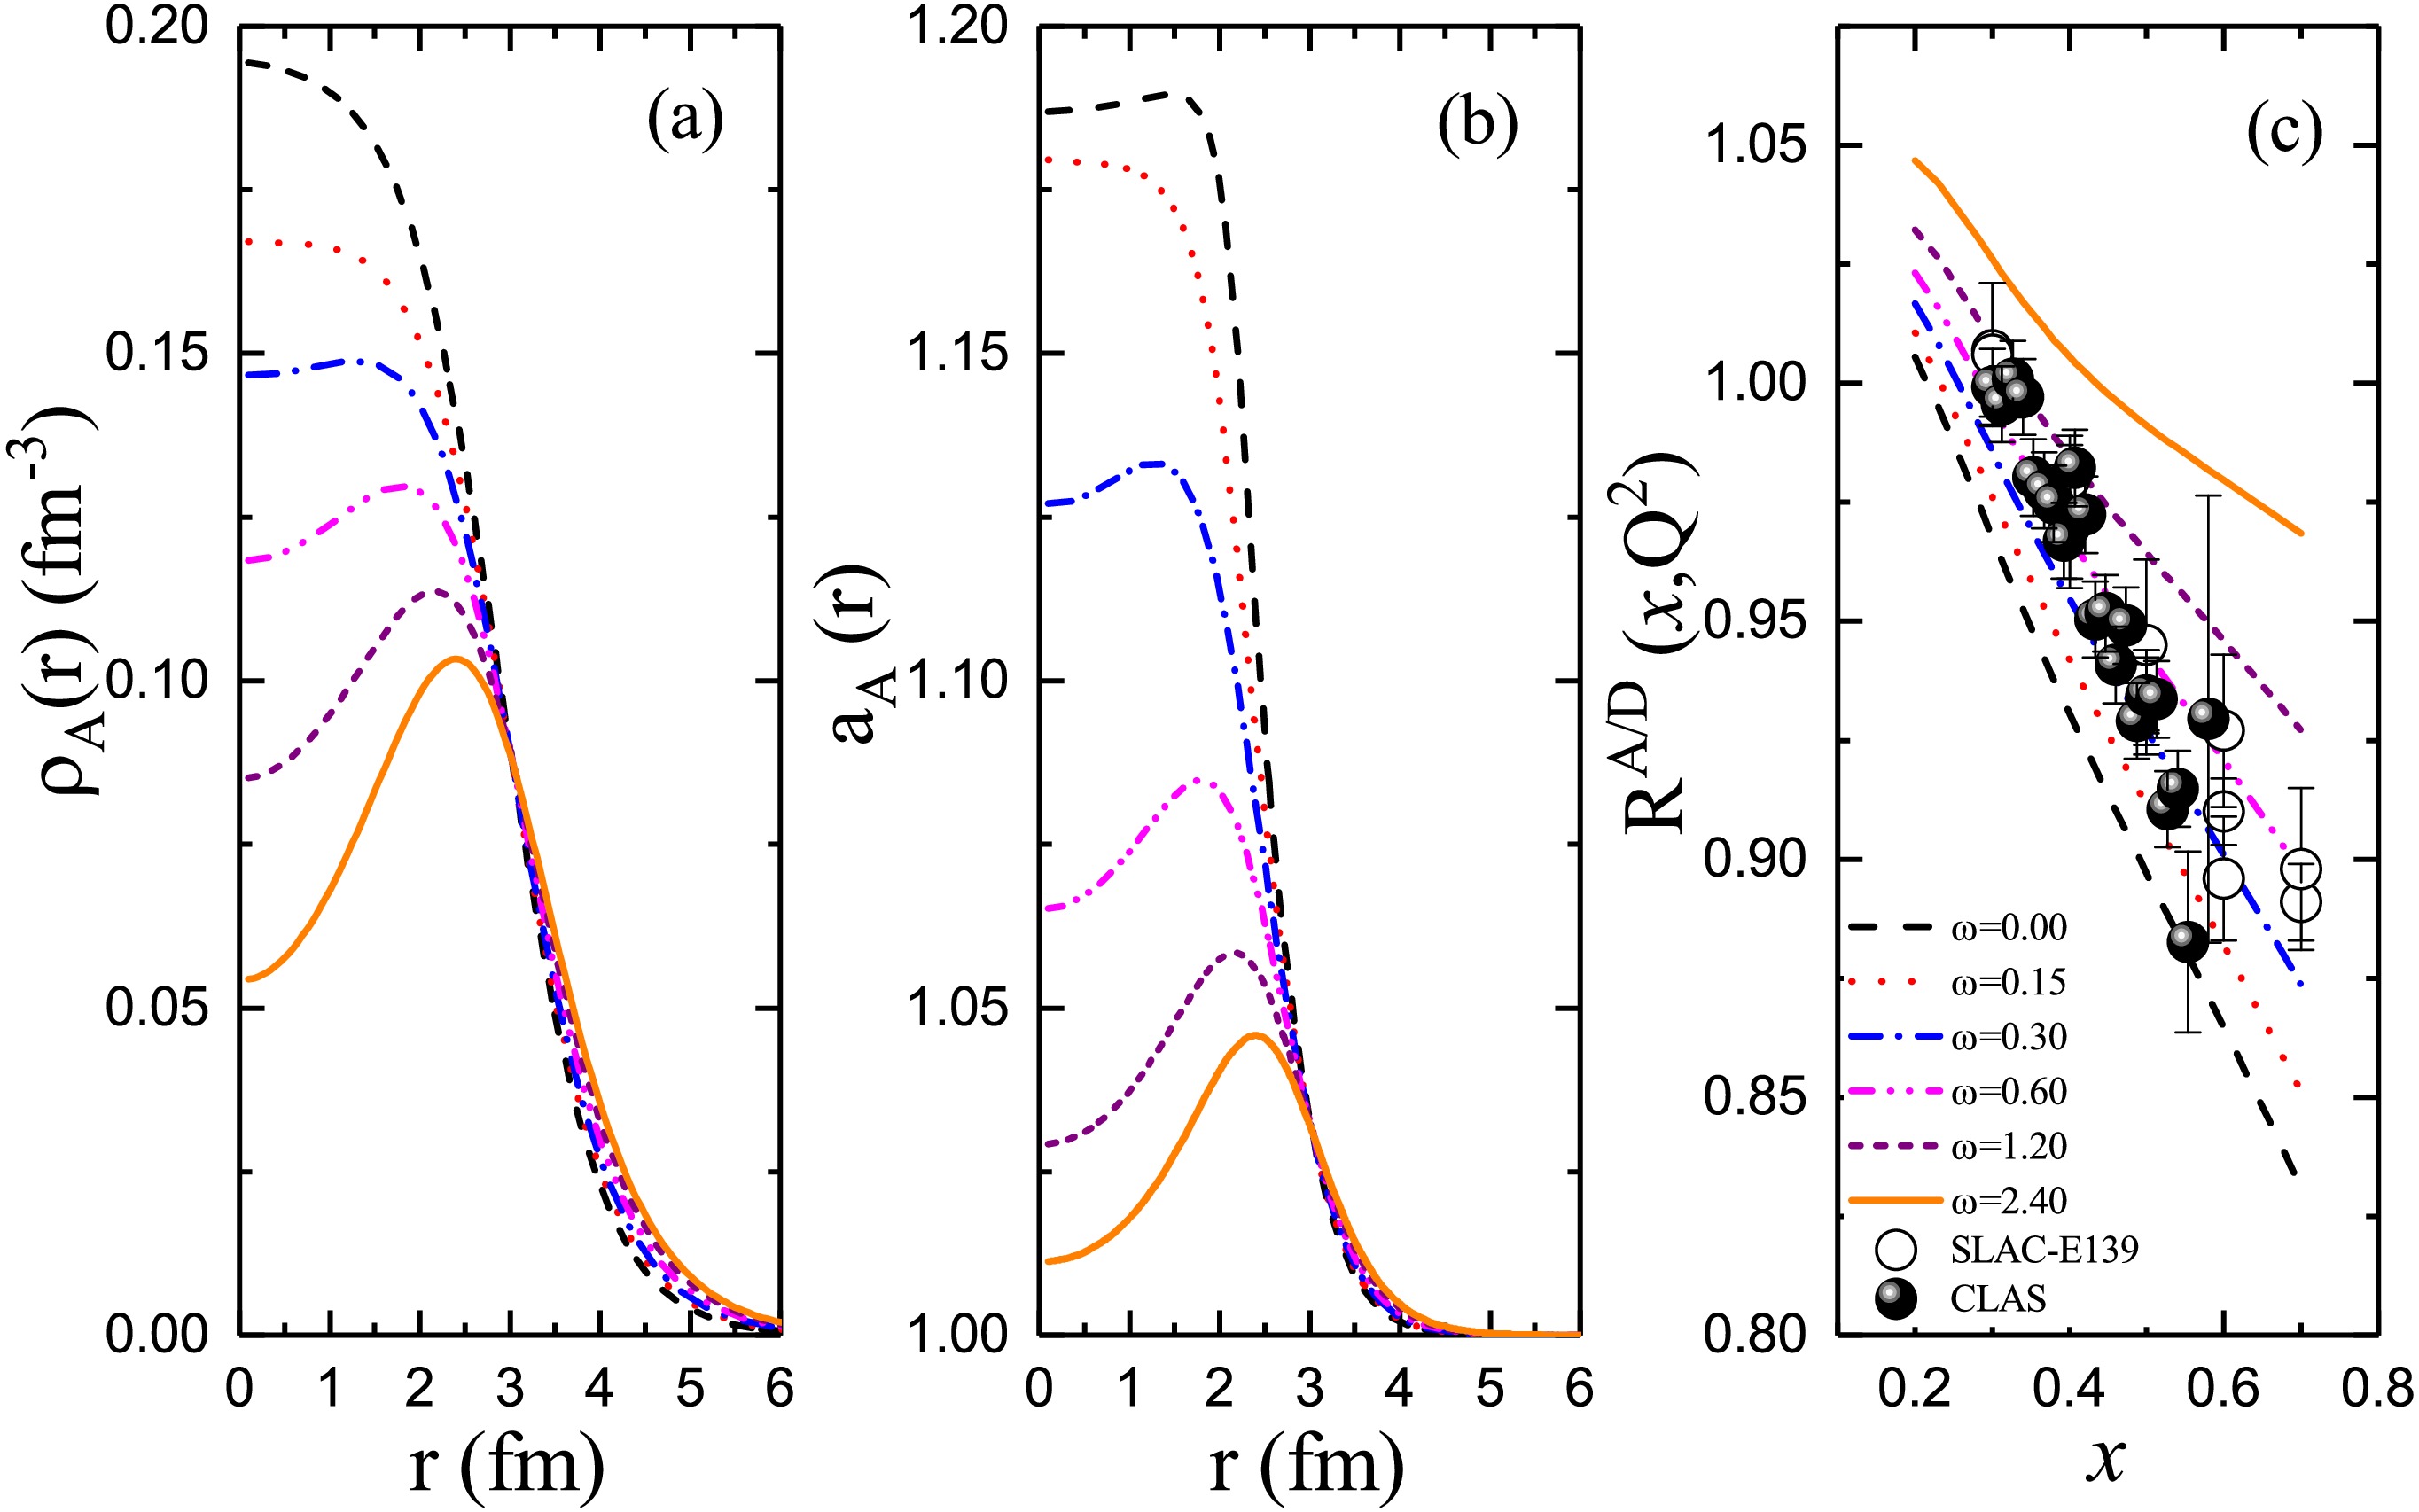
Figure 2. (color online) The nucleon density distributions
$ \rho _{A}(r) $ (a), the corresponding nucleon swelling factor distributions$ a_{A}(r) $ (b), and the computed EMC ratios$ R^{A/D}(x,Q^{2}) $ (c) for 27Al as functions of r for different ω values. The open and solid circles represent the experimental data from the SLAC-E139 [21] and CLAS [28] collaborations, respectively.From Fig. 2, we can see that the distribution of
$ a_{A}(r) $ is similar to that of$ \rho _{A}(r) $ . This means that, in regions with a higher nucleon density, the nucleon swelling is greater, and vice versa. Moreover, it can be seen that the central density decreases gradually with increasing ω because some interior nucleons must be scattered to the surface due to the mass conservation constraint in Eq. (4). As a result, the$ a_{A}(r) $ value in the central region continuously decreases. When more nucleons are scattered to the nuclear surface, the nucleus as a whole becomes more loosely bound. Consequently, the value of$ \overline{a_{A}} $ gradually decreases with increasing ω, as can be seen clearly from column 3 of Table 1.ω DF $ \overline{a_{A}} $ $ \xi _{V} $ $ \xi _{S} $ - $ \mathrm{d}R^{A/D}(x,Q^2)/\mathrm{d}x $ 0.00 0.00% 1.084 2.432 0.073 0.348 0.15 0.00% 1.066 2.168 0.066 0.319 0.30 1.38% 1.052 1.918 0.057 0.287 0.60 8.70% 1.041 1.696 0.048 0.253 1.20 25.10% 1.031 1.464 0.035 0.213 2.40 47.38% 1.022 1.207 0.017 0.162 Table 1. The depletion fraction DF, average nucleon swelling factor
$ \overline{a_{A}} $ , rescaling parameters$ \xi _{V} $ and$ \xi _{S} $ , and the slope of the EMC ratio,$ -\mathrm{d}R^{A/D}(x,Q^2)/\mathrm{d}x $ , for 27Al at different ω values.Next, the rescaling parameters
$ \xi _{V} $ and$ \xi _{S} $ for different values of ω are extracted using Eqs. (12) and (13) by inputting different values of$ \overline{a_{A}} $ . Columns 4 and 5 of Table 1 show the$ \xi _{V} $ and$ \xi _{S} $ values of 27Al for different values of ω. By comparing the$ \xi _{V} $ and$ \xi _{S} $ values listed in columns 4 and 5 of Table 1, one can see that the$ \xi _{V} $ value is much larger than the$ \xi _{S} $ value for any value of ω. This indicates that the contribution of valence quarks to the EMC effect is much more important than that of the sea and anti-sea quarks. This result is consistent with the interpretation that nuclear binding primarily modifies the valence quark momentum distributions and with the conclusions of previous studies [26, 49, 50]. In addition, one can see that the$ \xi _{V} $ and$ \xi _{S} $ values gradually decrease with increasing ω. This implies that the EMC ratio may be weakened by the decreasing$ \xi _{V} $ and$ \xi _{S} $ values, as will be shown in the next paragraph.Using the double Q2-rescaling model with the
$ \xi _{V} $ and$ \xi _{S} $ values extracted from Eqs. (12) and (13), the EMC ratios of 27Al for different values of ω are calculated and shown in Fig. 2(c). It can be seen that the calculated EMC ratio gradually approaches the experimental data as ω increases. In addition, we estimate the slope of the EMC ratio (-$ \mathrm{d}R^{A/D}(x,Q^2)/\mathrm{d}x $ ), and the corresponding values are listed in the last column of Table 1. One can see that the value of -$ \mathrm{d}R^{A/D}(x,Q^2)/\mathrm{d}x $ becomes progressively smaller as ω increases. However, the measurement by the CLAS collaboration suggested that the value of -$ \mathrm{d}R^{A/D}(x,Q^2)/\mathrm{d}x $ for 27Al is 0.347$ \pm 0.022 $ [28]. By comparing the calculated -$ \mathrm{d}R^{A/D}(x,Q^2)/\mathrm{d}x $ values listed in Table 1 with the corresponding experimental data, we find that when the calculated$ R^{A/D} $ (x,Q2) best matches the experimental data, the corresponding -$ \mathrm{d}R^{A/D}(x,Q^2)/\mathrm{d}x $ fails to agree well with the experimental slope. Meanwhile, when the calculated -$ \mathrm{d}R^{A/D}(x,Q^2)/\mathrm{d}x $ values show good agreement with the experimental measurements, the$ R^{A/D} $ (x,Q2) values deviate from the experimental data. Therefore, adjusting only the ω parameter is insufficient to reproduce the experimental EMC ratios and the corresponding slope values simultaneously. It seems that other nuclear medium effects, such as the N-N SRC [24, 25], the α-cluster effect on the nuclear surface [32], coupling between the isovector-vector mean field and the quarks [51], and nucleon electromagnetic form factors [52], should be taken into account.Note that, very recently, we investigated the correlation between the nuclear diffuseness ad and the EMC effect [33] and showed that the average nucleon swelling factor
$ \overline{a_{A}} $ and the rescaling parameters$ \xi _{V} $ and$ \xi _{S} $ decrease progressively with increasing ad. Furthermore, the value of$ -\mathrm{d}R^{A/D}(x,Q^2)/\mathrm{d}x $ is reduced as ad increases. A comparison between our current work and our recent study shows that the conclusion of this article is similar to that of our recent work [33]. In our recent work, the central density gradually decreases with increasing ad. However, in this work, we observe an increase in the surface diffuseness through a reduction in the central nuclear density. Thus, these two approaches are essentially linked to each other.In general, bubble structures have been predicted to exist in 22O, 34Si, 46Ar, and 206Hg [34−41]. However, these are proton bubble nuclei. When the neutron density distribution is included, the bubble structure almost disappears overall. Therefore, the EMC effect caused by the proton bubble structure is not significant. Recently, 48Si was predicted to be a candidate dual semi-bubble nucleus, with both neutron and proton bubble-like structures, using the RHFB theory with the PKA1 nucleon-nucleon (
$ N-N $ ) interaction [41]. To further test the possibility of the dual semi-bubble structure in 48Si, we calculate its neutron density$ \rho _{n}(r) $ , proton density$ \rho _{p}(r) $ , and nucleon density$ \rho _{A}(r) $ ($ \rho _{A}(r) $ =$ \rho _{n}(r) $ +$ \rho _{p}(r) $ ) using the SHFB theory [53] with the SLy4 [54], SKM* [55], and LNS$ N-N $ interactions [56]. The results are shown in Figs. 3(a) and 3(b). Note that, in our calculations, we use a mixed density-dependent δ interaction for the pairing channel [53]:$ V_{\rm pair}=\left( t_{0}^{\prime }+\dfrac{ t_{3}^{\prime }}{6}\rho ^{\gamma ^{\prime }}\right) \delta $ , where ρ is the isoscalar local density,$ \gamma ^{^{\prime }}=1 $ , and$ t_{3}^{^{\prime }}=-37.5t_{0}^{^{\prime }} $ .$ t_{0}^{^{\prime }} $ is the pairing strength and is determined, together with a certain cutoff quasiparticle energy, by the mean neutron pairing energy gap of 120Sn (1.31 MeV) [53]. For the SLy4, SKM*, and LNS interactions, the corresponding$ t_{0}^{^{\prime }} $ values are determined to be -287.74, -239.18, and -254.80 MeV fm−3, respectively.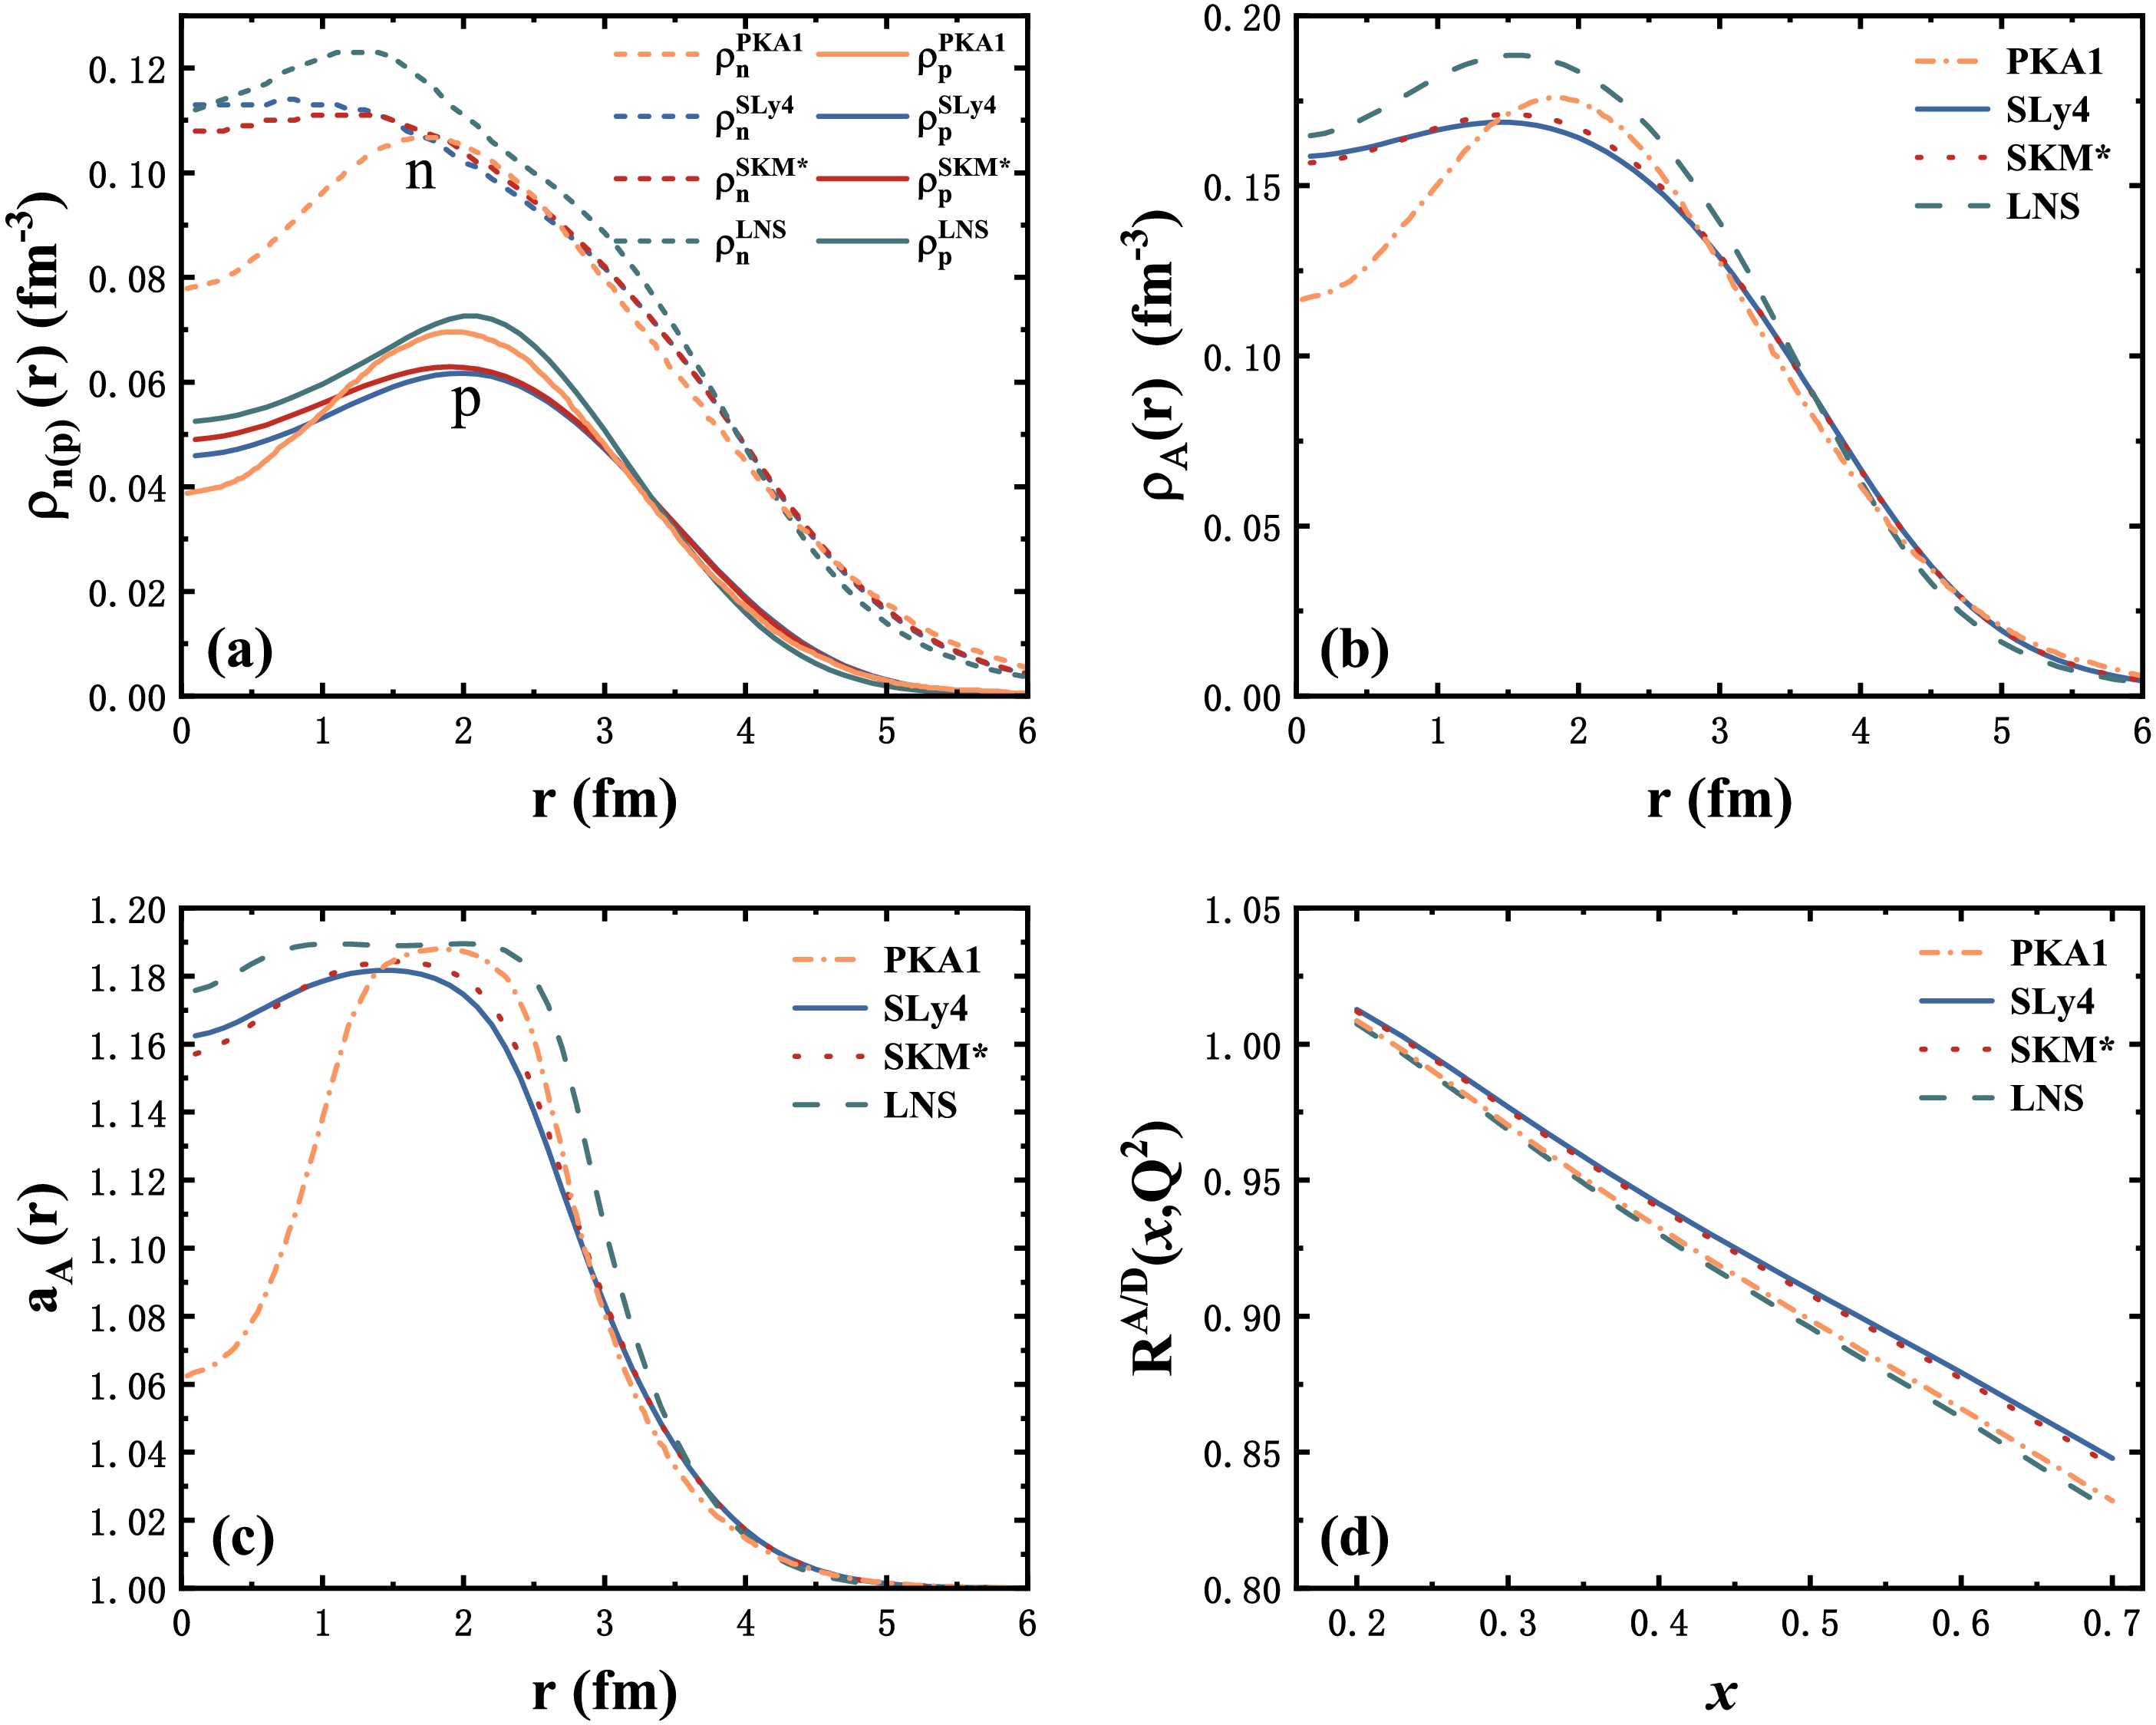
Figure 3. (color online) The calculated neutron density distribution
$ \rho _{n}(r) $ and proton density distribution$ \rho _{p}(r) $ of 48Si obtained with the PKA1, SLy4, SKM*, and LNS$ N{\rm{-}}N $ interactions are shown in (a), where the symbols "n'' and "p'' denote neutrons and protons, respectively. The corresponding nucleon density distribution$ \rho _{A}(r) $ (b), nucleon swelling factor distribution$ a_{A}(r) $ (c), and EMC ratio$ R^{A/D}(x,Q^{2}) $ (d) are also shown. The$ \rho _{n}(r) $ ,$ \rho _{p}(r) $ , and$ \rho _{A}(r) $ values for the PKA1 interaction are taken from the RHFB calculation in Ref. [41], whereas those for the SLy4, SKM*, and LNS interactions are obtained from our SHFB calculations.Using Eq. (5), we extract the neutron depletion fraction DFn, proton depletion fraction DFp, and nucleon depletion fraction DF for the four selected N-N interactions. These values are compiled in columns 2−4 of Table 2. Among these interactions, PKA1 produces the most pronounced bubble structure, as indicated by the largest DF values. Furthermore, for each interaction, the proton bubble is consistently stronger than the neutron bubble, as can be seen from the different radial density distributions of protons and neutrons in 48Si.
$ N-N $ interactionsDFn DFp DF $ \overline{a_{A}} $ $ \xi _{V} $ $ \xi _{S} $ - $ \mathrm{d}R^{A/D}(x,Q^2)/\mathrm{d}x $ PKA1 26.68% 43.86% 33.33% 1.082 2.427 0.059 0.353 SLy4 0.66% 25.62% 5.90% 1.069 2.221 0.054 0.330 SKM* 3.12% 22.08% 8.34% 1.071 2.255 0.055 0.334 LNS 9.01% 27.62% 12.59% 1.086 2.485 0.061 0.358 Table 2. The values of DFn, DFp, DF,
$ \overline{a_{A}} $ ,$ \xi _{V} $ ,$ \xi _{S} $ , and$ -\mathrm{d}R^{A/D}(x,Q^2)/\mathrm{d}x $ for 48Si obtained with the PKA1, SLy4, SKM*, and LNS N-N interactions.It is worth noting that the existence of bubble structures in the Si isotopes remains an open question. Although early experiments on 34Si suggested a proton central density depletion [42], a recent measurement of the 32Si(d,p)33Si reaction using SOLARIS [57] found a smooth evolution of the spin-orbit splitting that contradicts the prediction of proton central density depletion based on the relativistic mean-field theory. This motivates our theoretical investigation of the potential EMC effect in 48Si, which serves as a benchmark case should such density modifications be realized.
The corresponding
$ a_{A}(r) $ distributions of 48Si are displayed in Fig. 3(c) and closely follow the shape of the total nucleon density$ \rho _{A}(r) $ shown in Fig. 3(b). This confirms that the local nucleon swelling is directly driven by the local density, as expected from T. D. Lee's soliton bag model. The resulting average swelling factor$ \overline{a_{A}} $ , rescaling parameters$ \xi _{V} $ and$ \xi _{S} $ , and EMC slopes$ -\mathrm{d}R^{A/D}(x,Q^2)/ \mathrm{d}x $ are listed in columns 5−8 of Table 2. The corresponding EMC ratios$ R^{A/D} $ for the four interactions are plotted in Fig. 3(d).As shown in Fig. 3, the nucleon density distributions and the corresponding swelling factor distributions are strongly interaction-dependent. For the PKA1, SLy4, and SKM* interactions, a more pronounced bubble structure, characterized by a larger DF value, leads to a larger average nucleon swelling factor
$ \overline{a_{A}} $ and a steeper EMC slope$ -\mathrm{d}R^{A/D}(x,Q^2)/\mathrm{d}x $ , indicating an enhanced EMC effect. This positive correlation between bubble strength and the EMC effect for these three interactions is consistent with the expectation that a stronger central density depression modifies the local environment and amplifies the partonic effect.However, this trend is broken by the LNS interaction, which gives a much weaker bubble (DF = 12.59%) than the PKA1 interaction (DF = 33.33%) but produces the largest
$ \overline{a_{A}} $ and the strongest EMC slope among all four interactions. This apparent anomaly can be understood by examining the overall density scale: as shown in Fig. 3(b), the LNS interaction yields a systematically higher nucleon density across the entire nuclear volume than the other three interactions. Within the framework of T. D. Lee's soliton bag model, the local swelling factor$ a_{A}(r) $ is proportional to the local density, so a globally denser nuclear environment naturally enhances the average nucleon swelling and consequently amplifies the EMC effect, overriding the weaker bubble effect.It is instructive to compare the above results with the phenomenological study of 27Al, where the central density is reduced by increasing the ω parameter while keeping the mass number fixed. In that case, the nucleons are redistributed from the interior to the surface, leading to a decrease in the average nucleon swelling factor
$ \overline{a_{A}} $ and a weakening of the EMC effect. In contrast, for 48Si, different N-N interactions yield distinct ground-state density profiles with different overall density scales, so the bubble strength and the global density are coupled to each other and can not vary independently. The LNS interaction, despite predicting a weaker bubble, produces a higher overall density that enhances the EMC effect. Thus, the apparent difference between the 27Al and 48Si cases arises from the different ways in which the density is modified: density redistribution within a single nucleus versus density variation induced by different effective interactions.At present, 48Si has not yet been experimentally observed, and its predicted half-life is only about 1.9 ms [58], making a direct measurement of its EMC effect with current facilities extremely challenging. Nevertheless, our purpose is to provide a quantitative theoretical benchmark for the EMC effect in exotic nuclear environments with a depleted central density. Such predictions are useful for guiding future experimental efforts at the Electron–Ion Collider (EIC) or the High-Intensity Heavy-Ion Accelerator Facility (HIAF), where rare-isotope beams may become available. Complementary processes, such as the Drell–Yan reaction, could also offer alternative avenues for probing the parton distributions in short-lived nuclei. Therefore, although experimental verification remains a distant goal, this work establishes a clear and testable correlation between nuclear bubble structure and the EMC effect, which we believe is of genuine theoretical interest.
In summary, we have explored the correlation between nuclear bubble structure and the EMC effect within T. D. Lee's soliton bag model and the double Q2-rescaling model. For 27Al, decreasing the central nucleon density through nuclear mass-conserving redistribution reduces the average nucleon swelling factor and the EMC slope, but this approach cannot simultaneously reproduce both the experimental EMC ratios and slopes, suggesting that additional medium effects should be included. For 48Si, we perform SHFB calculations with the SLy4, SKM*, and LNS interactions to obtain the microscopic nucleon densities, while the microscopic density for the PKA1 interaction is taken from the RHFB calculation in Ref. [41]. The results confirm that
$ a_{A}(r) $ follows$ \rho _{A}(r) $ , indicating local-density-driven nucleon swelling. Among the PKA1, SLy4, and SKM* interactions, a stronger bubble correlates with a larger$ \overline{a_{A}} $ and a stronger EMC effect. The LNS interaction, however, breaks this trend: although its bubble is weaker than that of the PKA1 interaction, it produces the largest$ \overline{a_{A}} $ and the steepest EMC slope because of its overall higher density. This highlights that the EMC effect in bubble nuclei is governed not only by bubble strength but also by the global density scale. The strong interaction dependence of the bubble structure further underscores the need for future experimental verification at facilities such as the EIC or HIAF. Therefore, this work provides a quantitative and testable correlation between nuclear bubble structure and the EMC effect, bridging nuclear structure and quark-level dynamics in exotic nuclear environments. -
Since the discovery of the EMC effect [1−3], a series of models have been developed to interpret that effect [4−23]. However, to date no widely accepted model has been proposed. Nowadays, it is believed that the EMC effect arises primarily from the nucleon-nucleon short-range correlation (N-N SRC) [24−28], which was identified experimentally as the nucleon pair with a high relative momentum between the two nucleons and a small center-of-mass momentum of the pair [29, 30]. However, a recent study revealed that there is not a causal connection between the N-N SRC and EMC effect [31]. Therefore, the physical mechanism of the EMC effect remains an open question. Certainly, the relationship between the N-N SRC and EMC effect should be further examined. Moreover, it is necessary to further explore the correlations between other nuclear environments and the EMC effect.
The nucleon density distribution of finite nuclei is one of the most important nuclear media. Decades ago, it was found that the strength of the EMC effect is proportional to the average nuclear density [20, 21, 23]. However, the measurement of 3He and 9Be suggested that the EMC effect is dependent on the local density of a nucleus [32]. Generally, the nucleon density distribution exhibits a characteristic pattern of being dense in the interior and diffuse on the surface. So, it is necessary to explore the correlation between the local nuclear density and EMC effect.
Very recently, a correlation between the nuclear diffuseness and EMC effect has been explored within the T. D. Lee's soliton bag model and double Q2-rescaling model [33], which showed that the average nucleon swelling factor gets smaller and smaller with the increase of diffusion parameter and thus weakens the slope of the EMC ratio [33]. In fact, the central density is more significant for the EMC effect, which is attributed to the following three reasons: (i) At high density, the nucleons overlap more heavily with each other, leading to the temporary high-momentum nucleon pairs and altering the quark distributions. (ii) In denser nuclei, the meson exchange may be enhanced, affecting the quark confinement. (iii) The nucleon swelling is enhanced at high densities.
Nevertheless, researchers have predicted the existence of exotic nuclei exhibiting either a complete vanishing or a substantially reduced central density relative to the nuclear saturation density (
$ \rho_0\approx0.16\mathrm{\ fm}^{-3} $ ) [34−41]. These peculiar nuclear systems are conventionally termed as bubble nuclei due to their distinctive density distributions. Studies indicate that bubble structures arise from the low occupation probability of the s state. The absence of the l=0 orbital contribution leads to a strong drop in the nuclear central density [34−41]. Experimentally, the possible existence of a proton bubble structure was first reported in the doubly magic nucleus 34Si by Mutschler et al. [42], based on the observation of an almost empty proton 2s1/2 orbital. This finding suggests that a depleted central density can significantly affect the nuclear spin-orbit interaction, motivating further investigations of how such exotic density profiles influence the internal quark-gluon structure of nucleons. Therefore, it is interesting to explore the EMC effect caused by modifying the central nucleon density, which not only reveals how the internal quark-gluon structure of nucleons is altered in low-density nuclear environments, but also provides experimental benchmarks for lattice QCD calculations under non-uniform density conditions. Therefore, such a study bridges nuclear structure physics and quark-level dynamics, offering a new perspective on how quark confinement and many-body effects manifest in exotic nuclear geometries. So, based on our recent work for the EMC effect influenced by the nuclear diffuseness [33], in this letter we will discuss the correlation between the EMC effect and depleted central density within the soliton bag model proposed by T. D. Lee [43] and double Q2-rescaling model [44, 45].In the T. D. Lee's soliton bag model, it is assumed that there exists a phenomenological scalar field [43]
$ \begin{split} \sigma = \sigma_{{\rm{vac}}}(1 - \kappa), \end{split} $
(1) where outside the nucleon bag, the color dielectric constant
$ \kappa = 0 $ and$ \sigma = \sigma_{{\rm{vac}}} $ ; inside the bag,$ \kappa = 1 $ and$ \sigma = 0 $ . The potential energy of the σ field satisfies$ V(\sigma_{{\rm{vac}}}) = 0 $ and$ V(0) = B_0 $ [43], which is shown in Fig. 1. The pressure difference$ B_0 $ between the interior and exterior balances the pressure from the color field inside the bag, determining the free nucleon bag radius.
Figure 1. The potential energy curve V(σ) of the scalar field σ.
In a nucleus, the color dielectric constant outside the nucleon bag under investigation is no longer
$ \kappa = 0 $ , but rather the volume-weighted average of the space occupied by the remaining (A-1) nucleon bags ($ \kappa = 1 $ ) and the space unoccupied by the nucleons ($ \kappa = 0 $ ). The effective color dielectric constant$ \kappa_A $ is determined by [46−48]$ \begin{split} \kappa _{A}=\dfrac{A^{\alpha }-1}{\dfrac{3A^{\alpha }}{4\pi \rho _{A}R_{A}^{3}} -1}, \end{split} $
(2) where
$ \rho _{A} $ is the average density of the nucleon number and α is a parameter that is less than 1.0.The nucleon density inside a nucleus can be described by the following three-parameter Fermi type distribution
$ \begin{split} \rho _{A}(r)=\dfrac{(1+\dfrac{\omega r^{2}}{c^{2}})\rho _{0}}{1+\exp (\dfrac{r-c }{a_{d}})}, \end{split} $
(3) where
$ \rho_0 $ is the saturation density, the diffusion parameter ad is taken as 0.54 fm and the half-density radius$ c=r_{0}A^{1/3}\left( 1-\dfrac{\pi ^{2}a_{d}^{2}}{3r_{0}^{2}}A^{-2/3}\right) $ with$ r_{0}=1.07 $ fm. The parameter ω (>0) affects the central density and the depression in the central density increases with the ω rising.Moreover, the nuclear mass is conserved by the following condition
$ \begin{split}4\pi\int_0^{+\infty}\rho_A(r)r^2\mathrm{d}r=A.\end{split} $
(4) Usually, the bubble structure is quantified by the depletion fraction (DF) [34−41].
$ \begin{split} DF=\frac{\rho _{\max }-\rho _{c}}{\rho _{\max }}, \end{split} $
(5) where
$ \rho _{\max } $ and$ \rho _{c} $ denote the nucleon densities at the maximum and at the nuclear center (r = 0), respectively.Furthermore, the nucleon density distribution of a nucleus can be calculated consistently using microscopic nuclear many-body theories [34−41].
Considering the saturation property and short-range nature of the nuclear force, it is assumed that a nucleon at a distance r from the nuclear center is influenced only by the surrounding nucleons and the physical vacuum within a small spherical volume
$ \Delta V $ . The$ \kappa_A $ value outside this nucleon is the average over the$ \kappa = 1 $ and$ \kappa = 0 $ regions within$ \Delta V $ .$ \begin{split} \kappa _{A}(r)= &\frac{1}{\Delta V}\int_{\Delta V}\frac{4\pi }{3}R_{A}^{3}( {\boldsymbol{r}}+{\boldsymbol{r}}_{1})\rho _{A}({\boldsymbol{r}}+{\boldsymbol{r}}_{1}){\mathrm{d}}\tau \\ =& \frac{4\pi }{3}R_{A}^{3}(r)\rho _{A}(r). \end{split} $
(6) Thus,
$ \kappa_A(r) $ is proportional to the local nucleon density$ \rho_A(r) $ and the nucleon bag volume.In the nuclear interior, the effective scalar field outside the nucleon bag decreases from
$ \sigma_{{\rm{vac}}} $ to$ \sigma_A $ [46−48], as shown in Fig. 1. Correspondingly, the V(σ) outside the bag changes from m to n. The difference between the value of V(σ) at$ \sigma=\sigma_A $ and that at$ \sigma=0 $ (BA=B0–$ \Delta B_{A} $ ) is the effective bag constant, which is reduced by$ \Delta B_A $ relative to that of a free nucleon. This implies that the external pressure is reduced by$ \Delta B_A $ , causing the bag to expand.Expanding
$ V(\sigma_A) $ in a Taylor series about$ \sigma_{{\rm{vac}}} $ and retaining the first two non-zero terms yield$ \begin{split} V(\sigma_A)= & \Delta B_A=b_1(\sigma_A-\sigma_{\mathrm{vac}})^2+b_2(\sigma_A-\sigma_{\mathrm{vac}})^3 \\ = & G_1\kappa_A^2(r)-G_2\kappa_A^3(r). \end{split} $
(7) The pressure balance condition between the interior and exterior of the bag is given by [46−48].
$ \begin{split} \Delta B_A = \frac{3M_0 R_0}{16\pi} \left(\frac{1}{R_0^4} - \frac{1}{R_A^4}\right). \end{split} $
(8) Using Eqs. (6)–(8), the following equation can be derived.
$ \begin{split} \frac{1024\pi ^{4}}{81M_{0}}B_{2}\rho _{A}^{3}(r)a_{A}^{13}(r)-\frac{256\pi ^{3}}{27M_{0}}B_{1}\rho _{A}^{2}(r)a_{A}^{10}(r)+a_{A}^{4}(r)-1=0, \end{split} $
(9) where B1=G1
$ R_{0}^{9} $ =0.0504 GeV fm6 and B2=G2$ R_{0}^{12} $ =0.0260 GeV fm9 [48], and$ a_A(r) = R_A(r)/R_0 $ is the nucleon swelling factor. By solving Eq. (9),$ a_{A}(r) $ can be determined.Furthermore, the average
$ a_{A}(r) $ is defined as$ \begin{split}\overline{a_A}=\frac{1}{A}\int_0^{\infty}4\pi r^2\rho_A(r)a_A(r)\, \mathrm{d}r.\end{split} $
(10) In the framework of the double Q2-rescaling model [44, 45], the average nucleon structure function in a nucleus is
$ \begin{split} F_{2}^{A}(x, Q^{2}) =& \sum_{i} e_{i}^{2} x \left[ q_{Vi}^{N}(x, \xi_{V}Q^{2}) + q_{Si}^{N}(x, \xi_{S}Q^{2}) \right.\\&\left.+ \bar{q}_{Si}^{N}(x, \xi_{S}Q^{2}) \right], \end{split} $
(11) where
$ q_{Vi}^{N}(x,\xi _{V}Q^{2}) $ ,$ q_{Si}^{N}(x,\xi _{S}Q^{2}) $ , and$ \overline{\mathit{q}}_{Si}^{N}(x,\xi _{S}Q^{2}) $ denote the momentum distribution functions of valence quarks, sea quarks, and anti-sea quarks of flavor i in a bound nucleon. x denotes the Bjorken scaling variable.$ \xi _{V} $ and$ \xi _{S} $ are rescaling parameters whose values are estimated using the following empirical formulas [33]$ \begin{split} \xi _{V} &=9.3393\left( 1-\frac{1}{\overline{a_{A}}}\right) ^{1/2}+0.0333\ln A-0.2731, \end{split} $
(12) $ \begin{split} \xi _{S} &=-0.0175\left( 1-\frac{1}{\overline{a_{A}}}\right)^{-1/2} -0.0230\ln A+0.2117. \end{split} $
(13) The empirical parameters in Eqs. (12) and (13) were obtained by fitting the experimental EMC ratios for several medium-to-heavy nuclei within the double Q2-rescaling model, as described in Ref. [33].
The EMC effect can be quantified by the following ratio
$ \begin{split} R^{A/D}(x, Q^{2}) = \frac{F_{2}^{A}(x, Q^{2})}{F_{2}^{D}(x, Q^{2})}. \end{split} $
(14) Here, the denominator is the deuteron nucleon structure function.
From the above discussion, it can be seen that the value of
$ \overline{a_{A}} $ changes as the parameter ω varies. As a result, the corresponding rescaling parameters$ \xi _{V} $ and$ \xi _{S} $ , as well as the EMC ratio, also change.First, taking 27Al as an example, we calculate the nucleon density distributions with Eq. (3) and the corresponding
$ a_{A}(r) $ distributions for different values of ω, which are plotted in Figs. 2(a) and 2(b), respectively. It should be emphasized that 27Al is not predicted to be a bubble nucleus. The parameter ω introduced in Eq. (3) can phenomenologically modify the central density, allowing us to explore the sensitivity of the EMC effect to density depletion in a well-controlled manner. The bubble structure obtained at some values of ω should not be interpreted as a physical realization in 27Al. Using Eq. (5), the DF values are calculated and shown in column 2 of Table 1. From Table 1, one can see that the DF values rise gradually with increasing ω. This indicates that the bubble structure of 27Al becomes progressively more evident.
Figure 2. (color online) The nucleon density distributions
$ \rho _{A}(r) $ (a), the corresponding nucleon swelling factor distributions$ a_{A}(r) $ (b), and the computed EMC ratios$ R^{A/D}(x,Q^{2}) $ (c) for 27Al as functions of r for different ω values. The open and solid circles represent the experimental data from the SLAC-E139 [21] and CLAS [28] collaborations, respectively.From Fig. 2, we can see that the distribution of
$ a_{A}(r) $ is similar to that of$ \rho _{A}(r) $ . This means that, in regions with a higher nucleon density, the nucleon swelling is greater, and vice versa. Moreover, it can be seen that the central density decreases gradually with increasing ω because some interior nucleons must be scattered to the surface due to the mass conservation constraint in Eq. (4). As a result, the$ a_{A}(r) $ value in the central region continuously decreases. When more nucleons are scattered to the nuclear surface, the nucleus as a whole becomes more loosely bound. Consequently, the value of$ \overline{a_{A}} $ gradually decreases with increasing ω, as can be seen clearly from column 3 of Table 1.ω DF $ \overline{a_{A}} $ $ \xi _{V} $ $ \xi _{S} $ - $ \mathrm{d}R^{A/D}(x,Q^2)/\mathrm{d}x $ 0.00 0.00% 1.084 2.432 0.073 0.348 0.15 0.00% 1.066 2.168 0.066 0.319 0.30 1.38% 1.052 1.918 0.057 0.287 0.60 8.70% 1.041 1.696 0.048 0.253 1.20 25.10% 1.031 1.464 0.035 0.213 2.40 47.38% 1.022 1.207 0.017 0.162 Table 1. The depletion fraction DF, average nucleon swelling factor
$ \overline{a_{A}} $ , rescaling parameters$ \xi _{V} $ and$ \xi _{S} $ , and the slope of the EMC ratio,$ -\mathrm{d}R^{A/D}(x,Q^2)/\mathrm{d}x $ , for 27Al at different ω values.Next, the rescaling parameters
$ \xi _{V} $ and$ \xi _{S} $ for different values of ω are extracted using Eqs. (12) and (13) by inputting different values of$ \overline{a_{A}} $ . Columns 4 and 5 of Table 1 show the$ \xi _{V} $ and$ \xi _{S} $ values of 27Al for different values of ω. By comparing the$ \xi _{V} $ and$ \xi _{S} $ values listed in columns 4 and 5 of Table 1, one can see that the$ \xi _{V} $ value is much larger than the$ \xi _{S} $ value for any value of ω. This indicates that the contribution of valence quarks to the EMC effect is much more important than that of the sea and anti-sea quarks. This result is consistent with the interpretation that nuclear binding primarily modifies the valence quark momentum distributions and with the conclusions of previous studies [26, 49, 50]. In addition, one can see that the$ \xi _{V} $ and$ \xi _{S} $ values gradually decrease with increasing ω. This implies that the EMC ratio may be weakened by the decreasing$ \xi _{V} $ and$ \xi _{S} $ values, as will be shown in the next paragraph.Using the double Q2-rescaling model with the
$ \xi _{V} $ and$ \xi _{S} $ values extracted from Eqs. (12) and (13), the EMC ratios of 27Al for different values of ω are calculated and shown in Fig. 2(c). It can be seen that the calculated EMC ratio gradually approaches the experimental data as ω increases. In addition, we estimate the slope of the EMC ratio (-$ \mathrm{d}R^{A/D}(x,Q^2)/\mathrm{d}x $ ), and the corresponding values are listed in the last column of Table 1. One can see that the value of -$ \mathrm{d}R^{A/D}(x,Q^2)/\mathrm{d}x $ becomes progressively smaller as ω increases. However, the measurement by the CLAS collaboration suggested that the value of -$ \mathrm{d}R^{A/D}(x,Q^2)/\mathrm{d}x $ for 27Al is 0.347$ \pm 0.022 $ [28]. By comparing the calculated -$ \mathrm{d}R^{A/D}(x,Q^2)/\mathrm{d}x $ values listed in Table 1 with the corresponding experimental data, we find that when the calculated$ R^{A/D} $ (x,Q2) best matches the experimental data, the corresponding -$ \mathrm{d}R^{A/D}(x,Q^2)/\mathrm{d}x $ fails to agree well with the experimental slope. Meanwhile, when the calculated -$ \mathrm{d}R^{A/D}(x,Q^2)/\mathrm{d}x $ values show good agreement with the experimental measurements, the$ R^{A/D} $ (x,Q2) values deviate from the experimental data. Therefore, adjusting only the ω parameter is insufficient to reproduce the experimental EMC ratios and the corresponding slope values simultaneously. It seems that other nuclear medium effects, such as the N-N SRC [24, 25], the α-cluster effect on the nuclear surface [32], coupling between the isovector-vector mean field and the quarks [51], and nucleon electromagnetic form factors [52], should be taken into account.Note that, very recently, we investigated the correlation between the nuclear diffuseness ad and the EMC effect [33] and showed that the average nucleon swelling factor
$ \overline{a_{A}} $ and the rescaling parameters$ \xi _{V} $ and$ \xi _{S} $ decrease progressively with increasing ad. Furthermore, the value of$ -\mathrm{d}R^{A/D}(x,Q^2)/\mathrm{d}x $ is reduced as ad increases. A comparison between our current work and our recent study shows that the conclusion of this article is similar to that of our recent work [33]. In our recent work, the central density gradually decreases with increasing ad. However, in this work, we observe an increase in the surface diffuseness through a reduction in the central nuclear density. Thus, these two approaches are essentially linked to each other.In general, bubble structures have been predicted to exist in 22O, 34Si, 46Ar, and 206Hg [34−41]. However, these are proton bubble nuclei. When the neutron density distribution is included, the bubble structure almost disappears overall. Therefore, the EMC effect caused by the proton bubble structure is not significant. Recently, 48Si was predicted to be a candidate dual semi-bubble nucleus, with both neutron and proton bubble-like structures, using the RHFB theory with the PKA1 nucleon-nucleon (
$ N-N $ ) interaction [41]. To further test the possibility of the dual semi-bubble structure in 48Si, we calculate its neutron density$ \rho _{n}(r) $ , proton density$ \rho _{p}(r) $ , and nucleon density$ \rho _{A}(r) $ ($ \rho _{A}(r) $ =$ \rho _{n}(r) $ +$ \rho _{p}(r) $ ) using the SHFB theory [53] with the SLy4 [54], SKM* [55], and LNS$ N-N $ interactions [56]. The results are shown in Figs. 3(a) and 3(b). Note that, in our calculations, we use a mixed density-dependent δ interaction for the pairing channel [53]:$ V_{\rm pair}=\left( t_{0}^{\prime }+\dfrac{ t_{3}^{\prime }}{6}\rho ^{\gamma ^{\prime }}\right) \delta $ , where ρ is the isoscalar local density,$ \gamma ^{^{\prime }}=1 $ , and$ t_{3}^{^{\prime }}=-37.5t_{0}^{^{\prime }} $ .$ t_{0}^{^{\prime }} $ is the pairing strength and is determined, together with a certain cutoff quasiparticle energy, by the mean neutron pairing energy gap of 120Sn (1.31 MeV) [53]. For the SLy4, SKM*, and LNS interactions, the corresponding$ t_{0}^{^{\prime }} $ values are determined to be -287.74, -239.18, and -254.80 MeV fm−3, respectively.
Figure 3. (color online) The calculated neutron density distribution
$ \rho _{n}(r) $ and proton density distribution$ \rho _{p}(r) $ of 48Si obtained with the PKA1, SLy4, SKM*, and LNS$ N{\rm{-}}N $ interactions are shown in (a), where the symbols "n'' and "p'' denote neutrons and protons, respectively. The corresponding nucleon density distribution$ \rho _{A}(r) $ (b), nucleon swelling factor distribution$ a_{A}(r) $ (c), and EMC ratio$ R^{A/D}(x,Q^{2}) $ (d) are also shown. The$ \rho _{n}(r) $ ,$ \rho _{p}(r) $ , and$ \rho _{A}(r) $ values for the PKA1 interaction are taken from the RHFB calculation in Ref. [41], whereas those for the SLy4, SKM*, and LNS interactions are obtained from our SHFB calculations.Using Eq. (5), we extract the neutron depletion fraction DFn, proton depletion fraction DFp, and nucleon depletion fraction DF for the four selected N-N interactions. These values are compiled in columns 2−4 of Table 2. Among these interactions, PKA1 produces the most pronounced bubble structure, as indicated by the largest DF values. Furthermore, for each interaction, the proton bubble is consistently stronger than the neutron bubble, as can be seen from the different radial density distributions of protons and neutrons in 48Si.
$ N-N $ interactionsDFn DFp DF $ \overline{a_{A}} $ $ \xi _{V} $ $ \xi _{S} $ - $ \mathrm{d}R^{A/D}(x,Q^2)/\mathrm{d}x $ PKA1 26.68% 43.86% 33.33% 1.082 2.427 0.059 0.353 SLy4 0.66% 25.62% 5.90% 1.069 2.221 0.054 0.330 SKM* 3.12% 22.08% 8.34% 1.071 2.255 0.055 0.334 LNS 9.01% 27.62% 12.59% 1.086 2.485 0.061 0.358 Table 2. The values of DFn, DFp, DF,
$ \overline{a_{A}} $ ,$ \xi _{V} $ ,$ \xi _{S} $ , and$ -\mathrm{d}R^{A/D}(x,Q^2)/\mathrm{d}x $ for 48Si obtained with the PKA1, SLy4, SKM*, and LNS N-N interactions.It is worth noting that the existence of bubble structures in the Si isotopes remains an open question. Although early experiments on 34Si suggested a proton central density depletion [42], a recent measurement of the 32Si(d,p)33Si reaction using SOLARIS [57] found a smooth evolution of the spin-orbit splitting that contradicts the prediction of proton central density depletion based on the relativistic mean-field theory. This motivates our theoretical investigation of the potential EMC effect in 48Si, which serves as a benchmark case should such density modifications be realized.
The corresponding
$ a_{A}(r) $ distributions of 48Si are displayed in Fig. 3(c) and closely follow the shape of the total nucleon density$ \rho _{A}(r) $ shown in Fig. 3(b). This confirms that the local nucleon swelling is directly driven by the local density, as expected from T. D. Lee's soliton bag model. The resulting average swelling factor$ \overline{a_{A}} $ , rescaling parameters$ \xi _{V} $ and$ \xi _{S} $ , and EMC slopes$ -\mathrm{d}R^{A/D}(x,Q^2)/ \mathrm{d}x $ are listed in columns 5−8 of Table 2. The corresponding EMC ratios$ R^{A/D} $ for the four interactions are plotted in Fig. 3(d).As shown in Fig. 3, the nucleon density distributions and the corresponding swelling factor distributions are strongly interaction-dependent. For the PKA1, SLy4, and SKM* interactions, a more pronounced bubble structure, characterized by a larger DF value, leads to a larger average nucleon swelling factor
$ \overline{a_{A}} $ and a steeper EMC slope$ -\mathrm{d}R^{A/D}(x,Q^2)/\mathrm{d}x $ , indicating an enhanced EMC effect. This positive correlation between bubble strength and the EMC effect for these three interactions is consistent with the expectation that a stronger central density depression modifies the local environment and amplifies the partonic effect.However, this trend is broken by the LNS interaction, which gives a much weaker bubble (DF = 12.59%) than the PKA1 interaction (DF = 33.33%) but produces the largest
$ \overline{a_{A}} $ and the strongest EMC slope among all four interactions. This apparent anomaly can be understood by examining the overall density scale: as shown in Fig. 3(b), the LNS interaction yields a systematically higher nucleon density across the entire nuclear volume than the other three interactions. Within the framework of T. D. Lee's soliton bag model, the local swelling factor$ a_{A}(r) $ is proportional to the local density, so a globally denser nuclear environment naturally enhances the average nucleon swelling and consequently amplifies the EMC effect, overriding the weaker bubble effect.It is instructive to compare the above results with the phenomenological study of 27Al, where the central density is reduced by increasing the ω parameter while keeping the mass number fixed. In that case, the nucleons are redistributed from the interior to the surface, leading to a decrease in the average nucleon swelling factor
$ \overline{a_{A}} $ and a weakening of the EMC effect. In contrast, for 48Si, different N-N interactions yield distinct ground-state density profiles with different overall density scales, so the bubble strength and the global density are coupled to each other and can not vary independently. The LNS interaction, despite predicting a weaker bubble, produces a higher overall density that enhances the EMC effect. Thus, the apparent difference between the 27Al and 48Si cases arises from the different ways in which the density is modified: density redistribution within a single nucleus versus density variation induced by different effective interactions.At present, 48Si has not yet been experimentally observed, and its predicted half-life is only about 1.9 ms [58], making a direct measurement of its EMC effect with current facilities extremely challenging. Nevertheless, our purpose is to provide a quantitative theoretical benchmark for the EMC effect in exotic nuclear environments with a depleted central density. Such predictions are useful for guiding future experimental efforts at the Electron–Ion Collider (EIC) or the High-Intensity Heavy-Ion Accelerator Facility (HIAF), where rare-isotope beams may become available. Complementary processes, such as the Drell–Yan reaction, could also offer alternative avenues for probing the parton distributions in short-lived nuclei. Therefore, although experimental verification remains a distant goal, this work establishes a clear and testable correlation between nuclear bubble structure and the EMC effect, which we believe is of genuine theoretical interest.
In summary, we have explored the correlation between nuclear bubble structure and the EMC effect within T. D. Lee's soliton bag model and the double Q2-rescaling model. For 27Al, decreasing the central nucleon density through nuclear mass-conserving redistribution reduces the average nucleon swelling factor and the EMC slope, but this approach cannot simultaneously reproduce both the experimental EMC ratios and slopes, suggesting that additional medium effects should be included. For 48Si, we perform SHFB calculations with the SLy4, SKM*, and LNS interactions to obtain the microscopic nucleon densities, while the microscopic density for the PKA1 interaction is taken from the RHFB calculation in Ref. [41]. The results confirm that
$ a_{A}(r) $ follows$ \rho _{A}(r) $ , indicating local-density-driven nucleon swelling. Among the PKA1, SLy4, and SKM* interactions, a stronger bubble correlates with a larger$ \overline{a_{A}} $ and a stronger EMC effect. The LNS interaction, however, breaks this trend: although its bubble is weaker than that of the PKA1 interaction, it produces the largest$ \overline{a_{A}} $ and the steepest EMC slope because of its overall higher density. This highlights that the EMC effect in bubble nuclei is governed not only by bubble strength but also by the global density scale. The strong interaction dependence of the bubble structure further underscores the need for future experimental verification at facilities such as the EIC or HIAF. Therefore, this work provides a quantitative and testable correlation between nuclear bubble structure and the EMC effect, bridging nuclear structure and quark-level dynamics in exotic nuclear environments.
Correlation between nuclear bubble structure and EMC effect
- Received Date: 2026-05-27
- Available Online: 2026-11-15
Abstract: The correlation between the nuclear bubble structure and the EMC effect is investigated within the framework of T. D. Lee's soliton bag model and the double Q2-rescaling model. For 27Al, we artificially reduce its central density via a three-parameter Fermi distribution of nucleon density while conserving the mass number. It is found that as the central density decreases, nucleons are redistributed from the interior to the surface, leading to a systematic reduction in the average nucleon swelling factor, rescaling parameters and the EMC slope. However, this single-parameter modification fails to simultaneously reproduce both the magnitude and the slope of the experimental EMC ratio within the same parameter set, suggesting that additional nuclear medium effects must be considered. For the density distributions of the candidate bubble nucleus 48Si, we calculate them by the Skyrme-Hartree-Fock-Bogoliubov (SHFB) theory with the SLy4, SKM* and LNS interactions, while the density profiles given by the PKA1 interaction are taken from the relativistic Hartree-Fock-Bogoliubov (RHFB) calculation (Phys. Lett. B 788, 192 (2019)). Among the PKA1, SLy4 and SKM* interactions, a stronger bubble structure correlates with a larger nucleon swelling factor and a stronger EMC effect. The LNS interaction, however, presents an exception: despite having a weaker bubble, it yields the largest EMC effect, owing to its systematically higher overall nuclear density. This demonstrates that the EMC effect in bubble nuclei depends on both the bubble strength and the global density scale set by the effective interaction.



 DownLoad: