


 Abstract
 HTML
 Reference
 Related
 PDF



-
Neon is a chemically inert gas element. Natural neon consists predominantly of 20Ne (90.48%), with smaller contributions from 21Ne (0.27%) and 22Ne (9.25%).
The 20Ne(n, α)17O reaction (Q = – 0.587 MeV) is of considerable interest for studies of neutron-induced reactions on light nuclei. Owing to its relatively simple nuclear structure and the presence of several reaction channels, this reaction provides a valuable testing ground for nuclear reaction mechanisms, including compound-nucleus, pre-equilibrium, and direct reaction mechanisms [1]. For light nuclei, the relatively low-level density and the importance of individual discrete levels make statistical-model calculations less strongly averaged than in heavier nuclei. For neutron-induced (n, α) reactions on light nuclei, the neutron and α-particle optical-model potentials determine the entrance-channel and exit-channel transmission coefficients, while the level-density model and width-fluctuation correction affect the statistical decay of the compound nucleus and the branching among the open channels. Therefore, reliable cross sections, especially for state-resolved α-emission channels, are essential for constraining the data in evaluated nuclear data libraries and improving the description of neutron-induced reactions in the light-mass region. In addition, this reaction is the inverse of the astrophysical neutron source reaction 17O(α, n)20Ne, which impacts on the weak s process in massive stars [2–5]. The study of the 20Ne(n, α)17O reaction can provide complementary information on the compound nucleus 21Ne and on the reaction mechanisms in both forward and inverse processes. Possible α-cluster configurations in 20Ne and 21Ne have been discussed in previous studies [6,7]. While the present measurement does not provide a direct test of these cluster configurations, the state-resolved 20Ne(n, αi)17O cross sections offer useful experimental information on α-emission branching and reaction-channel competition in the 21Ne compound system.
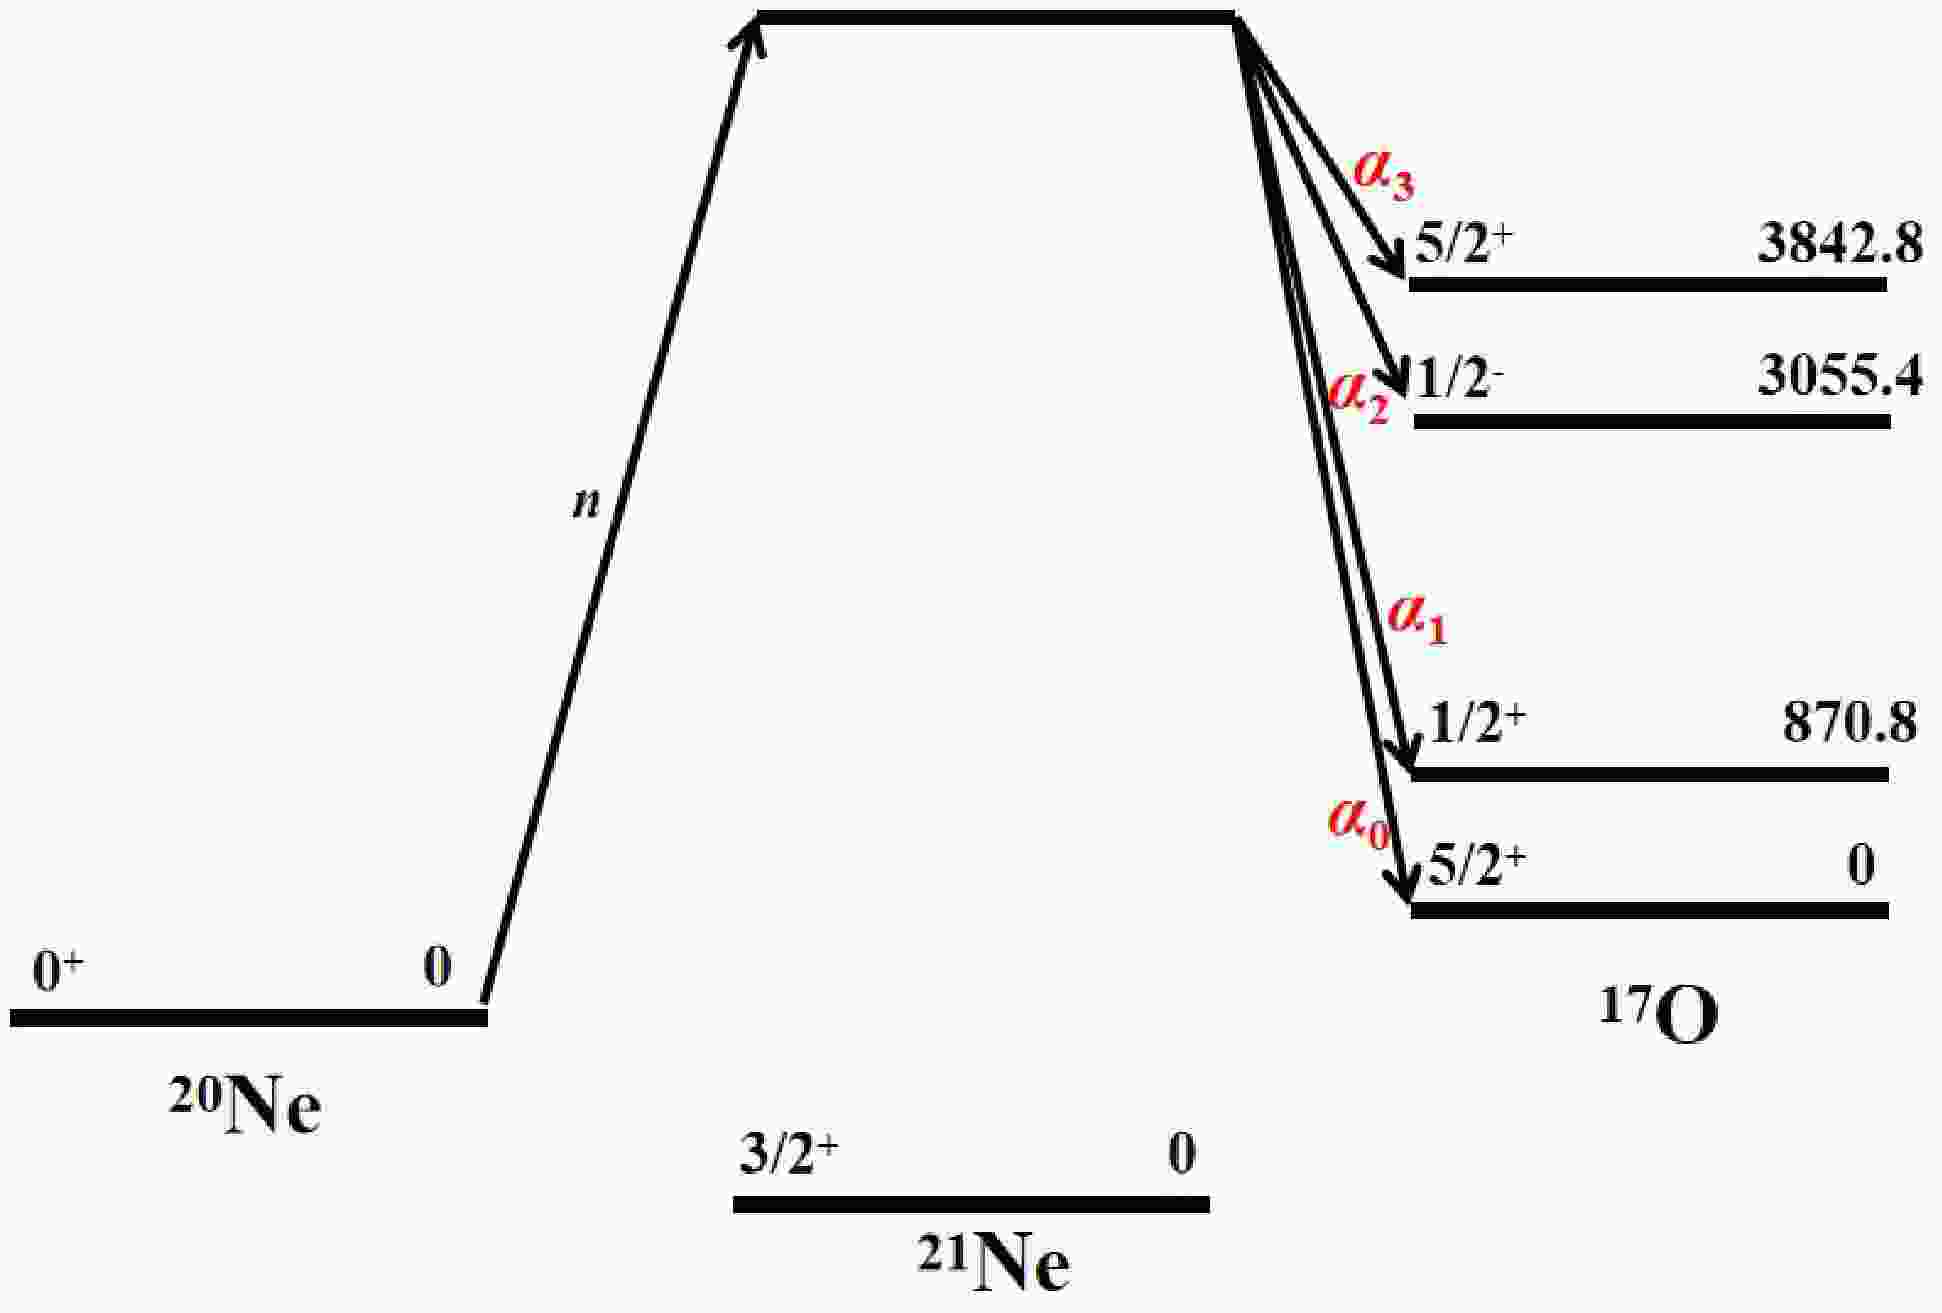
In the neutron-energy region below 12 MeV, the 20Ne(n, α)17O reaction can be described mainly by the formation and decay of the compound nucleus 21Ne, with α-particle emission populating the ground and low-lying excited states of 17O [8]. As shown in Fig. 1, the 20Ne(n, α)17O reaction can be divided into partial channels 20Ne(n, αi)17O (i=0,1,2,3) according to the final states populated in the residual nucleus 17O. Because these low-lying states are well separated in energy, the corresponding α events can be distinguished experimentally, allowing state-resolved cross sections to be extracted.
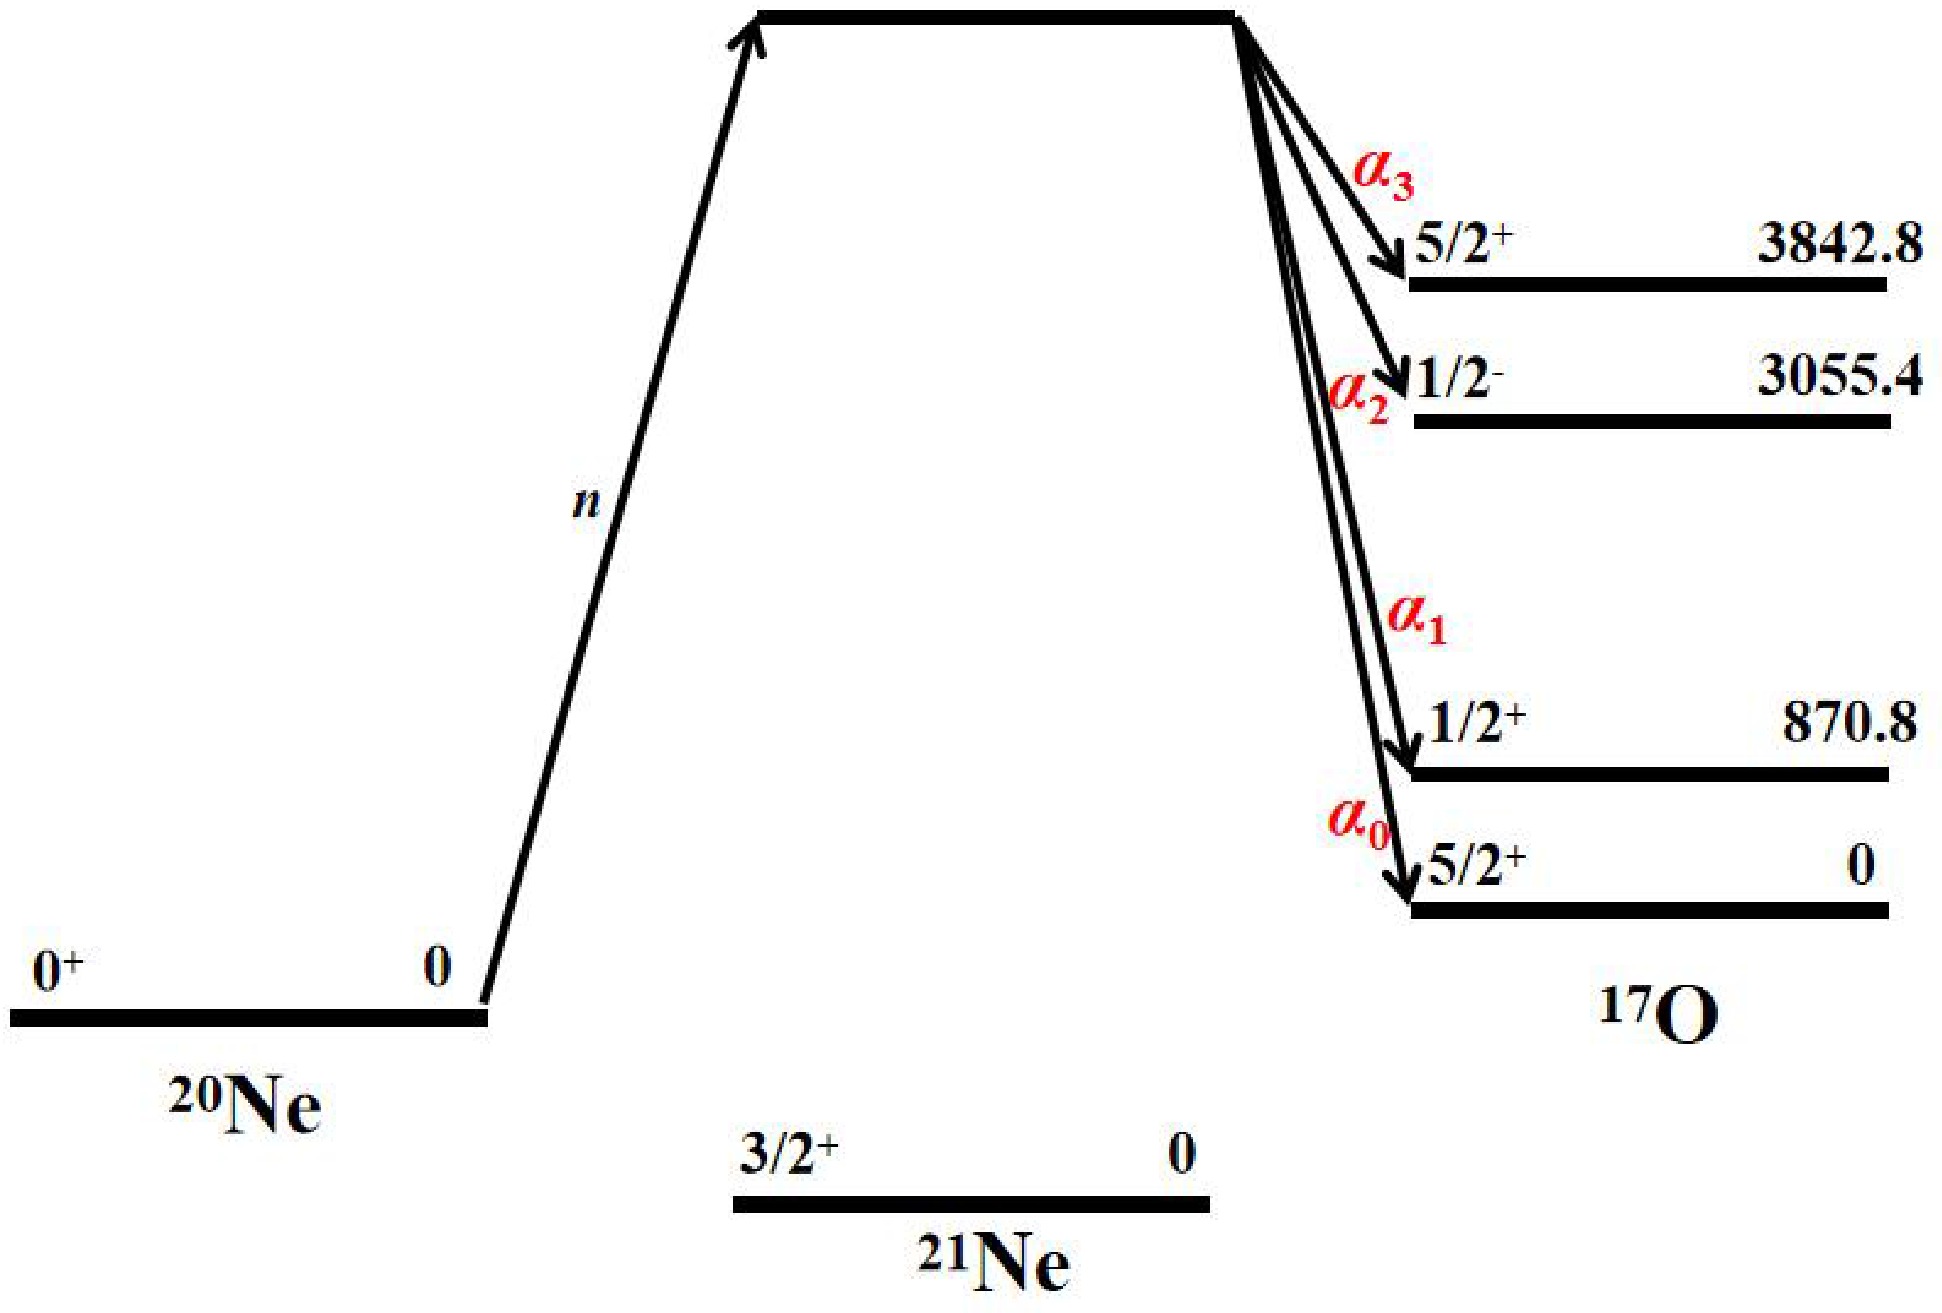
Figure 1. (color online) Schematic level scheme of the 20Ne(n, α)17O reaction through the compound nucleus 21Ne.
Previous measurements of the 20Ne(n, α)17O reaction are rather limited and cover only selected neutron energy regions. Owing to the difficulty of preparing solid neon targets, all existing measurements utilized neon gas as an active target within ionization chambers or in gridded ionization chambers. Johnson et al. [9] measured the 20Ne(n, α)17O reaction cross section below about 3.4 MeV. Bell et al. [10] extended the measurements to the 2.8–4.4 MeV region and obtained partial cross sections for the α0 and α1 channels. Shamu et al. [11] further measured the α0, α1, α2 and α3 partial cross sections between 6.2 and 9.6 MeV, while only the summed α0+α1 cross sections were reported in the higher neutron energy region from 9.6 to 10.7 MeV. Although these measurements provided valuable information on the excitation functions of the 20Ne(n, α)17O reaction, the detector efficiencies and background contributions were not fully evaluated in the earlier works, which may have introduced sizable systematic uncertainties. Measurements near 14 MeV were later reported including the works of Cevolani et al. [12], McDicken et al. [13], Kardonsky et al. [14], and Lin et al. [15]. A recent measurement was performed by Khryachkov et al. (2012) [16] in the neutron-energy range from 4 to 7 MeV using a gridded ionization chamber filled with a Kr + Ne + CO2 gas mixture. The α0, α1, α2 and α3 channels were identified by using the anode pulse height versus the anode signal rise time two-dimensional spectra. The influence of the pulse-height-defect (PHD) effect was present and discussed. Nevertheless, the separation of neighboring α particle groups remains challenging because of the overlap of the event regions in the two-dimensional spectra.
Due to the scarcity of experimental data, sizable discrepancies exist among different evaluated nuclear data libraries for the total 20Ne(n, α)17O reaction cross section, where the state-resolved channels are not distinguished [17]. This discrepancy is especially evident between ENDF/B-VIII.1 and JENDL-5 [17]. For the state-resolved channels, the available information in the evaluation libraries is even more limited. Among all of the evaluation libraries, only JENDL-5 [18] provides separate cross sections for the α0, α1, α2 and α3 channels. Therefore, new experimental cross sections for state-resolved reaction channels are needed to test and improve reaction-model calculations.
In recent years, our group has developed a measurement method based on the gas-sample and the gridded ionization chamber, neutron collimator, and detailed Monte Carlo simulations [19,20]. This method has been successfully applied in measurements of (n, α) reactions on light nuclei, including the 14N(n, α)11B [19] and 16O(n, α)13C [20]reactions. Our measurement method incorporates corrections for detector efficiency, background interference, the non-uniformity of neutron-field distribution, and low-energy neutron interference. In the present work, this method was further applied to the 20Ne(n, α)17O reaction. A twin gridded ionization chamber filled with a neon-based gas mixture was used, with natural neon component serving as the reaction sample. The cross sections for the 20Ne(n, αi)17O (i=0,1,2,3) reaction channels were obtained in the neutron energy region of 8.9–11.5 MeV (11 energy points). In addition, because the α0 and α1 event regions are closely situated to each other in the measured spectra, the summed 20Ne(n, α0+α1)17O cross sections were also determined from the combined α0+α1 yields to provide a more reliable quantity for comparison with previous measurement and evaluation data. Compared with previous measurements, the present work provides state-resolved experimental cross section data for the α0, α1, α2 and α3 channels from 9.6 to 11.5 MeV. Above 9.6 MeV, previous experimental data are only the summed α0+α1 cross sections reported by Shamu et al. [11]. The experimental setup of the present work is described in Sec. II, the data analysis is shown in Sec. III, the results are presented in Sec. IV, and the conclusions are drawn in the final section.
-
The experiments were performed using the HI-13 tandem accelerator at the China Institute of Atomic Energy (CIAE). As shown in Fig. 2, the experimental setup includes four parts: the neutron source, the neutron collimator, the twin gridded ionization chamber (GIC) for charged particle detection, and the EJ-309 liquid scintillator for measurement of the neutron energy spectra.
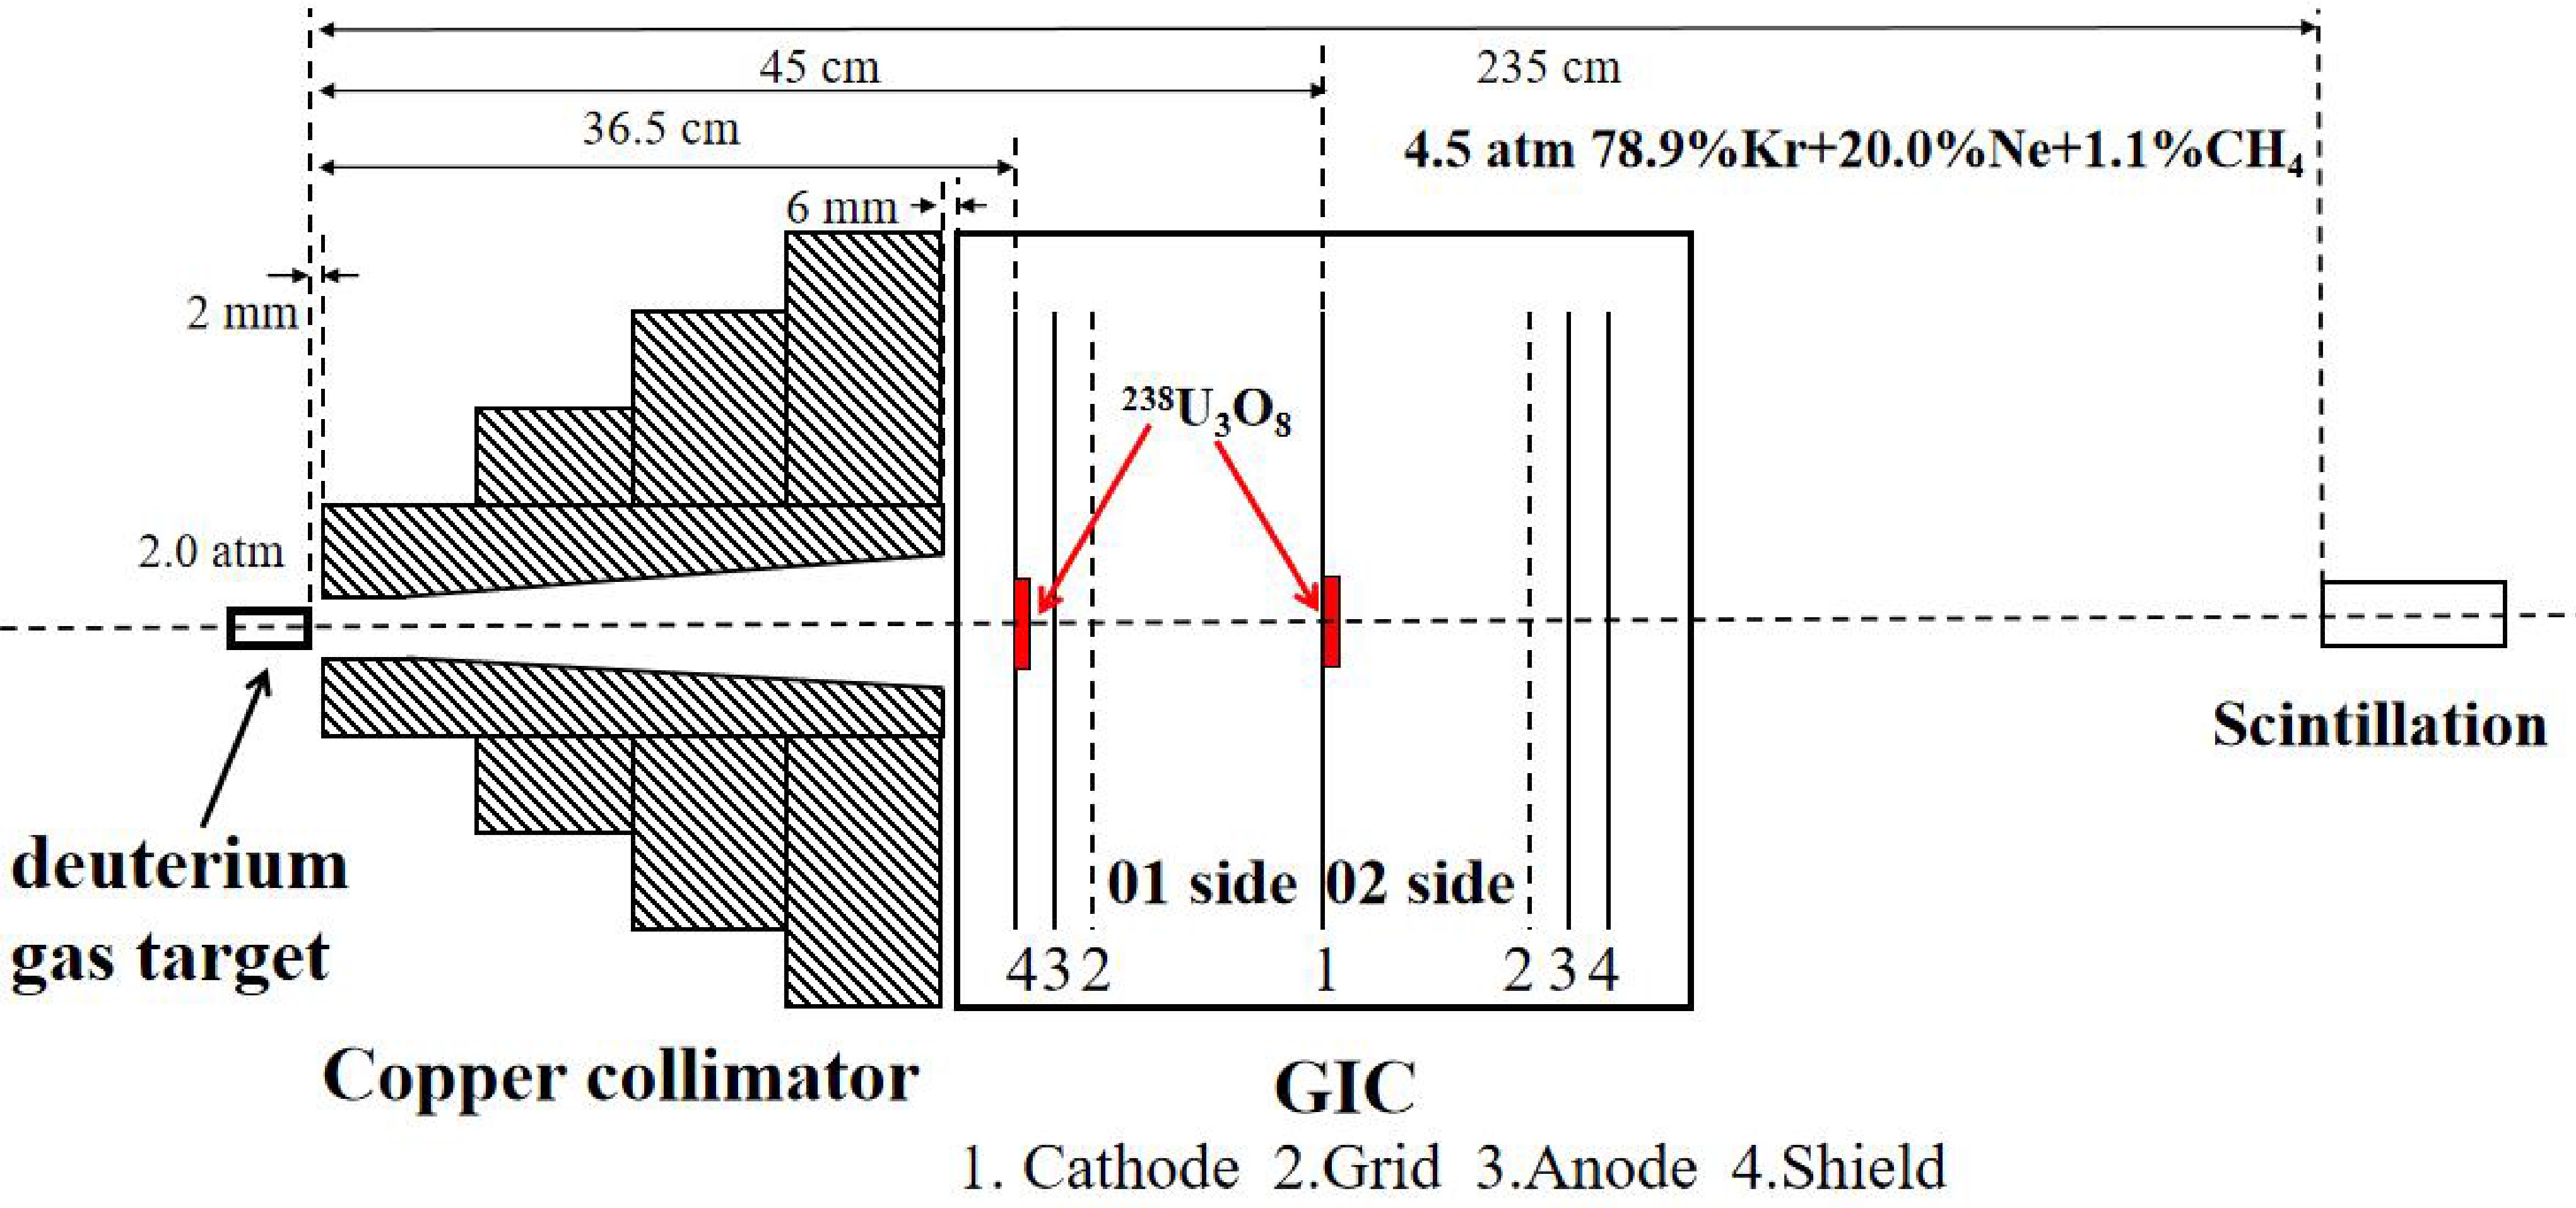
Figure 2. (color online) Experimental Setup.
Quasi mono-energetic neutrons were produced via the 2H(d, n)3He reaction. The neutron source consisted mainly of a deuterium gas target, separated from the accelerator vacuum tube by a 10.0-μm-thick molybdenum foil. The length of the gas cell was 3.0 cm and the diameter was 1.0 cm. The pressure of the deuterium gas in the cell was 2.0 atm. Measurements were performed in the neutron-energy range of 8.9–11.5 MeV, and the corresponding deuteron energy range was 6.4–8.9 MeV.
The neutron collimator was composed of pure copper material, which was placed between the neutron source and the GIC, as shown in Fig. 2. The detailed information of the design of the collimator and experimental validation can be found in our previous work [19]. The neutron flux distribution within the GIC was obtained through Geant4 simulation [21], as the R-Z plot shown in Fig. 3. The collimated region was approximately a cone. The horizontal (Z) axis corresponds to the direction of the incident neutron beam, while the vertical (R) axis represents the radial distance.
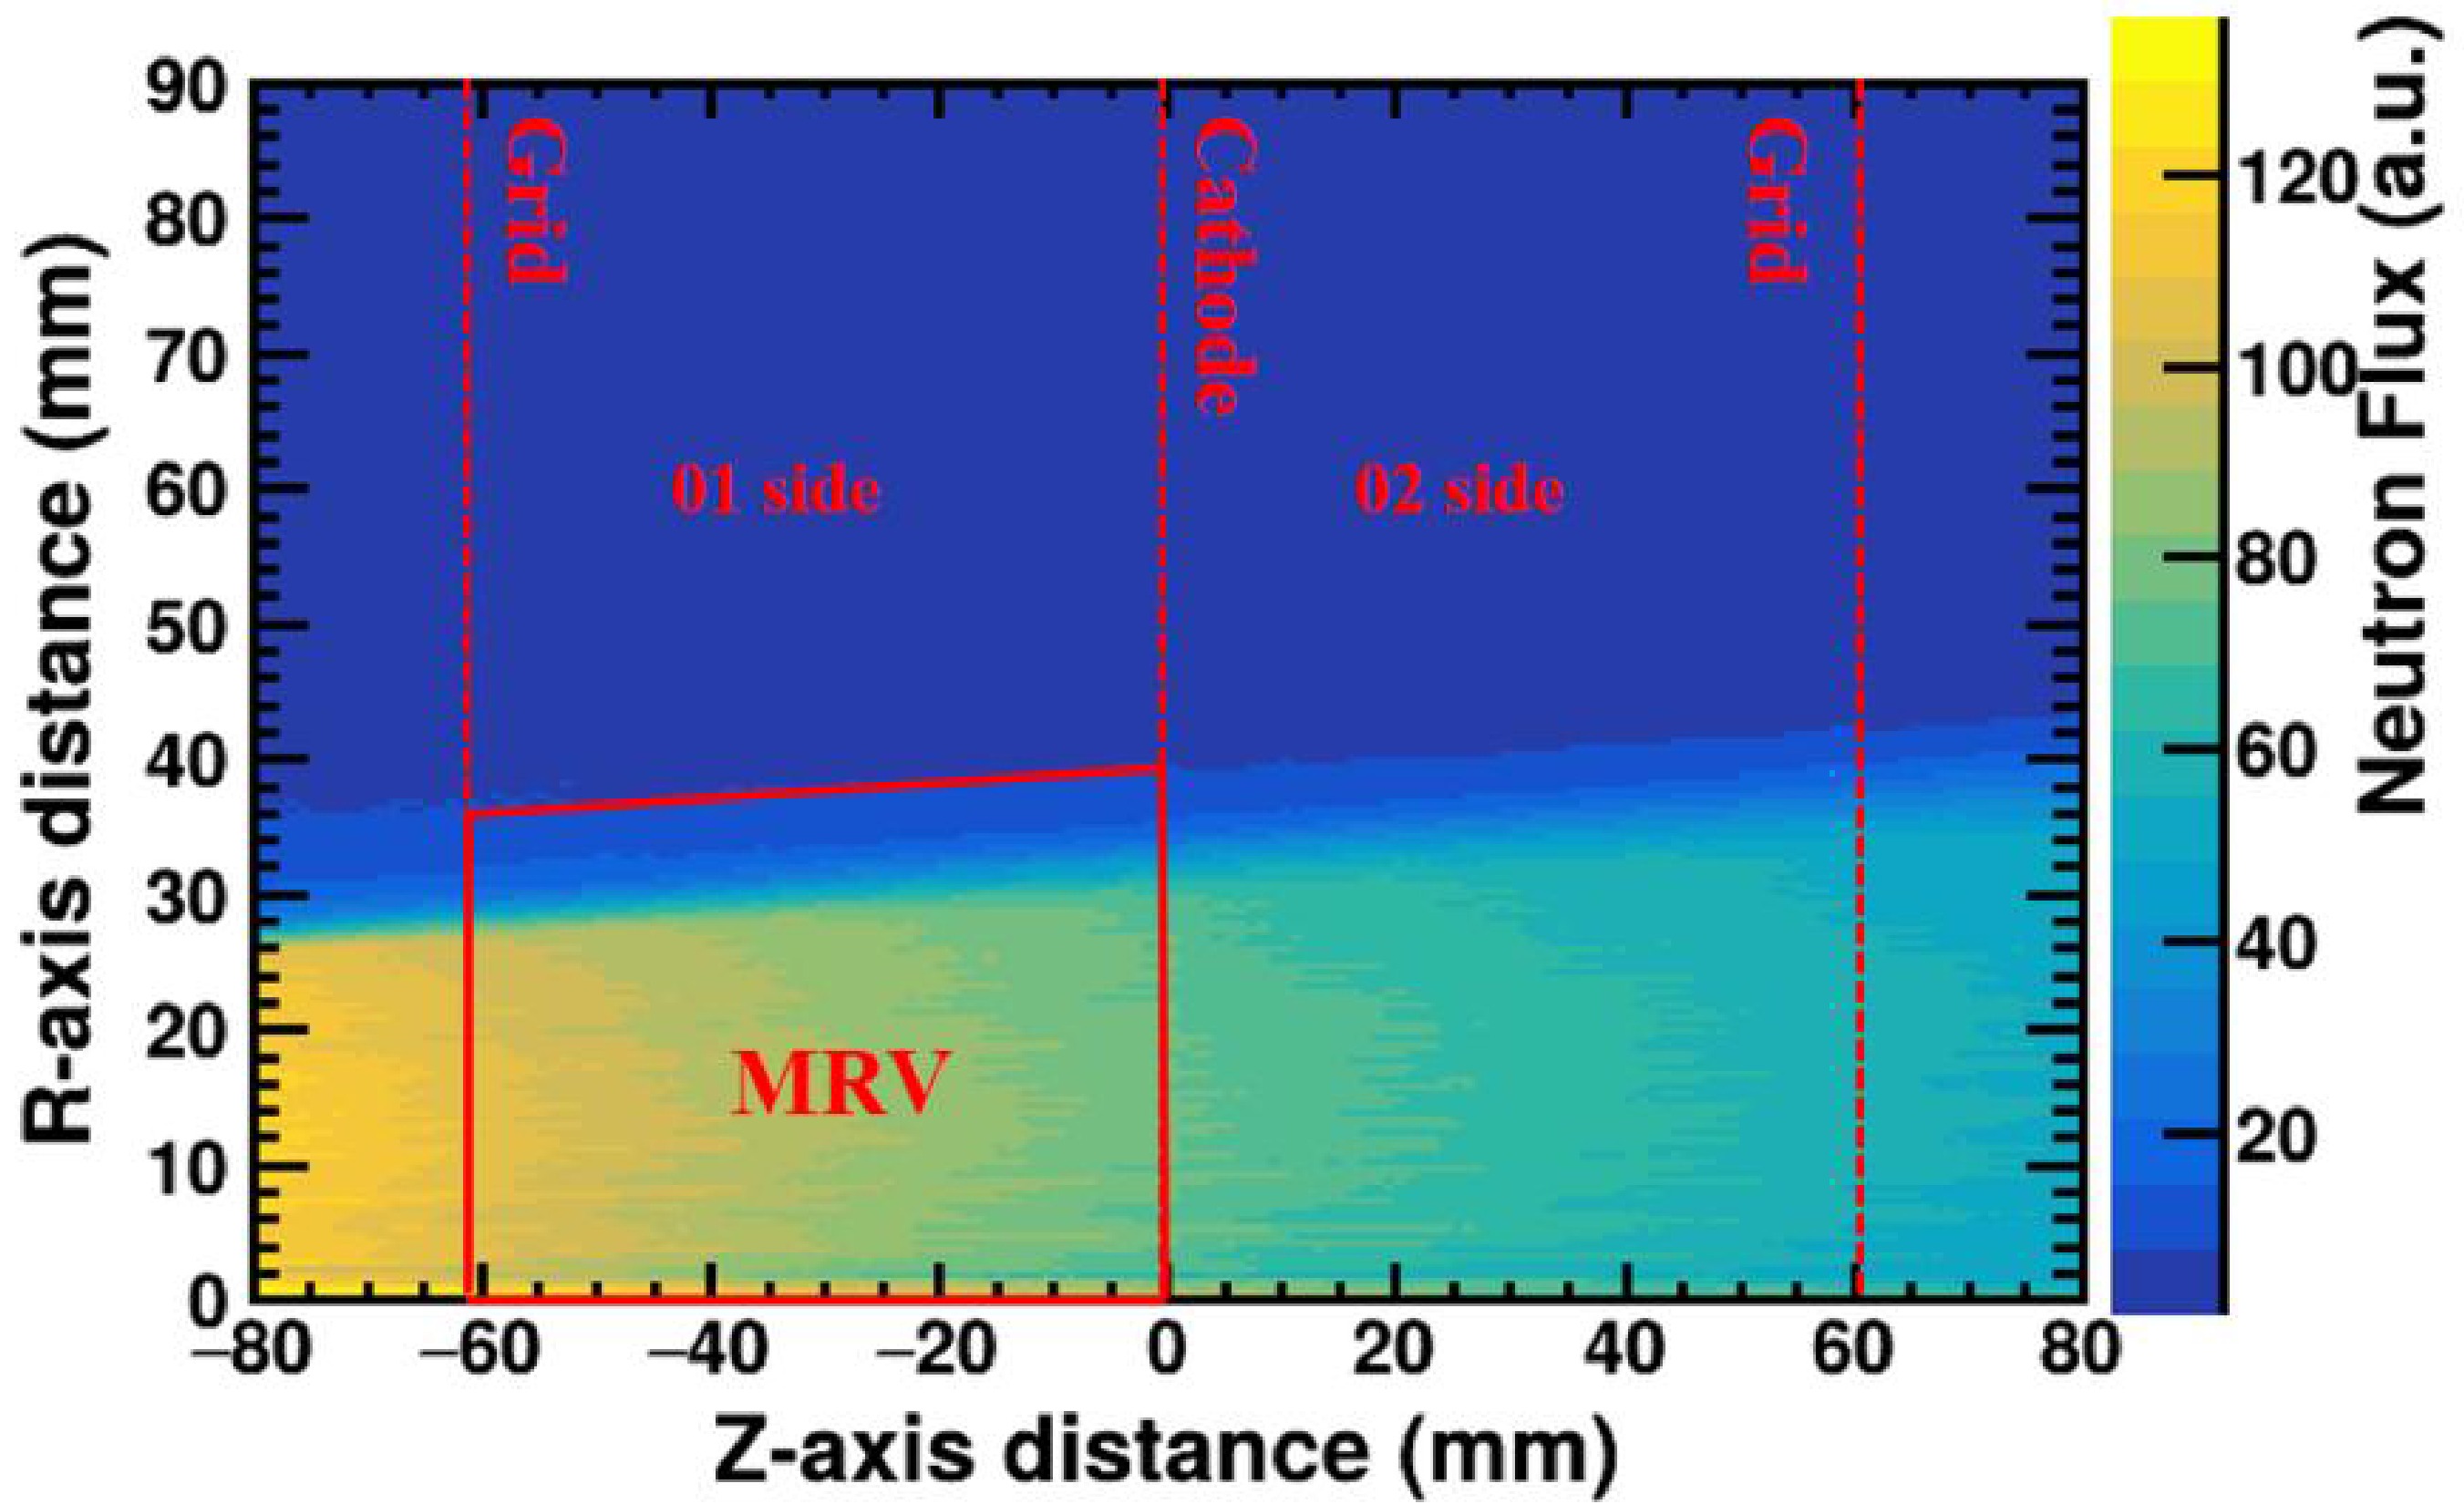
Figure 3. (color online) The simulated neutron flux distribution inside the GIC.
The region inside the red trapezoid in Fig. 3 of the 01 side corresponds to the main reaction volume (MRV). The real three-dimensional MRV in Fig. 2 is a circular truncated cone with the radii R1 = 3.6 cm and R2 = 4.0 cm, and it was used to calculate the average neutron fluence and the number of 20Ne atoms. In the present work, only the 01 side of the GIC was used to measure the (n, α) events.
A twin GIC was used as the charged particle detector, whose measurement principle, structure and the electronics can be found in Ref. [22]. A high voltage of −2800 V was applied to the cathode, while + 1400 V was applied to the anodes, with the grid electrodes grounded. The cathode-grid and anode-grid distances were 6.1 and 1.4 cm, respectively. The working gas in the GIC was the 78.9%Kr + 20.0% Ne + 1.1% CH4 mixture gas with the pressure of 4.5 atm at (23.7 ± 0.1) oC. The natural neon gas was the sample with the 20Ne abundance of 90.48%. Description of the electronics can be found in Ref. [22]. It is worth emphasizing that the external trigger was generated by the coincidence of the anode and cathode signals of the GIC, which effectively suppressed electronic noise and background events. The typical counting rate was less than 500 events/s, and the dead-time and pulse pile-up effects were found to be negligible compared with the other uncertainty sources.
A sample changer with five sample positions was positioned at the common cathode of the GIC [19]. A back-to-back α-sources (234U, 4.775 MeV; 239Pu, 5.155 MeV; 238Pu, 5.499 MeV; 244Cm, 5.805 MeV) was set at sample position #1, and back-to-back Ta/238U2O3#II was set at sample position #2, other three positions were all set with back-to-back Ta/Ta backings. The 238U3O8#I sample with 99.999% enrichment was glued on the center of the shield of the 01 side. The shield-anode distance was 1.0 cm. The diameter of the 238U3O8#I sample is 45.0 mm, and the nuclei number of 238U (NU) is (2.081 ± 0.020) × 1019 [23]. In the present measurement, only the 01 side of the twin GIC was used for the 20Ne(n, α)17O event selection in the present work. The 02 side was used to place 238U3O8#II sample for fission event measurements, but the 02 side fission data were not included in the final analysis because of the low fission statistics and the relatively low fission-fragment detection efficiency caused by gas sample (n, α) events. This does not affect the present cross section determination, since the neutron fluence was obtained from the fission cathode measurement. Owing to the large number of 20Ne atoms in the MRV (
$ N_{\text{sample}}^{\text{MRV}} $ = 5.68×10²¹), the statistical uncertainty of the selected (n, α) events was smaller than 1%. Therefore, using only the 01 side was sufficient to reduce the statistical uncertainty to an acceptable level in the present measurement.An EJ-309 liquid scintillation detector was used to measure the neutron spectrum. The unfolding method was used to obtained the neutron spectrum [24,25]. In addition to the main-energy neutrons from the 2H(d, n)3He reaction, there are also low-energy neutrons, mainly from the 2H(d, np)2H reaction and scattering off the walls. The interference α events induced by the low-energy neutrons were corrected in Sec. III.
Only two sample positions were used in the present experiments: Firstly, the back-to-back compound α-sources mounted at sample position #1 was used for energy calibration of the detection system without the neutron beam. Secondly, back-to-back Ta/238U2O3#II samples mounted at sample position #2 were used for the measurements of the events of the 20Ne(n, α)17O reaction from gas samples with the neutron beam on. The total neutron beam duration was ~ 18 h.
-
The cross section (
$ {\sigma }_{\alpha } $ ) of the 20Ne(n, α)17O reaction can be calculated from$ {\sigma }_{\alpha }=\frac{{N}_{\text{event}}}{{\Phi }_{\text{MRV}}\cdot {N}_{\text{sample}}}, $
(1) where
$ {N}_{\text{event}} $ is the number of the (n, α) events,$ {N}_{\text{sample}} $ is the effective number of the 20Ne nuclei, and$ {\text{Φ}}_{\text{MRV}} $ is the average neutron fluence through the main reaction volume (MRV). Unlike experiments employing foil solid samples, the neon gas sample occupies an extended three-dimensional volume inside the GIC. As a result, the neutron fluence, reaction yield, and event-detection efficiency depend on the reaction position. To obtain accurate cross sections, correction factors associated with detector efficiency, background interference and the non-uniformity of neutron-field distribution in the GIC detector were evaluated using detailed Monte Carlo simulations and incorporated into the data analysis procedure. This treatment is more detailed in the present work than in previous measurements, together with the improved identification of the αi event groups using the corrected anode-energy versus distance two-dimensional spectra (see Sec. III.A). This enables a more reliable determination of the state-resolved 20Ne(n, αi)17O (i=0,1,2,3) cross sections. -
The measured anode energy versus anode signal rise time two-dimensional spectrum at En = 10.49 MeV is shown in Fig. 4(a). The rise time of the anode signal is proportional to the projection length of the charged-particle track along the electric-field direction [19]. As shown in Fig. 4(a), the α particle events can be clearly separated from proton events due to much shorter ranges of α particle in the working gas. In addition, the α0, α1, α2 and α3 event groups from the 20Ne(n, α)17O reaction corresponding to different energy states of 17O can be identified. One can see from Fig. 4(a), each (n, αi) (i=0,1,2,3) event group exhibits a characteristic V-shaped structure in the anode energy versus anode signal rise time two-dimensional spectrum [16,26]. This behavior originates from the pulse-height-defect (PHD) effect [26,27] in the gas ionization chamber. In our previous work, the impact of the PHD effect on measurements was analyzed, as detailed in [26]. As a result, the event groups corresponding to different (n, αi) (i=0,1,2,3) channels partially overlap with each other, as shown in Fig. 4(a).
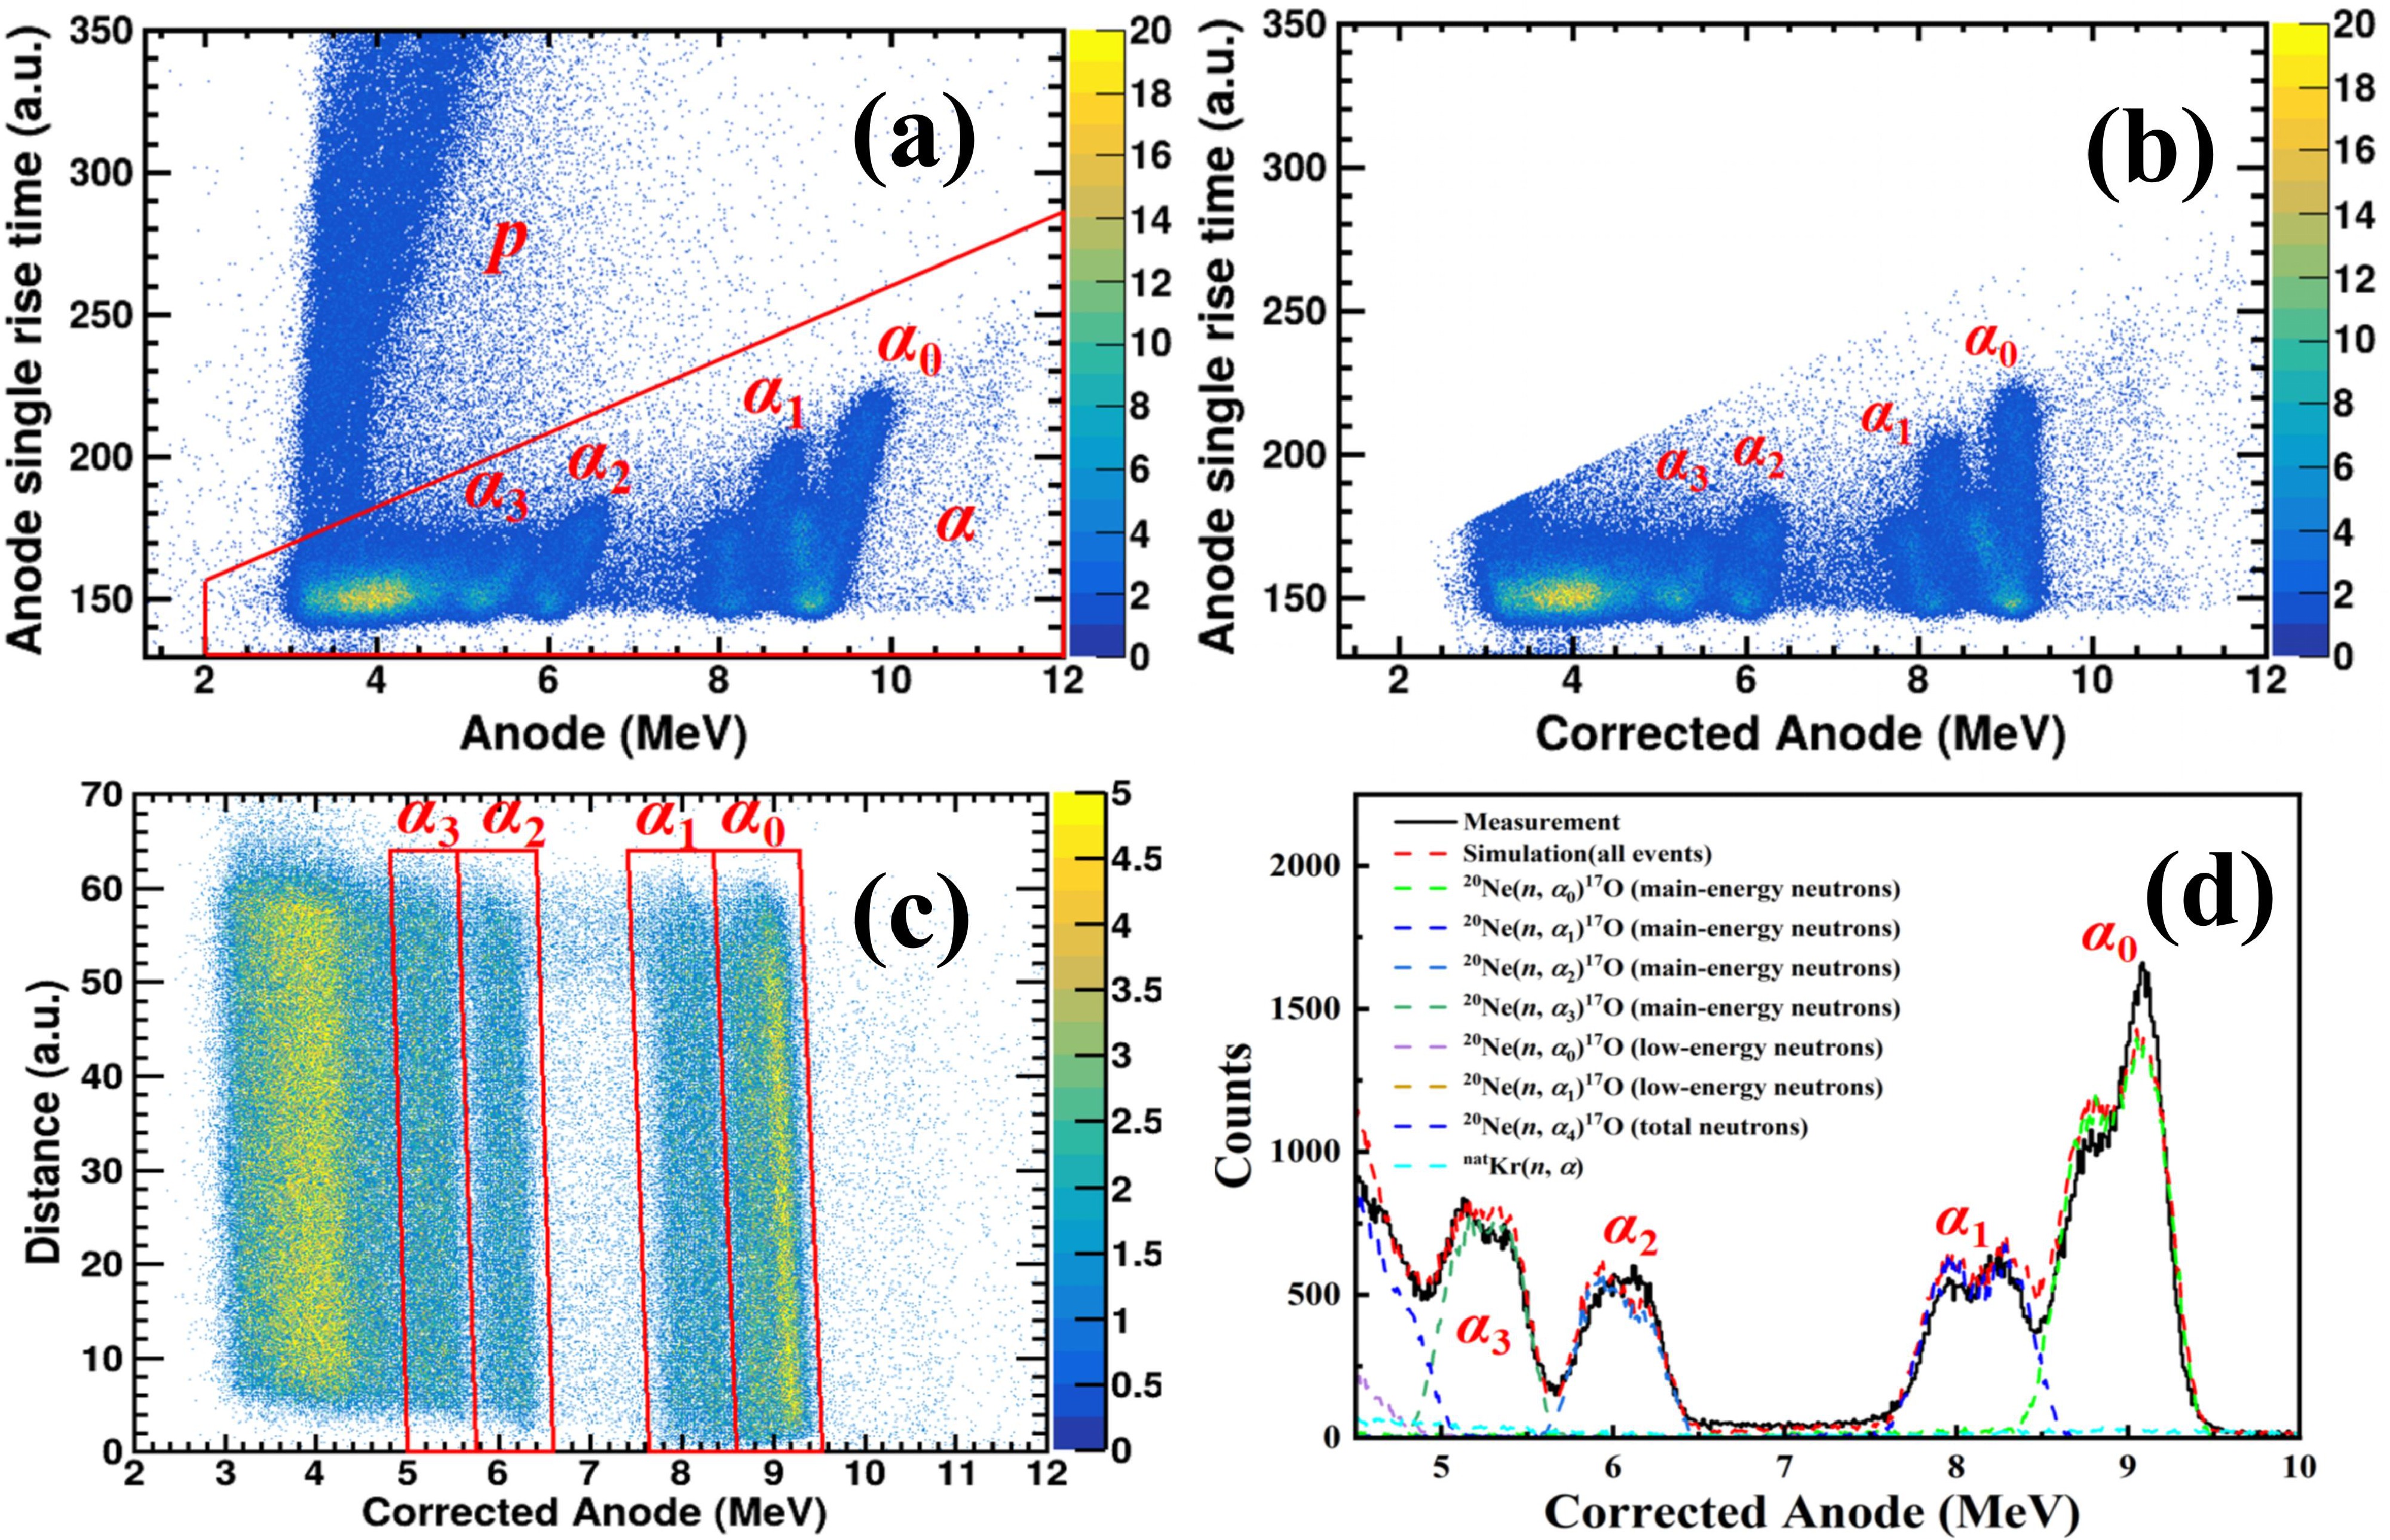
Figure 4. (color online) The measured anode energy versus anode signal rise time two-dimensional spectrum (a), and corrected anode energy versus
$ $ anode single rise time two-dimensional spectrum after the linear transformation (b), and corrected anode energy versus distance two-dimensional spectrum (c), and measured and simulated corrected anode energy spectra (d) at En = 10.49 ± 0.08 MeV.To better distinguish different (n, αi) event groups, a linear coordinate transformation was applied to the anode energy versus anode signal rise time two-dimensional spectrum. The corrected anode energy was defined as
$ {E}_{\text{corr}}={E}_{\text{anode}}-b({T}_{\text{rise}}-{T}_{0}), $
(2) where
$ {E}_{\text{anode}} $ is the amplitude of the anode signal of the GIC,$ {T}_{\text{rise}} $ is the rise time of the anode signal,$ {T}_{0} $ is the minimum rise time of the anode signal, and b is the slope parameter determined from the tilted structures of the αi event bands in the anode signal rise time versus anode amplitude 2D spectrum. In the present analysis,$ {T}_{0} $ = 145 a.u. and b = 0.0095 MeV/a.u. were used. The spectrum after transformation is shown in Fig. 4(b), where the separation between different (n, αi) event groups is significantly improved. However, after the transformation, neighbor event groups still partially overlap in the anode-energy spectrum, therefore additional position information was used to improve the event identification. The time difference between the starting times of the anode signal and cathode signal is proportional to the distance from the grid of the GIC to the closest point on the track of the detected α particle (hereinafter referred to as the “distance” [19]). The corrected anode energy versus “distance” two-dimensional spectra were obtained, as shown in Fig. 4(c). The (n, α0), (n, α1), (n, α2) and (n, α3) events were then selected separately, as indicated by the red rectangles in Fig. 4(c).Detailed Monte Carlo simulations were performed by considering the individual 20Ne(n, αi)17O (i=0,1,2,3) channels induced by both the main-energy and low-energy neutron components, together with the background contribution mainly from natKr(n, α) reactions. The cross sections of natKr(n, α) reactions were taken from ENDF/B-VIII.1 [28], while the cross sections of the 20Ne(n, αi)17O (i=0,1,2,3) reactions were taken from JENDL-5 [18]. The simulated events were processed using the same coordinate transformation and selection conditions as those applied to the experimental data, and the corrected anode-energy versus distance two-dimensional spectra were generated. The event-selection regions shown in Fig. 4(c) were applied consistently to both the measured and simulated spectra to determine the detection efficiency and the correction factor for background interference. Figure 4(d) shows a representative comparison between the measured and simulated corrected anode energy spectra, demonstrating the reliability of the simulation-based corrections.
Based on our established gas-sample measurement method developed in Refs. [19,20], four correction factors were introduced to obtain the number of 20Ne(n, αi)17O events. The number of the 20Ne(n, αi)17O events was determined from [19,20]
$ {N}_{\text{event}}=\frac{{N}_{\alpha }\cdot k\cdot (1-\eta _{\alpha }^{\text{low}})}{\varepsilon _{\alpha }^{\text{amp}}\cdot \varepsilon _{\alpha }^{\text{dis}}}, $
(3) where
$ {N}_{\text{α}} $ is the count of α events within the selected event region, as shown in Fig. 4(c). In addition to$ {N}_{\text{α}} $ , four correction factors were introduced.$ \varepsilon _{\text{α}}^{\text{amp}} $ is the anode detection efficiency introduced to correct for event losses caused by the wall effect, which reduces the anode pulse amplitudes of some events and moves them outside the selected anode-energy region [19]. To better evaluate this efficiency and to improve the separation of the (n, α0), (n, α1), (n, α2) and (n, α3) events, the anode-energy selection was performed using the corrected anode-energy versus distance two-dimensional spectra shown in Fig. 4(c). The method of$ \varepsilon _{\text{α}}^{\text{amp}} $ determination in the present work differs from our previous gas-sample measurements in Refs. [19,20], where the event selection was mainly based on the experimental anode-amplitude spectra. In addition, events occurring close to the grid may produce cathode signals with amplitudes below the lower threshold and therefore may escape identification, leading to a loss of events occurring near the grid region. This loss was corrected by introducing the detection efficiency for distance ($ \varepsilon _{\text{α}}^{\text{dis}} $ ) [19]. k is the correction factor for background interference, and$ \eta _{\text{α}}^{\text{low}} $ means the proportion of α events induced by low-energy neutrons within the threshold [19].The selected event region of the individual 20Ne(n, αi)17O (i=0,1,2,3) channels are indicated by the red rectangles in Fig. 4(c). The anode detection efficiency (
$ \varepsilon _{\text{α}}^{\text{amp}} $ ) was determined from the ratio of simulated events inside the selected region in the corrected anode energy versus distance two-dimensional spectra (Fig. 4(c)) to the total number of the simulated (n, α) events. The correction factor of background interference (k) was determined as the ratio of the number of the simulated (n, αi) events to the total number of events inside the selected region, including (n, αi) events to be measured, other (n, αi) events and background events, in the corrected anode energy versus distance two-dimensional spectra. In addition, because low-energy neutrons in neutron energy spectrum also induced (n, α) events, the correction factor$ \eta _{\text{α}}^{\text{low}} $ accounts for events induced by low-energy neutrons were considered. The detailed method used to determine the low-energy neutron correction can be found in Ref. [22]. The simulated distance spectrum, obtained without the cathode-threshold loss, was normalized to the measured spectrum in the reliable distance region defined by the lower and upper thresholds, as shown in Fig. 5. The detection efficiency for distance ($ \varepsilon _{\text{α}}^{\text{dis}} $ ) was obtained by comparing the total counts of measured and simulated distance spectra.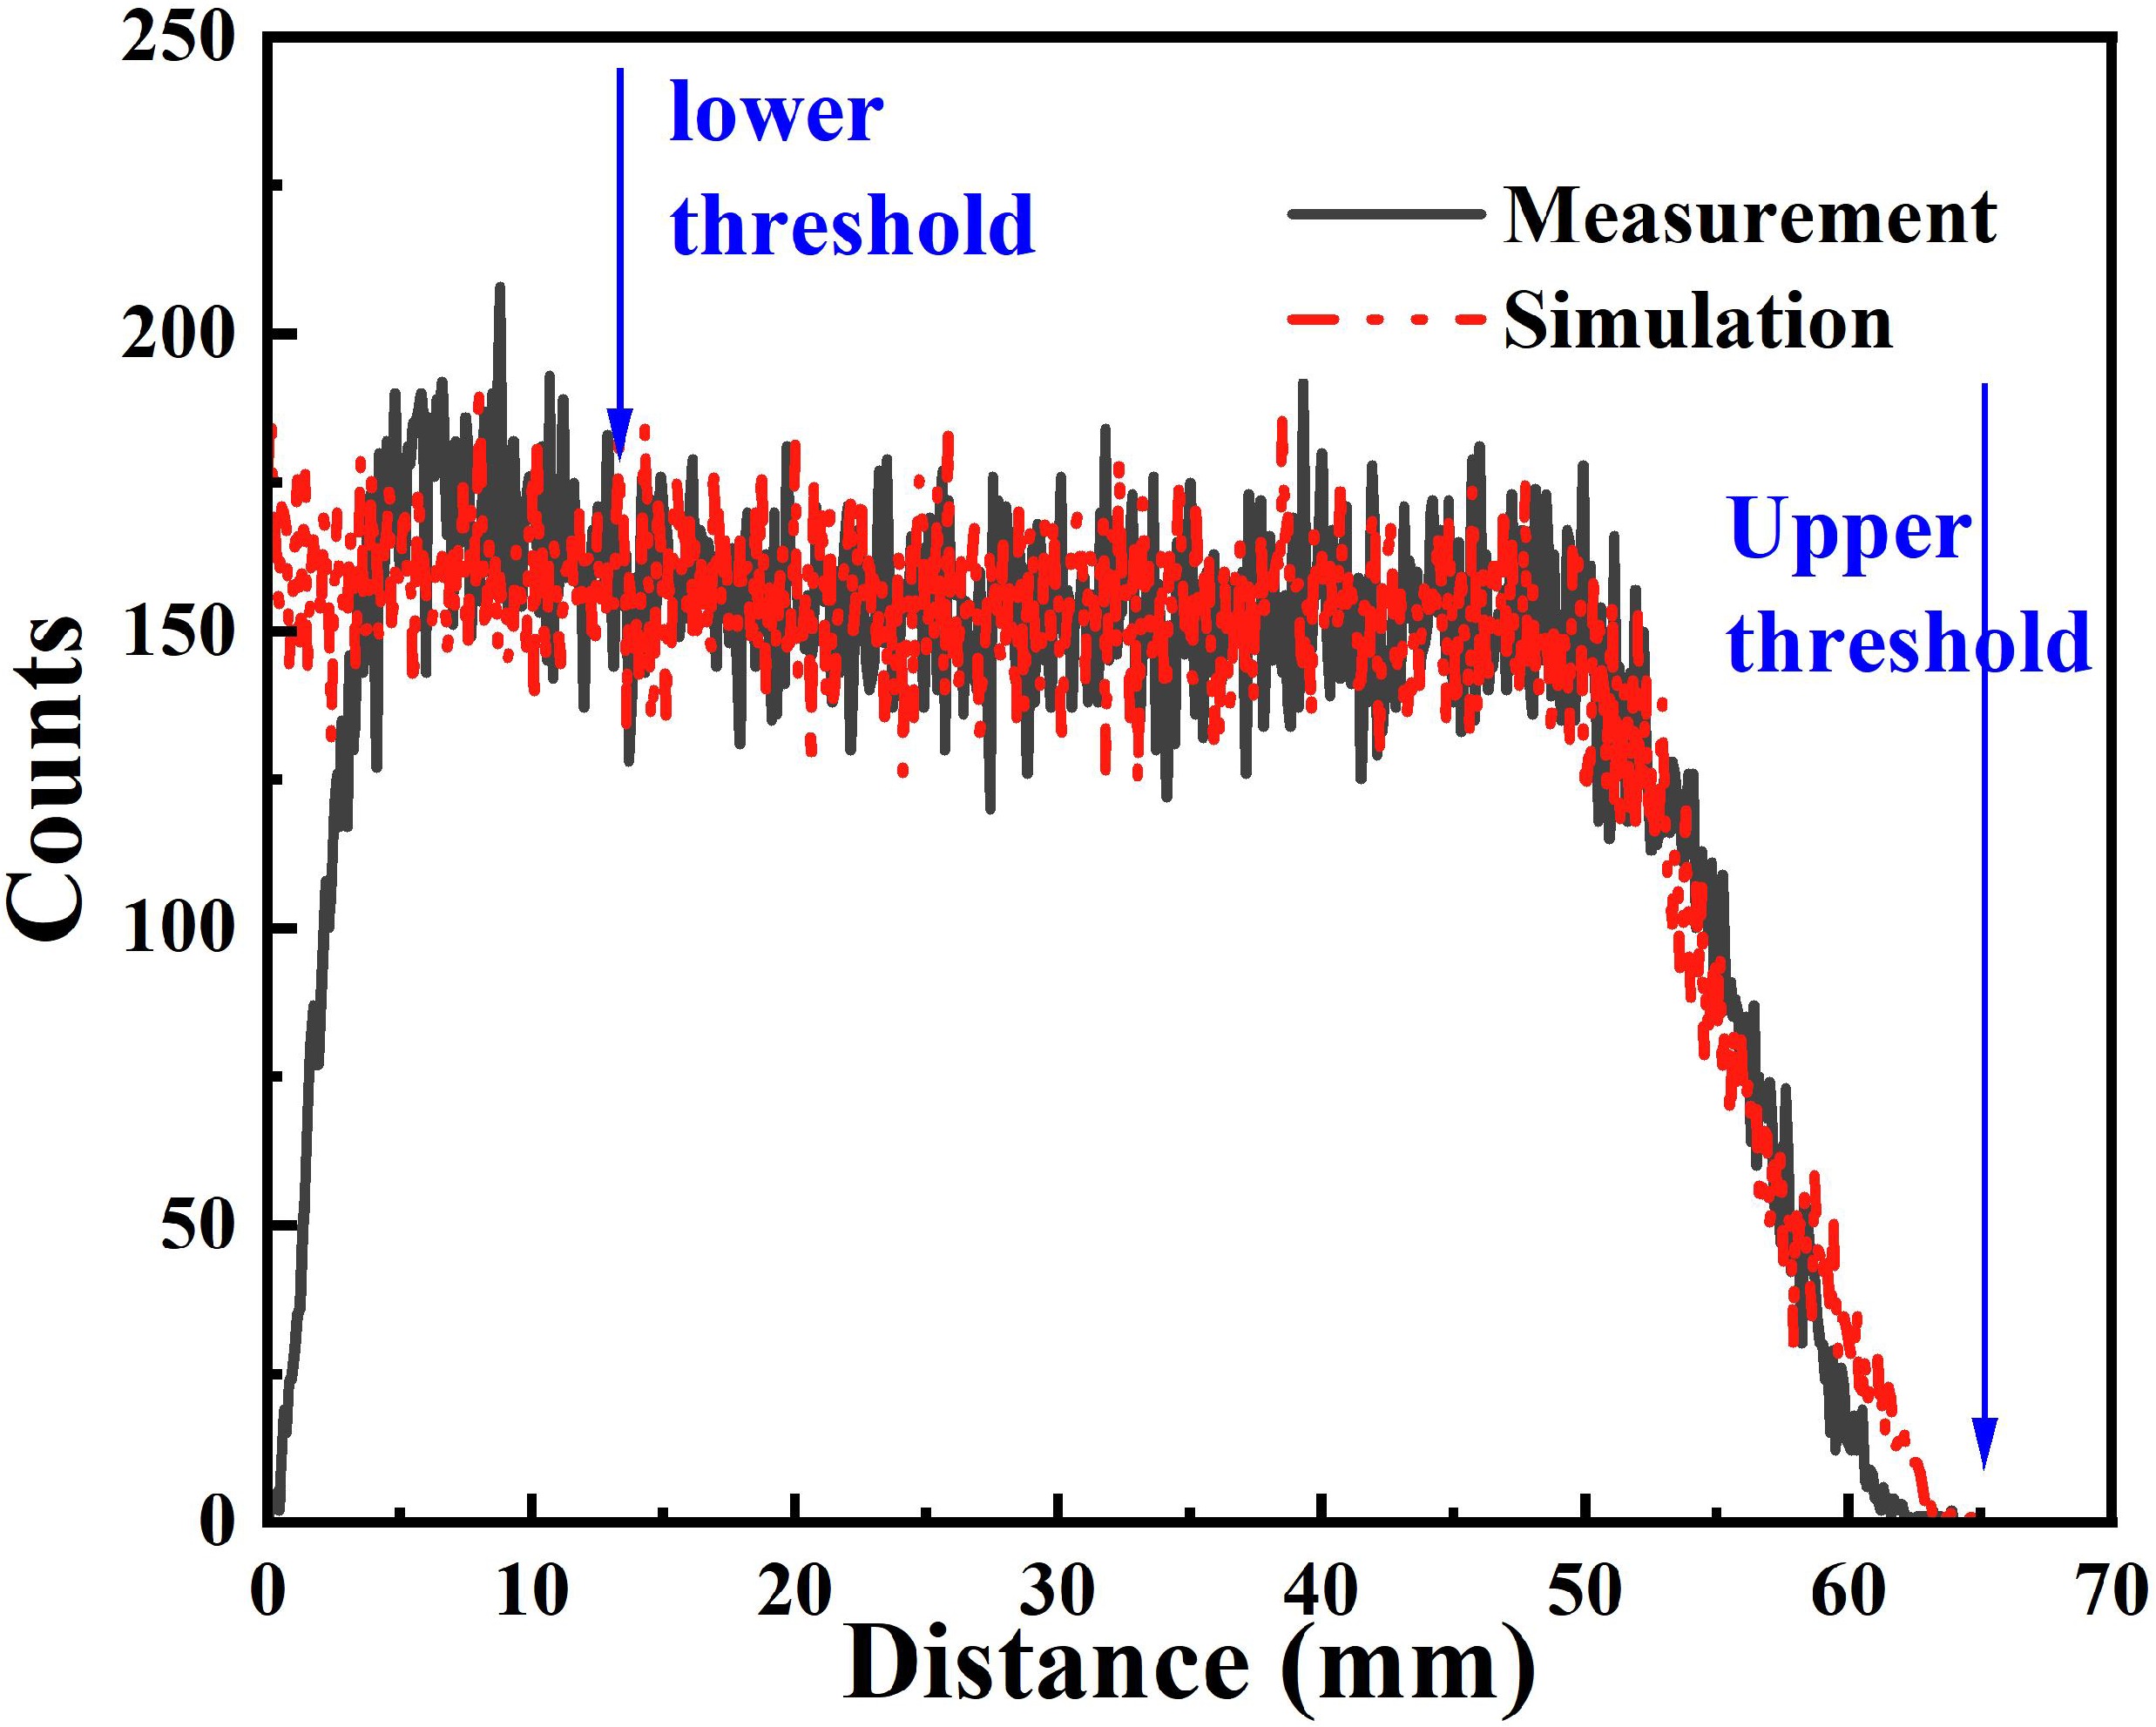
Figure 5. (color online) The measured and simulated distance spectrum for 20Ne(n, α0)17O reaction at En = 10.49 ± 0.08 MeV.
The simulations were performed for each neutron energy point to determine the values of
$ \varepsilon _{\text{α}}^{\text{amp}} $ ,$ \varepsilon _{\text{α}}^{\text{dis}} $ , k and$ \eta _{\text{α}}^{\text{low}} $ . The ranges of the values of these corrections for the individual 20Ne(n, αi)17O (i=1,2,3,4) channels are shown in Table 1. The value of$ \varepsilon _{\text{α}}^{\text{amp}} $ decreases as the neutron energy increases. The range of the charged particles becomes longer as the neutron energy increases, making the wall effect more pronounced and leading to a decrease in$ \varepsilon _{\text{α}}^{\text{amp}} $ . The value of$ \varepsilon _{\text{α}}^{\text{dis}} $ generally increases as neutron energy increases. The correction factor for background interference (k) decreases as neutron energy increases, indicating an increasing background contribution, since (k) is defined as one minus the correction factor for background interference. The low-energy neutron contributions ($ \eta _{\text{α}}^{\text{low}} $ ) are negligible for (n, α0) and (n, α1) channels, with values below 0.10%. However, it becomes more significant for (n, α2) and (n, α3) channels, reaching up to 13.96% and 33.31%, respectively, as shown in Table 1. This is mainly because the (n, α0) and (n, α1) events induced by low-energy neutrons can partially enter the selected (n, α2) and (n, α3) regions. For the (n, α3) channel, the low-energy neutron contribution exceeds 10% only at the four neutron-energy points below 10 MeV, namely 8.94, 9.13, 9.44, and 9.69 MeV; above 10 MeV, this correction is relatively small. The uncertainty of this correction was evaluated by varying the low-energy neutron fraction by 10% and recalculating the corresponding correction factors.Coefficient Values (%) 20Ne(n, α0)17O 20Ne(n, α1)17O 20Ne(n, α2)17O 20Ne(n, α3)17O 20Ne(n, α0+α1)17O $ \varepsilon _{\text{α}}^{\text{amp}} $ 88.35~92.98 90.24~94.50 92.54~96.81 94.48~97.84 91.83~95.83 $ \varepsilon _{\text{α}}^{\text{dis}} $ 95.51~98.66 94.90~99.28 90.28~95.01 88.67~94.72 95.89~99.28 $ k $ 92.39~99.59 81.49~99.65 86.45~93.63 82.48~89.85 87.83~99.22 $ \eta _{\text{α}}^{\text{low}} $ < 0.10 < 0.10 0.60~13.96 1.06~33.31 < 0.10 Table 1. Ranges of the values of the coefficient in Eq. (3)
Although the α0 and α1 events can be separated after the transformation, their event regions remain close, resulting in a relatively large uncertainty in the determination of the α1 events. In addition, the previous measurements (Shamu et al. [11]) reported only the summed (α0 + α1) cross sections. Thus, the (α0 + α1) yield was also determined from the uncorrected anode-energy spectrum for comparison. The simulations for (α0 + α1) were performed for each neutron energy point to determine the values of
$ \varepsilon _{\text{α}}^{\text{amp}} $ ,$ \varepsilon _{\text{α}}^{\text{dis}} $ , k and$ \eta _{\text{α}}^{\text{low}} $ , which are also presented in Table 1. -
The average neutron fluence through the MRV (
$ {\phi }_{\text{MRV}} $ ) can be calculated by$ {\Phi }_{\text{MRV}}=\frac{\Phi \text{u}}{G}=\frac{{N}_{f}\cdot (1-\eta _{f}^{\text{low}})}{{\sigma }_{f}\cdot {N}_{U}\cdot {\varepsilon }_{f}\cdot G}, $
(4) where
$ {\phi }_{\mathrm{U}} $ is the average neutron fluence through the 238U3O8#1 sample at the shield of the GIC, and G is the ratio of the neutron fluence through the 238U3O8#1 sample to the average neutron fluence through the MRV, Nf is the measured fission counts,$ \eta _{f}^{\text{low}} $ is the corrected factor for low-energy neutron contribution, the$ {\sigma }_{f} $ is the cross sections of the 238U(n, f) reaction, NU is the 238U atom number in the 238U3O8#1 sample,$ {\varepsilon }_{f} $ is the detection efficiency of fission fragments [22]. A typical fission spectrum of the fission fragments from the 238U3O8#1 is shown in Fig. 6. The fission counts (Nf) were obtained by integrating the spectrum within the selected lower and upper thresholds. The detection efficiency of fission fragments ($ {\varepsilon }_{f} $ ) can be calculated from simulation [22]. It is calculated from the ratio of the fission events between the lower and upper thresholds in the simulated fission spectrum to the total number of the simulated fission events, as shown in Fig. 6. The obtained ($ {\varepsilon }_{f} $ ) values range from 87.8% to 88.2%. In addition, the contribution of fission events induced by low-energy neutrons in the neutron energy spectrum was corrected by the factor ($ \eta _{f}^{\text{low}} $ ), which is determined using the method in Ref. [22]. The cross sections of the 238U(n, f) reaction ($ {\sigma }_{f} $ ) are taken from the IAEA-Std17 [29]. The 238U atom number in the 238U3O8#1 sample (NU) is described in Sec. II.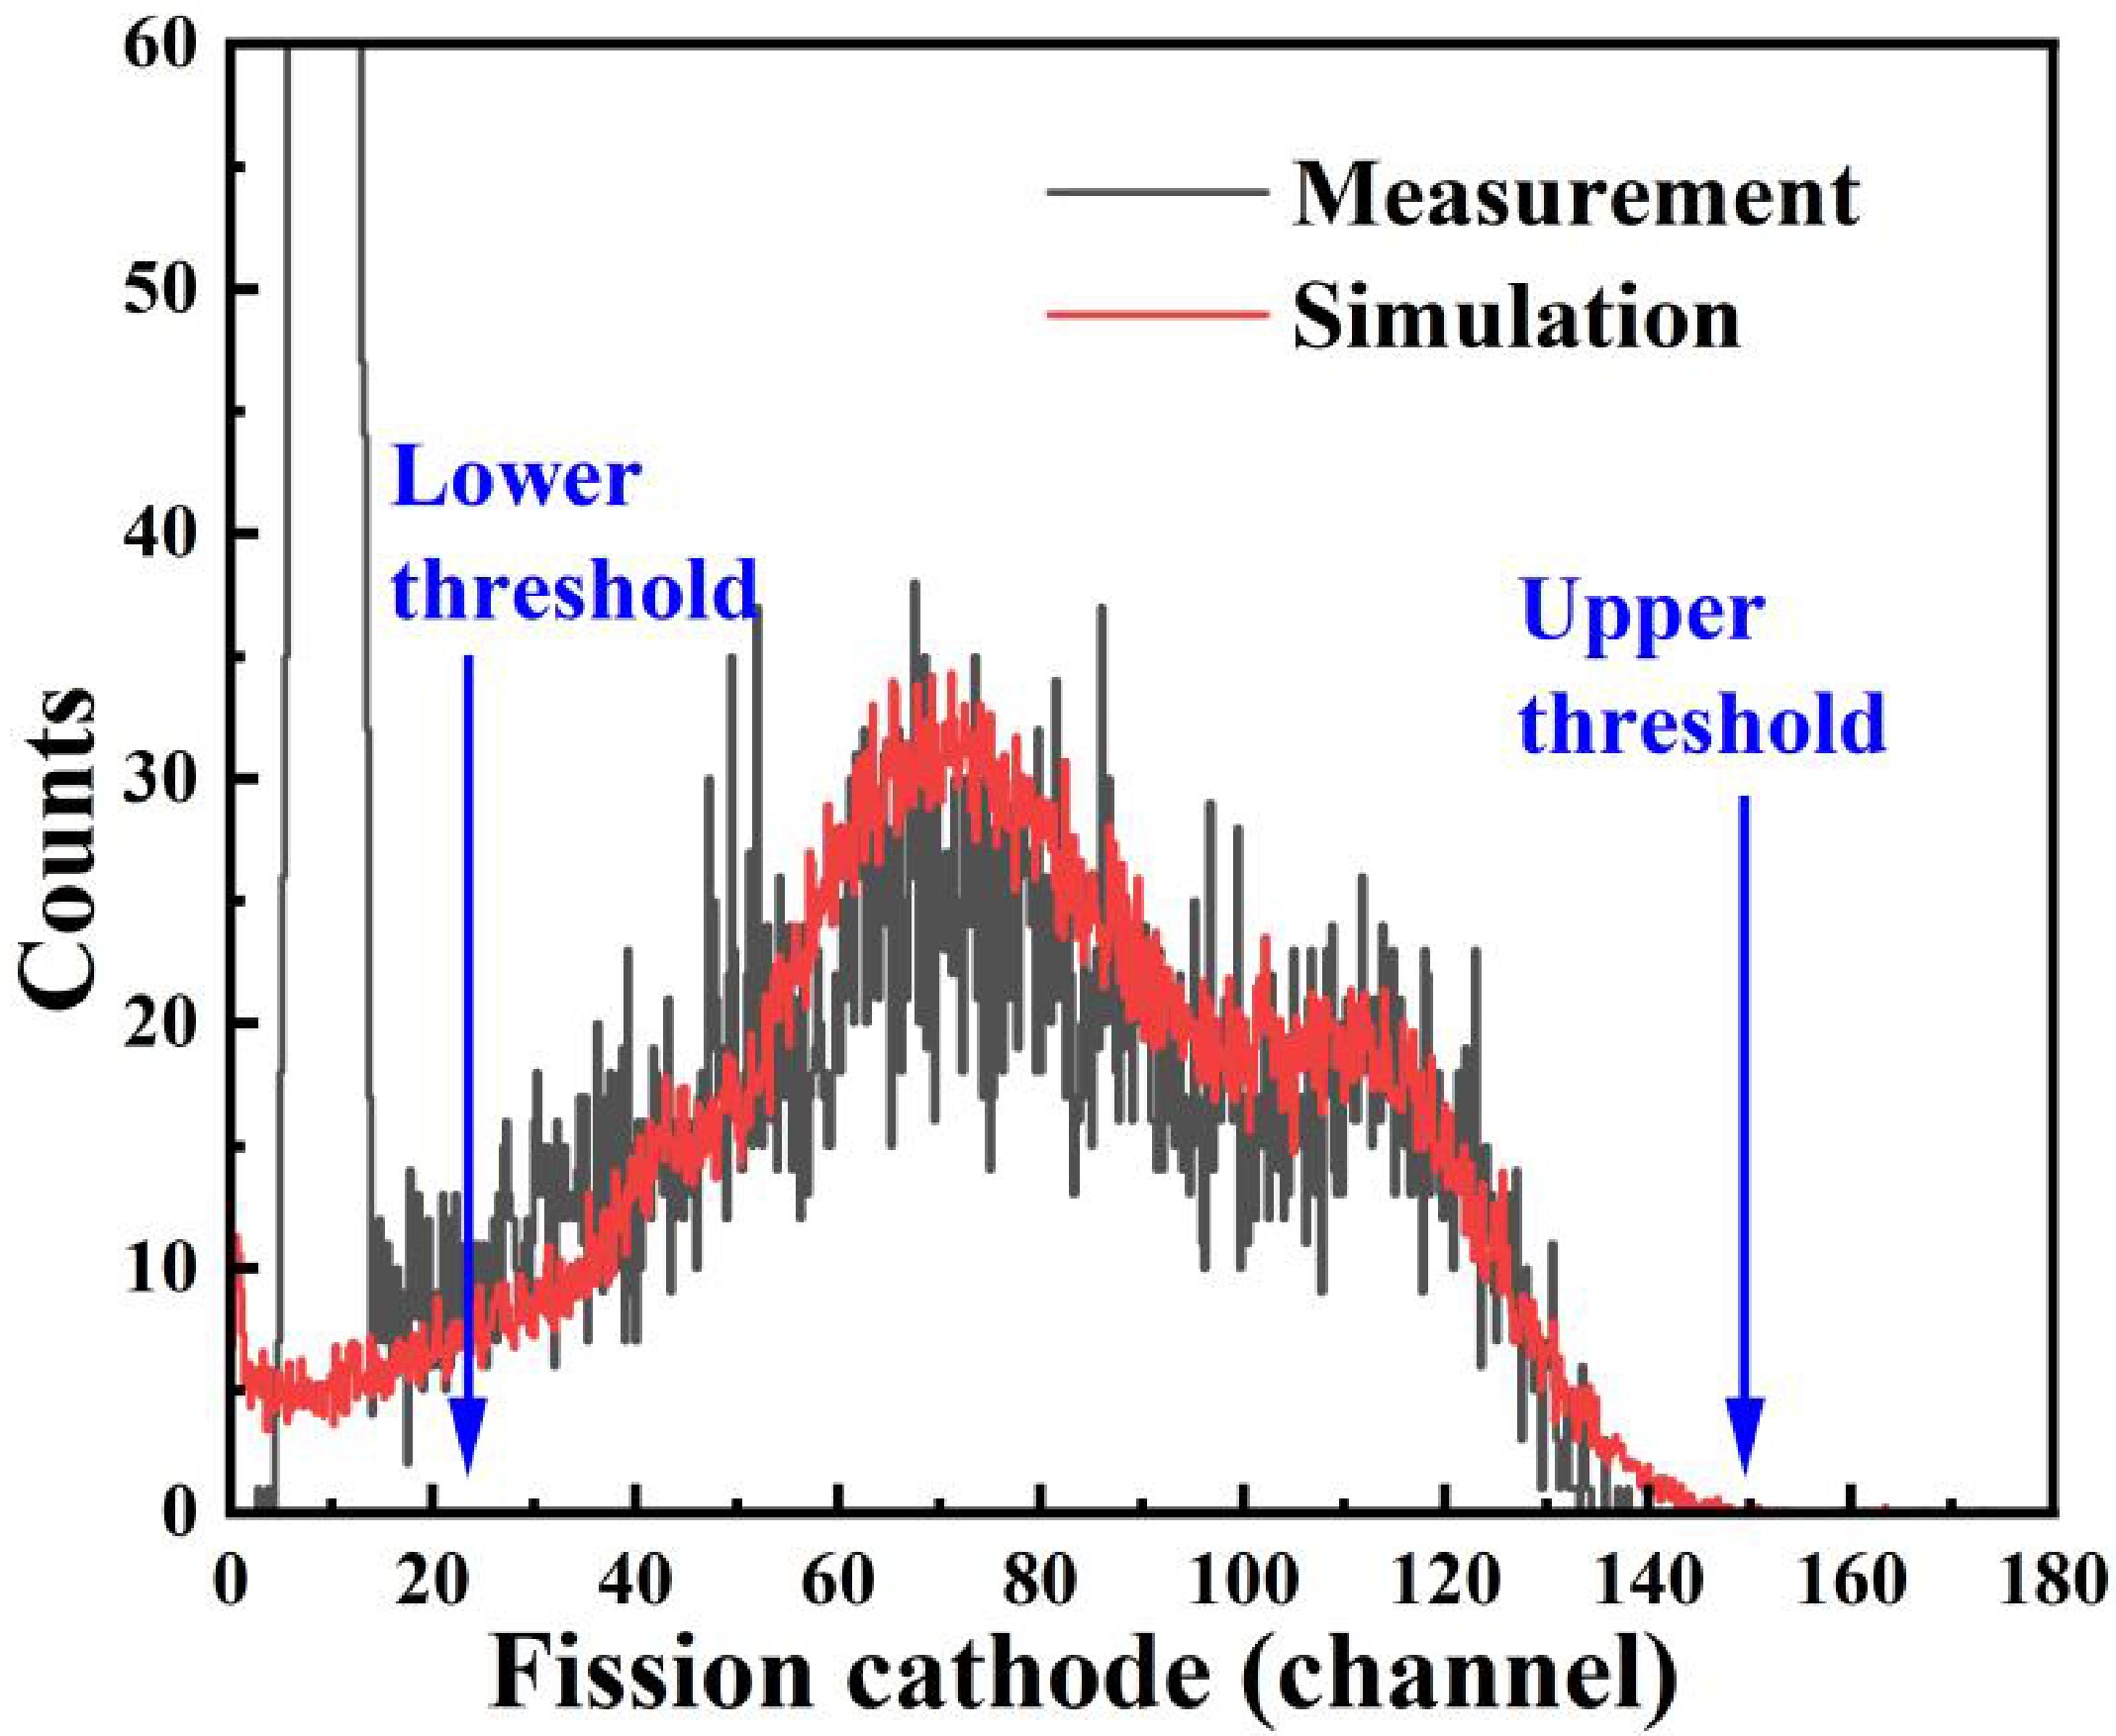
Figure 6. (color online) Measured fission spectrum from the 238U3O8 sample at the shield at En =9.44 ± 0.08 MeV.
Because the 238U3O8 sample and the neon gas sample occupy different positions in the GIC, the neutron fluence through the fission sample is not identical to the average neutron fluence in the main reaction volume (MRV). Therefore, the simulated neutron-field distribution in the GIC, as shown in Fig. 3, was used to determine the fluence ratio (G). The obtained G values range from 1.81 to 1.82. A detailed description of the calculation method for (G) can be found in Ref. [19].
-
The atom number of the 20Ne sample (
$ {N}_{\text{sample}} $ ) can be calculated by$ {N}_{\text{sample}}=N_{\text{sample}}^{\text{MRV}}\cdot W, $
(5) where
$ N_{\text{sample}}^{\text{MRV}} $ is the number of 20Ne nuclei in the MRV, and W is the correction factor of the nuclei number for incomplete shielding of the collimator. The value of$ N_{\text{sample}}^{\text{MRV}} $ was determined from the MRV volume, the gas pressure, the ratios of gas components, the gas temperature, and the isotopic abundance of 20Ne using the ideal gas equation. Because the neutron collimator cannot provide complete shielding, a fraction of 20Ne(n, αi)17O reactions may occur outside the MRV. Some of these events can still be recorded using the same selection rules as events generated inside the MRV and therefore will contribute to the measured yield. The correction factor (W) was calculated using Monte Carlo simulations and ranges from 1.267 to 1.297 in the present work. The value of W increases as neutron energy increases, indicating that the contribution of the events generated outside the MRV region becomes larger at higher neutron energies. A detailed description of the calculation method for W can be found in Ref. [19]. -
The sources of the uncertainties and their magnitudes are summarized in Table 2. The total uncertainty for each measured cross section was obtained by combining the individual uncertainty components listed in Table 2 in quadrature, i.e., using the root-sum-square method. The total uncertainties of the measured cross sections are 8.22% ~ 10.81% for the α0 channel, 8.38% ~ 15.59% for the α1 channel, 9.15% ~ 10.56% for the α2 channel, 10.34% ~ 12.89% for the α3 channel, and 7.58% ~ 10.98% for the α0+α1 channel. Because the gas atoms are distributed throughout the chamber and the neutron collimator cannot provide complete shielding, the uncertainty associated with the effective number of target nuclei (
$ {N}_{\text{sample}} $ ) becomes a relatively important contribution in gas sample measurements. The correction factor (W), which accounts for the reactions generated outside the MRV due to incomplete collimator shielding, gives one of the largest systematic contributions, with uncertainties of about 5.3% ~ 6.1%. In addition, since dedicated background measurements were not performed and the background was subtracted using simulations instead, the background correction factor (k) also introduces a significant uncertainty, ranging from 0.78~12.04%. This contribution is particularly important for the α1 channel, for which the maximum total uncertainty of 15.59% occurs at the highest measured neutron energy (En = 11.51 MeV) mainly because the neighboring α0 events affected by the wall effect can partially enter the selected α1 event region.Source Magnitude (%) 20Ne(n, α0)17O 20Ne(n, α1)17O 20Ne(n, α2)17O 20Ne(n, α3)17O 20Ne(n, α0+α1)17O Nα 0.63~1.21 1.38~3.55 1.27~2.55 2.48~3.67 0.34~0.70 $ \varepsilon _{\text{α}}^{\text{amp}} $ 3.51~5.82 2.75~4.88 1.60~3.00 1.08~2.58 0.21~0.41 $ \varepsilon _{\text{α}}^{\text{dis}} $ 1.33~2.46 1.51~3.58 2.51~4.92 2.73~5.67 0.85~2.29 k 2.37~5.10 2.80~12.04 4.22~6.51 5.02~7.01 0.78~6.92 $ \eta _{\text{α}}^{\text{low}} $ < 0.1 < 0.1 0.12~2.77 0.21~6.66 < 0.1 Nf 0.97~1.57a ~ ~ ~ ~ $ {\sigma }_{f} $ 1.40~1.50a ~ ~ ~ ~ Nu 1.00 a ~ ~ ~ ~ $ {\varepsilon }_{f} $ 2.38~2.41 a ~ ~ ~ ~ G 1.48~1.52 a ~ ~ ~ ~ $ \eta _{f}^{\text{low}} $ 0.91~1.62 a ~ ~ ~ ~ $ N_{\text{sample}}^{\text{MRV}} $ 1.17 a ~ ~ ~ ~ W 5.34~6.05 5.44~5.99 5.28~5.58 5.34~5.70 5.34~6.03 $ {\sigma }_{\alpha } $ 8.22~10.81 8.38~15.59 9.15~10.56 10.34~12.89 7.58~10.98 aFor 20Ne(n, αi)17O (i=0,1,2,3,4) and 20Ne(n, α0+α1)17O reactions, the values are the same. Table 2. Sources of the uncertainties and their magnitudes.
The uncertainty components listed in Table A1 are not all independent among different neutron energy points. For Nα, the uncertainty is dominated by the event-region selection, whereas the statistical uncertainty of the selected Nα events is smaller than 1% for all four reaction channels. This uncertainty was treated mainly as a point-to-point component, although it may also contain a small correlated contribution from the common event-selection procedure. In contrast, Nu,
$ N_{\text{sample}}^{\text{MRV}} $ and the standard 238U(n, f) cross section$ {\sigma }_{f} $ mainly contribute correlated normalization uncertainties. The correction factors$ \varepsilon _{\text{α}}^{\text{amp}} $ ,$ \varepsilon _{\text{α}}^{\text{dis}} $ ,k ,$ {\varepsilon }_{f} $ ,$ \eta _{\text{α}}^{\text{low}} $ ,$ \eta _{f}^{\text{low}} $ , G and W are energy dependent, but their uncertainties contain correlated components because they are derived from common experimental inputs, detector geometry, MRV definition, and simulation procedures. Therefore, the total uncertainties in Table A1 should not be regarded as fully point-to-point independent.En (MeV) Cross Sections (mb) 20Ne(n, α0)17O 20Ne(n, α1)17O 20Ne(n, α2)17O 20Ne(n, α3)17O 20Ne(n, α0+α1)17Oa 8.94±0.07 101.87±8.84 75.48±7.07 43.41±4.32 23.10±2.98 180.00±13.66 9.13±0.07 85.70±7.33 52.42±4.39 34.99±3.31 30.88±3.31 141.43±13.15 9.44±0.08 93.10±7.65 43.13±3.78 35.04±3.38 27.62±3.22 136.97±10.95 9.69±0.06 102.86±8.75 34.95±3.24 34.90±3.36 42.08±4.48 139.57±10.70 9.92±0.07 91.18±8.14 24.56±2.44 39.04±3.57 37.88±4.12 116.50±9.55 10.28±0.06 68.09±6.11 24.01±2.41 27.77±2.59 38.19±4.09 93.67±7.47 10.49±0.08 63.59±5.88 26.05±2.59 20.97±1.97 29.27±3.14 90.94±7.47 10.71±0.06 58.08±5.53 22.13±2.31 27.61±2.64 40.92±4.30 81.19±7.07 10.99±0.06 47.19±4.73 16.56±2.02 24.06±2.42 33.20±3.59 65.39±6.09 11.19±0.06 53.33±5.34 19.18±2.25 23.09±2.21 28.84±2.98 72.99±6.75 11.51±0.05 52.52±5.68 14.79±2.31 16.31±1.72 25.51±2.84 67.37±7.40 a The 20Ne(n, α0+α1)17O cross sections were obtained from the combined 20Ne(n, α0+α1)17O event yields in the uncorrected anode-energy spectrum, not from the arithmetic sum of the separate 20Ne(n, α0)17O and 20Ne(n, α1)17O cross sections. Table A1. The measured cross sections for the 20Ne(n, α)17O reaction.
-
According to Eqs. (1), (3), (4) and (5), the cross sections of the 20Ne(n, α0)17O, 20Ne(n, α1)17O, 20Ne(n, α2)17O, and 20Ne(n, α3)17O reactions can be obtained.
The measured cross sections of the 20Ne(n, αi)17O (i=0,1,2,3) reactions are shown in Fig. 7 and in Table A1 of Appendix A. The present α0, α1 and α2 partial cross sections exhibit an overall decreasing trend as the neutron energy increases, although the excitation functions are not completely smooth. In contrast, the α3 channel shows an overall rise-and-fall behavior, with more pronounced fluctuations over the measured energy region. Compared with the data of Shamu et al. [11], the present results show smoother excitation functions with smaller uncertainties, about 8.2%~12.9% compared with approximately 15.0% in the previous work. The present measurement also extends the state-resolved α0, α1, α2 and α3 data from 9.6 MeV to 11.5 MeV. The present measurement also extends the state-resolved 20Ne(n, αi)17O (i=0,1,2,3) cross section data from 9.6 MeV to 11.5 MeV. The smoother excitation functions mainly benefit from the improved event selection using the corrected anode-energy versus distance two-dimensional spectra, which enhances the separation of the αi (i=0,1,2,3) event groups and reduces the influence of channel overlap. The smaller uncertainties are largely attributed to the more comprehensive correction procedure for detector efficiency, background interference, low-energy neutron interference, and non-uniformity of neutron-field distribution.
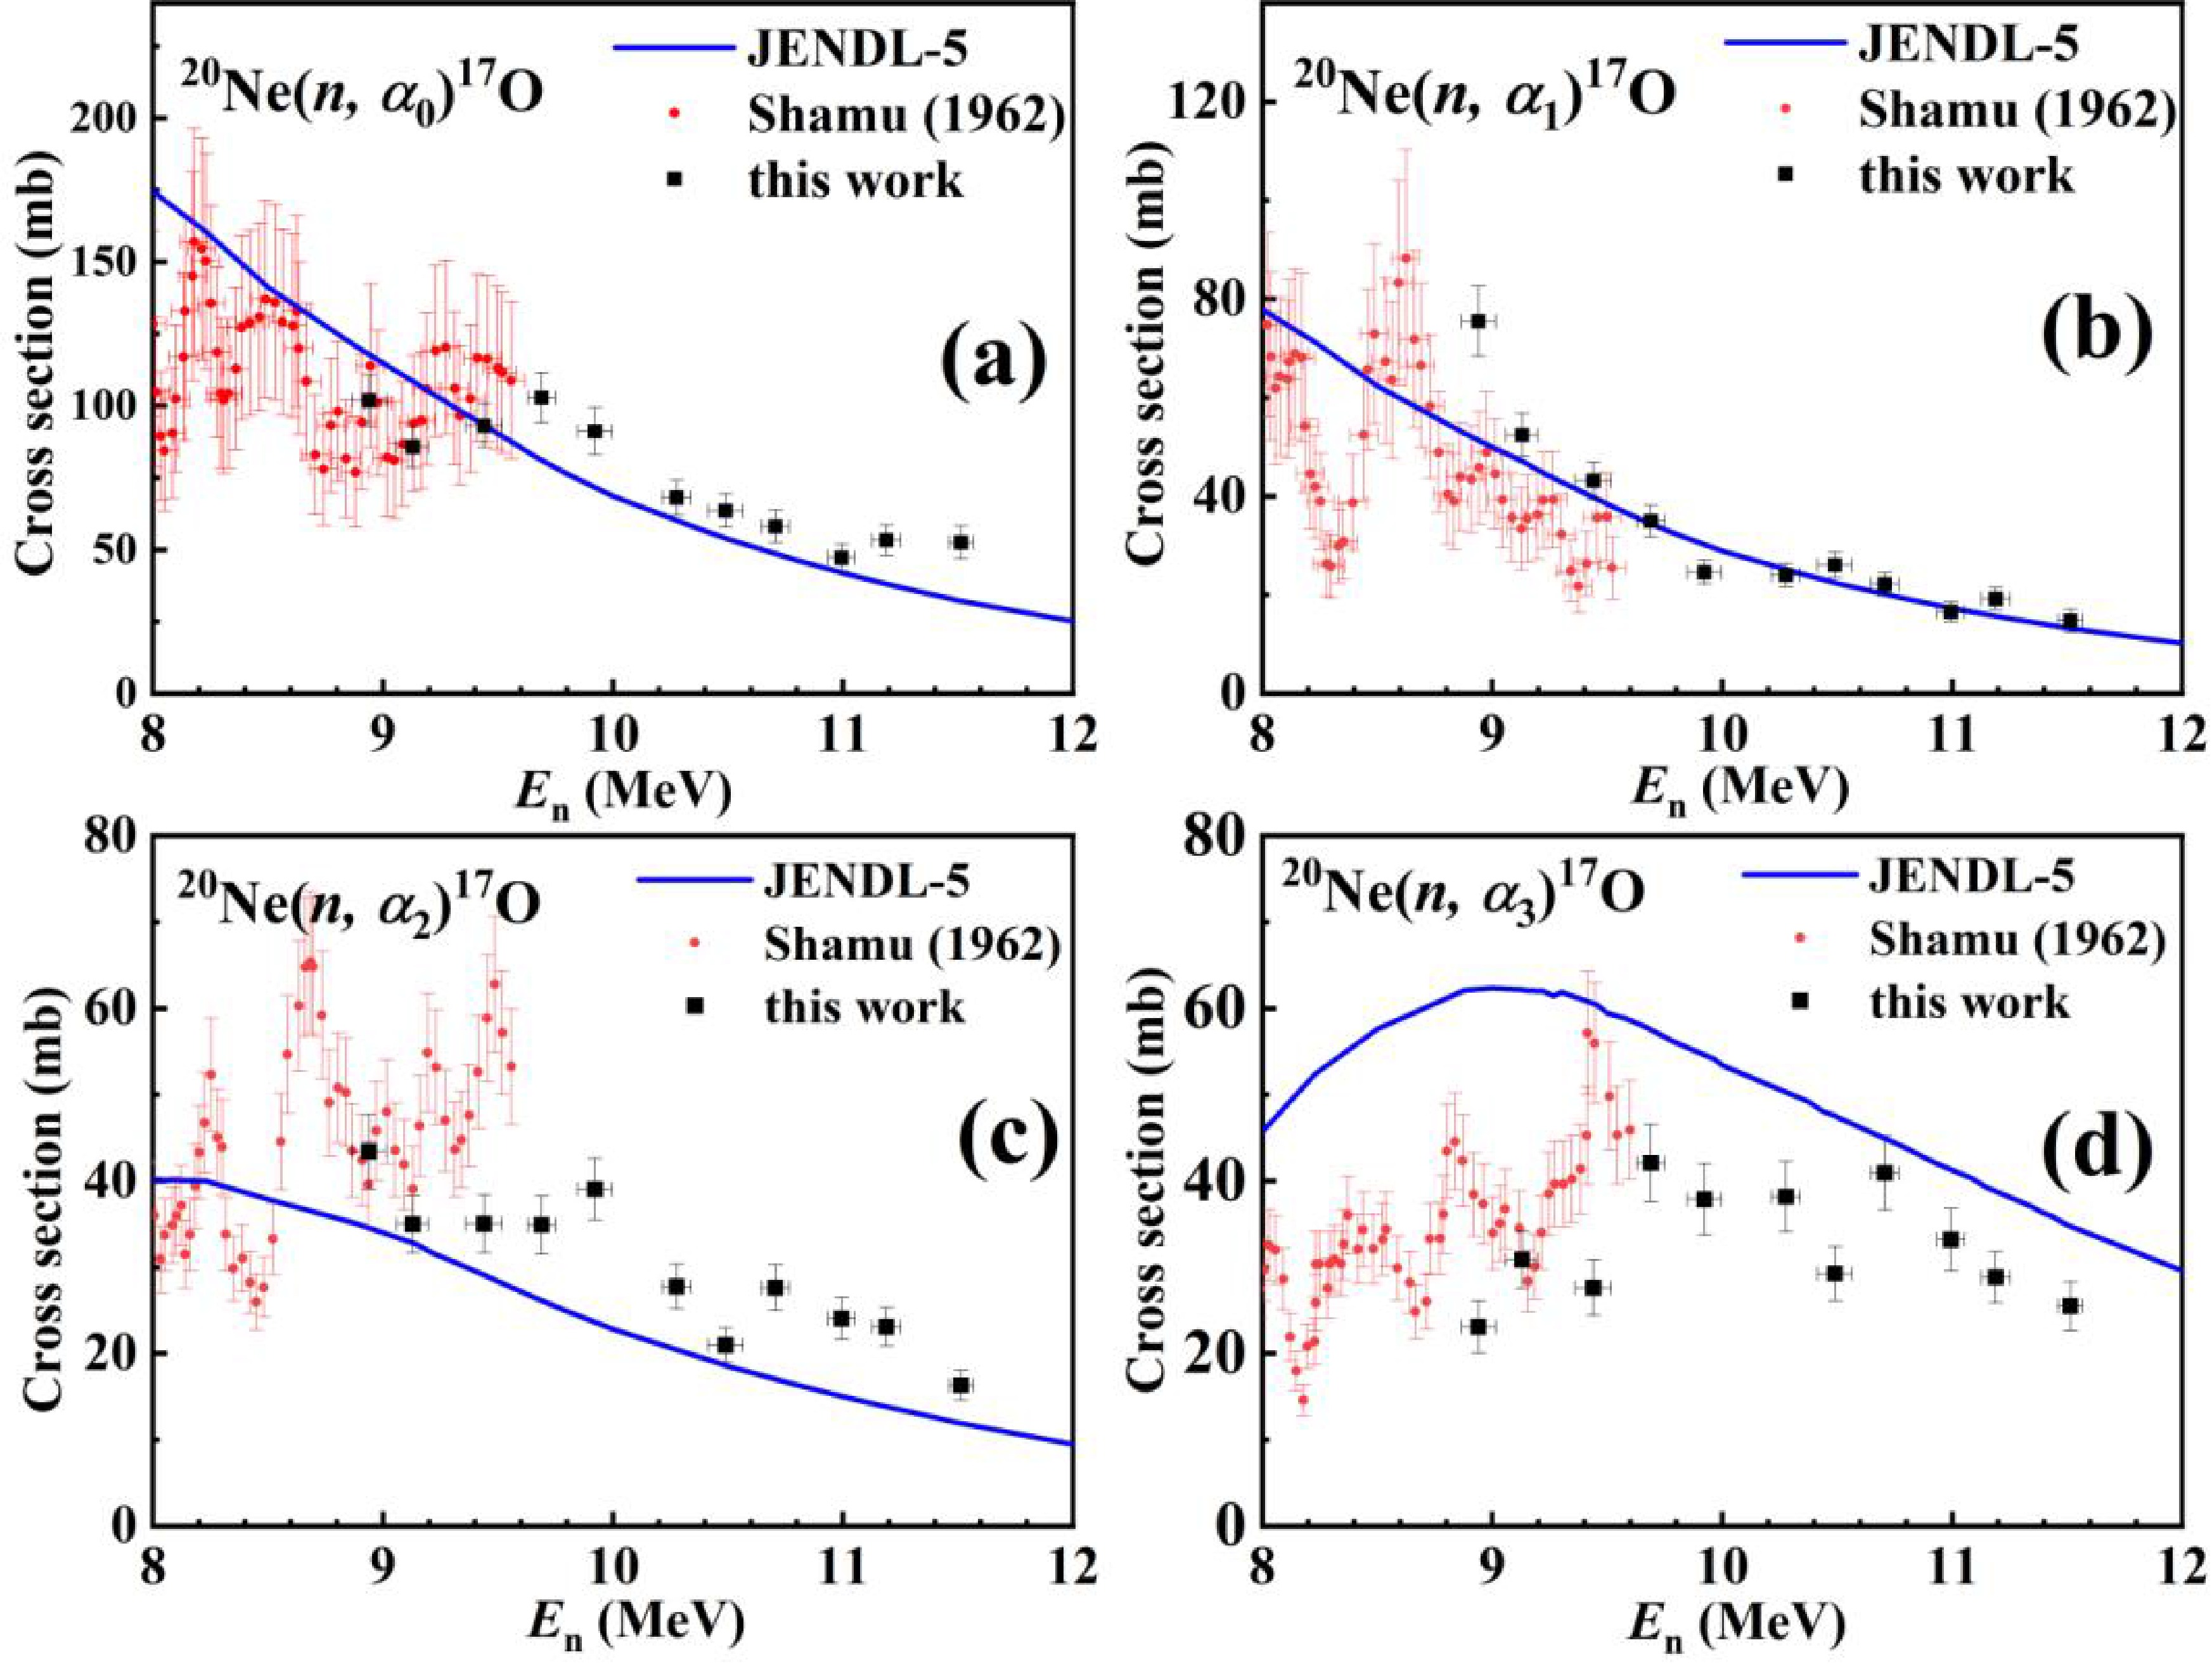
For the α0 channel, the present data show a decreasing overall trend as the neutron energy increases, and are close to that of JENDL-5 [18]. However, around 8.94 – 9.44 MeV (three energy points), the present α0 cross sections shows a local decrease followed by an increase. For the α1 channel, the present cross sections decrease rapidly from 8.94 to 9.20 MeV, which differs from the JENDL-5 evaluation [18]. Above 9.2 MeV, the cross sections decrease more slowly and show good agreement with JENDL-5 [18]. For the α2 channel, the present cross sections are systematically higher than the data in JENDL-5 [18]. While JENDL-5 [18] predicts a continuously decreasing excitation function, the present data shows oscillations around 9 – 12 MeV. The data of Shamu et al. [11] show large fluctuations in the α2 channel and are generally higher than both the present data and the evaluation in the neutron energy region of 9.0 – 10.0 MeV. For the α3 channel, the present cross sections are systematically lower than the data in JENDL-5 [18]. Similar with the α2 channel, the present data shows oscillations around 9 – 12 MeV. Compared with the data of Shamu et al. [11], the present results provide a clearer constraint on both the magnitude and energy dependence of this channel.
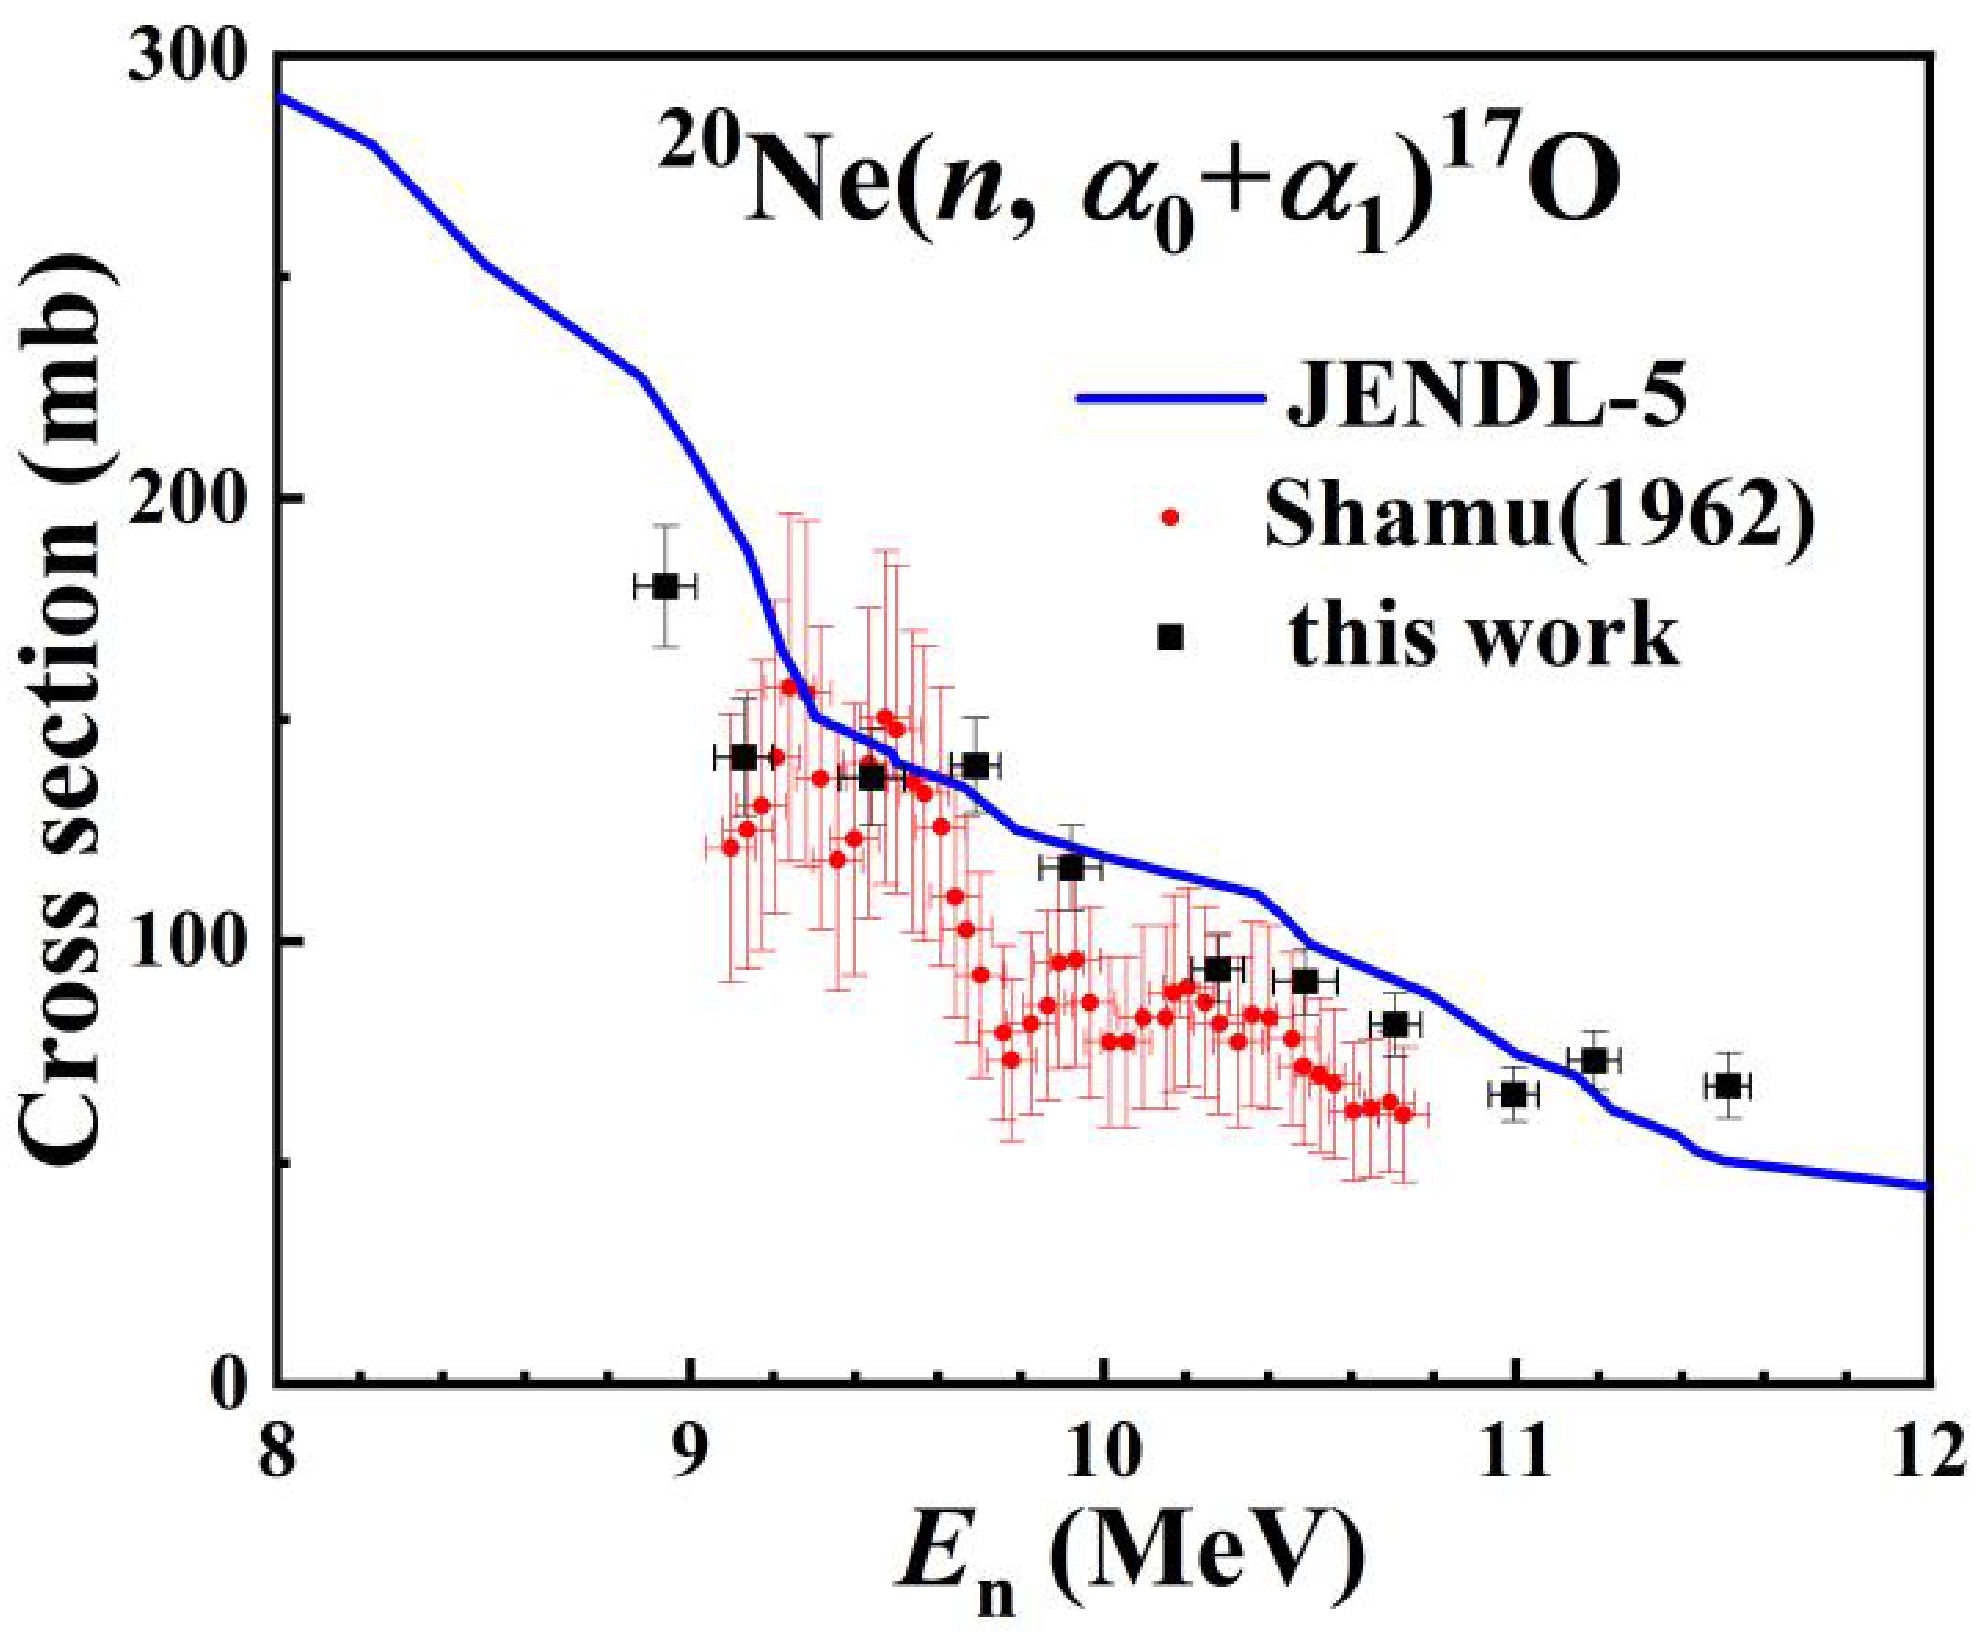
Cross sections of the 20Ne(n, α0+α1)17O reaction were also obtained for the 11 energy points, as shown in Fig. 8, with better uncertainties than those of the 20Ne(n, α1)17O reaction. In general, the present data are consistent with the sum of the cross sections of the 20Ne(n, α0)17O and 20Ne(n, α1)17O reactions in JENDL-5 [18]. This agreement indicates that the evaluated trend for the summed α0+α1 channel is reasonable in the present neutron-energy region. The present data are systematically higher than those of Shamu et al. [11], but they remain in agreement within the uncertainty ranges.
In general, the α0 and α1 results are reasonably consistent with those in JENDL-5 [18]. In contrast, the present α2 cross sections are systematically higher than those in JENDL-5 [18], whereas the α3 cross sections are generally lower. Since the α2 and α3 channels populate higher excited states in 17O, their calculated cross sections may be more sensitive to the α-particle transmission coefficients, spin-parity coupling, and competition among open decay channels than those of the α0 and α1 channels. The generally good agreement observed for the α0 and α1 channels suggests that the overall magnitude of the 20Ne(n, α)17O reaction and the population of the lowest states in 17O are reasonably described by the current evaluation. In contrast, the systematic differences observed for the α2 and α3 channels indicate that the predicted branching ratios among the excited states of 17O may not be fully consistent with the experimental observations.
-
Theoretical calculations for the 20Ne(n, αi)17O (i=0,1,2,3) reaction were performed using the TALYS code [1]. TALYS provides a unified framework for the calculation of neutron-induced nuclear reaction cross sections by combining optical-model calculations, direct reaction contributions, pre-equilibrium emission, and Hauser-Feshbach compound-nucleus decay. In the present work, the TALYS calculations were performed primarily as a sensitivity study to investigate the influence of different model parameters on the state-resolved cross sections. Five TALYS-2.2 [30] model parameters were considered as shown in Table 3, and their values were used for generating 108 model sets (each set is a combination of all model parameters). A more detailed description of their meaning and available values may be found in Refs. [31,32].
Parameter Meaning Values alphaomp Alpha optical model 5, 6b, 8 ldmodel Level density 1b, 2, 5 colenhance Collective enhancement nb, y widthmode Width fluctuation corrections 0, 1b, 2 preequilibrium Pre-equilibrium reaction mechanism n, yb Table 3. List of TALYS model parameters and their values used for generating 108 model sets (Superscript “b” represents the selected best model parameters combination).
The results of TALYS-2.2 [30] calculation are shown in Fig. 9. Shaded area represents the range covered by the 108 tested model combinations, the solid line represents the arithmetic mean of the calculations, and the black dashed line represents the selected best calculation. In addition, the red dashed line represents the evaluation data in JENDL-5 [18]. The best TALYS parameter set was selected according to a χ2-based criterion. For each model combination, the average χ2 value was calculated as
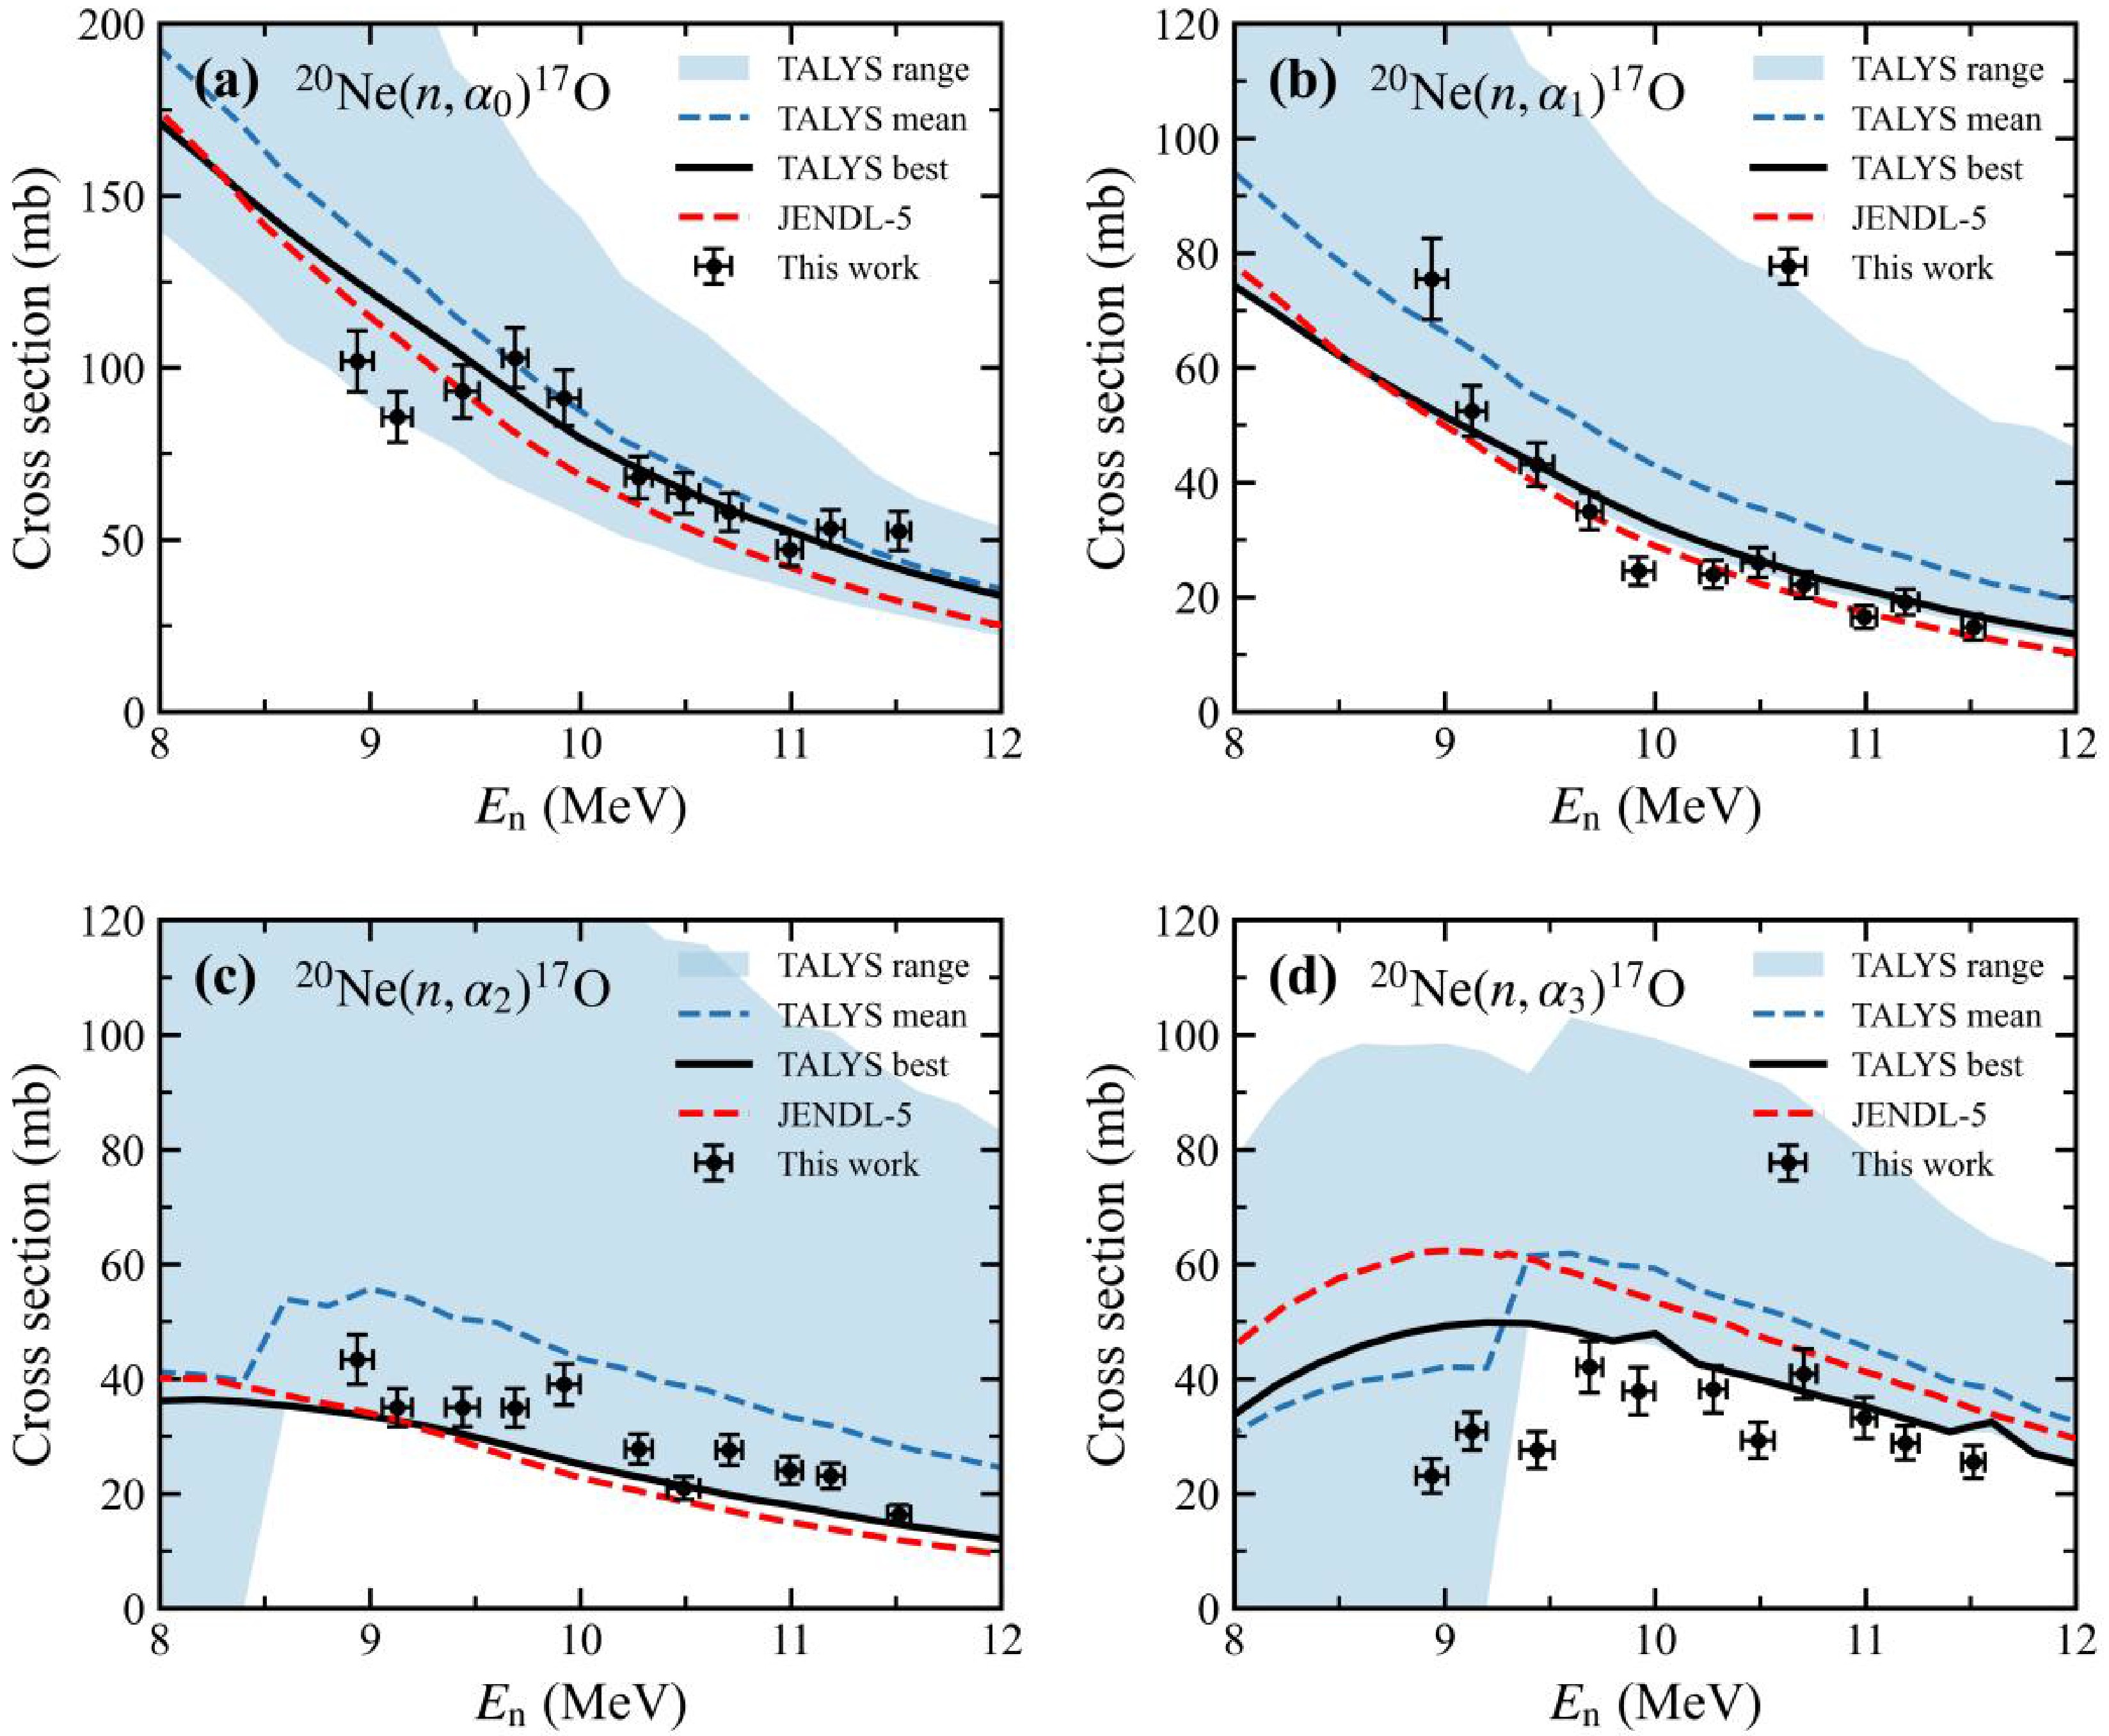
Figure 9. (color online) TALYS-calculated cross sections for the 20Ne(n, αi)17O (i=0,1,2,3) reactions compared with the measured data and the evaluated data from JENDL-5 [18].
$ {\chi }^{2}={\sum \limits_{i=0}^{3}\sum \limits_{j=1}^{N}\left(\frac{\sigma _{i,j}^{\text{cal}}-\sigma _{i,j}^{\text{exp}}}{\Delta \sigma _{i,j}^{\text{exp}}}\right)}^{2}, $
(6) where i denotes the (n, αi) (i= 0,1,2,3) channel, j denotes the neutron-energy point, N is the number of measured neutron-energy points,
$ \sigma _{i,j}^{\text{cal}} $ is the TALYS calculated cross sections,$ \sigma _{i,j}^{\exp } $ is the measured cross sections, and$ \Delta \sigma _{i,j}^{\exp } $ is the uncertainty of the measured cross sections. All measured data points for the four state-resolved channels were included in the comparison. No additional channel dependent weighting factor was applied. Therefore, the four channels were treated equally apart from the weighting by their individual experimental uncertainties. Among the tested model combinations, the parameter set with (alphaomp = 6, ldmodel = 1, colenhance = n, widthmode = 1, preequilibrium = y) gives the smallest overall deviation from the measured 20Ne(n, αi)17O (i=0,1,2,3) cross sections.Among the investigated parameters, the α-particle optical-model potential appears to have a significant influence on the calculated cross sections, because the α-particle transmission coefficients directly affect the probability of α emission from the compound nucleus. The level-density prescription also affects the calculated partial cross sections by modifying the statistical competition between the explicitly treated low-lying final states and the higher energy states of the compound nucleus 21Ne. The better agreement obtained with (ldmodel = 1), corresponding to the Constant Temperature plus Fermi-gas level-density model in TALYS [30], indicates that this level-density prescription provides the most suitable description among the tested models for the statistical decay calculation in the present neutron-energy region. The inclusion of pre-equilibrium emission (preequilibrium = y) leads to improved agreement with the present measurement data. The preferred value (colenhance = n) further indicates that only introducing a global collective enhancement of the level density does not improve the description of the present state-resolved data within the tested TALYS framework.
The selected TALYS calculation reproduces the general decreasing trend of the measured α0 and α1 cross sections in the 8–12 MeV region. The α2 channel shows a larger model dependence, but most of the experimental data are covered by the calculated model band. For the α3 channel, the TALYS calculated results are higher than the measured results in the 8–12 MeV region. Additional checks were performed to examine possible experimental contributions to the discrepancy between the results of measured data and TALYS calculations. To estimate the influence of the PHD-related event-selection boundary, the anode-energy selection range of the selected event regions was varied by 0.02 MeV. This value corresponds to the largest reasonable boundary variation that can be applied while maintaining a reliable separation of neighboring event groups. A larger variation would lead to severe overlap between adjacent event regions and would no longer represent a reasonable event-selection uncertainty. The resulting variation of the extracted α3 cross sections is 2.4%–3.6%, which was included in the uncertainty of Nα. Possible contributions from the α4 and α5 events to the selected α3 region were also considered and it found to be smaller than 7%. The low-energy neutron correction for α3 mainly arises from low-energy neutron induced α0 events entering the selected α3 region. This contribution exceeds 10% only for the four neutron energy points, namely 8.93, 9.13, 9.43, and 9.68 MeV, and is not significant above 10 MeV. Therefore, the experimental effects considered here are unlikely to fully account for the systematic overestimation of the α3 cross section by the TALYS calculations. For TALYS calculation, the overestimation of the α3 cross section is likely related to two factors. First, α3 populates a higher excited state of 17O, resulting in a lower outgoing α-particle energy and stronger sensitivity to the Coulomb-barrier penetrability and the α optical potential. Second, the population of this state depends on spin-parity coupling and the detailed structure of the 21Ne*, which may not be fully described by a global Hauser-Feshbach calculation. Although the present TALYS analysis does not uniquely determine the underlying reaction mechanism, it demonstrates the usefulness of the present experimental data for constraining model calculations and for evaluation of nuclear data. Further theoretical investigations would be valuable for clarifying the roles of the α-particle optical-model potential, level-density prescription, pre-equilibrium processes and global collective enhancement in the 20Ne(n, α)17O reaction.
-
Cross sections for the 20Ne(n, αi)17O (i=0,1,2,3) reactions were measured in the neutron-energy region of 8.9 – 11.5 MeV (11 energy points) using a twin GIC. The GIC was filled with a neon-based gas mixture, in which the natural neon component served as the reaction sample, while the chamber was used for charged particle detection. The present measurement provides new α0, α1, α2 and α3 partial cross-section data from 9.6 to 11.5 MeV, where previous measurement results are limited to the summed α0+α1 cross sections. The summed 20Ne(n, α0+α1)17O cross sections were also determined from the combined α0+α1 yields, providing a more reliable cross-section quantity for comparison with previous measurements and evaluation data. Compared with previous measurements, the present work provides several improvements in the data analysis. First, the corrected anode-energy versus distance two-dimensional spectra were used for event selection, which improved the separation of the α0, α1, α2 and α3 event groups. Second, detailed Monte Carlo simulations were performed to determine the anode detection efficiency, detection efficiency for distance, background interference correction, low-energy neutron interference correction, non-uniformity of neutron-field distribution and the effective number of 20Ne nuclei. These improvements reduce the uncertainties associated with detector efficiency and background subtraction and enable a more reliable extraction of the state-resolved 20Ne(n, αi)17O (i=0,1,2,3) cross sections. The measured α0+α1 cross sections show a clear decreasing trend with increasing neutron energy and are generally consistent with the evaluation data in JENDL-5 [18]. Both individual α0 and α1 cross sections decrease as the neutron energy increases and are reasonably consistent with the data in JENDL-5 [18]. In contrast, for α2 and α3 cross sections, significant deviations between the present data and those in JENDL-5 library [18] are observed: The present α2 cross sections are systematically higher than those in JENDL-5 in most of the measured energy region, whereas the α3 cross sections are generally lower than those in JENDL-5 [18]. In detail, the JENDL-5 evaluation [18] does not fully capture the pronounced fluctuations observed in the measured excitation functions. Analysis using TALYS-2.2 [30] shows that the measured α0, α1, α2 and α3 cross sections provide sensitive constraints on the parameters of α-particle optical potential, level-density, width-fluctuation, and pre-equilibrium contribution. The TALYS-2.2 calculations can describe the measured α0, α1 and α2 cross sections, whereas the calculated α3 cross sections overestimate the measured data in the 8–12 MeV region. The present cross sections for the 20Ne(n, αi)17O (i=0,1,2,3) reactions and the 20Ne(n, α0+α1)17O reaction can provide detailed information on the population of individual states in 17O. The observed discrepancies with the JENDL-5 evaluation [18] for the α2 and α3 channels demonstrate that state-resolved experimental data are essential for testing and improving nuclear reaction models. The dataset reported in the present work therefore constitutes an important benchmark for future evaluations of neutron-induced reactions on 20Ne and for further developments of Hauser–Feshbach-based reaction calculations.
Cross sections of the 20Ne(n, α)17O reaction in the 8.9 – 11.5 MeV neutron energy region
- Received Date: 2026-08-01
- Available Online: 2026-10-01
Abstract: State-resolved cross sections for the 20Ne(n, αi)17O (i=0,1,2,3) reactions were measured in the 8.9 – 11.5 MeV neutron energy region (11 energy points) at the HI-13 tandem accelerator of the China Institute of Atomic Energy (CIAE). The present measurements extend the data of the α0, α1, α2, and α3 channels from 9.6 MeV to 11.5 MeV, where previous measurements reported only the summed (α0+ α1) cross sections. A twin gridded ionization chamber (GIC) filled with a neon-based gas mixture was used as the charged-particle detection, with the neon gas serving as an active sample. Corrections for detector efficiency, background interference, and neutron-field non-uniformity were performed by combining experimental measurements and detailed Monte Carlo simulations. From 9.6 to 11.5 MeV, the measured 20Ne(n, α0)17O and 20Ne(n, α1)17O cross sections decrease as neutron energy increases, and are generally consistent with those in JENDL-5. The 20Ne(n, α2)17O cross sections are generally above those in JENDL-5, whereas the 20Ne(n, α3)17O cross sections are below those in JENDL-5. In detail, the measured excitation functions exhibit noticeable fluctuations that are not included in JENDL-5. The TALYS-2.2 calculations can describe the measured α0, α1 and α2 cross sections reasonably, whereas the calculated α3 cross sections are generally higher than the measured α3 cross sections. The present data provide new state-resolved constraints for modeling the 20Ne(n, α)17O reaction and improving nuclear data evaluation.



 DownLoad: