


 Abstract
 HTML
HTML Reference
 Related
 PDF
PDF


-
In heavy-ion collisions above the Coulomb barrier, reactions in which the projectile loses only a moderate amount of energy and exchanges only a few nucleons with the target nucleus are assumed to occur when the two ions make grazing contact at their surfaces. Single-nucleon transfer reactions typically occur when nuclear surfaces approach distances at which the tails of the two wavefunctions begin to overlap in the attractive nuclear field [1]. Accordingly, single-nucleon transfer reactions are inherently sensitive to the tails of the nuclear wavefunctions and, consequently, to the radius and diffuseness of the nuclear potential. Because single-nucleon transfer is a direct, one-step reaction, Distorted Wave Born Approximation (DWBA) calculations [2−4] can be employed to extract the optical potential parameters, from which the interaction radius can be determined [5−8]. As a key parameter, the interaction radius characterizes the distance scale at which two nuclei begin to interact and provides critical insight into the nuclear potential and collision geometry. In this work, single-proton transfer reactions
$ ^{56,58}\mathrm{Fe}(^{18}\mathrm{O},^{17}\mathrm{N})^{57,59}\mathrm{Co} $ were carried out, and DWBA calculations were employed to reproduce the experimental data using the systematic optical potential for heavy ions [9] to investigate the interaction radii. The obtained results were then compared with the radii extracted from Refs. [7, 10−14]. -
In heavy-ion collisions above the Coulomb barrier, reactions in which the projectile loses only a moderate amount of energy and exchanges only a few nucleons with the target nucleus are assumed to occur when the two ions make grazing contact at their surfaces. Single-nucleon transfer reactions typically occur when nuclear surfaces approach distances at which the tails of the two wavefunctions begin to overlap in the attractive nuclear field [1]. Accordingly, single-nucleon transfer reactions are inherently sensitive to the tails of the nuclear wavefunctions and, consequently, to the radius and diffuseness of the nuclear potential. Because single-nucleon transfer is a direct, one-step reaction, Distorted Wave Born Approximation (DWBA) calculations [2−4] can be employed to extract the optical potential parameters, from which the interaction radius can be determined [5−8]. As a key parameter, the interaction radius characterizes the distance scale at which two nuclei begin to interact and provides critical insight into the nuclear potential and collision geometry. In this work, single-proton transfer reactions
$ ^{56,58}\mathrm{Fe}(^{18}\mathrm{O},^{17}\mathrm{N})^{57,59}\mathrm{Co} $ were carried out, and DWBA calculations were employed to reproduce the experimental data using the systematic optical potential for heavy ions [9] to investigate the interaction radii. The obtained results were then compared with the radii extracted from Refs. [7, 10−14]. -
The experiments were carried out at the Tandem Accelerator of the Japan Atomic Energy Agency (JAEA). An
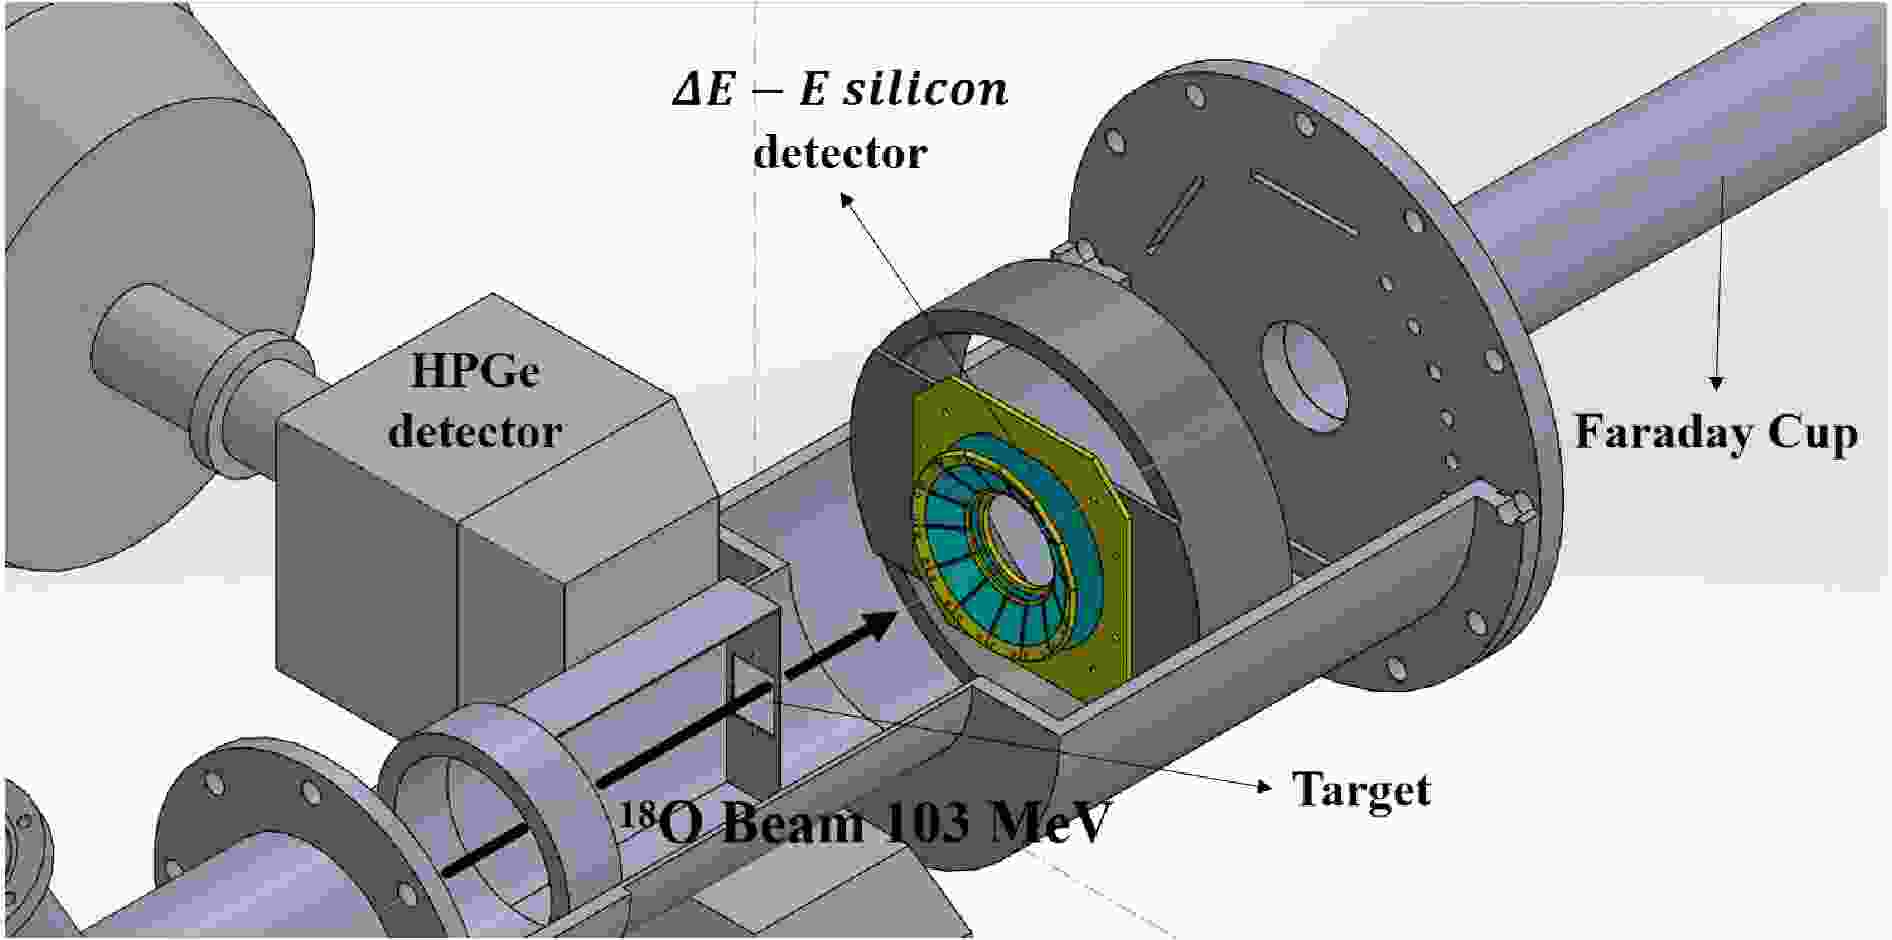
$ ^{18}\mathrm{O} $ beam with an incident energy of$ 103.0\; \mathrm{MeV} $ was directed onto metallic self-supporting iron foil targets. The$ ^{56}\mathrm{Fe} $ target was$ 402\; \text{µ} \mathrm{g}/\mathrm{cm}^2 $ thick, with an isotopic enrichment of$ 99.4 $ %, whereas the$ ^{58}\mathrm{Fe} $ target had a thickness of$ 260\; \text{µ} \mathrm{g}/\mathrm{cm}^2 $ and an isotopic enrichment of$ 96.3 $ %. An array of$ \Delta E-E $ silicon detectors was placed approximately$ 110\; \mathrm{mm} $ downstream of the target to identify light ejectiles. The trapezoidal$ \Delta E $ detectors were arranged in a ring around the beam axis to collect the scattered ejectiles over an angular range of 12.2°−21.4° relative to the beam direction. The thickness of the$ \Delta E $ detector was 68 μm. The E detector was an annular detector segmented into 16 ring-shaped strips, allowing the ejectile scattering angle to be determined with an angular resolution of approximately 0.6°. The E detector had a thickness of 300 μm. Four HPGe detectors were mounted perpendicular to the beam axis for measurements of the$ ^{56,58}\mathrm{Fe}(^{18}\mathrm{O},^{16}\mathrm{O}\gamma)^{58,60}\mathrm{Fe} $ reactions [15]. A Faraday cup was installed approximately$ 1.3\; \mathrm{m} $ downstream of the target to integrate the$ ^{18}\mathrm{O} $ beam dose. The average intensity of the$ ^{18}\mathrm{O} $ beam was approximately$ 0.2\; \mathrm{pnA} $ , and the diameter of the beam spot was less than$ 3\; \mathrm{mm} $ . Each Fe target was irradiated for approximately 2.5 days, and the total accumulated numbers of$ ^{17}\mathrm{N} $ were approximately$ 9.2 \times 10^5 $ and$ 1.0 \times 10^6 $ for the$ ^{56}\mathrm{Fe} $ and$ ^{58}\mathrm{Fe} $ targets, respectively. -
The experiments were carried out at the Tandem Accelerator of the Japan Atomic Energy Agency (JAEA). An
$ ^{18}\mathrm{O} $ beam with an incident energy of$ 103.0\; \mathrm{MeV} $ was directed onto metallic self-supporting iron foil targets. The$ ^{56}\mathrm{Fe} $ target was$ 402\; \text{µ} \mathrm{g}/\mathrm{cm}^2 $ thick, with an isotopic enrichment of$ 99.4 $ %, whereas the$ ^{58}\mathrm{Fe} $ target had a thickness of$ 260\; \text{µ} \mathrm{g}/\mathrm{cm}^2 $ and an isotopic enrichment of$ 96.3 $ %. An array of$ \Delta E-E $ silicon detectors was placed approximately$ 110\; \mathrm{mm} $ downstream of the target to identify light ejectiles. The trapezoidal$ \Delta E $ detectors were arranged in a ring around the beam axis to collect the scattered ejectiles over an angular range of 12.2°−21.4° relative to the beam direction. The thickness of the$ \Delta E $ detector was 68 μm. The E detector was an annular detector segmented into 16 ring-shaped strips, allowing the ejectile scattering angle to be determined with an angular resolution of approximately 0.6°. The E detector had a thickness of 300 μm. Four HPGe detectors were mounted perpendicular to the beam axis for measurements of the$ ^{56,58}\mathrm{Fe}(^{18}\mathrm{O},^{16}\mathrm{O}\gamma)^{58,60}\mathrm{Fe} $ reactions [15]. A Faraday cup was installed approximately$ 1.3\; \mathrm{m} $ downstream of the target to integrate the$ ^{18}\mathrm{O} $ beam dose. The average intensity of the$ ^{18}\mathrm{O} $ beam was approximately$ 0.2\; \mathrm{pnA} $ , and the diameter of the beam spot was less than$ 3\; \mathrm{mm} $ . Each Fe target was irradiated for approximately 2.5 days, and the total accumulated numbers of$ ^{17}\mathrm{N} $ were approximately$ 9.2 \times 10^5 $ and$ 1.0 \times 10^6 $ for the$ ^{56}\mathrm{Fe} $ and$ ^{58}\mathrm{Fe} $ targets, respectively. -
Particle identification was performed using the two-dimensional
$ \Delta E - E_\text{t} $ spectrum collected with the$ \Delta E - E $ silicon telescope, where$ E_\text{t} $ is the total energy, defined as the sum of the energy loss in the$ \Delta E $ detector and the residual energy deposited in the annular E detector. As an example, the$ \Delta E - E_\text{t} $ scatter plot obtained from one$ \Delta E $ detector and the fifth inner strip of the annular E detector is shown in Fig. 1. A cut was applied to select$ ^{17}\mathrm{N} $ events from the$ ^{58}\mathrm{Fe}(^{18}\mathrm{O},^{17}\mathrm{N})^{59}\mathrm{Co} $ proton transfer reaction. Because the first excited-state energies of$ ^{17}\mathrm{N} $ and$ ^{57,59}\mathrm{Co} $ are 1373.9, 1224.0, and 1099.3 keV, respectively, the$ ^{17}\mathrm{N} $ ground state can be clearly separated and identified in the$ \Delta E - E_\text{t} $ two-dimensional spectrum. Within the selected cut,$ ^{17}\mathrm{N} $ and$ ^{59}\mathrm{Co} $ are both in their ground states, as determined from the reaction kinematics. The energy resolution for$ ^{17}\mathrm{N} $ is approximately 0.5 MeV in full width at half maximum (FWHM), dominated by the noise of the silicon detectors and the angular uncertainty arising from the$ \sim $ 0.6° acceptance of each ring.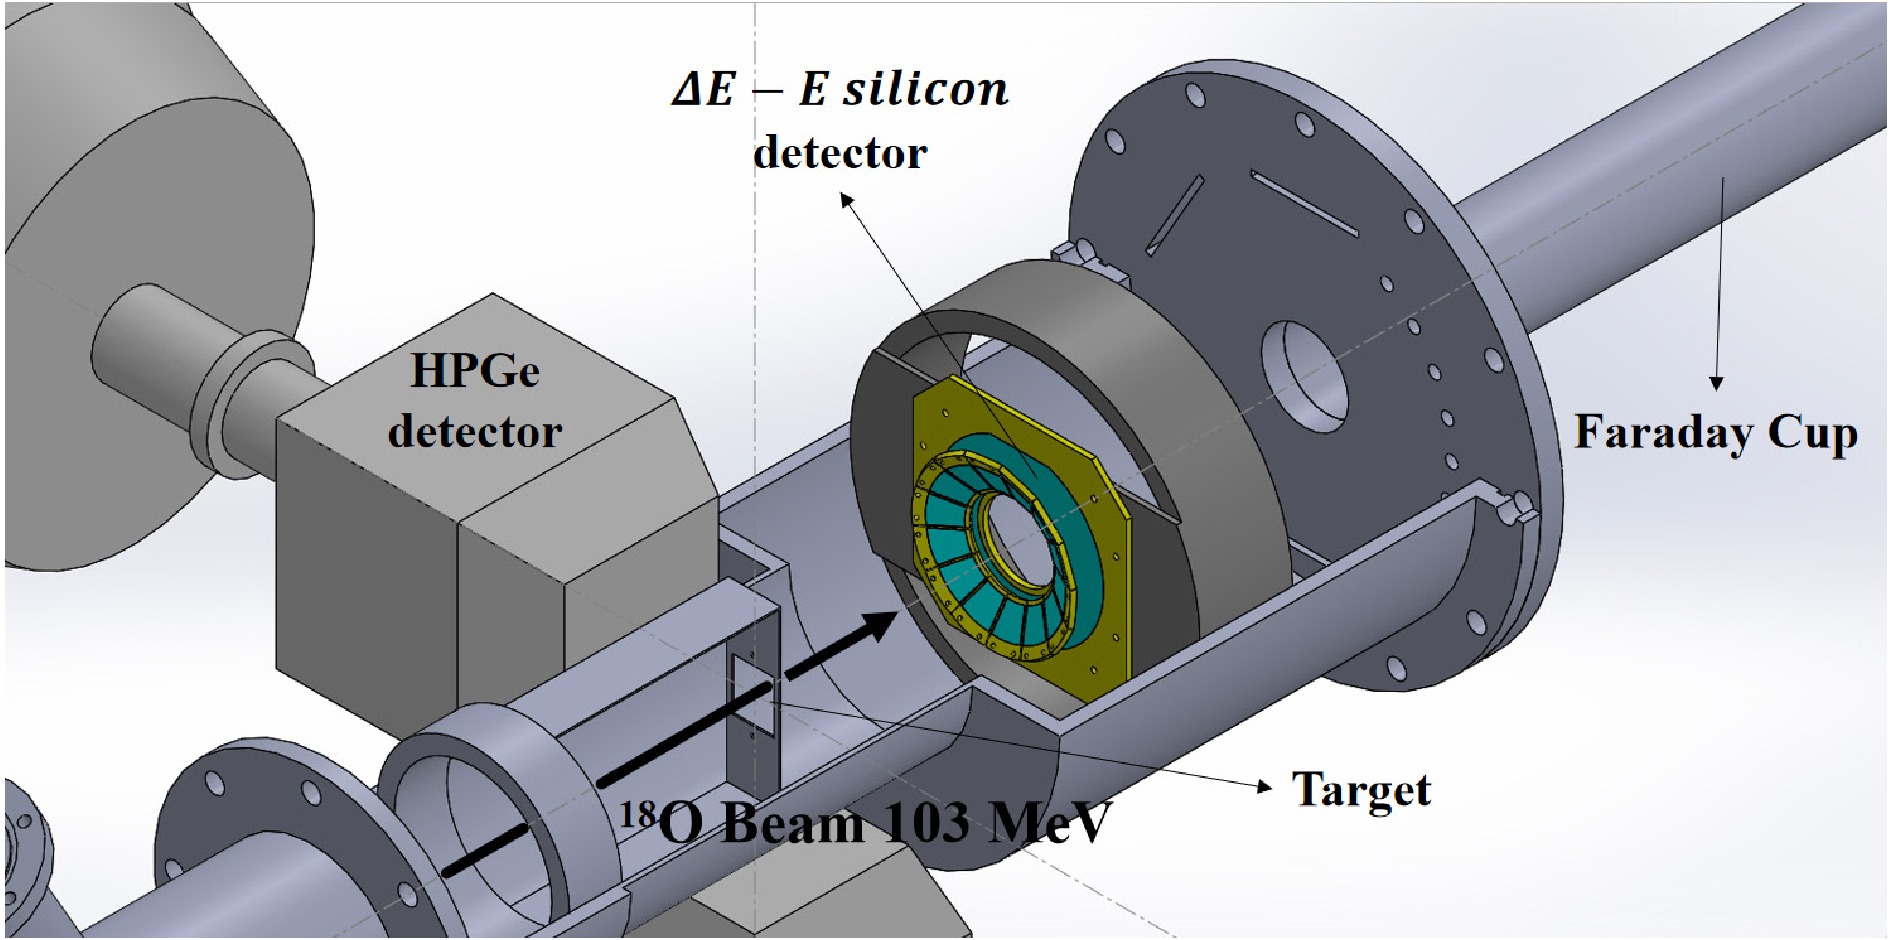
Figure 1. (color online) Experimental Setup.
After the
$ ^{17}\mathrm{N} $ events were obtained for each strip of the annular E detector in the$ ^{56,58}\mathrm{Fe}(^{18}\mathrm{O},^{17}\mathrm{N})^{57,59}\mathrm{Co} $ reactions, the angular distributions for the ground-state transitions to$ ^{59}\mathrm{Co} $ and$ ^{57}\mathrm{Co} $ were extracted, as shown in Fig. 2. The$ \Delta E-E $ silicon telescope covered laboratory angles of 12.2°−21.4°, corresponding to 16.5°−27.6° in the center-of-mass (c.m.) frame. This angular range includes the main peaks of the proton-transfer angular distributions, as the grazing angles for the$ ^{56,58}\mathrm{Fe}(^{18}\mathrm{O},^{17}\mathrm{N})^{57,59}\mathrm{Co} $ reactions are approximately 21° (c.m.), as shown in Fig. 3. Angular uncertainties are dominated by the$ \sim $ 0.6° angular bin size of the individual E detector strips. The reported cross-section uncertainties include statistical contributions and background-subtraction uncertainties.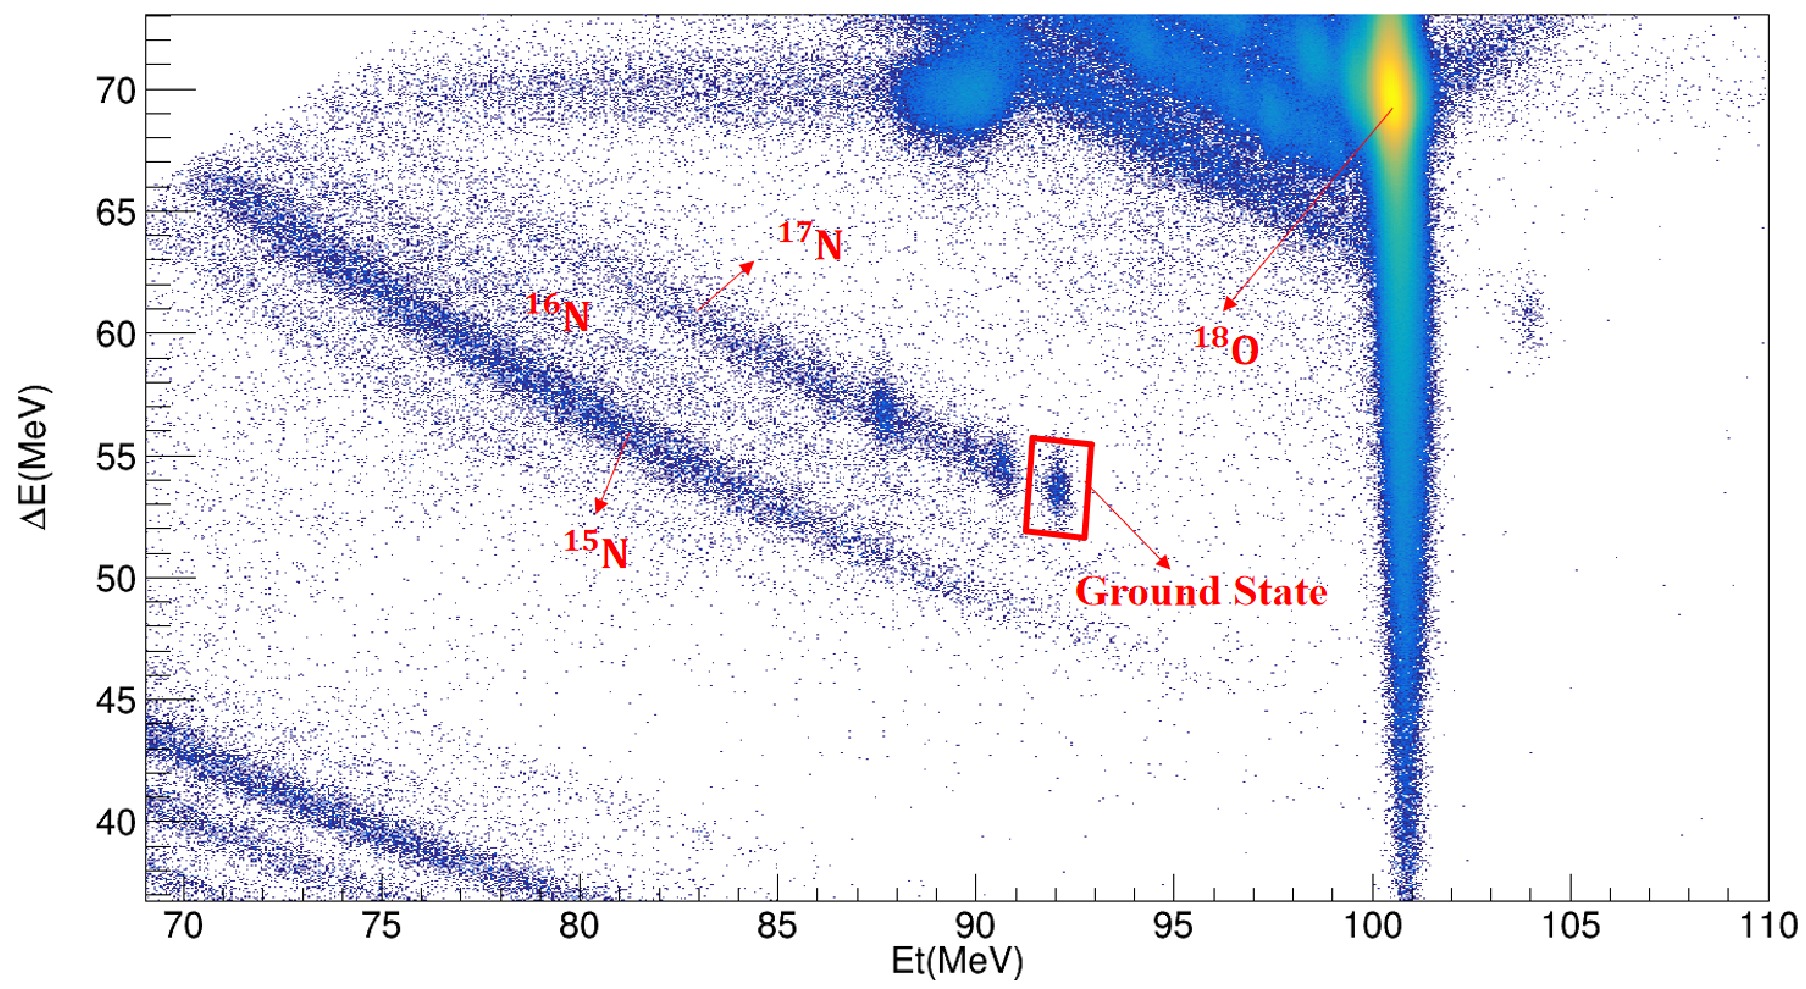
Figure 2. (color online)
$\Delta E - E_\text{t}$ two-dimensional spectrum of the products from$^{18}\mathrm{O} + ^{58}\mathrm{Fe}$ . A cut is set to select the ($^{18}\mathrm{O}$ ,$^{17}\mathrm{N}$ ) events where$^{17}\mathrm{N} $ $ $ and$^{59}\mathrm{Co}$ are both in ground states.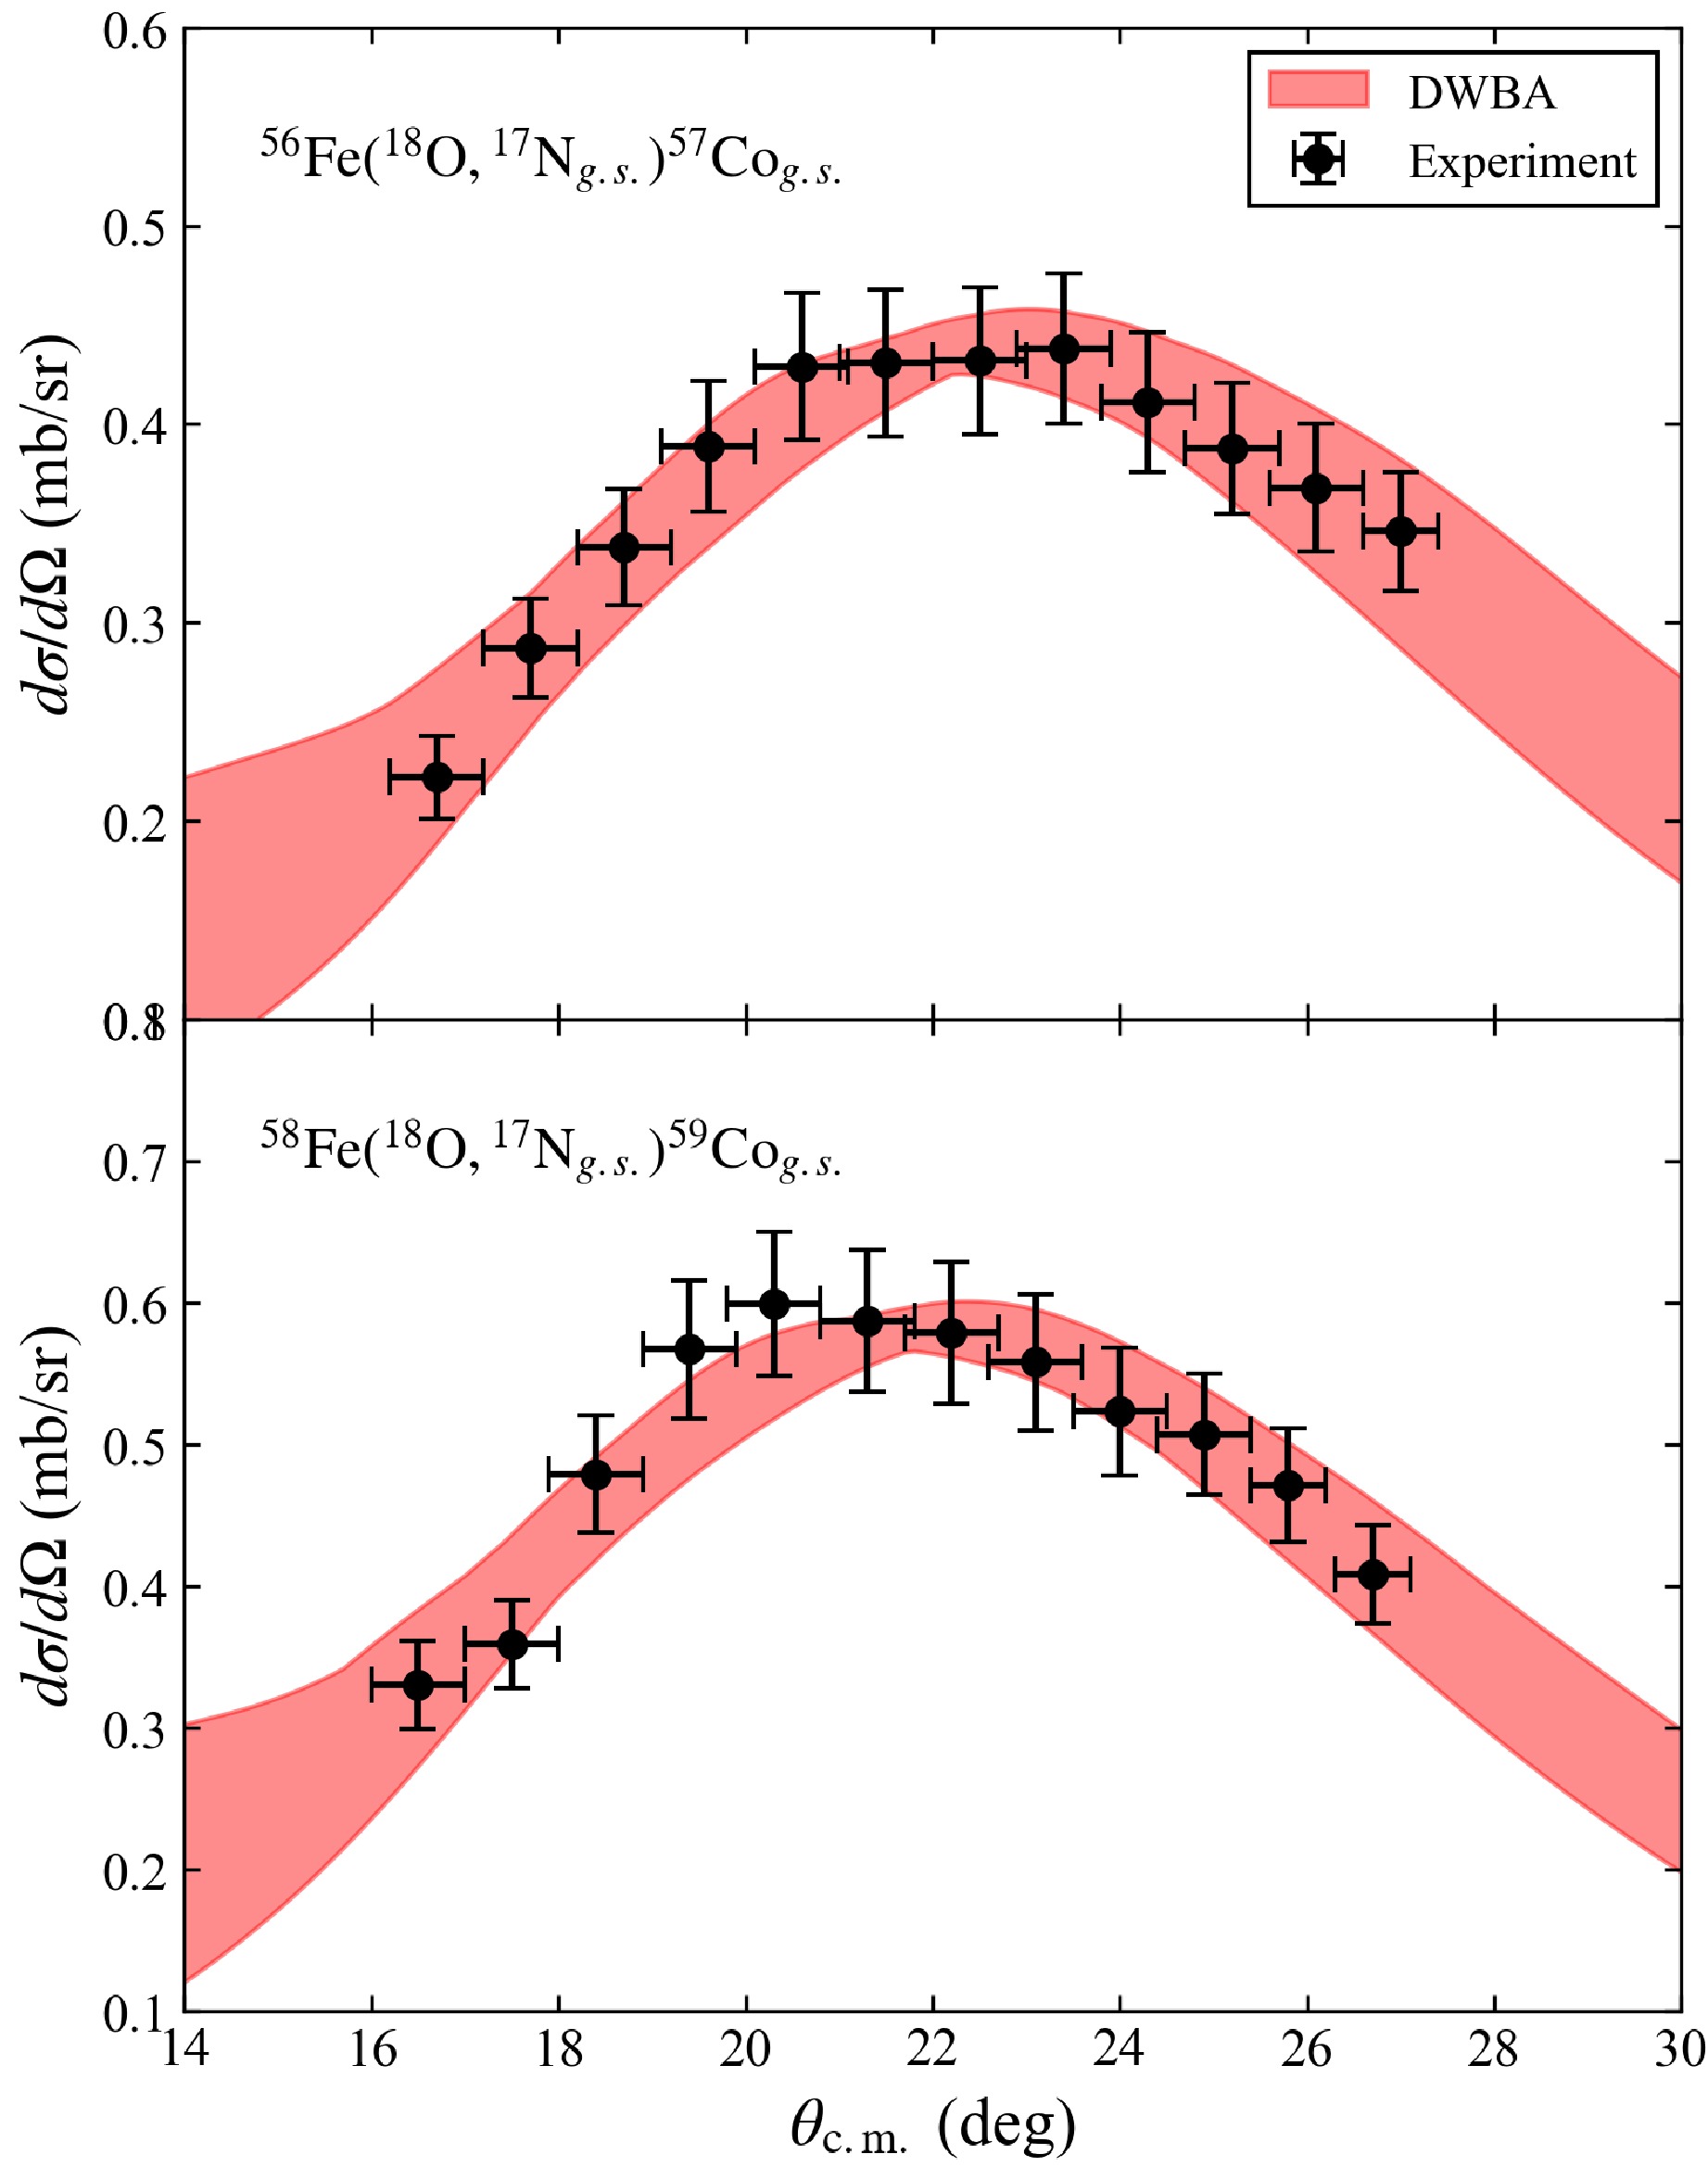
Figure 3. (color online) The angular distributions of
$^{56}\mathrm{Fe}(^{18}\mathrm{O}, ^{17}\mathrm{N}_\text{g.s.})^{57}\mathrm{Co}_\text{g.s.}$ and$^{58}\mathrm{Fe}(^{18}\mathrm{O}, ^{17}\mathrm{N}_\text{g.s.})^{59}\mathrm{Co}_\text{g.s.}$ reactions. The black solid circles are the experimental data, the DWBA calculations are red bands. The spectroscopic factors of these two reactions are$0.10 \pm 0.06$ for$^{56}\mathrm{Fe}(^{18}\mathrm{O}, ^{17}\mathrm{N}_\text{g.s.})^{57}\mathrm{Co}_\text{g.s.}$ and$0.14 \pm 0.08$ for$^{58}\mathrm{Fe}(^{18}\mathrm{O}, ^{17}\mathrm{N}_\text{g.s.})^{59}\mathrm{Co}_\text{g.s.}$ .To extract the optical potential parameters for the
$ ^{56,58}\mathrm{Fe}(^{18}\mathrm{O},^{17}\mathrm{N})^{57,59}\mathrm{Co} $ reactions, DWBA calculations were performed using the PTOLEMY [16] code to reproduce the measured angular distributions of these transfer reactions. The calculated results are shown in Fig. 3. The optical potential parameters for the entrance channels ($ ^{18}\mathrm{O} + ^{56,58}\mathrm{Fe} $ ) and exit channels ($ ^{17}\mathrm{N} + ^{57,59}\mathrm{Co} $ ) were taken from the systematic optical model potential reported in Ref. [9].In Ref. [9], the parameters R and a for the systematic heavy-ion optical potential used in DWBA calculations were determined using Eq. (1):
$ \begin{aligned}[b] R_V &= R_W = (1.772 \pm 0.039) \times (A_1^{1/3} + A_2^{1/3})\\ &\quad - (4.881 \pm 0.256), \\ a_V &= a_W = (-0.0736 \pm 0.011) \times (A_1^{1/3} + A_2^{1/3})\\ &\quad + (1.087 \pm 0.063). \end{aligned} $
(1) A1 and A2 are the mass numbers of the projectile and target nuclei, respectively. The real part V and imaginary part W of the optical potential depth were determined using the energy dispersion relation parameter (EDRP) in Eq. (2):
$ \begin{aligned}[b] V &= 268.7 \pm 24.1,\\ EDRP &= E_{\text{lab}} \times (A_1^{1/3} + A_2^{1/3}) / Z_1 Z_2, \\ W/V &= \begin{cases} 0.0416 \times EDRP + 0.4124 & \quad EDRP \lt 10, \\ 0.8284 & \quad EDRP \ge 10. \end{cases} \end{aligned} $
(2) $ E_\text{lab} $ is the projectile energy, and$ Z_1 $ and$ Z_2 $ are the charge numbers of the projectile and target nuclei, respectively. To optimize the optical model parameters, V,$ R_V $ , and a were adjusted within the ranges given in Eq. (1) and Eq. (2) so that the theoretical results reproduced the experimental data. The optical potential parameters corresponding to a one-σ deviation between the theoretical and experimental values were defined as a set, thereby determining the parameter range for each optical potential. The parameters are listed in Table 1. The bound-state potential parameters were set identically for the respective nuclei. For$ ^{18}\mathrm{O} $ ,$ ^{56}\mathrm{Fe} $ , and$ ^{58}\mathrm{Fe} $ , the single-particle state parameters were fixed at$ r_0 = 1.25\; \mathrm{fm} $ ,$ a_0 = 0.65\; \mathrm{fm} $ , and$ V_{\mathrm{s.o.}} = 6.0\; \mathrm{MeV} $ . The potential depth V was subsequently varied within the range of 50−70 MeV to reproduce the respective bound states. These parameter settings were adopted from Refs. [17−19]. The spectroscopic factors (SFs) for both reactions were extracted by fitting the DWBA calculations to the experimental angular distributions using the least-squares method. The experimental SF was determined to be$ 0.10 \pm 0.06 $ for the$ ^{56}\text{Fe}(^{18}\text{O},^{17}\text{N}_{\text{g.s.}})^{57}\text{Co}_{\text{g.s.}} $ reaction and$ 0.14 \pm 0.08 $ for the$ ^{58}\text{Fe}(^{18}\text{O},^{17}\text{N}_{\text{g.s.}})^{59}\text{Co}_{\text{g.s.}} $ reaction.Channel $E_{{\mathrm{lab}}}$ /MeVV/MeV $W/V$ $r_{0}$ /fm$a_{0}$ /fm$^{18}\text{O} + ^{56}\text{Fe}$ 103.00 281.5 ± 7.1 0.545 1.030 ± 0.027 0.590 ± 0.065 $^{17}\text{N} + ^{57}\text{Co}$ 88.33 277.5 ± 8.4 0.537 0.953 ± 0.015 0.590 ± 0.042 $^{18}\text{O} + ^{58}\text{Fe}$ 103.00 282.4 ± 7.1 0.546 1.052 ± 0.029 0.599 ± 0.066 $^{17}\text{N} + ^{59}\text{Co}$ 90.21 277.9 ± 8.4 0.541 0.952 ± 0.010 0.563 ± 0.040 Table 1. OMPs used In DWBA for reaction channels.
Single-nucleon transfer reactions occur in grazing collisions at the nuclear surface. Therefore, the effective interaction radii can be identified with the grazing radii
$ r_\text{g} $ . First, the total effective potential$ U_{\mathrm{eff}}(r) $ can be calculated using the obtained optical potential parameters:$ U_{\mathrm{eff}}(r) = V_N(r) + V_C(r) + \frac{\hbar^2L(L+1)}{2\mu r^2}. $
(3) where
$ V_N(r) $ is the nuclear potential,$ V_C(r) $ is the Coulomb potential, and$ \dfrac{\hbar^2L(L+1)}{2\mu r^2} $ is the angular-momentum-dependent term. Here, L is the angular momentum, and μ is the reduced mass of the system. When$ L = 0 $ , the Coulomb barrier radius$ r_\text{B} $ can be deduced from Eq. (4). The calculated values of$ r_\text{B} $ are$ 9.58 \pm 0.35\text{ fm} $ for$ ^{18}\text{O}+^{56}\text{Fe} $ and$ 9.83 \pm 0.37\text{ fm} $ for$ ^{18}\text{O}+^{58}\text{Fe} $ .$ \left. \frac{\partial U_{\mathrm{eff}}(r)}{\partial r} \right|_{r = r_\text{B}} = 0. $
(4) The grazing radius
$ r_\text{g} $ can then be determined from Eq. (5) in Ref. [1] by setting$ L = L_\text{g} $ .$ \begin{aligned}[b] E_\text{c.m.} - (U_{\mathrm{eff}}(r_\text{g}))_{L = {L_\text{g}}} &= 0, \\ \left. \frac{\partial U_{\mathrm{eff}}(r)}{\partial r} \right|_{r = r_\text{g}, L = L_\text{g}}& = 0. \end{aligned}$
(5) Using the equations above, the total effective potentials of
$ ^{18}\text{O} + ^{56, 58}\text{Fe} $ at$ 103\text{ MeV} $ were calculated, and the results are shown in Fig. 4. The grazing radii$ r_\text{g} $ were determined to be 8.59$ \pm $ 0.23 fm and 8.80$ \pm $ 0.25 fm for$ ^{18}\text{O}+^{56}\text{Fe} $ and$ ^{18}\text{O}+^{58}\text{Fe} $ , respectively. Because the grazing radius corresponds to the position where the projectile's kinetic energy equals the potential energy, it effectively serves as the turning point [20], marking the classical distance of closest approach. However,$ r_\text{g} $ increases as the incident energy of$ ^{18}\text{O} $ decreases, and the cross section of the single-proton transfer reaction decreases sharply when the incident energy of$ ^{18}\text{O} $ falls below the Coulomb barrier. Thus,$ r_\text{g} $ for the two reactions reaches its maximum values, corresponding to the values of$ r_\text{B} $ mentioned above.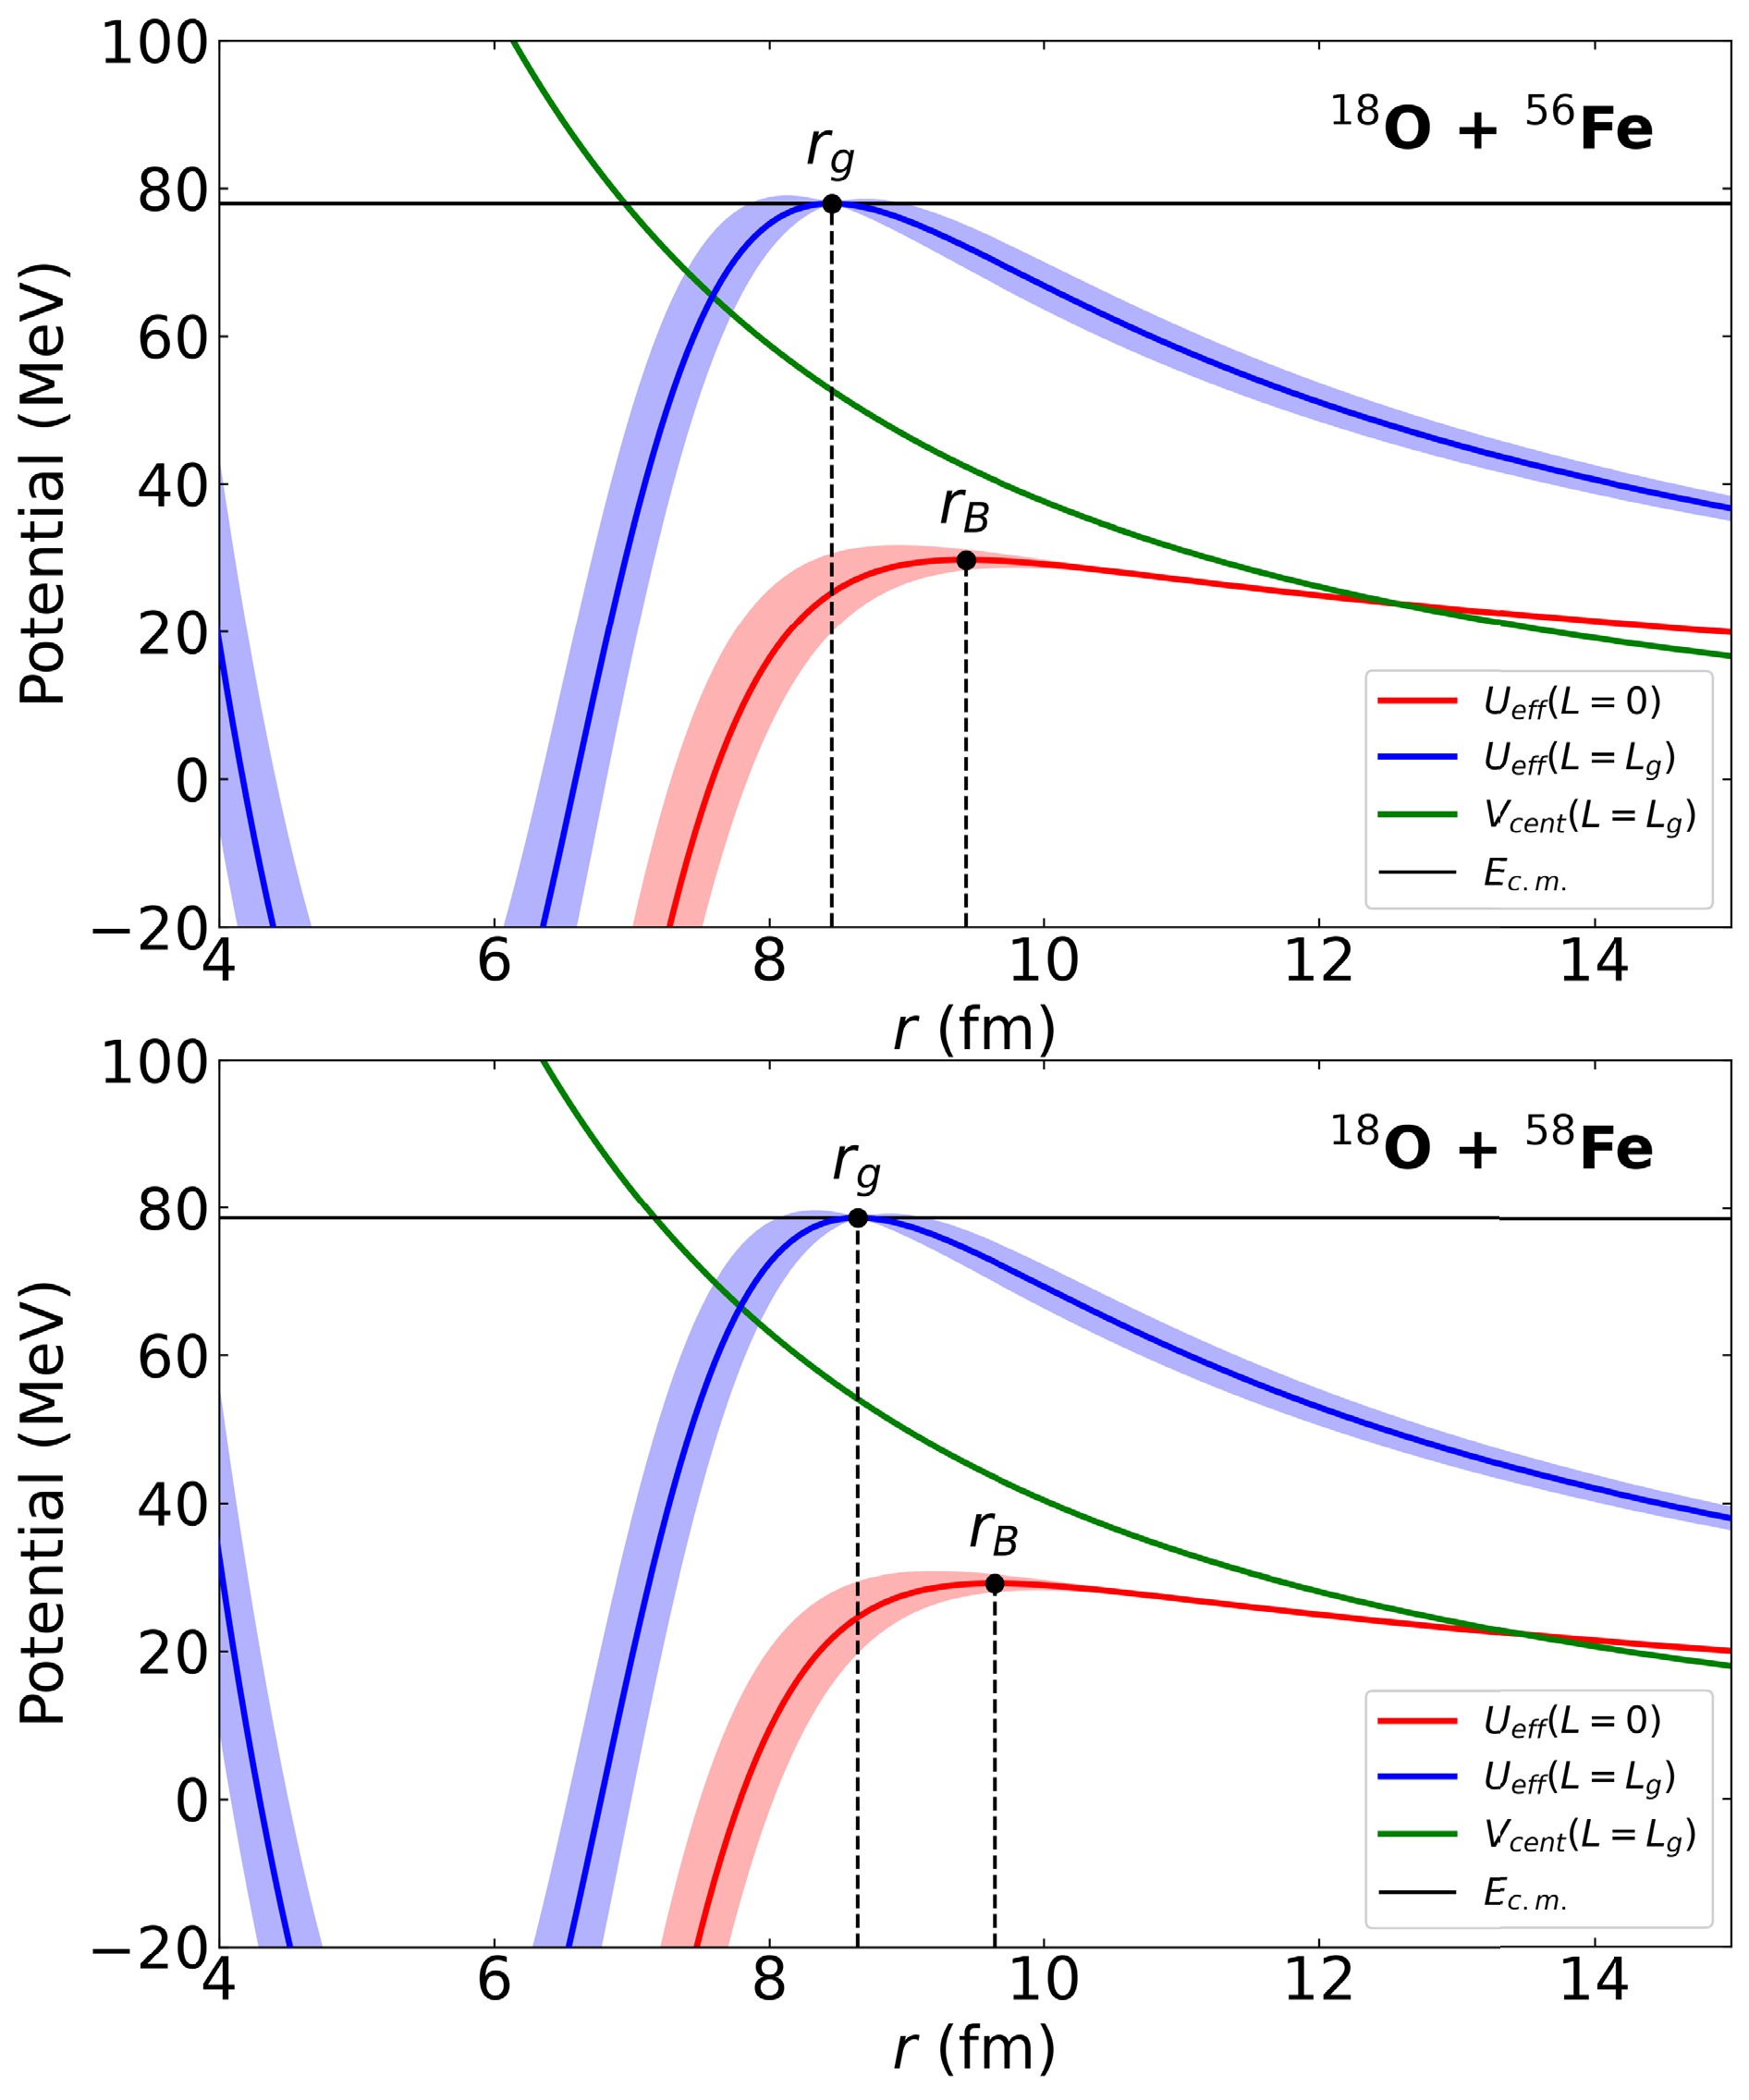
Figure 4. (color online) The
$U_{\mathrm{eff}}$ of the incident system$^{18}\text{O} + ^{56, 58}\text{Fe}$ . The blue line and its shaded band represent$U_{\mathrm{eff}}$ with the grazing angular momentum$L_\text{g}$ at the 103 MeV incident energy. The red line and its shaded band represent$U_{\mathrm{eff}}$ with the angular momentum$L = 0$ . The$r_\text{B}$ and$r_\text{g}$ are Coulomb barrier radii and grazing radii of$^{18}\text{O} + ^{56, 58}\text{Fe}$ channels. The black and green solid line represent the incident center-of-mass energies$E_\text{c.m.}$ in measurement and centrifugal potential, respectively. -
Particle identification was performed using the two-dimensional
$ \Delta E - E_\text{t} $ spectrum collected with the$ \Delta E - E $ silicon telescope, where$ E_\text{t} $ is the total energy, defined as the sum of the energy loss in the$ \Delta E $ detector and the residual energy deposited in the annular E detector. As an example, the$ \Delta E - E_\text{t} $ scatter plot obtained from one$ \Delta E $ detector and the fifth inner strip of the annular E detector is shown in Fig. 1. A cut was applied to select$ ^{17}\mathrm{N} $ events from the$ ^{58}\mathrm{Fe}(^{18}\mathrm{O},^{17}\mathrm{N})^{59}\mathrm{Co} $ proton transfer reaction. Because the first excited-state energies of$ ^{17}\mathrm{N} $ and$ ^{57,59}\mathrm{Co} $ are 1373.9, 1224.0, and 1099.3 keV, respectively, the$ ^{17}\mathrm{N} $ ground state can be clearly separated and identified in the$ \Delta E - E_\text{t} $ two-dimensional spectrum. Within the selected cut,$ ^{17}\mathrm{N} $ and$ ^{59}\mathrm{Co} $ are both in their ground states, as determined from the reaction kinematics. The energy resolution for$ ^{17}\mathrm{N} $ is approximately 0.5 MeV in full width at half maximum (FWHM), dominated by the noise of the silicon detectors and the angular uncertainty arising from the$ \sim $ 0.6° acceptance of each ring.
Figure 1. (color online) Experimental Setup.
After the
$ ^{17}\mathrm{N} $ events were obtained for each strip of the annular E detector in the$ ^{56,58}\mathrm{Fe}(^{18}\mathrm{O},^{17}\mathrm{N})^{57,59}\mathrm{Co} $ reactions, the angular distributions for the ground-state transitions to$ ^{59}\mathrm{Co} $ and$ ^{57}\mathrm{Co} $ were extracted, as shown in Fig. 2. The$ \Delta E-E $ silicon telescope covered laboratory angles of 12.2°−21.4°, corresponding to 16.5°−27.6° in the center-of-mass (c.m.) frame. This angular range includes the main peaks of the proton-transfer angular distributions, as the grazing angles for the$ ^{56,58}\mathrm{Fe}(^{18}\mathrm{O},^{17}\mathrm{N})^{57,59}\mathrm{Co} $ reactions are approximately 21° (c.m.), as shown in Fig. 3. Angular uncertainties are dominated by the$ \sim $ 0.6° angular bin size of the individual E detector strips. The reported cross-section uncertainties include statistical contributions and background-subtraction uncertainties.
Figure 2. (color online)
$\Delta E - E_\text{t}$ two-dimensional spectrum of the products from$^{18}\mathrm{O} + ^{58}\mathrm{Fe}$ . A cut is set to select the ($^{18}\mathrm{O}$ ,$^{17}\mathrm{N}$ ) events where$^{17}\mathrm{N} $ $ $ and$^{59}\mathrm{Co}$ are both in ground states.
Figure 3. (color online) The angular distributions of
$^{56}\mathrm{Fe}(^{18}\mathrm{O}, ^{17}\mathrm{N}_\text{g.s.})^{57}\mathrm{Co}_\text{g.s.}$ and$^{58}\mathrm{Fe}(^{18}\mathrm{O}, ^{17}\mathrm{N}_\text{g.s.})^{59}\mathrm{Co}_\text{g.s.}$ reactions. The black solid circles are the experimental data, the DWBA calculations are red bands. The spectroscopic factors of these two reactions are$0.10 \pm 0.06$ for$^{56}\mathrm{Fe}(^{18}\mathrm{O}, ^{17}\mathrm{N}_\text{g.s.})^{57}\mathrm{Co}_\text{g.s.}$ and$0.14 \pm 0.08$ for$^{58}\mathrm{Fe}(^{18}\mathrm{O}, ^{17}\mathrm{N}_\text{g.s.})^{59}\mathrm{Co}_\text{g.s.}$ .To extract the optical potential parameters for the
$ ^{56,58}\mathrm{Fe}(^{18}\mathrm{O},^{17}\mathrm{N})^{57,59}\mathrm{Co} $ reactions, DWBA calculations were performed using the PTOLEMY [16] code to reproduce the measured angular distributions of these transfer reactions. The calculated results are shown in Fig. 3. The optical potential parameters for the entrance channels ($ ^{18}\mathrm{O} + ^{56,58}\mathrm{Fe} $ ) and exit channels ($ ^{17}\mathrm{N} + ^{57,59}\mathrm{Co} $ ) were taken from the systematic optical model potential reported in Ref. [9].In Ref. [9], the parameters R and a for the systematic heavy-ion optical potential used in DWBA calculations were determined using Eq. (1):
$ \begin{aligned}[b] R_V &= R_W = (1.772 \pm 0.039) \times (A_1^{1/3} + A_2^{1/3})\\ &\quad - (4.881 \pm 0.256), \\ a_V &= a_W = (-0.0736 \pm 0.011) \times (A_1^{1/3} + A_2^{1/3})\\ &\quad + (1.087 \pm 0.063). \end{aligned} $
(1) A1 and A2 are the mass numbers of the projectile and target nuclei, respectively. The real part V and imaginary part W of the optical potential depth were determined using the energy dispersion relation parameter (EDRP) in Eq. (2):
$ \begin{aligned}[b] V &= 268.7 \pm 24.1,\\ EDRP &= E_{\text{lab}} \times (A_1^{1/3} + A_2^{1/3}) / Z_1 Z_2, \\ W/V &= \begin{cases} 0.0416 \times EDRP + 0.4124 & \quad EDRP \lt 10, \\ 0.8284 & \quad EDRP \ge 10. \end{cases} \end{aligned} $
(2) $ E_\text{lab} $ is the projectile energy, and$ Z_1 $ and$ Z_2 $ are the charge numbers of the projectile and target nuclei, respectively. To optimize the optical model parameters, V,$ R_V $ , and a were adjusted within the ranges given in Eq. (1) and Eq. (2) so that the theoretical results reproduced the experimental data. The optical potential parameters corresponding to a one-σ deviation between the theoretical and experimental values were defined as a set, thereby determining the parameter range for each optical potential. The parameters are listed in Table 1. The bound-state potential parameters were set identically for the respective nuclei. For$ ^{18}\mathrm{O} $ ,$ ^{56}\mathrm{Fe} $ , and$ ^{58}\mathrm{Fe} $ , the single-particle state parameters were fixed at$ r_0 = 1.25\; \mathrm{fm} $ ,$ a_0 = 0.65\; \mathrm{fm} $ , and$ V_{\mathrm{s.o.}} = 6.0\; \mathrm{MeV} $ . The potential depth V was subsequently varied within the range of 50−70 MeV to reproduce the respective bound states. These parameter settings were adopted from Refs. [17−19]. The spectroscopic factors (SFs) for both reactions were extracted by fitting the DWBA calculations to the experimental angular distributions using the least-squares method. The experimental SF was determined to be$ 0.10 \pm 0.06 $ for the$ ^{56}\text{Fe}(^{18}\text{O},^{17}\text{N}_{\text{g.s.}})^{57}\text{Co}_{\text{g.s.}} $ reaction and$ 0.14 \pm 0.08 $ for the$ ^{58}\text{Fe}(^{18}\text{O},^{17}\text{N}_{\text{g.s.}})^{59}\text{Co}_{\text{g.s.}} $ reaction.Channel $E_{{\mathrm{lab}}}$ /MeVV/MeV $W/V$ $r_{0}$ /fm$a_{0}$ /fm$^{18}\text{O} + ^{56}\text{Fe}$ 103.00 281.5 ± 7.1 0.545 1.030 ± 0.027 0.590 ± 0.065 $^{17}\text{N} + ^{57}\text{Co}$ 88.33 277.5 ± 8.4 0.537 0.953 ± 0.015 0.590 ± 0.042 $^{18}\text{O} + ^{58}\text{Fe}$ 103.00 282.4 ± 7.1 0.546 1.052 ± 0.029 0.599 ± 0.066 $^{17}\text{N} + ^{59}\text{Co}$ 90.21 277.9 ± 8.4 0.541 0.952 ± 0.010 0.563 ± 0.040 Table 1. OMPs used In DWBA for reaction channels.
Single-nucleon transfer reactions occur in grazing collisions at the nuclear surface. Therefore, the effective interaction radii can be identified with the grazing radii
$ r_\text{g} $ . First, the total effective potential$ U_{\mathrm{eff}}(r) $ can be calculated using the obtained optical potential parameters:$ U_{\mathrm{eff}}(r) = V_N(r) + V_C(r) + \frac{\hbar^2L(L+1)}{2\mu r^2}. $
(3) where
$ V_N(r) $ is the nuclear potential,$ V_C(r) $ is the Coulomb potential, and$ \dfrac{\hbar^2L(L+1)}{2\mu r^2} $ is the angular-momentum-dependent term. Here, L is the angular momentum, and μ is the reduced mass of the system. When$ L = 0 $ , the Coulomb barrier radius$ r_\text{B} $ can be deduced from Eq. (4). The calculated values of$ r_\text{B} $ are$ 9.58 \pm 0.35\text{ fm} $ for$ ^{18}\text{O}+^{56}\text{Fe} $ and$ 9.83 \pm 0.37\text{ fm} $ for$ ^{18}\text{O}+^{58}\text{Fe} $ .$ \left. \frac{\partial U_{\mathrm{eff}}(r)}{\partial r} \right|_{r = r_\text{B}} = 0. $
(4) The grazing radius
$ r_\text{g} $ can then be determined from Eq. (5) in Ref. [1] by setting$ L = L_\text{g} $ .$ \begin{aligned}[b] E_\text{c.m.} - (U_{\mathrm{eff}}(r_\text{g}))_{L = {L_\text{g}}} &= 0, \\ \left. \frac{\partial U_{\mathrm{eff}}(r)}{\partial r} \right|_{r = r_\text{g}, L = L_\text{g}}& = 0. \end{aligned}$
(5) Using the equations above, the total effective potentials of
$ ^{18}\text{O} + ^{56, 58}\text{Fe} $ at$ 103\text{ MeV} $ were calculated, and the results are shown in Fig. 4. The grazing radii$ r_\text{g} $ were determined to be 8.59$ \pm $ 0.23 fm and 8.80$ \pm $ 0.25 fm for$ ^{18}\text{O}+^{56}\text{Fe} $ and$ ^{18}\text{O}+^{58}\text{Fe} $ , respectively. Because the grazing radius corresponds to the position where the projectile's kinetic energy equals the potential energy, it effectively serves as the turning point [20], marking the classical distance of closest approach. However,$ r_\text{g} $ increases as the incident energy of$ ^{18}\text{O} $ decreases, and the cross section of the single-proton transfer reaction decreases sharply when the incident energy of$ ^{18}\text{O} $ falls below the Coulomb barrier. Thus,$ r_\text{g} $ for the two reactions reaches its maximum values, corresponding to the values of$ r_\text{B} $ mentioned above.
Figure 4. (color online) The
$U_{\mathrm{eff}}$ of the incident system$^{18}\text{O} + ^{56, 58}\text{Fe}$ . The blue line and its shaded band represent$U_{\mathrm{eff}}$ with the grazing angular momentum$L_\text{g}$ at the 103 MeV incident energy. The red line and its shaded band represent$U_{\mathrm{eff}}$ with the angular momentum$L = 0$ . The$r_\text{B}$ and$r_\text{g}$ are Coulomb barrier radii and grazing radii of$^{18}\text{O} + ^{56, 58}\text{Fe}$ channels. The black and green solid line represent the incident center-of-mass energies$E_\text{c.m.}$ in measurement and centrifugal potential, respectively. -
The nuclear interaction radius defines the characteristic distance at which nuclear forces become appreciable and governs the probability of direct processes, such as single-nucleon transfer, which occur predominantly near this radius. Thus, this radius determines the grazing trajectory of reactions, and its signature is encoded in experimental observables, such as angular distributions and excitation functions, making it a fundamental quantity in the analysis of reaction mechanisms. Accordingly, considerable effort has been devoted to estimating this radius, including the Bass80 [11], CW76 [13], BW91 [11, 21], and AW95 [12] models. In this work, the Coulomb barrier radii
$ r_\text{B} $ for these proximity potential models were calculated for comparison with the values obtained in the present study. The CW76 and AW95 models were developed from extensive experimental data on heavy-ion collisions and scattering and provide empirical formulas for calculating$ r_\text{B} $ . The formulas are given as:$ \begin{aligned}[b] r^{\text{CW76}}_\text{B}& = 1.07(A_1^{1/3} + A_2^{1/3}) + 2.72, \\ r^{\text{AW95}}_\text{B}& = 1.08(A_{1}^{1/3} + A_{2}^{1/3}) + 1.20 \\ &\quad + 0.34(28.6 - A_{1}^{1/3}A_{2}^{1/3})^{1/2}. \end{aligned} $
(6) For the Bass80 and BW91 models, no empirical formula is available for
$ r_\text{B} $ . Consequently,$ r_\text{B} $ is determined from their respective nuclear potentials. The nuclear potential for the Bass80 model is formulated as follows:$ \begin{aligned}[b] U_\text{N}^{\text{Bass80}}(r) &= - \bar R \Phi(s), \\ \Phi(s) &= \left[ 0.033 \exp\left(\frac{r - R_0}{3.5}\right) + 0.007 \exp\left(\frac{r - R_0}{0.65}\right) \right]^{-1}. \end{aligned} $
(7) Where
$ \bar R $ is the reduced radius of the projectile and target nuclei, and$ R_0 $ is the geometric radius. In contrast to the Bass80 potential, the BW91 potential adopts a standard Woods-Saxon form with diffuseness parameter$ a = 0.63\text{ fm} $ ; the nuclear potential for the BW91 model is expressed as:$ U_\text{N}^{\text{BW91}}(r) = -\frac{16\pi \bar R \gamma a}{1 + \exp \left( \dfrac{r - R_0}{a} \right)}. $
(8) The definitions of
$ \bar R $ and$ R_0 $ are the same as those in the Bass80 model, and γ represents the surface energy coefficient. The$ r_\text{B} $ values calculated for each model and the$ r^\text{exp}_\text{B} $ value obtained in this work are listed in Table 2.Reaction $r^\text{exp}_\text{B}$ /fm$r^\text{Bass80}_\text{B}$ /fm$r^\text{CW76}_\text{B}$ /fm$r^\text{BW91}_\text{B}$ /fm$r^\text{AW95}_\text{B}$ /fm$r^\text{SPP2}_\text{B}$ /fm$^{56}\mathrm{Fe}(^{18}\mathrm{O}, ^{17}\mathrm{N})^{57}\mathrm{Co}$ $9.58\pm0.35$ 9.56 9.62 9.59 9.63 9.60 $^{58}\mathrm{Fe}(^{18}\mathrm{O}, ^{17}\mathrm{N})^{59}\mathrm{Co}$ $9.83\pm0.37$ 9.64 9.67 9.65 9.67 9.72 Table 2. The Coulomb Barrier Radii
$ r_\text{B}$ determined in this work and in different models.In addition to the proximity potential,
$ r_\text{B} $ was also extracted from the São Paulo potential calculated using the REGINA code [22] for comparison. Unlike the aforementioned models, the REGINA code employs nucleon density distributions calculated using the Dirac-Hartree-Bogoliubov model to determine the São Paulo potential (SPP2). This approach can calculate both the nuclear potential and the corresponding Coulomb potential of the nuclear system.The values of
$ r_\text{B} $ estimated by these four models are approximately 9.6 fm. The$ r_\text{B} $ values extracted in this work are slightly larger on average but agree with the model predictions within experimental uncertainties. Single-nucleon transfer reactions occur when the tails of nuclear potentials overlap, whereas fusion requires the nuclei to approach sufficiently closely for the strong nuclear force to become dominant. Because the proximity potential models are parameterized for fusion reactions, a systematically larger$ r_\text{B} $ extracted from single-nucleon transfer reactions is consistent with theoretical expectations.The grazing radii
$ r_\text{g} $ extracted from the systematic heavy-ion optical potential and other potential models are listed in Table 3. For the Bass80, AW76, and BW91 potential models, no solution to Eq. (5) can be obtained. Thus, for these three models, the grazing radii cannot be determined for the reaction systems at an incident energy of 103 MeV. The SPP2 and CW76 potential models do not reproduce the experimental angular distributions accurately. Consequently, the$ r_\text{g} $ values obtained with the SPP2 and CW76 potentials deviate significantly from those derived from the systematic heavy-ion optical potential.Reaction $r^\text{exp}_\text{g}$ /fm$r^\text{Bass80}_\text{g}$ /fm$r^\text{CW76}_\text{g}$ /fm$r^\text{BW91}_\text{g}$ /fm$r^\text{AW95}_\text{g}$ /fm$r^\text{SPP2}_\text{g}$ /fm$^{56}\mathrm{Fe}(^{18}\mathrm{O}, ^{17}\mathrm{N})^{57}\mathrm{Co}$ $8.59\pm0.23$ N/A 8.43 N/A N/A 8.28 $^{58}\mathrm{Fe}(^{18}\mathrm{O}, ^{17}\mathrm{N})^{59}\mathrm{Co}$ $8.80\pm0.25$ N/A 8.49 N/A N/A 8.35 Table 3. The Grazing Radii
$r_\text{g}$ determined in this work and in different models.The single-nucleon transfer reaction is considered to occur on the surfaces of the projectile and target nuclei. Based on the
$ r_\text{B} $ and$ r_\text{g} $ values obtained in this work, it is useful to discuss the surface distances between the two nuclei near the Coulomb barrier and at an incident energy of 103 MeV for$ ^{18}\text{O} $ . It is well established that nuclei have diffuse surfaces, where the nucleon density decreases exponentially from 90% to 10% of the central density. The nucleon density distributions obtained with the REGINA code are described by the two-parameter Fermi distribution, and the surface thickness can be calculated from the diffuseness parameter a using Eq. (9):$ t = 4a \ln 3. $
(9) By convention, the nuclear surface position is defined as the radius at which the density decreases to 10% of the central density. Therefore, the nuclear surface radius
$ R_s $ is given by the sum of the half-density radius$ R_{1/2} $ and half of the surface thickness t. The nuclear density parameters used in this work are taken from the REGINA code [22]. For$ ^{18}\text{O} $ , the half-density radius is$ R_{p1/2} = 2.57\text{ fm} $ , and the diffuseness parameter is$ a_p = 0.50\text{ fm} $ . For$ ^{56}\text{Fe} $ and$ ^{58}\text{Fe} $ , the half-density radii are$ R_{T1/2} = 4.20\text{ fm} $ and$ 4.24\text{ fm} $ , respectively; the corresponding diffuseness parameters are$ a_T = 0.47\text{ fm} $ and$ 0.49\text{ fm} $ . Using the determined value of$ r_\text{B} $ , the surface distance between the two nuclei can be calculated as$ D = r_\text{B}-(R_{p1/2}+\dfrac{1}{2}t_p)-(R_{T1/2}+\dfrac{1}{2}t_T) $ . The resulting values are$ 0.68 \pm 0.35\text{ fm} $ for$ ^{18}\text{O} $ +$ ^{56}\text{Fe} $ and$ 0.85 \pm 0.37\text{ fm} $ for$ ^{18}\text{O} $ +$ ^{58}\text{Fe} $ . At the higher incident energy of 103 MeV, using$ r_\text{g} $ , the surface distances are calculated to be$ -0.31 \pm 0.23\text{ fm} $ and$ -0.19 \pm 0.25\text{ fm} $ for the$ ^{18}\text{O} $ +$ ^{56}\text{Fe} $ and$ ^{18}\text{O} $ +$ ^{58}\text{Fe} $ reactions, respectively. These values indicate that the surface regions of the projectile and target nuclei overlap at 103 MeV. For convenience, the values of the surface distance D are listed in Table 4.Reaction $r_\text{B}$ /fm$r_\text{g}$ /fm$D(r_\text{B})$ /fm$D(r_\text{g})$ /fm$^{56}\mathrm{Fe}(^{18}\mathrm{O}, ^{17}\mathrm{N})^{57}\mathrm{Co}$ $9.58\pm0.35$ $8.59\pm0.23$ $0.68\pm0.35$ $-0.31\pm0.23$ $^{58}\mathrm{Fe}(^{18}\mathrm{O}, ^{17}\mathrm{N})^{59}\mathrm{Co}$ $9.83\pm0.37$ $8.80\pm0.25$ $0.85\pm0.37$ $-0.19\pm0.25$ Table 4. Surface distance in different reactions.
-
The nuclear interaction radius defines the characteristic distance at which nuclear forces become appreciable and governs the probability of direct processes, such as single-nucleon transfer, which occur predominantly near this radius. Thus, this radius determines the grazing trajectory of reactions, and its signature is encoded in experimental observables, such as angular distributions and excitation functions, making it a fundamental quantity in the analysis of reaction mechanisms. Accordingly, considerable effort has been devoted to estimating this radius, including the Bass80 [11], CW76 [13], BW91 [11, 21], and AW95 [12] models. In this work, the Coulomb barrier radii
$ r_\text{B} $ for these proximity potential models were calculated for comparison with the values obtained in the present study. The CW76 and AW95 models were developed from extensive experimental data on heavy-ion collisions and scattering and provide empirical formulas for calculating$ r_\text{B} $ . The formulas are given as:$ \begin{aligned}[b] r^{\text{CW76}}_\text{B}& = 1.07(A_1^{1/3} + A_2^{1/3}) + 2.72, \\ r^{\text{AW95}}_\text{B}& = 1.08(A_{1}^{1/3} + A_{2}^{1/3}) + 1.20 \\ &\quad + 0.34(28.6 - A_{1}^{1/3}A_{2}^{1/3})^{1/2}. \end{aligned} $
(6) For the Bass80 and BW91 models, no empirical formula is available for
$ r_\text{B} $ . Consequently,$ r_\text{B} $ is determined from their respective nuclear potentials. The nuclear potential for the Bass80 model is formulated as follows:$ \begin{aligned}[b] U_\text{N}^{\text{Bass80}}(r) &= - \bar R \Phi(s), \\ \Phi(s) &= \left[ 0.033 \exp\left(\frac{r - R_0}{3.5}\right) + 0.007 \exp\left(\frac{r - R_0}{0.65}\right) \right]^{-1}. \end{aligned} $
(7) Where
$ \bar R $ is the reduced radius of the projectile and target nuclei, and$ R_0 $ is the geometric radius. In contrast to the Bass80 potential, the BW91 potential adopts a standard Woods-Saxon form with diffuseness parameter$ a = 0.63\text{ fm} $ ; the nuclear potential for the BW91 model is expressed as:$ U_\text{N}^{\text{BW91}}(r) = -\frac{16\pi \bar R \gamma a}{1 + \exp \left( \dfrac{r - R_0}{a} \right)}. $
(8) The definitions of
$ \bar R $ and$ R_0 $ are the same as those in the Bass80 model, and γ represents the surface energy coefficient. The$ r_\text{B} $ values calculated for each model and the$ r^\text{exp}_\text{B} $ value obtained in this work are listed in Table 2.Reaction $r^\text{exp}_\text{B}$ /fm$r^\text{Bass80}_\text{B}$ /fm$r^\text{CW76}_\text{B}$ /fm$r^\text{BW91}_\text{B}$ /fm$r^\text{AW95}_\text{B}$ /fm$r^\text{SPP2}_\text{B}$ /fm$^{56}\mathrm{Fe}(^{18}\mathrm{O}, ^{17}\mathrm{N})^{57}\mathrm{Co}$ $9.58\pm0.35$ 9.56 9.62 9.59 9.63 9.60 $^{58}\mathrm{Fe}(^{18}\mathrm{O}, ^{17}\mathrm{N})^{59}\mathrm{Co}$ $9.83\pm0.37$ 9.64 9.67 9.65 9.67 9.72 Table 2. The Coulomb Barrier Radii
$ r_\text{B}$ determined in this work and in different models.In addition to the proximity potential,
$ r_\text{B} $ was also extracted from the São Paulo potential calculated using the REGINA code [22] for comparison. Unlike the aforementioned models, the REGINA code employs nucleon density distributions calculated using the Dirac-Hartree-Bogoliubov model to determine the São Paulo potential (SPP2). This approach can calculate both the nuclear potential and the corresponding Coulomb potential of the nuclear system.The values of
$ r_\text{B} $ estimated by these four models are approximately 9.6 fm. The$ r_\text{B} $ values extracted in this work are slightly larger on average but agree with the model predictions within experimental uncertainties. Single-nucleon transfer reactions occur when the tails of nuclear potentials overlap, whereas fusion requires the nuclei to approach sufficiently closely for the strong nuclear force to become dominant. Because the proximity potential models are parameterized for fusion reactions, a systematically larger$ r_\text{B} $ extracted from single-nucleon transfer reactions is consistent with theoretical expectations.The grazing radii
$ r_\text{g} $ extracted from the systematic heavy-ion optical potential and other potential models are listed in Table 3. For the Bass80, AW76, and BW91 potential models, no solution to Eq. (5) can be obtained. Thus, for these three models, the grazing radii cannot be determined for the reaction systems at an incident energy of 103 MeV. The SPP2 and CW76 potential models do not reproduce the experimental angular distributions accurately. Consequently, the$ r_\text{g} $ values obtained with the SPP2 and CW76 potentials deviate significantly from those derived from the systematic heavy-ion optical potential.Reaction $r^\text{exp}_\text{g}$ /fm$r^\text{Bass80}_\text{g}$ /fm$r^\text{CW76}_\text{g}$ /fm$r^\text{BW91}_\text{g}$ /fm$r^\text{AW95}_\text{g}$ /fm$r^\text{SPP2}_\text{g}$ /fm$^{56}\mathrm{Fe}(^{18}\mathrm{O}, ^{17}\mathrm{N})^{57}\mathrm{Co}$ $8.59\pm0.23$ N/A 8.43 N/A N/A 8.28 $^{58}\mathrm{Fe}(^{18}\mathrm{O}, ^{17}\mathrm{N})^{59}\mathrm{Co}$ $8.80\pm0.25$ N/A 8.49 N/A N/A 8.35 Table 3. The Grazing Radii
$r_\text{g}$ determined in this work and in different models.The single-nucleon transfer reaction is considered to occur on the surfaces of the projectile and target nuclei. Based on the
$ r_\text{B} $ and$ r_\text{g} $ values obtained in this work, it is useful to discuss the surface distances between the two nuclei near the Coulomb barrier and at an incident energy of 103 MeV for$ ^{18}\text{O} $ . It is well established that nuclei have diffuse surfaces, where the nucleon density decreases exponentially from 90% to 10% of the central density. The nucleon density distributions obtained with the REGINA code are described by the two-parameter Fermi distribution, and the surface thickness can be calculated from the diffuseness parameter a using Eq. (9):$ t = 4a \ln 3. $
(9) By convention, the nuclear surface position is defined as the radius at which the density decreases to 10% of the central density. Therefore, the nuclear surface radius
$ R_s $ is given by the sum of the half-density radius$ R_{1/2} $ and half of the surface thickness t. The nuclear density parameters used in this work are taken from the REGINA code [22]. For$ ^{18}\text{O} $ , the half-density radius is$ R_{p1/2} = 2.57\text{ fm} $ , and the diffuseness parameter is$ a_p = 0.50\text{ fm} $ . For$ ^{56}\text{Fe} $ and$ ^{58}\text{Fe} $ , the half-density radii are$ R_{T1/2} = 4.20\text{ fm} $ and$ 4.24\text{ fm} $ , respectively; the corresponding diffuseness parameters are$ a_T = 0.47\text{ fm} $ and$ 0.49\text{ fm} $ . Using the determined value of$ r_\text{B} $ , the surface distance between the two nuclei can be calculated as$ D = r_\text{B}-(R_{p1/2}+\dfrac{1}{2}t_p)-(R_{T1/2}+\dfrac{1}{2}t_T) $ . The resulting values are$ 0.68 \pm 0.35\text{ fm} $ for$ ^{18}\text{O} $ +$ ^{56}\text{Fe} $ and$ 0.85 \pm 0.37\text{ fm} $ for$ ^{18}\text{O} $ +$ ^{58}\text{Fe} $ . At the higher incident energy of 103 MeV, using$ r_\text{g} $ , the surface distances are calculated to be$ -0.31 \pm 0.23\text{ fm} $ and$ -0.19 \pm 0.25\text{ fm} $ for the$ ^{18}\text{O} $ +$ ^{56}\text{Fe} $ and$ ^{18}\text{O} $ +$ ^{58}\text{Fe} $ reactions, respectively. These values indicate that the surface regions of the projectile and target nuclei overlap at 103 MeV. For convenience, the values of the surface distance D are listed in Table 4.Reaction $r_\text{B}$ /fm$r_\text{g}$ /fm$D(r_\text{B})$ /fm$D(r_\text{g})$ /fm$^{56}\mathrm{Fe}(^{18}\mathrm{O}, ^{17}\mathrm{N})^{57}\mathrm{Co}$ $9.58\pm0.35$ $8.59\pm0.23$ $0.68\pm0.35$ $-0.31\pm0.23$ $^{58}\mathrm{Fe}(^{18}\mathrm{O}, ^{17}\mathrm{N})^{59}\mathrm{Co}$ $9.83\pm0.37$ $8.80\pm0.25$ $0.85\pm0.37$ $-0.19\pm0.25$ Table 4. Surface distance in different reactions.
-
In this work, we measured the
$ ^{56,58}\mathrm{Fe}(^{18}\mathrm{O},^{17}\mathrm{N})^{57,59}\mathrm{Co} $ transfer reactions to investigate nuclear interaction radii. DWBA calculations were used to reproduce the measured angular distributions of these two reactions and to extract optical potential parameters. Using the extracted optical potential parameters, the Coulomb barrier radii$ r_\text{B} $ were subsequently calculated to be 9.58$ \pm $ 0.35 fm for$ ^{18}\text{O}+^{56}\text{Fe} $ and 9.83$ \pm $ 0.37 fm for$ ^{18}\text{O}+^{58}\text{Fe} $ . The resulting mean$ r_\text{B} $ values are slightly larger than the predictions of proximity potential models (Bass80, CW76, BW91, and AW95), but they are consistent with these predictions within experimental uncertainties. The grazing radius$ r_\text{g} $ was also determined to be 8.59$ \pm $ 0.23 fm and 8.80$ \pm $ 0.25 fm for$ ^{18}\text{O}+^{56}\text{Fe} $ and$ ^{18}\text{O}+^{58}\text{Fe} $ , respectively, at the experimental incident energy of$ ^{18}\text{O} $ . Based on the determined radii$ r_\text{B} $ and$ r_\text{g} $ , the corresponding surface distances between the two nuclei provide a relatively clear physical picture of the separation between nuclear surfaces in single-nucleon transfer reactions. -
In this work, we measured the
$ ^{56,58}\mathrm{Fe}(^{18}\mathrm{O},^{17}\mathrm{N})^{57,59}\mathrm{Co} $ transfer reactions to investigate nuclear interaction radii. DWBA calculations were used to reproduce the measured angular distributions of these two reactions and to extract optical potential parameters. Using the extracted optical potential parameters, the Coulomb barrier radii$ r_\text{B} $ were subsequently calculated to be 9.58$ \pm $ 0.35 fm for$ ^{18}\text{O}+^{56}\text{Fe} $ and 9.83$ \pm $ 0.37 fm for$ ^{18}\text{O}+^{58}\text{Fe} $ . The resulting mean$ r_\text{B} $ values are slightly larger than the predictions of proximity potential models (Bass80, CW76, BW91, and AW95), but they are consistent with these predictions within experimental uncertainties. The grazing radius$ r_\text{g} $ was also determined to be 8.59$ \pm $ 0.23 fm and 8.80$ \pm $ 0.25 fm for$ ^{18}\text{O}+^{56}\text{Fe} $ and$ ^{18}\text{O}+^{58}\text{Fe} $ , respectively, at the experimental incident energy of$ ^{18}\text{O} $ . Based on the determined radii$ r_\text{B} $ and$ r_\text{g} $ , the corresponding surface distances between the two nuclei provide a relatively clear physical picture of the separation between nuclear surfaces in single-nucleon transfer reactions.
Probing the nuclear interaction radius with single-proton transfer reactions
- Received Date: 2026-04-07
- Available Online: 2026-09-15
Abstract: In this work, the $^{56,58}\mathrm{Fe}(^{18}\mathrm{O},^{17}\mathrm{N})^{57,59}\mathrm{Co}$ transfer reactions were measured, and Distorted Wave Born Approximation calculations using the systematic heavy-ion optical potential were employed to reproduce the experimental data and investigate the interaction radius. The Coulomb barrier radii $r_\text{B}$ were determined to be $9.58 \pm 0.35\text{ fm}$ and $9.83 \pm 0.37\text{ fm}$ for $^{18}\text{O}+^{56}\text{Fe}$ and $^{18}\text{O}+^{58}\text{Fe}$, respectively. The maximum distances between the surfaces of the two nuclei were calculated to be $0.68 \pm 0.35\text{ fm}$ for $^{18}\text{O}$ + $^{56}\text{Fe}$ and $0.85 \pm 0.37\text{ fm}$ for $^{18}\text{O}$ + $^{58}\text{Fe}$. These results provide a clear physical picture of the distance between the surfaces of the two nuclei in single-nucleon transfer reactions.



 DownLoad: