


 Abstract
 HTML
HTML Reference
 Related
 PDF
PDF


-
Nuclear clustering has recently attracted great attention within the nuclear structure studies, especially for nuclei in the expanded nuclear chart away from the
$ \beta $ -stability line [1–7]. The cluster structure is often formed and stabilized at highly excited resonant states in the vicinity of the cluster-separation threshold [8]. This structure can be probed experimentally by nuclear reaction tools combined with sequential cluster-decay. The reconstruction of the resonant state from the decay fragments, by the so-called invariant mass (IM) method, allows to select the cluster states with large partial decay widths. This selection significantly reduces the level density at high excitation energies, being in favor of the quantitative extraction of the physical properties of the resonances. Furthermore, a model-independent determination of the spin in the reconstructed resonant state can be achieved though the sensitive angular correlation method [9, 10]. This is particularly important at high excitation energies, where the differential cross-section method becomes almost futile due to the overlap of many close-by states and the uncertainties in many fitting parameters [9].Determination of the spin of each resonant state is of particular importance to form the molecular band, which is required to firmly establish the clustering structure [11]. Thus far, the angular correlation analysis has been the most sensitive and reliable tool to determine the spin of the resonant state [10, 12–15]. Nevertheless, the angular correlation plot depends on the selection of the coordinate system, which varies for different types of experiments and conventions of data analysis. Although in most cases the z-coordinate axis is fixed in the beam direction, the definition of the spherical angle axis differs in different coordinate systems. To date, no detailed analysis and comparison of these coordinate systems is provided in the literature, which could lead to misunderstanding and erroneous application of the angular correlation method.
In this study, we systemically investigate three kinds of coordinate systems that have been frequently applied in the literature. The definitions and features of these systems are outlined and compared to each other. The consistency of these systems is demonstrated by the experimental data analysis for the 10.29-MeV resonant state in 18O. Some suggestions for the application of the angular correlation method are provided in the summary.
-
For a sequential decay reaction
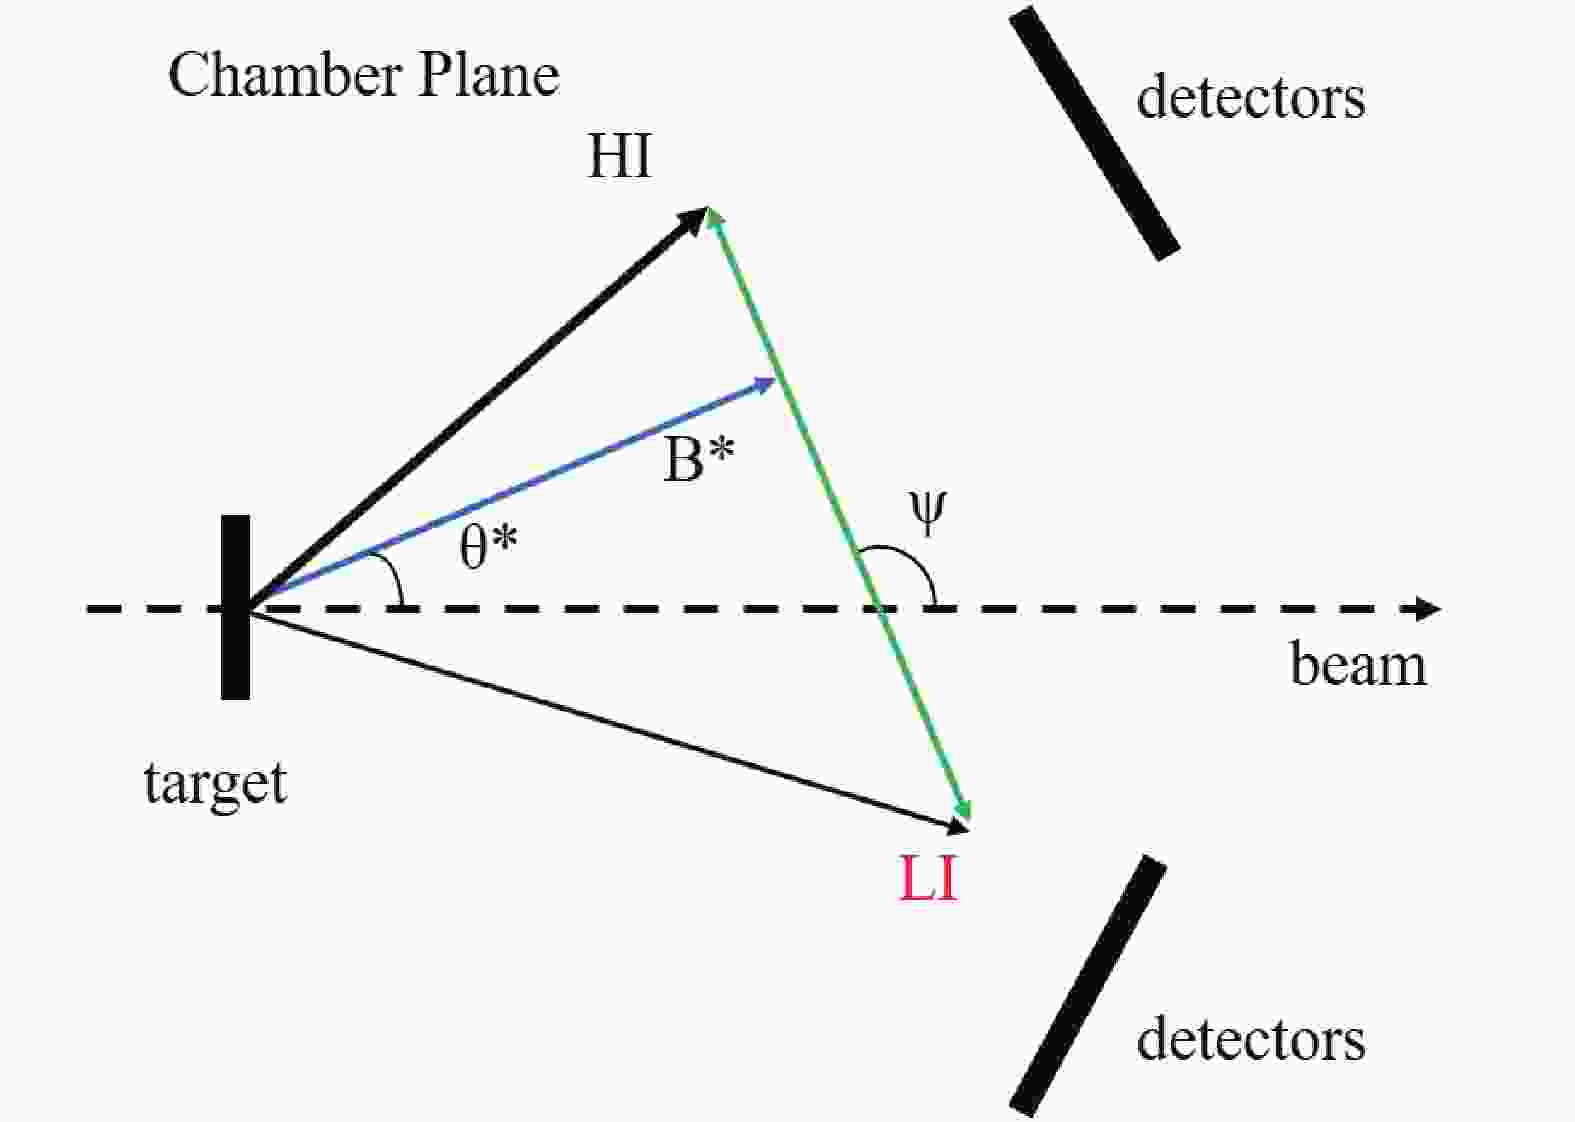
$ a(A, B^*\to c + C)b $ , the composite resonant particle$B^*$ may decay into e.g., two spin-zero fragments. The angular correlation of the latter is a sensitive probe for the spin of the resonant state in the mother nucleus B [10]. In a spherical coordinate system, with its z-axis pointing along the beam direction (Fig. 1), the correlation function can be parameterized in terms of four angles [10]. Namely, the center-of-mass (c.m.) scattering polar and azimuthal angles,$ \theta^* $ and$ \phi^* $ , respectively, of the resonant particle$ B^*$ ; the polar and azimuthal angles,$ \psi $ and$ \chi $ , respectively, of the relative velocity vector$ v_{ \rm{rel}} $ of the two fragments (the arrow connecting HI and LI in Fig. 1). Both polar angles,$ \theta^* $ and$ \psi $ , are with respect to the beam direction. The azimuthal angle$ \phi $ is$ 0^\circ $ (or$ 180^\circ $ ) in the horizontal plane defined by the center positions of the detectors placed at opposite sides of the beam (the chamber plane or the detection plane). Another azimuthal angle$ \chi $ is defined to be$0 ^\circ $ (or$180 ^\circ $ ) in the reaction plane, fixed by the beam axis and the reaction product$ B^*$ . Because of the limited detector geometry in a typical experiment, the correlation is often approximately constrained in the chamber plane, as shown in Fig. 1. In this case, the azimuthal angles$ \phi $ and$ \chi $ remain at$ 0^\circ $ or$ 180^\circ $ , depending on the selected coordinate system, and the angular correlation appears as a function of only two polar angles$ \theta^* $ and$ \psi $ . This is referred to as the in-plane correlation.
Figure 1. (color online) Schematic diagram of the sequential decay following a transfer reaction
$a(A, B^*\to c + C)b$ , depicting the polar angles$\theta^*$ and$\psi$ in the detection plane. The two decay fragments, c and C, are specified as light ion (LI) and heavy ion (HI), respectively, in the figure.When the azimuthal angle
$ \chi $ is restricted to$ 0^\circ $ (or$180 ^\circ ),$ the most striking feature of the angular correlation in the$ \theta^* $ -$ \psi $ plane appears, as the ridge structures associated with the spin of the mother nucleus ([9, 10, 16]). At relatively small$ \theta^* $ angles, the structure is characterized by the locus$ \psi = \alpha\theta^* $ in the double differential cross-section, where$ \alpha $ depicts a constant for the slope of the ridge and is almost inversely proportional to the spin of the resonant state$ B^*$ [10, 16]. The correlation is oscillatory along the$ \psi $ angle for a fixed$ \theta^* $ , and vice versa. Generally, this in-plane correlation structure can be projected onto the one-dimensional spectrum$ W(\theta^* = 0^{\circ}, \psi' = \psi - \alpha\theta^*) $ . Within the strong absorption model (SAM) [17–19],$ \alpha $ may be related to the orbital angular moment$ l_{i} $ of the dominant partial wave in the entrance channel through$ \alpha = \displaystyle\frac{l_{i}-J}{J} $ , with$ J $ being the spin of$B^* $ [9, 16].$ l_{i} $ can be evaluated simply from$ l_{i} = r_{0}(A^{1/3}_{p} + A^{1/3}_{t})\sqrt{2{\mu}E_{ \rm{c.m.}}} $ [20], with$ A_{p} $ and$ A_{t} $ being the mass numbers of the beam and target nucleus, respectively. Here,$ \mu $ is the reduced mass and$ E_{ \rm{c.m.}} $ depicts the center-of-mass energy. If the resonant nucleus is emitted at angles close to$ \theta^{*} = 0 ^{\circ} $ , the projected correlation function$ W(\psi') $ is simply proportional to the square of the Legendre polynomial of order$ J $ , namely$ |P_{J}(\rm{cos}(\psi))|^{2} $ . This method has been frequently applied in the literature ([21] and references therein) and will also be demonstrated in the following section 2.3. -
As indicated above, in the application of the angular correlation plot, it is important to enhance the ridge structure, which corresponds to the spin of the resonant mother nucleus. Consequently, the selection of the coordinate system for the plot is meaningful. For a non-polarized experiment, the reaction process satisfies the axial symmetry around the beam axis. Moreover, the decay process should satisfy the parity (space inversion) symmetry with respect to the c.m. of the resonant mother nucleus. In the two-dimensional correlation plot (plot of the double differential cross-section), depicting functions of the polar angles
$ \theta^* $ and$ \psi $ , it is natural to plot these symmetrical events in the same ridge band while placing the non-symmetric events elsewhere, to enhance the sensitivity to the associated spin. This should be applied even for the simple case of restricted detection around the chamber plane. For instance, in Fig. 2 we schematically illustrate two processes that generate the same polar angles$ \theta^* $ and$ \psi $ but are not symmetric in terms of the resonance-decay. These two processes should be distinguished from the ridge plot using an appropriate coordinate system, such as the one using positive and negative$ \theta^* $ , as defined below. In contrast, the coordinate definition should keep the four symmetric processes in the same ridge band, as schematically portrayed in Fig. 3, such that the ridge structure appears continuously and a simple projection can bring them together to enhance the sensitivity to the associated spin. We introduce, in the following, three kinds of coordinate systems and demonstrate their differences with respect to plot-definition and consistency in extraction of the spin.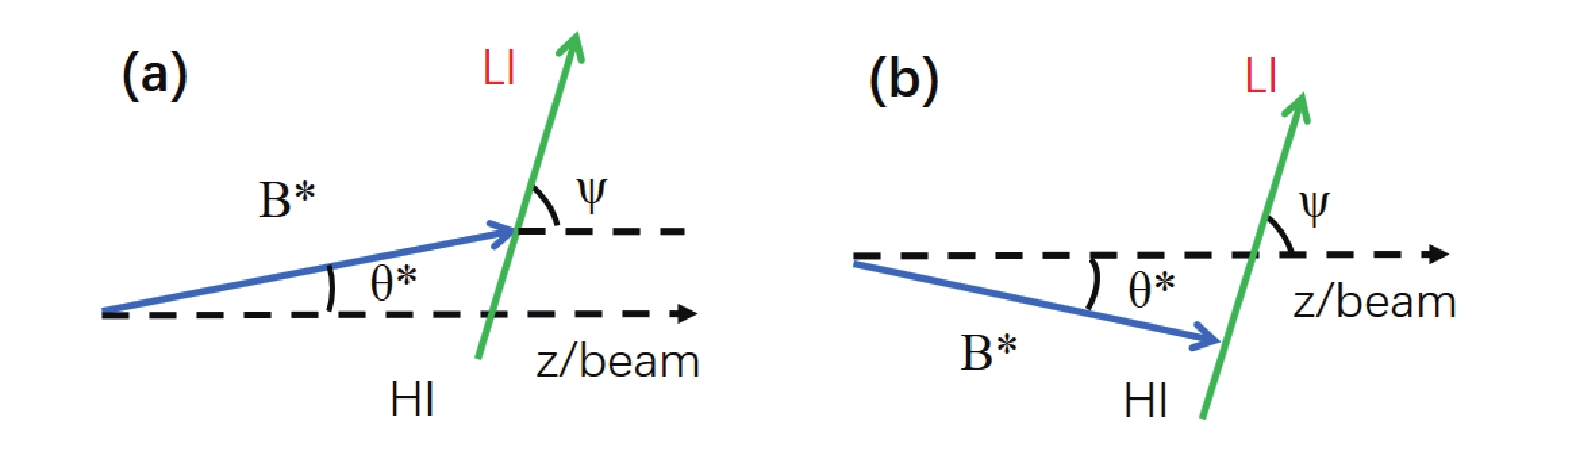
Figure 2. (color online) Schematic diagram of the two independent reaction processes with the same polar angles. The direction of the relative velocity vector
$v_{ \rm{rel}}$ is guided by the light ion in both cases.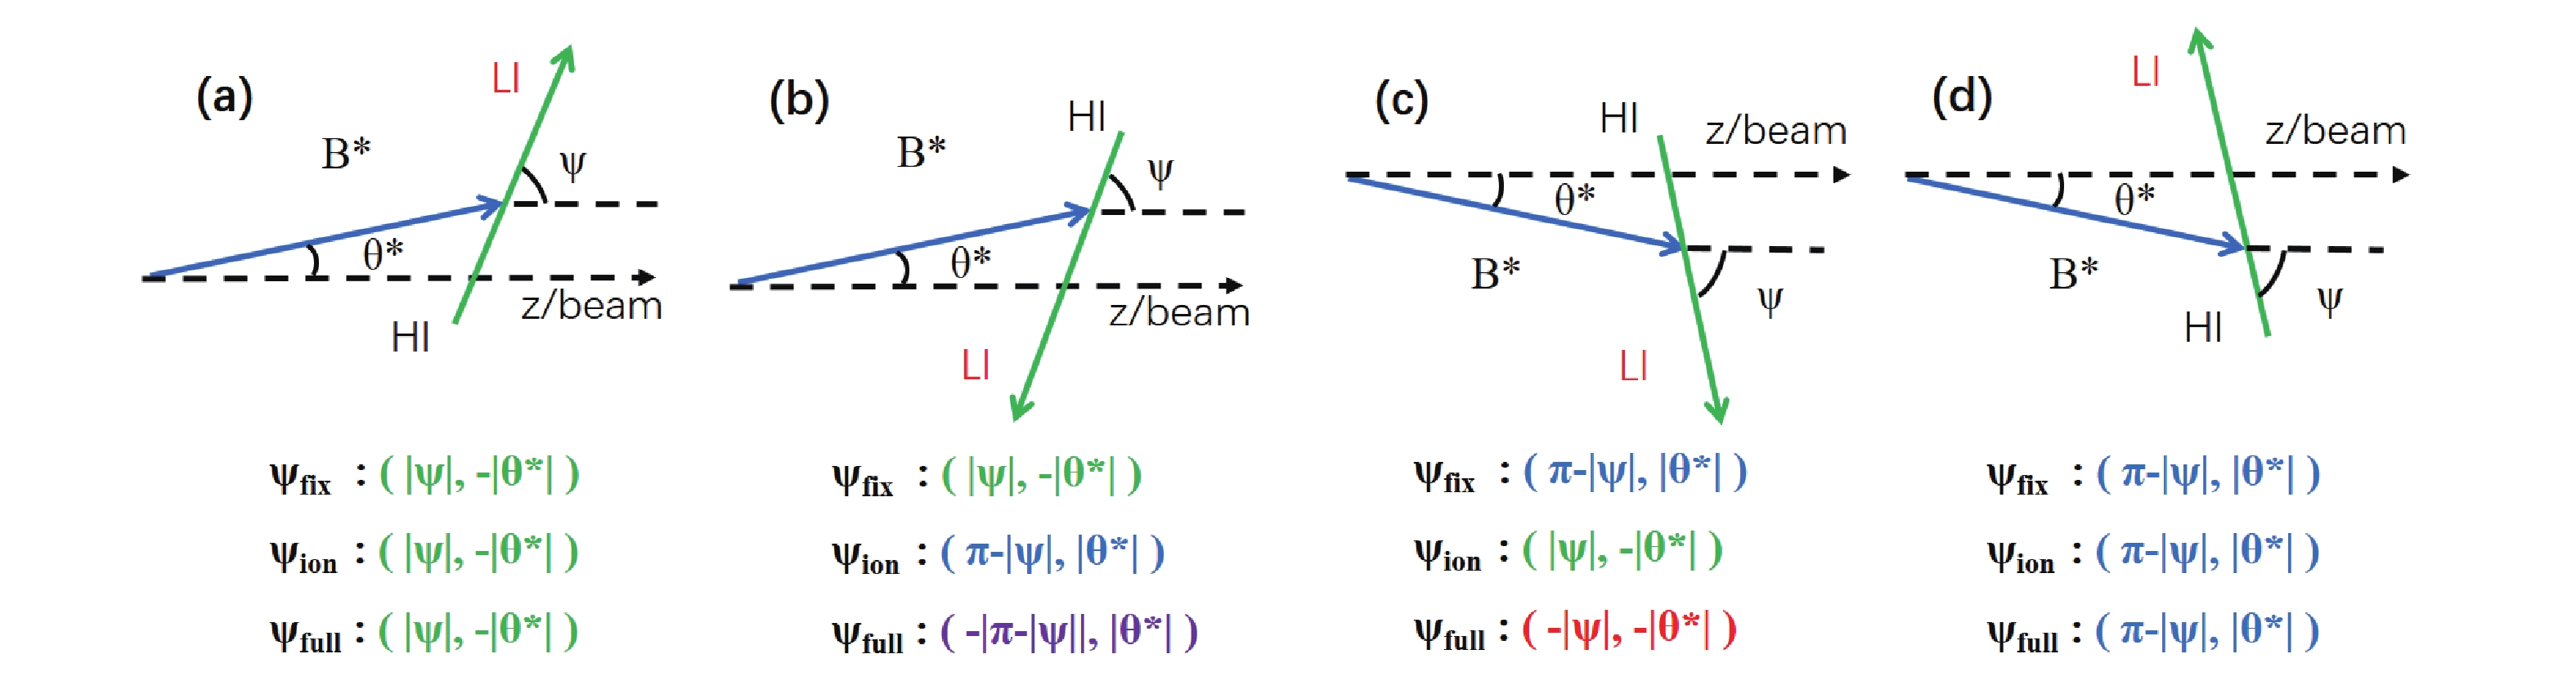
Figure 3. (color online) Schematic diagram of the four symmetric reaction-decay processes in the chamber plane. (a) and (b) are parity-symmetric processes, while (c) and (d) are their axial-symmetric processes, respectively. All processes are identified by the angles
$\theta^*$ and$\psi$ defined in various coordinate systems, as described in the text.In the first coordinate system (hereinafter refered to as the
$ \psi_{ \rm{fix}} $ coordinate system), the relative velocity vector of the decay products always points to the fixed detector at one side of the beam (where$ \phi^* $ =$ 0^\circ $ ). This is convenient when two decay particles are identical, such as in$^{24}\rm{Mg}\; \rightarrow\;$ $ ^{12}\rm{C}+^{12}\rm{C} $ [10], or each detector is designed to be sensitive to only one type of the particles, such as$ ^{18}\rm{O} \rightarrow ^{14}\rm{C}+\alpha $ with$ ^{14}\rm{C} $ always detected at one-side, while$ \alpha $ is at the other side of the beam [9]. By definition,$ \theta^* $ is positive on the opposite side of the beam and negative on the same side, in comparison with the fixed positive$ \psi $ . With this definition, processes (a) and (b) are plotted at one position (negative$ \theta^* $ ), while (c) and (d) are at another position (positive$ \theta^* $ ) (see present Fig. 4(A) or Fig. 5 in Ref. [10]).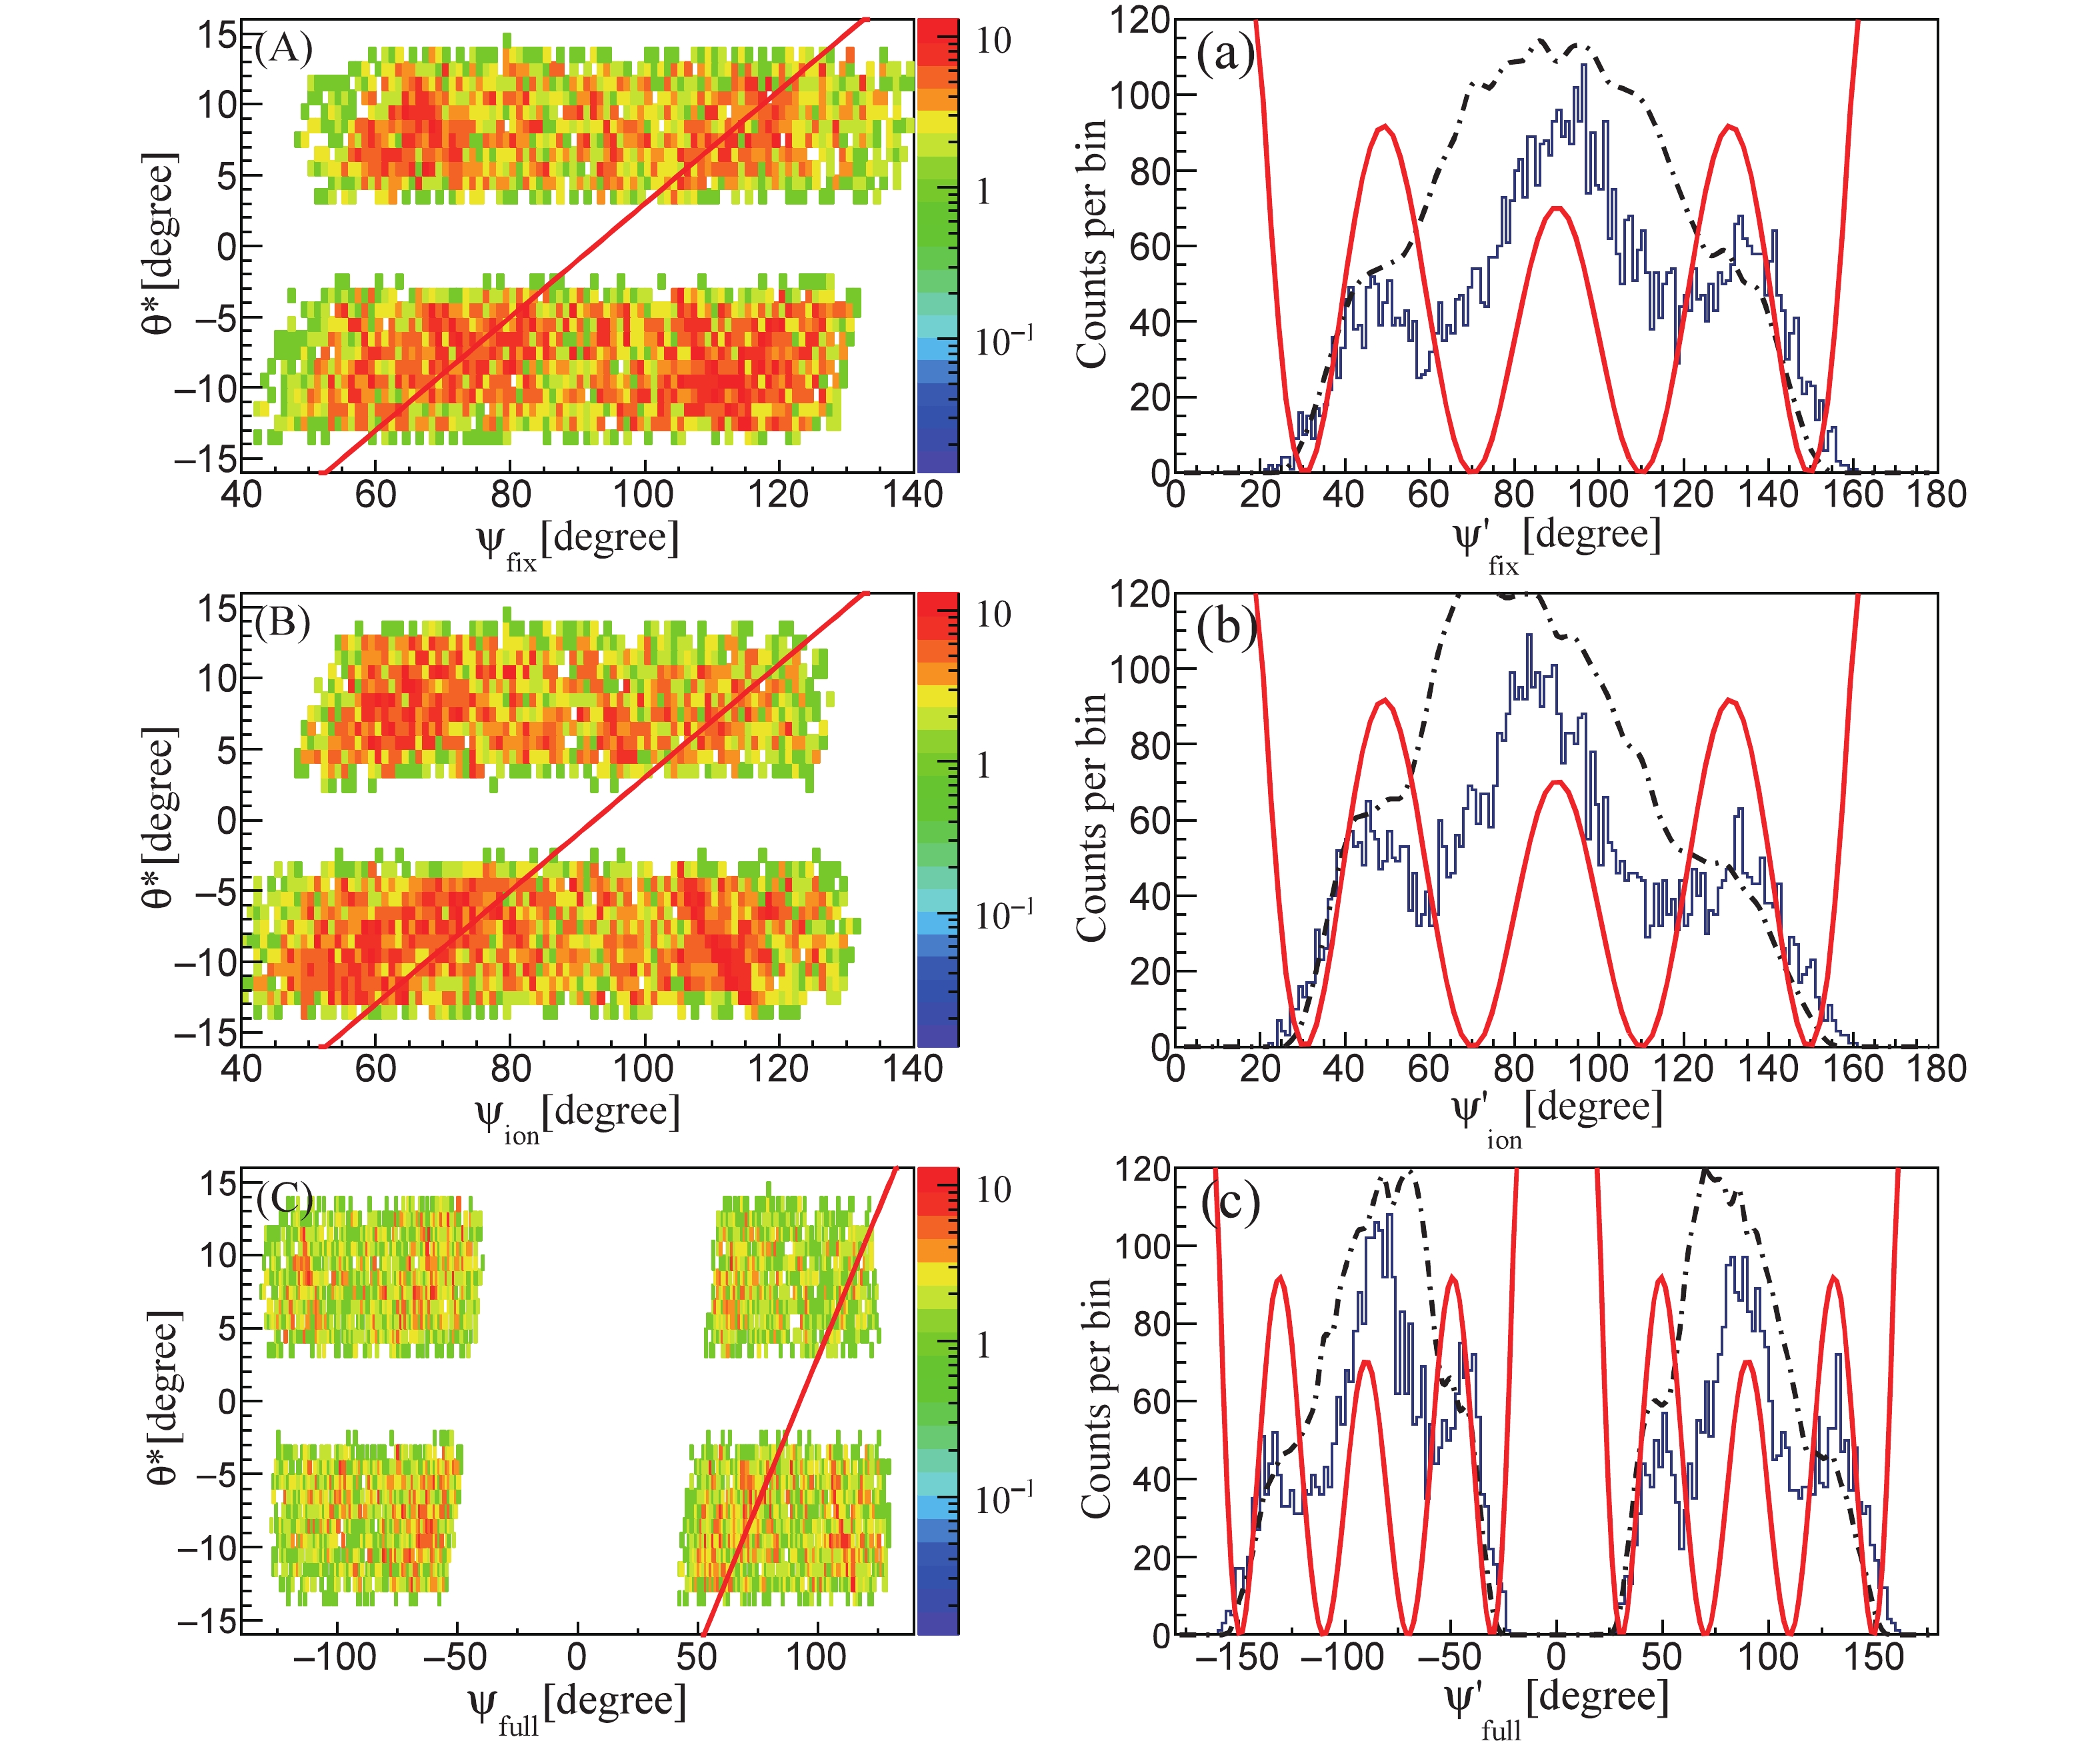
Figure 4. (color online) Angular correlation spectra for the 10.29-MeV state in 18O in the (A)
$\psi_{ \rm{fix}}$ , (B)$\psi_{ \rm{ion}}$ and (C)$\psi_{ \rm{full}}$ coordinate systems, respectively. The projection lines in (A), (B), and (C) (the red-solid lines) correspond to a slope parameter$\alpha\; = \; \frac{l_{i}-J}{J}$ , with$l_{i}$ = 13.9$\hbar$ (using$r_{0}$ = 1.2 fm). (a), (b), and (c) show the projections of (A), (B), and (C) onto the$\theta^* = 0^\circ$ axis, respectively. The black dot-dashed line indicates the simulated detector efficiency in each coordinate system. All experimental distributions are compared with a squared Legendre polynomial of the 4th order.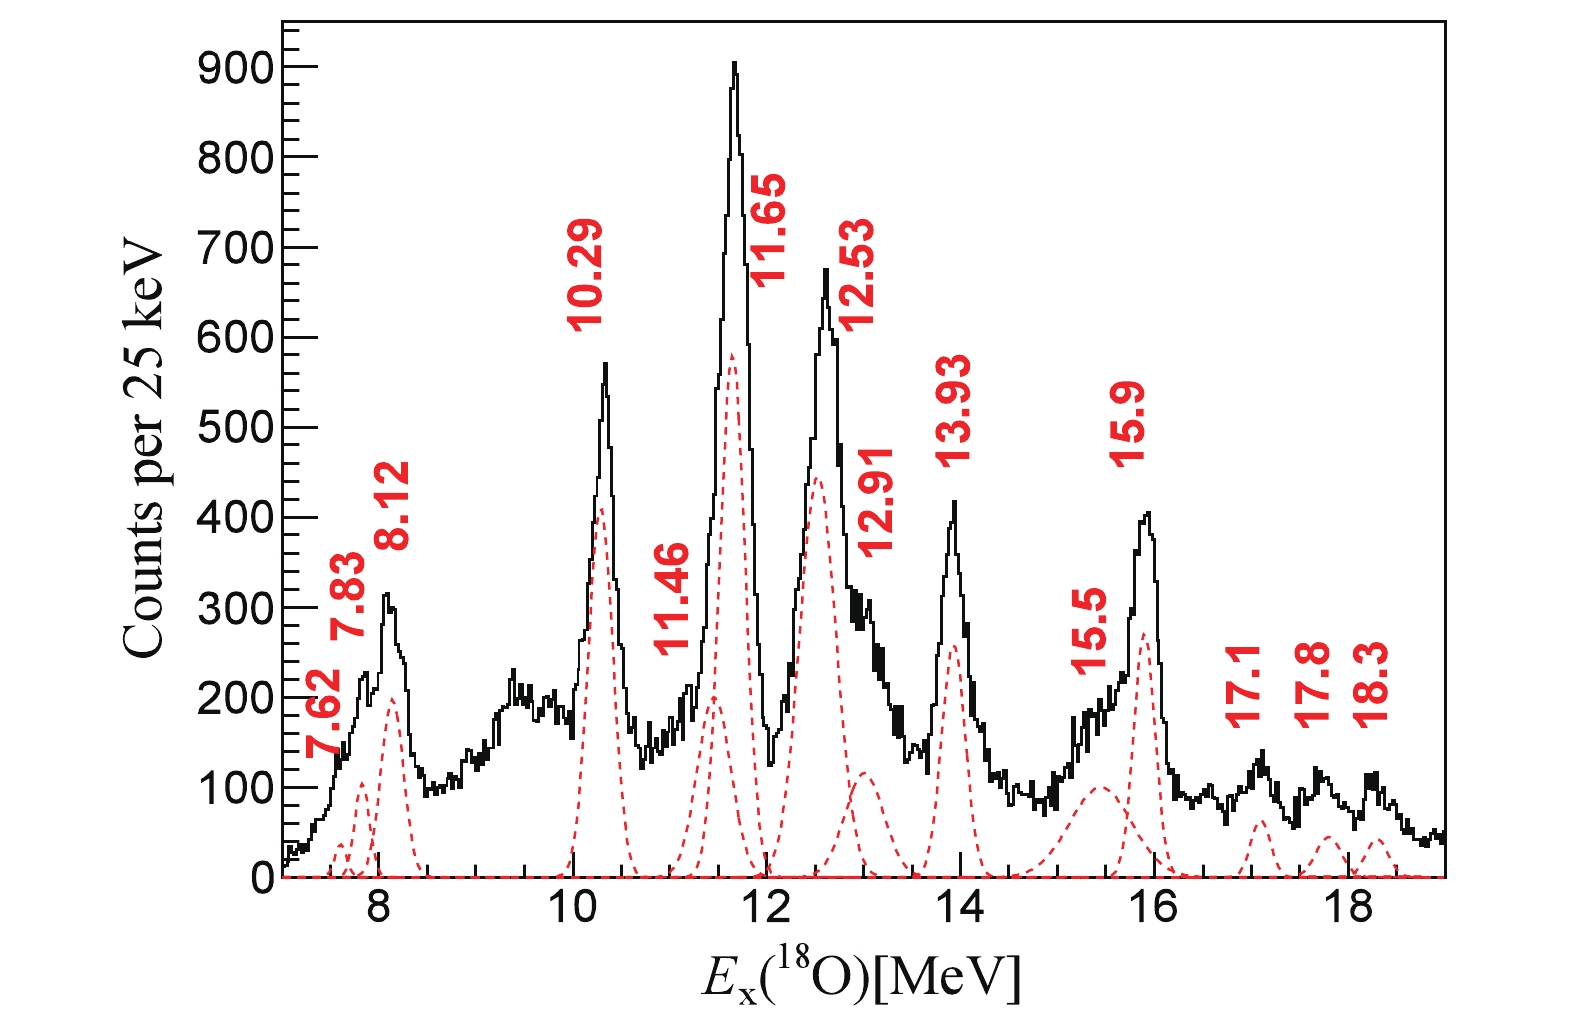
Figure 5. (color online) Excitation energy spectrum for 18O emitting to small
$\theta^*$ angles. The state at 10.29 MeV is selected to demonstrate the angular correlation analysis.In another more “physical” convention [16] (hereinafter denoted as the
$ \psi_{ \rm{ion}} $ coordinate system), the relative velocity vector$ v_{ \rm{rel}} $ always points to a certain decay particle (usually the lighter one, LI), corresponding to$ \phi^* $ =$ 0^\circ $ . The positive$ \theta^* $ remains at the opposite side of the positive$ \psi $ . Under this convention, the axial-symmetric processes (a) and (c) will be plotted at the same position, whereas (b) and (d) are plotted at another position, as demonstrated in the present Fig. 4(B) or in Fig. 3 of Ref. [16]. Due to the different detection efficiencies for light and heavy particles, the correlation structure in this coordinate system may differ from that in the$ \psi_{ \rm{fix}} $ coordinate system.Additionally, on the basis of the
$ \psi_{ \rm{ion}} $ coordinate system, the polar angle$ \psi $ could also be assigned a positive or negative sign, depending on the azimuthal angle$ \chi $ . First,$ 0^\circ $ of the azimuthal angle$ \phi^* $ or$ \chi $ is defined by a detector in the chamber plane. Then, a positive$ \psi $ means that$ \chi $ is close to$ 0^\circ $ , while negative$ \psi $ means that$ \chi $ is close to$ 180^\circ $ . Hence, four intrinsically equivalent cases in Fig. 3 are plotted at four different positions in the$ \theta^* $ -$ \psi $ plane. This coordinate system is denoted as$ \psi_{ \rm{full}} $ . This convention was used in some previous studies, such as in Ref. [14], and also demonstrated in the present Fig. 4(C). Thus, both$ \theta^* $ and$ \psi $ range across positive as well as negative scales. Since the experimental detection system may not be exactly symmetric with respective to the beam axis, the double differential cross-section in Fig. 4(C) seems not symmetric neither. It is evident that this wider scale distribution would give more consistent information for the ridge structure, however in the meantime, it would require higher statistics.The above-introduced three coordinate systems are equally meaningful, since the non-symmetric process, as shown in Fig. 2(b), does not appear in any of the defined ridge bands. Meanwhile, these systems should be consistent with each other in terms of extracting the spin of the resonant mother nucleus. This consistency is demonstrated below by experimental data analysis.
-
Recently, a multi-nucleon transfer and cluster-decay experiment [22] 9Be(13C, 18O*
$ \; \to\; ^{14} $ C +$ \alpha $ )$ \alpha $ was performed at the HI-13 tandem accelerator facility at the China Institute of Atomic Energy (CIAE) in Beijing. Resonant states in 18O can be reconstructed according to the invariant mass method [1, 5], as shown in Fig. 5 for events with small$ \theta^* $ angles. The state at 10.29 MeV is a good candidate for angular correlation analysis, owing to its clear peak identification and relatively large$ \psi $ -angle coverage. In Fig. 4, we plot the angular correlation spectrum for the 18O 10.29-MeV state in the above described three coordinate systems (Fig. 4(A-C)). Further, these two dimensional spectra in$ \theta^*-\psi $ plane are projected onto the$ \theta^* = 0 ^\circ $ axis according to the above described$ \psi' = \psi - \frac{l_{i}-J}{J}\theta^* $ relation, as exhibited in Fig. 4(a-c), respectively. The projections are compared with the square of the Legendre polynomial of order 4. Only the periodicity of the distribution matters, whereas the absolute peak amplitudes depend on the detection efficiency. Although the distributions behave slightly differently in the three coordinate systems, the periodicities of the experimental spectra all agree with the Legendre polynomial of order 4, corresponding to a spin-parity of 4+ for the 10.29-MeV state in 18O. This consistency between various coordinate systems indicates the reliability of the angular correlation method in determining the spin of a resonant state.Based on the consistency exhibited in Fig. 4 and the symmetry property of the Legendre polynomial, we may plot the projected correlation spectrum as a function of
$ | \rm{cos}(\psi')| $ [21], in order to increase the statistics in each bin of the distribution. Furthermore, this plot is independent of the above-defined coordinate systems. Moreover, the excitation energy spectrum can be reconstructed, similarly to that in Fig. 5, for each bin of$ | \cos(\psi')| $ and the corresponding event number can be extracted for the pure 10.29-MeV peak by subtracting the smooth background beneath the peak. The experimental correlation spectrum is plotted in Fig. 6. The theoretical function composed of a squared Legendre polynomial with a constant background, corrected by the detection efficiency, is used to describe the experimental results. Not only the periodicity, but also the magnitude of the function for a spin-parity of$ 4^+ $ provide an excellent fit to the experimental data, whereas other options of spin-parity can be excluded. A constant background is nevertheless needed in the theoretical function, since the experimental data include some uncorrelated components stemming from events within the 10.29-MeV peak, but away from the exact$ \theta^* $ =$ 0^\circ $ axis [10].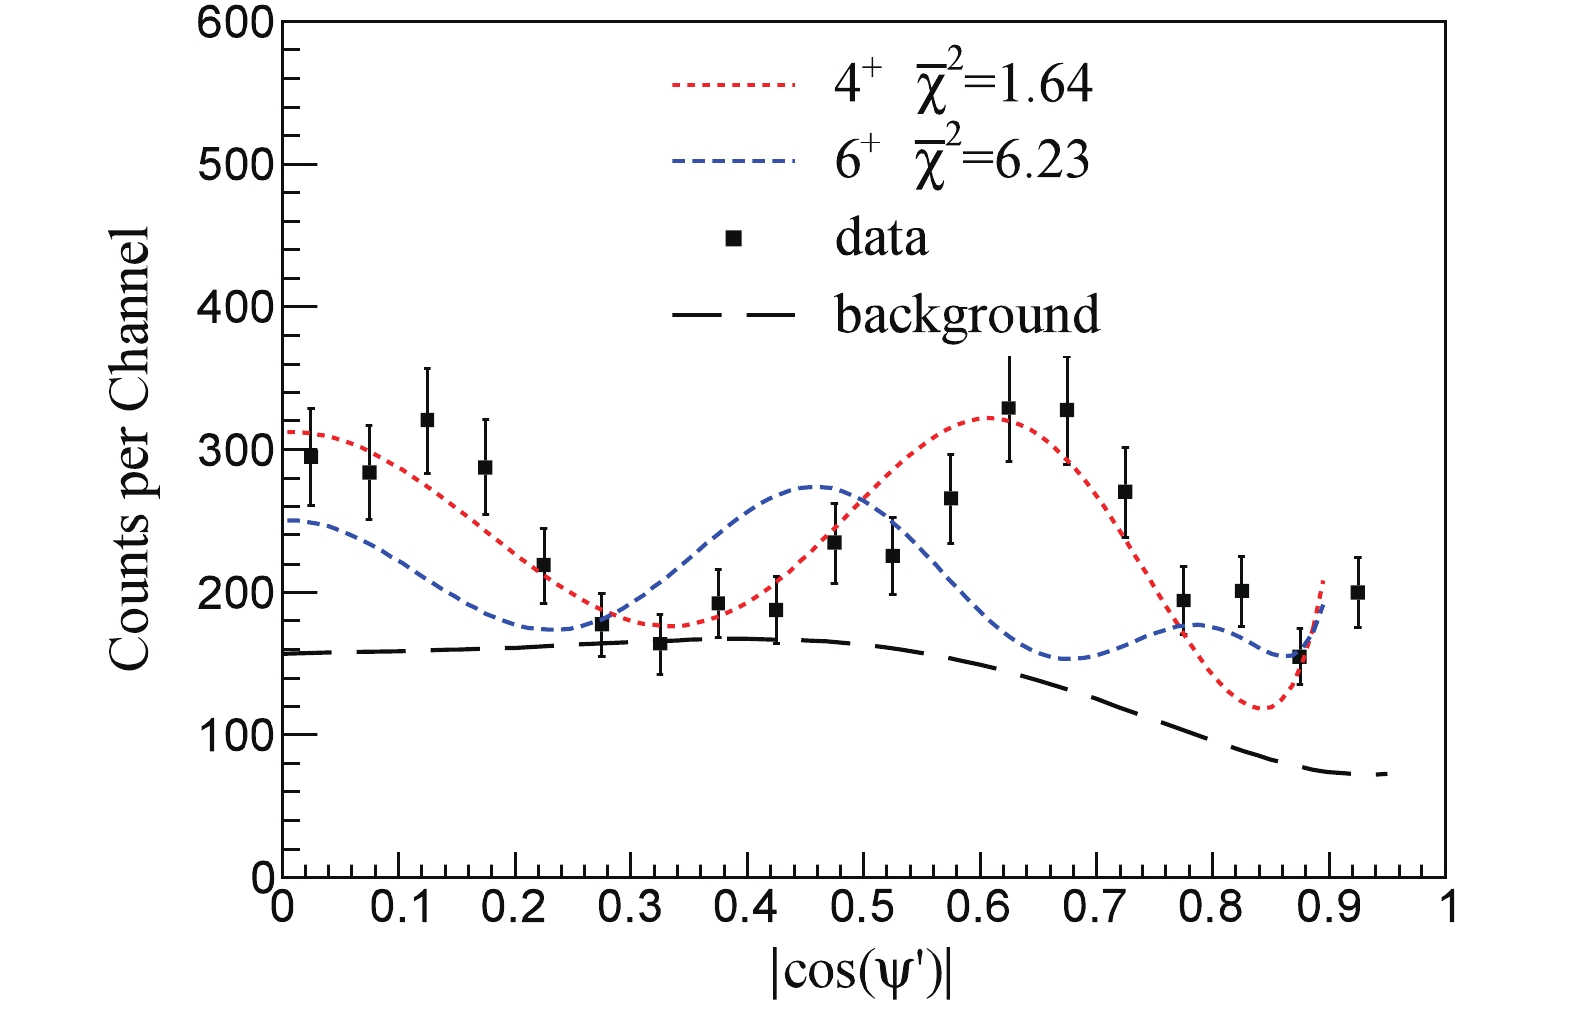
Figure 6. (color online) Angular correlation spectrum for 10.29-MeV state in 18O, in comparison to the Legendre polynomials of order 4 (the red dotted line) and order 6 (the blue dot-dashed line). A uniformly distributed background is assumed to account for the uncorrelated component (the long dot-dashed line). Theoretical angular distributions have been corrected for the detection efficiency. The corresponding reduced
$\bar{\chi}^2$ indicating the efficiency of the theoretical description is also indicated in the plot. -
The fragment angular correlation in a sequential cluster-decay reaction provides a method to determine the spins of the resonant nucleus independent of models. When the correlation spectrum is restricted to angles close to the detection chamber plane, the ridged pattern can be clearly seen in the two-dimensional plot with respective to the two polar angles
$ \theta^* $ and$ \psi $ . According to the ways to deal with symmetrical events, three coordinate systems for different$ \theta^* $ and$ \psi $ definitions have been adopted in the literature for various experiments and for the spin analysis. In the present work, we outlined these systems and compared them to each other to clarify their differences and consistencies. The systems are examined by the cluster-decay data for the 10.29-MeV state in 18O, measured in our recent experiment. This study provides a better understanding of the angular correlation function, and demonstrates the possible choices for the best extraction of the spin in a resonant state.In the case where a resonant nucleus decays into two spin-zero fragments, the two-dimensional correlation spectrum for small
$ \theta^* $ angles can be projected onto the$ \theta^* $ =$ 0^\circ $ axis. This projected spectrum may be described by a squared Legendre polynomial with an order corresponding to the spin of the resonant mother nucleus. Using this method, a spin-parity of 4+ is decisively determined for the 10.29-MeV state in 18O.Based on the above investigations, we propose the basic procedure for the application of the angular correlation method. Firstly, the experiment should be designed to have good detection for events at small
$ \theta^* $ angles and with wide$ \psi $ coverage. Secondly, a proper coordinate system should be selected according to the detection and data-distribution characteristics. In principle, the best choice is the$ \psi_{ \rm{full}} $ coordinate system, owing to its wider angular range of the correlation spectrum, which may help identify the ridge structure assuming the statistics are sufficient. However, when the statistics are low, the coordinate systems$ \psi_{ \rm{fix}} $ or$ \psi_{ \rm{ion}} $ , depending on the detection arrangement, are more convenient. Thirdly, before the projection onto the$ \theta^* = 0^\circ $ axis, the ridge structure should be distinctly observed. Otherwise, any small shift in the projection direction may lead to the wrong extraction of the spin, especially in the case of higher spin, where more oscillations in the projected spectrum are expected. The detector efficiency should likewise be carefully examined, since large variations in the efficiency curve may give rise to some non-physical structures in the projected distribution. Finally, the projected spectrum may be obtained by subtracting the background for each bin of$ | \rm{cos}(\psi')| $ . This experimental spectrum can be compared with the theoretical function (Legendre polynomial corrected by the detection efficiency), and the goodness of fit can be examined quantitatively. However, the correct projection parameter should be fixed before this fitting procedure.
Spin determination by in-plane angular correlation analysis in various coordinate systems
- Received Date: 2019-04-21
- Available Online: 2019-08-01
Abstract: In the excitation of the resonant state followed by the sequential cluster-decay, the in-plane angular correlation method is usually employed to determine the spin of the mother nucleus. However, the correlation pattern exhibited in a two-dimensional angular-correlation spectrum depends on the selected coordinate system. In particular, the parity-symmetric and axial-symmetric processes should be presented in a way to enhance the correlation pattern, whereas the non-symmetric process should be plotted separately to reduce the background. In this study, three coordinate systems previously adopted for correlation patterns in the literature are described and compared to each other. The consistency among these systems is evaluated based on the experimental data analysis for the 10.29-MeV state in 18O. A spin-parity of 4+ is obtained for all three coordinate systems.


 DownLoad: