-
From the early days of nuclear physics, elastic scattering has been widely used to investigate the structure of the interacting nuclei [1, 2]. It is the simplest nuclear process with quite a large cross-section. Usually, the angular distribution of elastic scattering is plotted as the ratio to the Rutherford scattering. In this representation, the angular distributions for stable and ordinary nuclei at energies close to the Coulomb barrier are pure Rutherford (
$ \sigma/\sigma_{\rm R}\approx 1 $ ) at forward angles. As the scattering angle increases, a typical Fresnel oscillatory diffraction pattern, or the so-called Coulomb rainbow, may appear due to the interference between the partial waves refracted by the Coulomb and short-range nuclear potentials [3]. At larger angles, the absorption component of the optical model potential exponentially damps the$ \sigma/\sigma_{\rm R} $ ratio [4, 5]. For lighter projectile and target nuclei, the Coulomb force is smaller and the diffractive pattern changes from the Fresnel to Fraunhofer oscillations. In reactions induced by weakly-bound nuclei on a heavy target, coupling effects from breakup channels may be important, and the angular distribution of the elastic scattering may show different features. Due to the Coulomb field of a heavy target and possible long-range component of the nuclear potential, the Fresnel peak may be reduced or sometimes completely damped. Deformation and strong cluster structure of the projectile and/or target can also play an important role in modifying the elastic scattering angular distribution, for instance, by deviating the elastic flow from the forward to backward angles [6]. Although several studies of elastic scattering of light nuclei on heavy targets have been carried out [7-9], the origin and characteristics of the long-range component of the nuclear potential in elastic scattering due to deformation, cluster configuration or low binding energy of the projectile, are yet to be fully understood. For instance, it would be interesting to investigate if the common behavior (e.g. the reduction of the Fresnel peak) of heavy-ion elastic scattering at energies close to the barrier is present for collisions at a few times the Coulomb barrier.The description of the angular distribution of elastic scattering is very sensitive to the choice of the interaction potential. Optical model (OM) potentials is usually used in the analysis of the angular distribution, where the potential is constrained by the data [10]. The angular distribution may also be affected by the cluster structure, size and density of the interacting nuclei, which are quite different in the tightly-bound stable and weakly-bound unstable nuclei. Weakly-bound nuclei may have an extended radial distribution due to the valence particles. The size of the nuclei has been deduced by the interaction and reaction cross-section measurements [11, 12]. The extended radial distribution or strong cluster configuration of weakly-bound nuclei, and large deformations of stable nuclei, may considerably affect the surface density. Thus, it is worthwhile to test different density distributions in OM in order to better understand the angular distribution of elastic scattering .
In previous publications, our group has studied the elastic scattering of 7Be [13], 8B [14], 10B [15] and 9,10,11C [13, 15] on a lead target, and the breakup reactions of 8B [16] and 9Li [17] on carbon and lead targets, respectively. In the present work we report the study of elastic scattering of 10Be + 208Pb at the energy of about three times the Coulomb barrier. Elastic scattering induced by beryllium isotopes (7Be, 9Be, 10Be and 11Be) as projectiles on heavy targets can serve as an interesting case for investigating several effects that may emerge in the interactions. For instance, 9Be is a weakly-bound nucleus which has a Borromean cluster configuration given by
$ \alpha $ -$ \alpha $ -n with a neutron valence separation energy of$ S_{n} $ = 1.574 MeV. Two recent works related to the elastic scattering in the 9Be + 120Sn [18] and 9Be + 208Pb systems [19] showed the importance of considering the three-body cluster model ($ \alpha $ -$ \alpha $ -n) of this projectile for the description of the elastic data. A clear Fresnel peak observed in the data of proton-rich radioactive 7Be beam on 208Pb, measured at the energy of about three times the barrier [13], was reduced to the angular distribution measured at energies close to the barrier (note that this was only confirmed by calculations since the experimental setup did not allow the collection of data at the required scattering angles) [20], probably due to the coupling to continuum. The coupling to continuum was found to be more pronounced for a weakly-bound projectile as observed, for instance, for 11Be [21]. Data for elastic scattering of the neutron-rich weakly-bound radioactive projectile 11Be on heavy targets is quite scarce. One such study is related to the elastic scattering of 11Be + 120Sn [22], and, despite the limited angular range measured, the authors inferred a strong damping of the Fresnel peak. These data were analyzed in terms of the short and long-range potentials, giving evidence of a large radius of the 11Be nucleus [23]. Proton-rich nuclei can also induce damping of the Fresnel peak, and the difference in the elastic scattering of proton and neutron-rich light nuclei on a heavy target was discussed in Ref. [24]. The other beryllium isotope is the 10Be nucleus. 10Be is a tightly-bound nucleus with a neutron separation energy of$ S_{n} $ = 6.812 MeV. Theoretical studies predicted a$ \alpha $ -$ \alpha $ -n-n cluster configuration of its ground-state [25]. This nucleus is an interesting case of possible coexistence of molecular orbital structure and cluster structure [26-28]. Data for 10Be + 208Pb elastic scattering, measured at energies close to the barrier, were reported in Ref. [29]. From the OM analysis, the authors obtained a larger total reaction cross-section for 10Be compared to 9Be on 209Bi [30]. This result is quite surprising considering that 10Be is much more bound than 9Be. Although doubt was raised in Ref. [29] about the experimental result of 9Be + 209Bi [30], one may wonder if the difference in the deformation of 10Be and 9Be may have a role in this discussion. The deformation parameter of 10Be was found to be$ \beta_2 $ = 1.14(6) [31], which gives$ \delta_2 $ = 2.947 fm ($ r_{0} $ = 1.2), while for 9Be the parameters are$ \beta_2 $ = 0.92 [32] with$ \delta_2 $ = 2.296 fm ($ r_{0} $ = 1.2), or$ \beta_2 $ = 1.1 [33] with$ \delta_2 $ = 2.45 fm ($ r_{0} $ = 1.2). Discussion of these low energy data is out of the scope of this paper. These results suggest that more experimental studies are needed to fully understand the reactions induced by these Be isotopes. It is also important to mention that 10Be is the core of the halo 11Be nucleus, and the excitation of 10Be was found to be important for describing the 11Be breakup data [34, 35].The present work reports the measurements of the angular distribution of elastic scattering of 10Be on a 208Pb target at 127 MeV, which is around three times the Coulomb barrier. A detailed description of the experimental setup and of the data analysis is given in Sec. 2. The measured angular distribution of elastic scattering of 9,10Be and the optical model analysis are presented in Sec. 3 and Sec. 4. In Sec. 5, the summary and conclusions are presented.
-
9Be and 10Be were produced as secondary beams by fragmentation of the 54.2 MeV/nucleon 13C primary beam at the Radioactive Ion Beam Line in Lanzhou (RIBLL) [36, 37] of the Heavy-Ion Research Facility in Lanzhou (HIRFL) [38, 39]. The schematic view of the beam line is shown in Fig. 1. The 13C primary beam was impinged on the 4500 μm thick beryllium target which was placed in the production chamber (T0) of RIBLL. An aluminum wedge, 1510 μm thick, was placed at the first focal plane (C1) of RIBLL as a degrader. The energies of secondary beams at the center of the 208Pb target were E
$ _{\rm Lab} $ = 88 and 127 MeV, for 9Be and 10Be, respectively. These secondary beams were identified and discriminated using a combination of time-of-flight and energy loss (ToF-ΔE) signals. The ToF detectors consisted of two plastic scintillators (C9H10), 50 μm-thick, installed at T1 and T2, giving a total of 17 m flight length. A 317 μm thick silicon detector (SD) was placed at T2 and used as the ΔE detector. After the particles had been identified, SD was removed from the beam line. The average intensities of 9Be and 10Be were 7×10³ and 6×10³ pps, with purity of 98% and 98.5%, respectively. The 208Pb target consisted of a self-supporting foil, 8.52 mg/cm2 thick, which was made by evaporation and measured by weighing.
Figure 1. (color online) Schematic view of the low-energy radioactive ion beam line at the RIBLL facility.
For scattering experiments, an accurate measurement of the scattering angle and the direction and position of the incident particles is crucial. For this purpose, collimating detectors are placed before the reaction target to determine the incident direction of the beam particles. The detectors in the setup should have the ability to effectively identify the scattered particles with high resolution for both energy and position measurements. In the present experiment we used several double-sided silicon strip detectors (DSSDs). The sketch of the setup used in the experiment is shown in Fig. 2. Two DSSDs, with 16 horizontal and 16 vertical strips and 74 μm and 87 μm thick (denoted as SiA and SiB), were used to give the precise position and direction of the incident beam particles. These detectors were set 669 mm and 69 mm away from the target position, respectively, as indicated in Fig. 2.
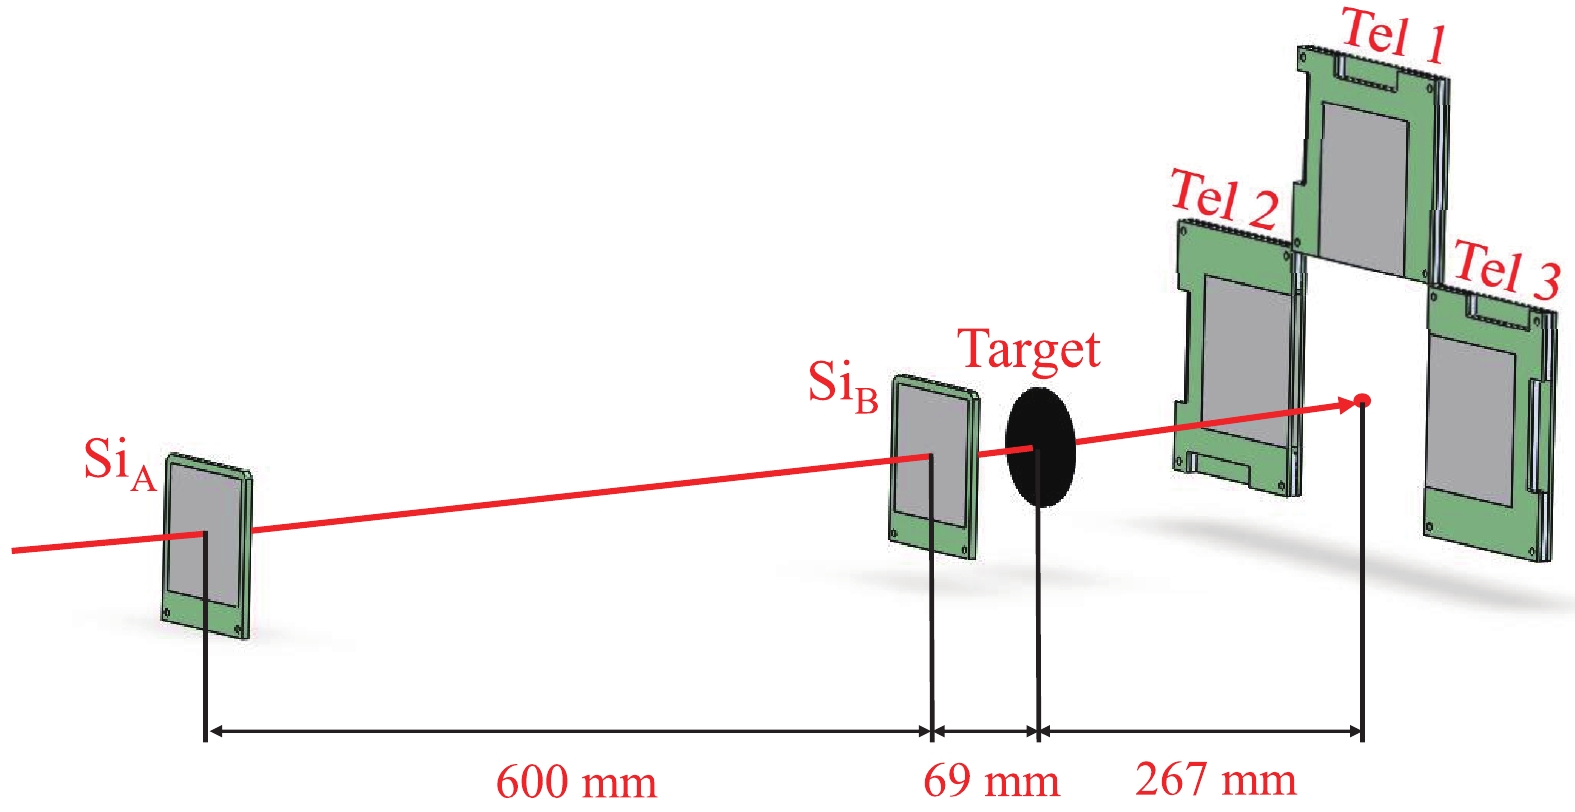
Figure 2. (color online) Experimental setup used for measuring the elastic scattering in the reaction 9,10Be + 208Pb.
An array of three
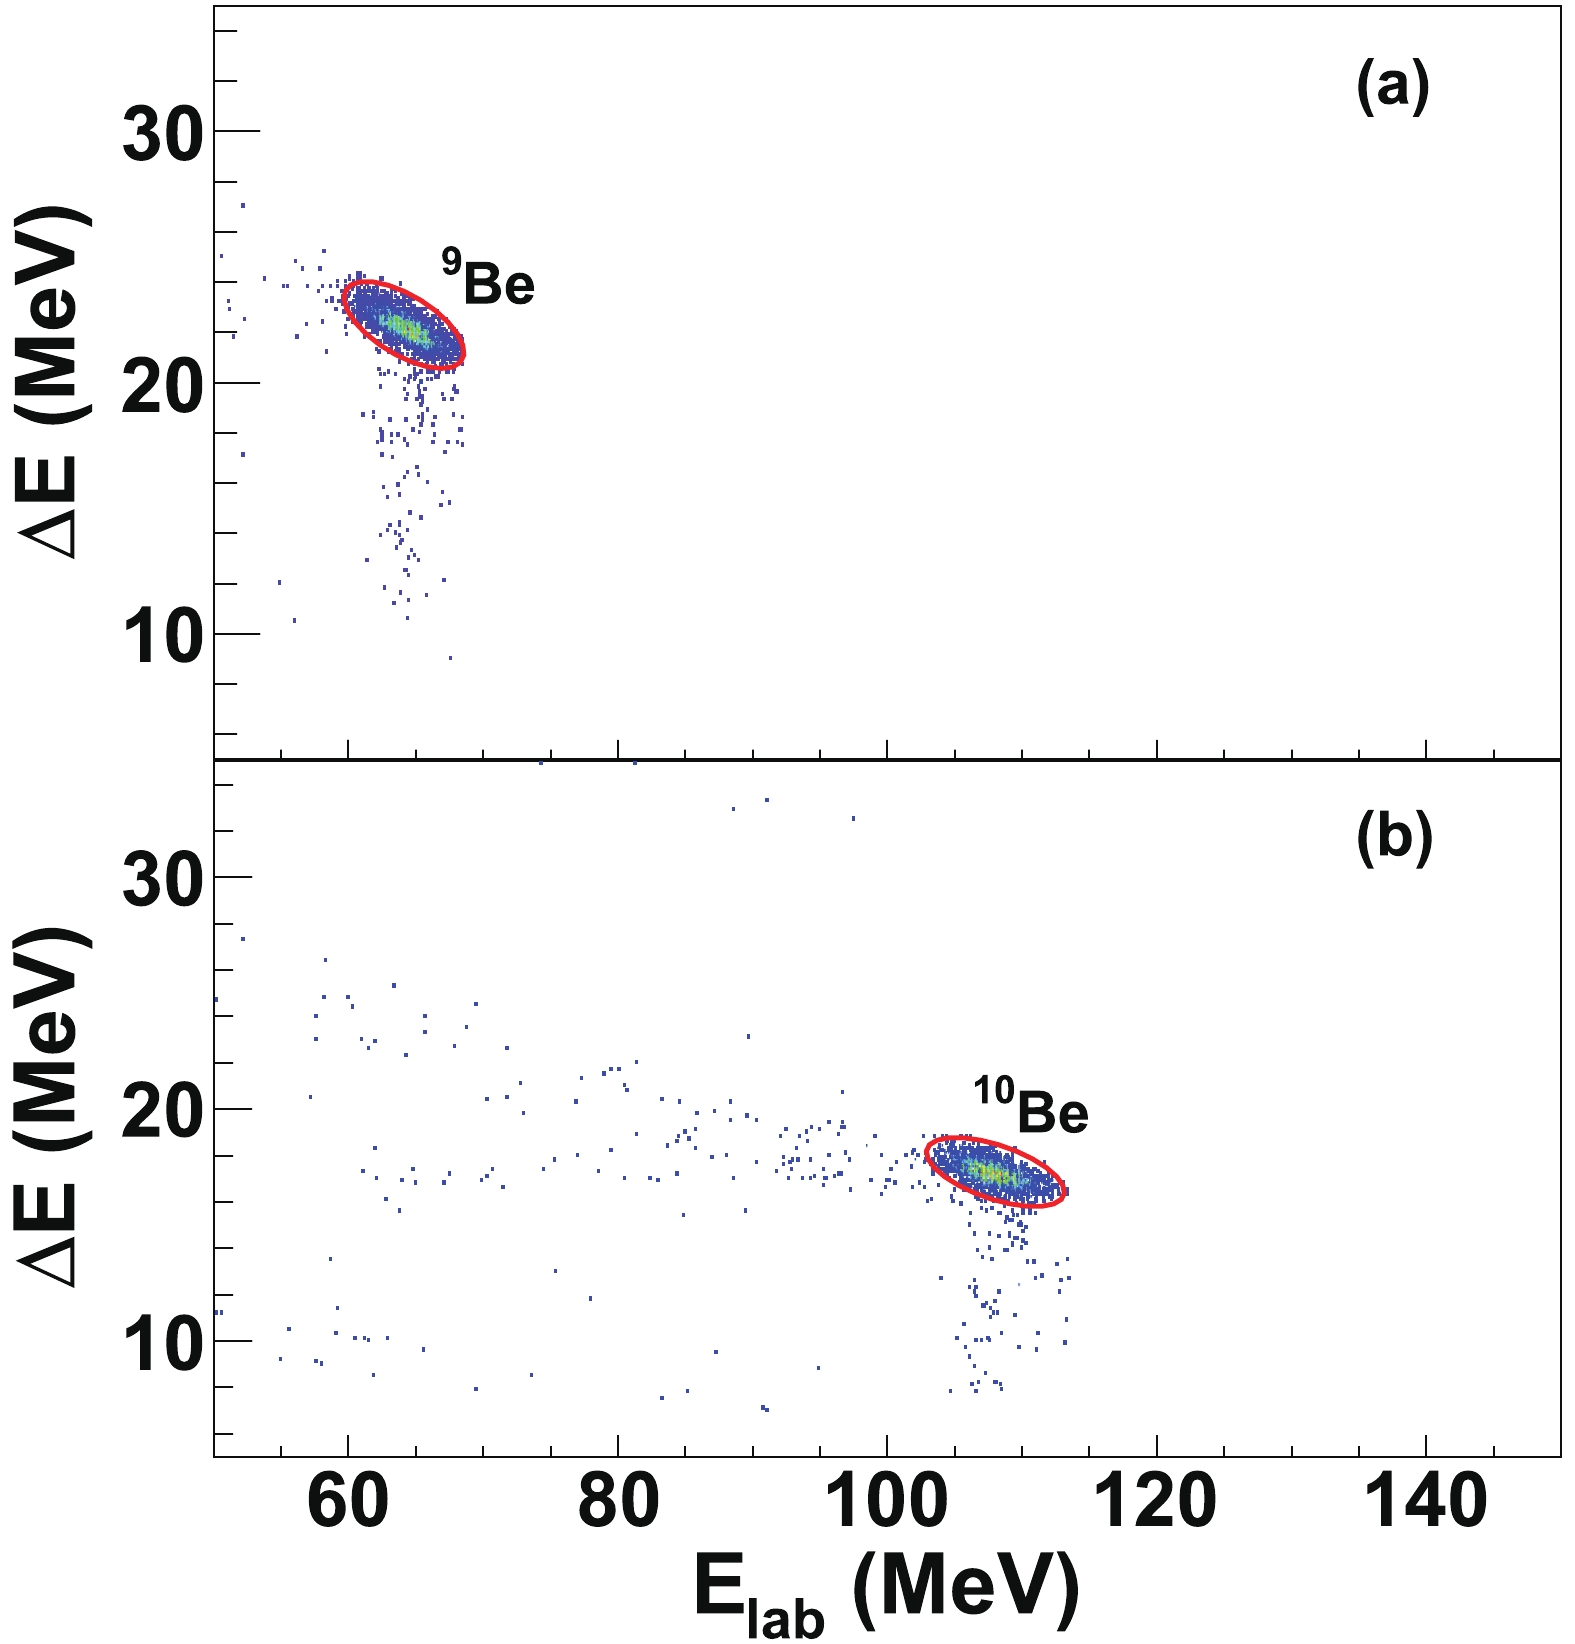
$ {\Delta E-E} $ particle telescopes, named$ \mathit{\rm Tel1} $ ,$ \mathit{\rm Tel2} $ and$ \mathit{\rm Tel3} $ , was used to detect the scattered particles. DSSDs with a thickness of 301, 129, and 144 μm, respectively, were used as the$ {\Delta E} $ detectors in each telescope. Each${\Delta E} $ detector consisted of 32 elements (X position) on the junction side and 32 elements (Y position) on the ohmic side, giving a total active area of 64 mm×64 mm. For the E signal, SDs with a thickness of 1536, 1535, and 1528 μm, respectively, and with the same effective area as DSSDs, were used. The full detector array was mounted 267 mm downstream from the target, covering an angular range of 5° to 27°. The angular resolution of DSSDs was about 0.4°. The position of the scattered particles was extracted from DSSDs with an accuracy of 2 mm×2 mm. The amplification of the signal from each DSSD strip was not identical, and each was individually calibrated with the 9Be and 10Be beams. To improve the signal-to-noise ratio, the detector system was cooled by circulation of cold alcohol at a temperature of −20 °C. Typical$ {\Delta E-E} $ particle identification spectra for the 9Be and 10Be beams on 208Pb target are shown in Fig. 3. Points inside the solid red ellipsoid curve in Fig. 3(a) and Fig. 3(b) represent elastic scattering events of 9Be and 10Be, respectively. -
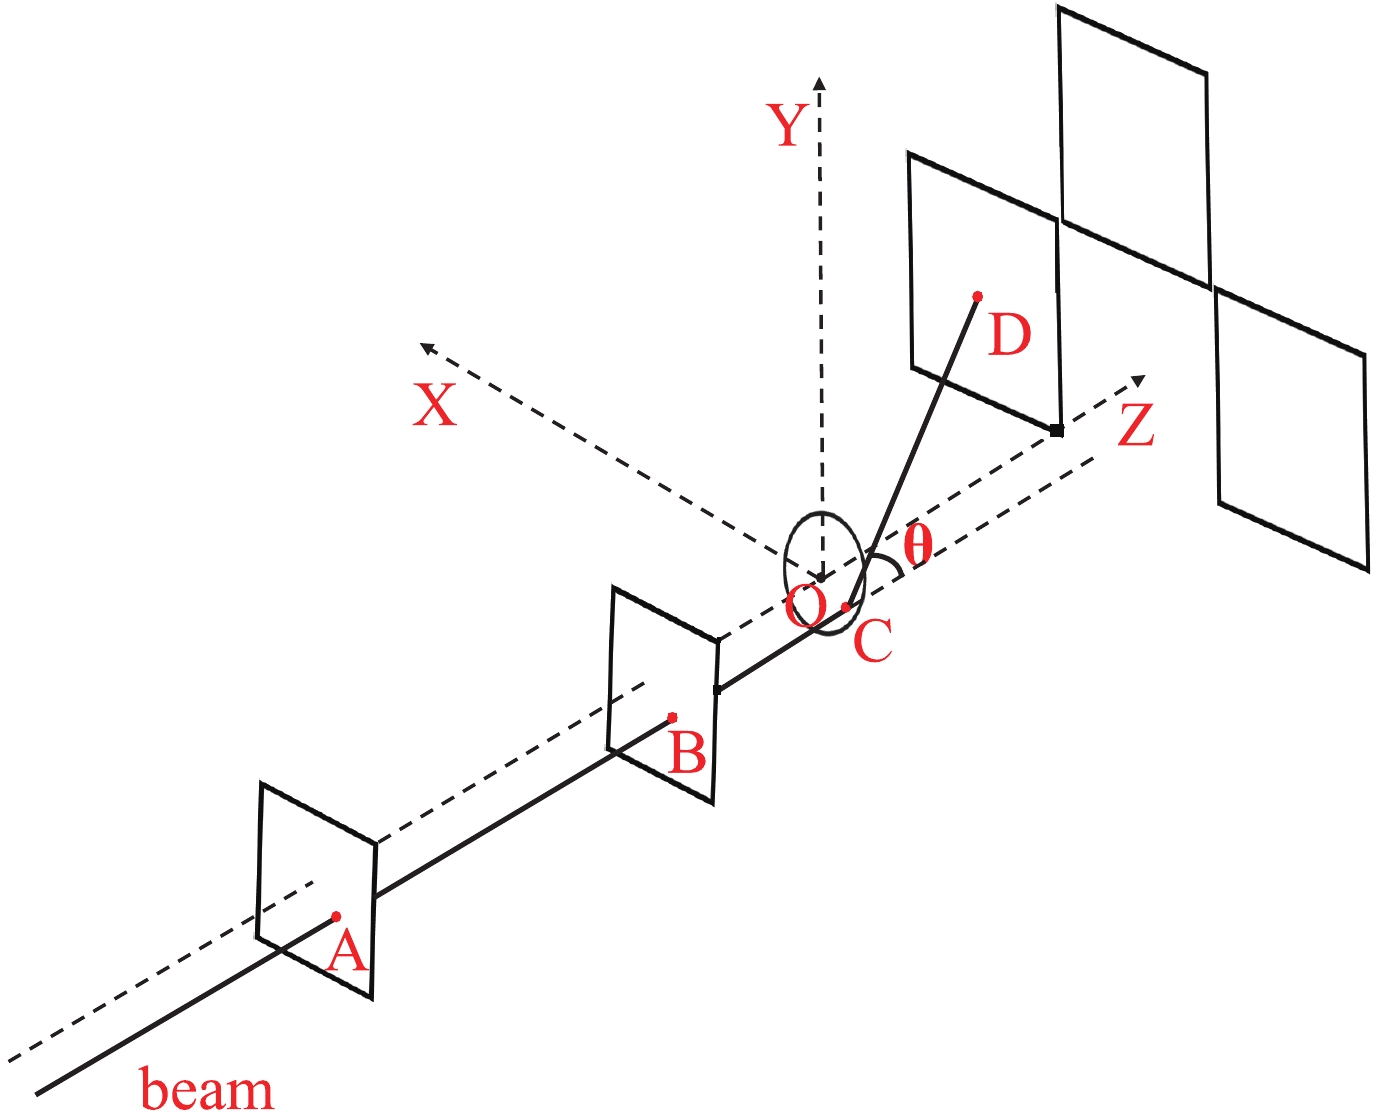
The scattering angles were obtained by extrapolation of the target position and the positions of particles hitting DSSDs, as shown in Fig. 4. For each scattered particle, the incident track
$ \overrightarrow{AC}$ was determined by a combination of the hit positions in the SiA and SiB detectors,$ \overrightarrow{AB} $ , which was extrapolated to the hit position C in the target. The particle is then scattered by the target and hits point D of DSSDs. The track$ \overrightarrow{CD} $ defines the outgoing path of the scattered particle. The angle between the incident direction$ \overrightarrow{AC} $ and the scattered direction$ \overrightarrow{CD} $ is the scattering angle$ \theta_{\rm Lab} $ , which was calculated on the event-by-event basis. The beam spot on the target was large ($ \approx $ 30 mm) and asymmetrical. Therefore, a Monte Carlo simulation, taking into account the detector geometry and the beam distribution in the target, was used to evaluate the absolute differential cross-section.Another important issue considered was the contamination of the data from particles scattered by DSSDs (SiA and SiB). In previous experiments, we used Parallel-Plate Avalanche Counters (PPACs) to measure the position and direction of the beam particles [40-42]. Compared to silicon detectors, PPAC introduces almost no disturbance of RIB. In this experiment, we used two thin DSSDs replacing PPACs, which caused some contamination of the data from scattering in the detectors. The events coming from the detector system were measured with the target moved out. To check the impact of the target-out events on the data, we performed a simulation assuming that the particles are scattered in the silicon detectors before scattering in the 208Pb target. Only scattered particles in SiB were considered in the simulation. The incident direction of the beam is calculated after scattering in SiA, and thus particles scattered by SiA do not affect the data. Since
$ \mathit{\rm Tel1} $ was placed at a large angle, particles that do not originate in the target can hardly hit it. Thus, the target-out events mostly come from$ {\mathit {\rm Tel2}} $ and$ {\mathit {\rm Tel3}} $ . The results of the simulations for the 9Be and 10Be beams as a function of the angle$ \theta $ , with (blue line) and without (red line) scattered particles in Si$ _{B} $ , are shown in Fig. 5. The scattering events in Si$ _{B} $ for both 9Be and 10Be beams account for less than 5% of all scattering events. We conclude that the contribution of the target-out events affects the data very little, basically in the forward angles, which can be considered negligible in our experiment. Also, the effect of the small contribution at forward angles was diluted by the normalization method.
Figure 5. (color online) Simulation results for 9Be (left) and 10Be (right) as a function of
$ \theta $ with and without scattering in SiB.The elastic scattering differential cross-section as the ratio to the Rutherford cross-section is obtained by:
$ \begin{aligned}\frac{\sigma(\theta)}{\sigma_{\rm Ruth}(\theta)}=\frac{{\rm d}\sigma(\theta)/{\rm d}\Omega}{{\rm d}\sigma_{\rm Ruth}(\theta)/{\rm d}\Omega}= \frac{\dfrac{N(\theta)_{\rm exp}}{N_{\rm in}N_{\rm target}{\rm d}\Omega}}{\dfrac{N(\theta)_{\rm Ruth}}{N_{\rm in}N_{\rm target}{\rm d}\Omega}}= C\times\frac{N(\theta)_{\rm exp}}{N(\theta)_{\rm Ruth}}, \end{aligned} $

(1) where
$ \mathit{C} $ is the normalization constant,$ N_{\rm in} $ is the number of incident particles,$ N_{\rm target} $ is the number of target nuclei per unit area,$ N(\theta)_{\rm exp} $ and$ N(\theta)_{\rm Ruth} $ are the yields at a given angle in the data and from the simulations, respectively. The normalization constant$ \mathit{C} $ for the 9Be angular distribution was obtained by normalizing the experimental cross-section to the simulation results for angles below 20°, where the elastic scattering is assumed to be pure Rutherford scattering. This overall normalization was also applied to the cross-section of the 10Be + 208Pb system. With this method, the cross-sections are obtained in a straight forward way, and the influence of the systematic errors of the measured total number of incident particles, target thickness and solid angle determination was avoided. To minimize the systematic errors, small corrections of the detector misalignment were also performed. The details of this procedure can be found in Ref. [43].It is important to mention that, in principle, the elastic and inelastic scattering from the excited states of the lead target nuclei could not be discriminated and the data are quasi-elastic in nature. However, the contributions from the excited states of the lead target were found to be negligible in several other experiments with a similar energy and angular range [13]. For this reason, we consider in the present work that the data are for elastic scattering.
The differential cross-sections for elastic scattering were normalized to the differential cross-section of Rutherford scattering, and are plotted as a function of scattering angle. The elastic scattering angular distributions for 9Be + 208Pb at the energy
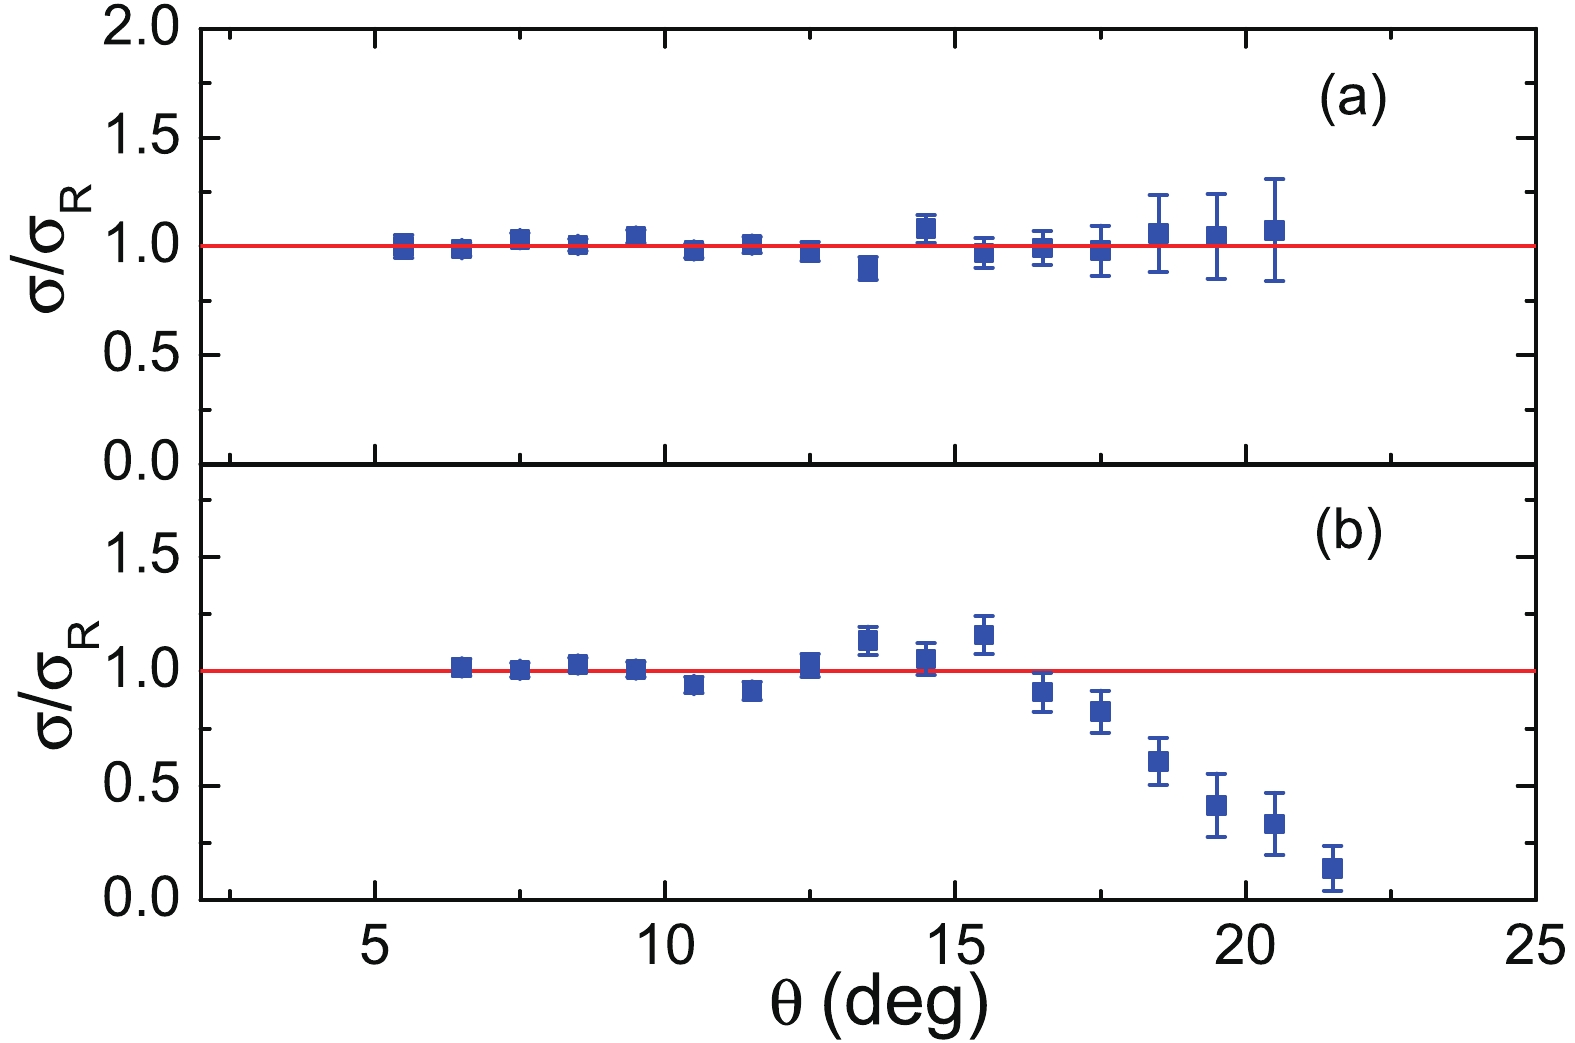
$ E_{\rm Lab} $ = 88 MeV, and for 10Be + 208Pb at the energy$ E_{\rm Lab} $ = 127 MeV, are shown in Fig. 6. As can be seen, the ratio$ \sigma \ / \sigma_{\rm Ruth} $ for 9Be is close to unity since the Rutherford scattering is dominant within the measured angular range. In the angular distribution of 10Be + 208Pb, shown in Fig. 6(b), the typical Fresnel diffraction can be observed. -
Optical model analysis of the elastic scattering differential cross-section data was performed. All the calculations were performed with the code FRESCO [44]. We first considered the complex Woods-Saxon (WS) potential, which has six parameters, namely, the real (imaginary) potential depth V (W), radius
$ r_{v} $ ($ r_{w} $ ) and the diffuseness$ a_{v} $ ($ a_{w} $ ). The reduced radii have to be multiplied by the mass term$ (A_{P}^{1/3} + A_{T}^{1/3}) $ , where$ A_{P} $ = 10 and$ A_{T} $ = 208, to give the radii of the real and imaginary potentials. The WS potential for 10Be + 208Pb was obtained by adjusting the six parameters to best reproduce the elastic scattering data. The parameters from the fit procedure are listed in Table 1, and were obtained with the minimum$ \chi^2 $ criteria given by:parameters V/MeV rv/fm av/fm W/MeV rw/fm aw/fm χ2 10Be + 208Pb 18.33 1.251 0.636 20.27 1.255 0.744 0.493 Table 1. The Woods-Saxon parameters obtained by fitting the experimental data.
$ \chi^2 = \frac{1}{N}\sum\limits_{i = 1}^N\frac{[\sigma_{i}^{\rm exp}-\sigma_{i}^{\rm th}]^2}{\Delta\sigma_{i}^2}, $

(2) in which N is the number of data points,
$ \sigma_{i}^{\rm exp} $ and$ \sigma_{i}^{\rm th} $ are the experimental and the calculated differential cross-sections, and$ \Delta\sigma_{i} $ is the uncertainty of the experimental cross-section. The results of the OM analysis with the WS potential are shown in Fig. 7 by the black dashed line. As can be seen, the agreement with the data is good, in particular at the Fresnel peak. The total reaction cross-section obtained with the WS potential is 3370 mb. However, since the experimental data were obtained in a relatively limited angular range, the potential parameters are not unique.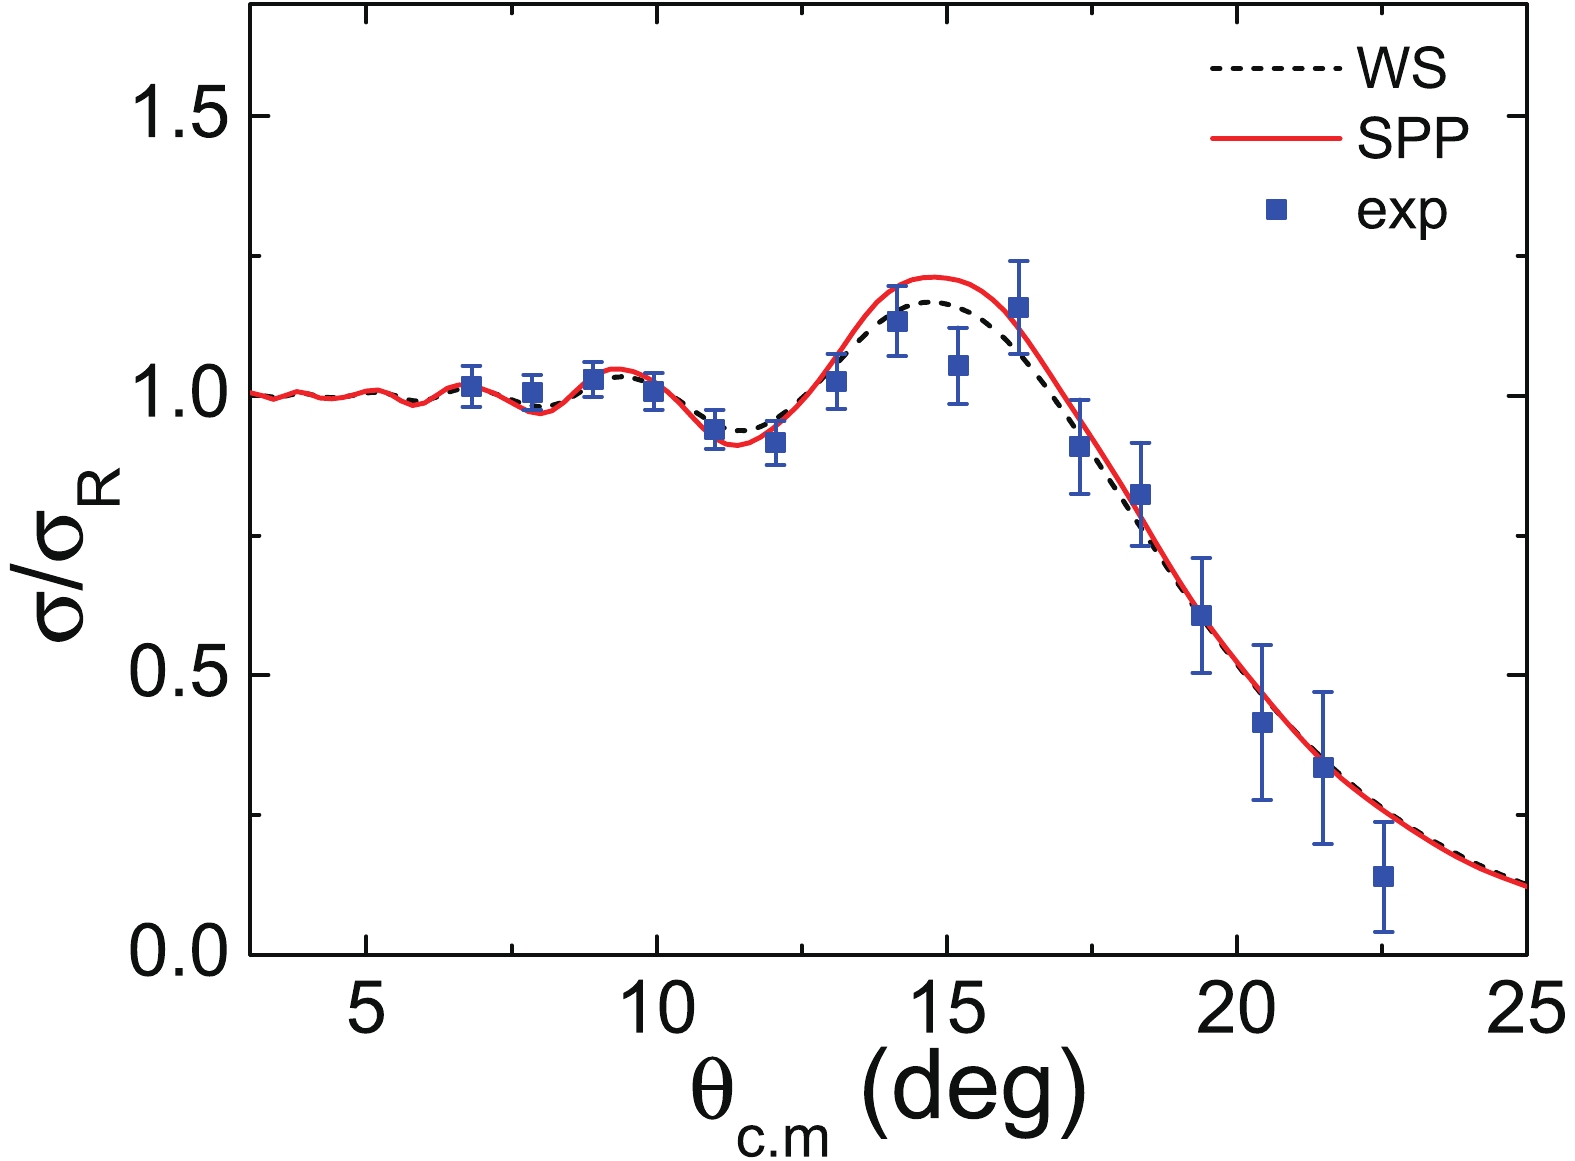
Figure 7. (color online) Elastic scattering angular distribution for the 10Be + 208Pb system at 127 MeV. The lines are the results of the optical model analysis with the WS potential and the double-folding SPP.
To decrease the number of free parameters, and thus the ambiguities in the potentials in the OM analysis, folding potentials have been developed. The results with the double-folding São Paulo Potential (SPP) in the OM analysis are shown in Fig. 7 by the red solid line. The total reaction cross-section obtained with SPP is 3240 mb. SPP is a "folding-type" effective nucleon-nucleon interaction with a fixed parametrized nucleon density distributions in the projectile and target. It can be used in association with OM, with
$ N_{\rm R} $ and$ N_{\rm I} $ as normalizations of the real and imaginary parts [45]. From a large set of systematic values,$ N_{\rm R} $ = 1.00 and$ N_{\rm I} $ = 0.78 were proposed [46]. With the standard values of the normalization, we could reproduce well the data in the measured angular region with SPP, as can be seen in Fig. 7. SPP fit is more sensitive to the backward angles, where the influence of the absorption of the flux from direct reactions is more important. A measurement at more backward angles for 10Be would be highly desirable for a more rigorous test of this potential.We considered another global nucleus-nucleus potential, which was obtained from a systematic optical potential analysis by Xu and Pang (X&P) [47]. This global potential can reasonably reproduce the elastic scattering and total reaction cross-sections for projectiles with mass numbers up to
$ A\lesssim40 $ , including the stable and unstable nuclei, and at energies above the Coulomb barrier. It is obtained by folding the semi-microscopic Bruyères Jeukenne-Lejeuue-Mahaux (JLMB) nucleon-nucleus potential with the nucleon density distribution of the projectile nucleus [47]. The JLMB potential itself employs single-folding of the effective nucleon-nucleon interaction with the nucleon density distribution of the target nucleus [48]. Hence, the X&P potential is single folding in nature, but it also requires nucleon density distributions in both the projectile and target nuclei. The results with JLMB are close to SPP, but in some cases it may overestimate the differential cross-section for large angles. These may be caused by the special consideration of the Pauli nonlocality in SPP, which is important at low incident energies [47]. The density distribution in the projectile can be deduced from the observed interaction and total reaction cross-sections using the Glauber model [49], or using the Hartree-Fock calculation [50]. The proton and neutron density distributions in the target nuclei are obtained from the Hartree-Fock calculation with the SkX interaction [47]. Optical model results with this global nucleus-nucleus potential, using different density distributions in 10Be, and the comparison with the data for 10Be + 208Pb are shown in Fig. 8. The root-mean-square (RMS) radii of proton, neutron and nuclear matter distributions used in these calculations are summarized in Table 2. The first row in Table 2 gives the RMS radii derived from the Glauber model with harmonic oscillator distributions which result in the RMS radius$ R_{\rm HO} = 2.299 $ fm for 10Be [49]. In row 2, the RMS radius$ R_{\rm Liatard} = 2.479 $ fm was determined from the Glauber model analysis of the total reaction cross-section of 10Be on a carbon target by Liatard et al. [11].$ R_{\rm Liatard2} $ and$ R_{\rm Liatard3} $ are two artificial density distributions, obtained by stretching the distribution proposed by Liatard et al., so that the radius of 10Be is increased by 10% and 20%, respectively. The elastic scattering angular distributions calculated with the X&P potential using these density distributions are shown in Fig. 8 together with the experimental data. From these results, it can be concluded that a change of the RMS radius by 10% induces a shift of the angular distribution by about 0.7 degrees at angles where$ \sigma/\sigma_{\rm Ruth} = 0.5 $ . In other words, a precision of the angular distribution measurement of 0.1 degrees, which is feasible with modern techniques, allows to determine the RMS radius (of a nucleus like 10Be) with a precision of around 1.4%. Given that there are quite large uncertainties of RMS radius of light heavy ions (see, e.g., the compilation of RMS radii of light heavy ions in Ref. [49]), it might be interesting to measure the RMS radii of these nuclei in elastic scattering experiments. Of course, more effort needs to be made both at the experimental and theoretical level, to fully understand the precision of this method. Obviously, better statistics, which requires higher beam intensities and a high-performance detector arrays, would be needed.Table 2. The RMS radii of the proton, neutron and nuclear matter distributions used, in units of fm. The total reaction cross-sections and references are listed.
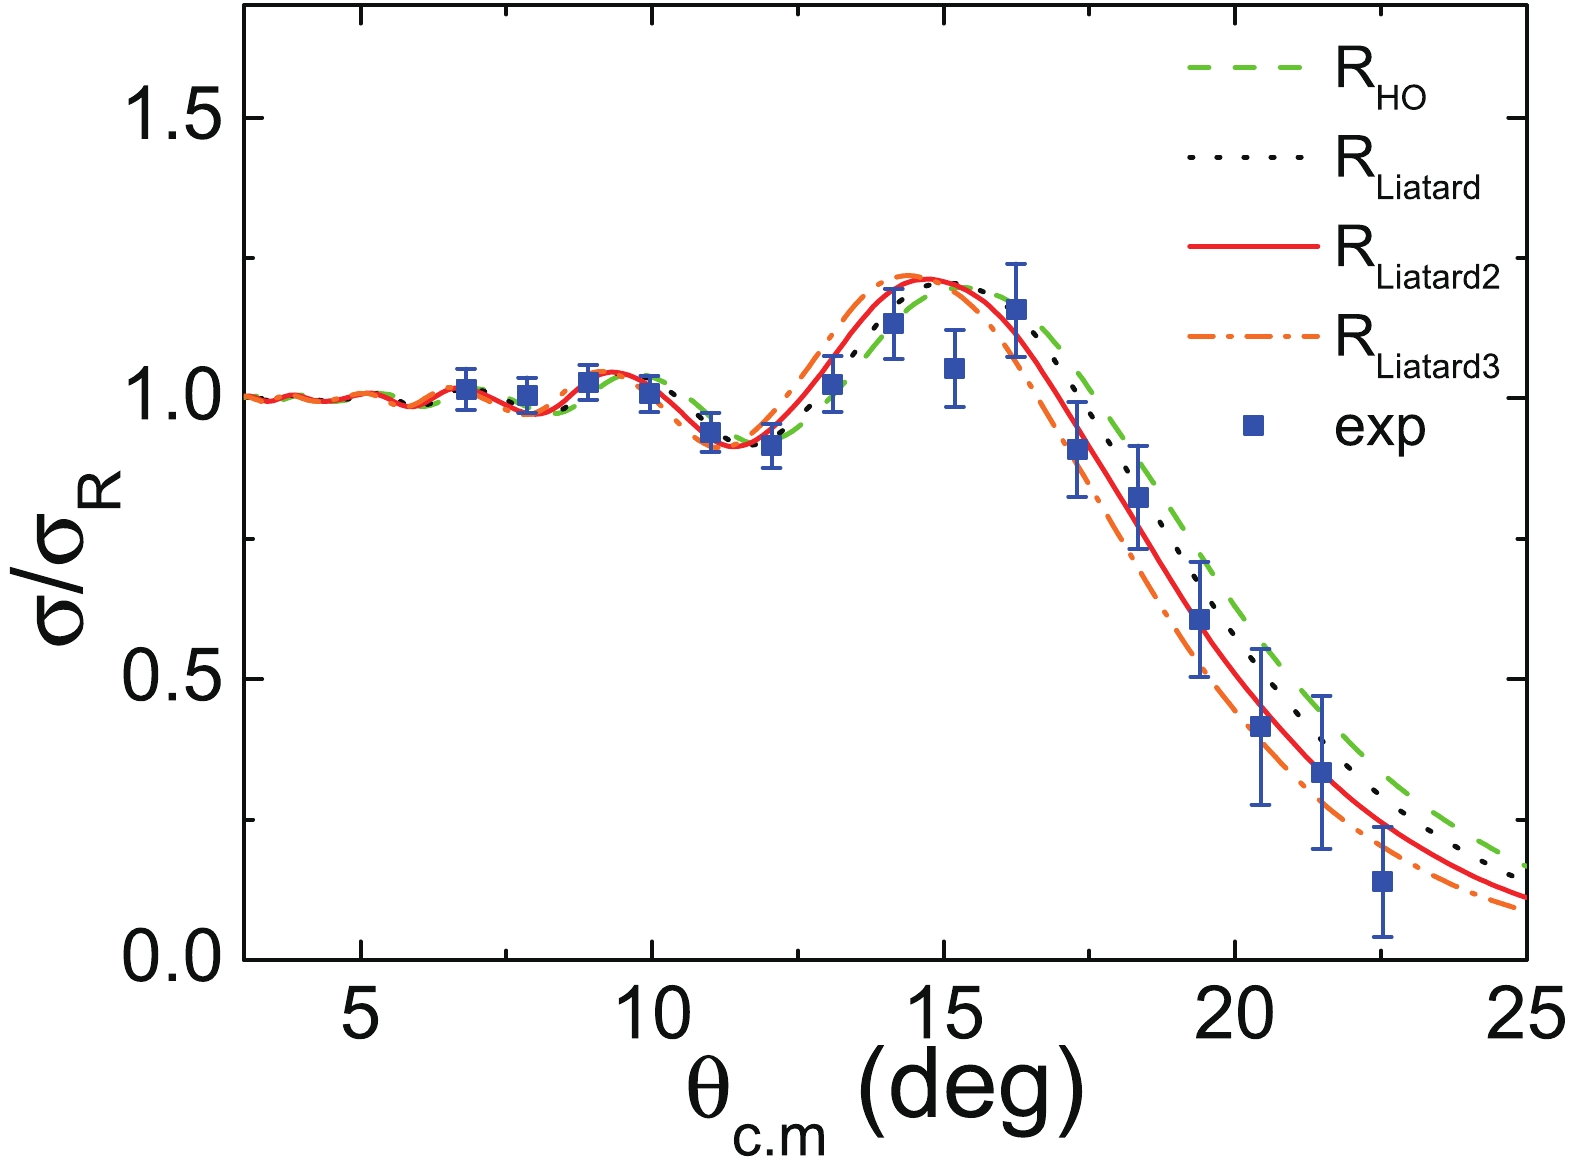
Figure 8. (color online) Comparison of the experimental data and the optical model calculations using nucleus-nucleus potentials with different density distributions for 10Be. The angular distribution in green dashed line was calculated with
$R_{\rm HO}$ [49]. The angular distribution in black dotted line, red solid line and orange dash-dotted line were calculated with density distributions$R_{\rm Liatard}$ [11],$R_{\rm Liatard2}$ and$R_{\rm Liatard3}$ , respectively.Comparison of the experimental data and the results of optical model calculations using the SPP and X&P potentials was also made for the 9Be + 208Pb system. The results are shown in Fig. 9. The Coulomb dominance is clearly seen in the range of scattering angles of our experiment. For this reason, a similar analysis as for 10Be was not made. For stable nuclei like 9Be, both SPP and X&P reproduce the elastic scattering data quite well.
-
Measurements of elastic scattering of 9Be and 10Be on 208Pb at energies above the Coulomb barrier were performed at HIRFL-RIBLL. The elastic scattering angular distributions for 9Be and 10Be were measured at ELab = 88 and 127 MeV, respectively. For the stable 9Be nucleus, the elastic scattering is a pure Rutherford scattering in the angular range measured, and was used for normalization of the 10Be + 208Pb data. The present data show that the detection system is a powerful equipment for performing elastic scattering measurements. The angular distribution of the 10Be + 208Pb system was analyzed with the optical model using the Woods-Saxon and the double-folding São Paulo potentials. The measured angular distribution is well described by these potentials. Optical model analysis using a global nucleus-nucleus potential, based on a single-folding potential, was also performed. In this analysis different density distributions were used showing that the angular distribution is sensitive to the choice of the radius of the projectile.
In conclusion, we performed measurements of elastic scattering of 10Be on a lead target at an energy above the Coulomb barrier. The obtained angular distribution shows a Fresnel peak. However, it would be desirable to have measurements at more backward angles, where higher sensitivity could be obtained for the choice of potential and for the influence of other mechanisms, such as coupling to excited states and direct reactions.
We would like to acknowledge the staff of HIRFL for the operation of the cyclotron and friendly collaboration.
Experimental study of the elastic scattering of 10Be on 208Pb at the energy of around three times the Coulomb barrier
- Received Date: 2019-09-03
- Available Online: 2020-02-01
Abstract: Elastic scattering of 10Be on a 208Pb target was measured at


 Abstract
 HTML
HTML Reference
 Related
 PDF
PDF




 DownLoad: