


 Abstract
 HTML
HTML Reference
 Related
 PDF
PDF


-
The cross sections of neutron induced reactions are quantitative attributes of nuclear processes that can reveal the features of excited atomic states (e.g., β-decay abundance, half-life-
${T} _{1/2}$ , and neutron emission probabilities) as well as provide information on different reaction mechanisms that are dependent on the incident neutron energy. Neutron activation is the most commonly used technique to quantify cross section; it measures the activity of characteristic γ-rays produced from the residues of neutron driven nuclear processes. The study of the neutron induced reaction cross sections in the energy range of approximately 14 MeV is critical for the advancement of fusion reactor technology in terms of activation, radiation damage, and the mechanical stability of the construction materials. The elements potassium and copper were chosen for this investigation because both are essential structural materials and are commonly employed in reactor construction. Furthermore, the sodium-potassium (NaK) alloy is used as a coolant in liquid metal fast reactors [1-3]. An inspection of the EXFOR database for neutron energies up to 14 MeV reveals that considerable data are missing in several energy ranges, and differences are found between various measurements of specific activation cross sections [4, 5]. Based on this, we intend to investigate these processes experimentally and theoretically at neutron energies up to 14 MeV. These differences in literature values could be attributed to one of two factors: The first involves differences in decay data (i.e., the choice of distinctive γ-rays), while the second involves the interference reaction processing method. For the generated nuclei, we addressed the above-mentioned aspect in this study using the most recent decay data and related decay laws to eliminate interference processes.In most studies of neutrino-less double-β-decay, natural copper is also used as a cooling and shielding medium [6-10]. Natural copper consists of 69.15 ± 0.15%
$ ^{63} {\rm{Cu}}$ and 30.85 ± 0.15%$ ^{65} {\rm{Cu}}$ . During the interaction between natural copper and 14.92 ± 0.02 MeV fast neutrons,$ ^{64} {\rm{Cu}}$ residue is produced with the emission of γ and 2n particles from the$ ^{63} {\rm{Cu}}$ (n,γ)$ ^{64} {\rm{Cu}}$ and$ ^{65} {\rm{Cu}}$ (n,2n)$ ^{64} {\rm{Cu}}$ reaction channels, respectively. Thus, the measured cross sections in this study include contributions from these two processes. There is no experimental cross section available for the latter reaction at the energy of interest; however, we theoretically estimated this cross section using TALYS-1.9 [11], obtaining a value of σ = 1.203 mb, which is three orders of magnitude smaller than the present reported value of 1030.82 mb for the$ ^{65} {\rm{Cu}}$ (n,2n)$ ^{64} {\rm{Cu}}$ reaction. Hence, the contribution from the$ ^{63} {\rm{Cu}}$ (n,γ)$ ^{64} {\rm{Cu}}$ reaction is considered negligible. This$ ^{64} {\rm{Cu}}$ residue nucleus is unstable and decays with a half-life (${{T}} _{1/2}$ ) of 12.701 ± 0.002 hr and a characteristic γ-ray energy (${E}_{\gamma}$ ) of 1345.77 keV to the stable nucleus$ ^{64} {\rm{Ni}}$ . In the$ ^{65} {\rm{Cu}}$ (n,α)$ ^{62m} {\rm{Co}}$ reaction, the residue product$ ^{62} {\rm{Co}}$ decays to the stable state of$ ^{62} {\rm{Ni}}$ with a half-life of 1.54 ± 0.01 min and produces a γ-ray of energy 1172.90 keV in between to form a metastable state, i.e.,$ ^{62m} {\rm{Co}}$ , which also produces 1172.90 and 1163.50 keV γ-rays [12]. Therefore, to eliminate the contribution of$ ^{62} {\rm{Co}}$ , we allowed a cooling time of up to a$10^{\rm th}$ of the half-life of$ ^{62} {\rm{Co}}$ and used a 1163.50 keV γ-ray to produce a precise cross section without the contribution of γ-ray activity from other channels.Natural potassium consists of 93.2581 ± 0.0044%
$ ^{39} {\rm{K}}$ and 6.7302 ± 0.0044%$ ^{41} {\rm{K}}$ . During the interaction between natural potassium and 14.92 MeV fast neutrons,$ ^{38} {\rm{Cl}}$ residue is produced from the$ ^{41} {\rm{K}}$ (n,α) reaction. This$ ^{38} {\rm{Cl}}$ residue nucleus is unstable and decays with a half-life (${{T}}_{1/2}$ ) of 37.230 ± 0.014 min and characteristic γ-ray energies (${E}_{\gamma}$ ) of 1642.68 and 2167.40 keV to the stable nucleus$ ^{38} {\rm{Ar}}$ . In the present case, the 1642.68 keV γ-ray was used to calculate the$ ^{41} {\rm{K}}$ (n,α) reaction cross section. The$ ^{27} {\rm{Al}}$ (n,α)$ ^{24} {\rm{Na}}$ reaction, which is the standard reference reaction for the current fast neutron energy range, was used to normalize the neutron flux. The$ ^{27} {\rm{Al}}$ (n,α) reaction produces the radioactive product$ ^{24} {\rm{Na}}$ , which is unstable and decays with a half-life (${T}_{1/2}$ ) of 14.999 ± 0.014 hr and characteristic γ-ray energies (${E}_{\gamma}$ ) of 1368.62 and 2754.00 keV to the stable nucleus$ ^{24} {\rm{Mg}}$ . The cross section for the reference reaction is retrieved from the IRDFF-1.05 library [13], and the reactions cross section is measured with detailed uncertainty quantification. The covariance analysis was used to estimate the total uncertainty in a particular reaction cross section and propagate the correlation matrix between different reaction cross sections [14, 15].These cross sectional data with detailed uncertainty quantification and a correlation matrix obtained from the experiment will be used by evaluators to optimize the experimentally measured data with model predictions. These evaluated results shall be added to computer modelling software, such as MCNP, which is used by engineers to simulate and design reactors. Besides the basic cross sectional information used to build a complete nuclear database, a detailed study of cross sections and their energy dependence would enable us to examine the sensitivity of the results to different parameter sets in the fast neutron energy range. Moreover, we used the TALYS-1.9 and EMPIRE-3.2 codes to perform the nuclear model calculations for all three reactions [11, 16], which are based on the Hauser-Feshbach (HFB) statistical model formalism [17] with distinct sets of input level density parameters and nuclear models to reproduce the measured cross section.
-
We used a square shaped thin grade-1 copper metal sheet with a dimension of 1.0×1.0 cm2 and thickness of 0.0125 cm wrapped in an aluminum foil for irradiation purposes. This aluminum foil was used as a relative sample to normalize the neutron flux with the IRDFF-1.05 library's known cross section value for the
$ ^{27} {\rm{Al}}$ (n,α)$ ^{24} {\rm{Na}}$ reaction. A pure$ {\rm{K}}_{2} {\rm{SO}}_{4} $ powder was taken as a sample for potassium irradiation; this circular potassium sample has a diameter of 1 cm and thickness of 0.2 cm. Further details on the samples acquired for this investigation are summarized in Table 1.Isotope Isotope abundance (%) Isotope weight in the sample/mg Thickness/cm density/(g/cm3) Number of target atoms/( $10^{-4}$ atoms/b)

$^{41}{\rm{K}}$ 

6.7302 ± 0.0044 370.5 ± 0.1 0.2 2.66 1.612 $^{65}{\rm{Cu}}$ 

30.85 ± 0.15 116.5 ± 0.1 0.0125 8.96 3.330 $^{27}{\rm{Al}}$ 

100 22.5 ± 0.1 0.0025 2.70 5.019 Table 1. Sample details for this investigation.
-
Neutron irradiation in this experiment was performed at the Bhabha Atomic Research Center (BARC)'s PURNIMA neutron generator facility in Mumbai [18]. The t(d,n)α fusion process was used to create neutrons during which d+ ions with an energy of 140 ± 5 keV and a current of 60 µA were accelerated onto a Ti-t (Titanium-tritide) target to create neutrons in the advancing direction with a flux value of 9.42×10⁷ n/cm2/s on the aluminum sample. The position order of the samples during the experiment was Al-Cu-K. The samples of aluminum and potassium were positioned at zero degrees with respect to the deuteron beam at distances of 1.1 cm and 1.2 cm from the neutron target, respectively. The aluminum used was square shaped, while the potassium was in the shape of a circular pellet. A GEANT4 simulation was performed to estimate the variation in neutron flux for both samples owing to the difference in their shape and distance with respect to neutron target [19]. The simulation was performed incorporating the deuteron beam energy, deuteron beam profile and emittance, tritium profile of the Ti-t target, and the solid angle between the neutron target and the sample. The neutron flux observed on the potassium sample was 82.13% of the neutron flux observed on the aluminum sample, as calculated by GEANT4. The energy of the neutrons and the associated uncertainty were calculated using two-body kinematics described in [20].
-
The irradiated samples were removed from the irradiation room and placed in the counting room for further cooling. Then, the samples were pasted on a perplex plate and taken to the gamma counting room to measure for induced activity. The irradiation time (
$t_{\rm ir}$ ) was set in such a way that it covered the time until the induced activity reached the saturation state as different reactions in this study have different half-lives. Similarly, the irradiated samples were counted by providing the appropriate cooling time ($t_{\rm co}$ ) before measuring the counts; this ensures that the short half life γ-rays disintegrate and do not contribute to the primary characteristic γ-rays used for the cross section estimation. The timing factor parameters ($t_{\rm ir}$ ,$t_{\rm co}$ ) of this experiment with the measured counting time ($t_{\rm ms}$ ) factor are listed in Table 2. A lead-shielded 185-cc HPGe detector system was used to detect the induced activity counts.Reaction $t_{\rm ir}/{\rm s}$ 

$t_{\rm co}/{\rm s}$ 

$t_{\rm ms}/{\rm s}$ 

$^{65}{\rm{Cu}}$ (n,α)

$^{62m}{\rm{Co}}$ 

8525 1468 250 $^{41}{\rm{K}}$ (n,α)

$^{38}{\rm{Cl}}$ 

8525 2208 356 $^{65}{\rm{Cu}}$ (n,2n)

$^{64}{\rm{Cu}}$ 

8525 6620 693 $^{27}{\rm{Al}}$ (n,α)

$^{24}{\rm{Na}}$ 

8525 11268 2030 Table 2. Timing factor parameters of this experiment.
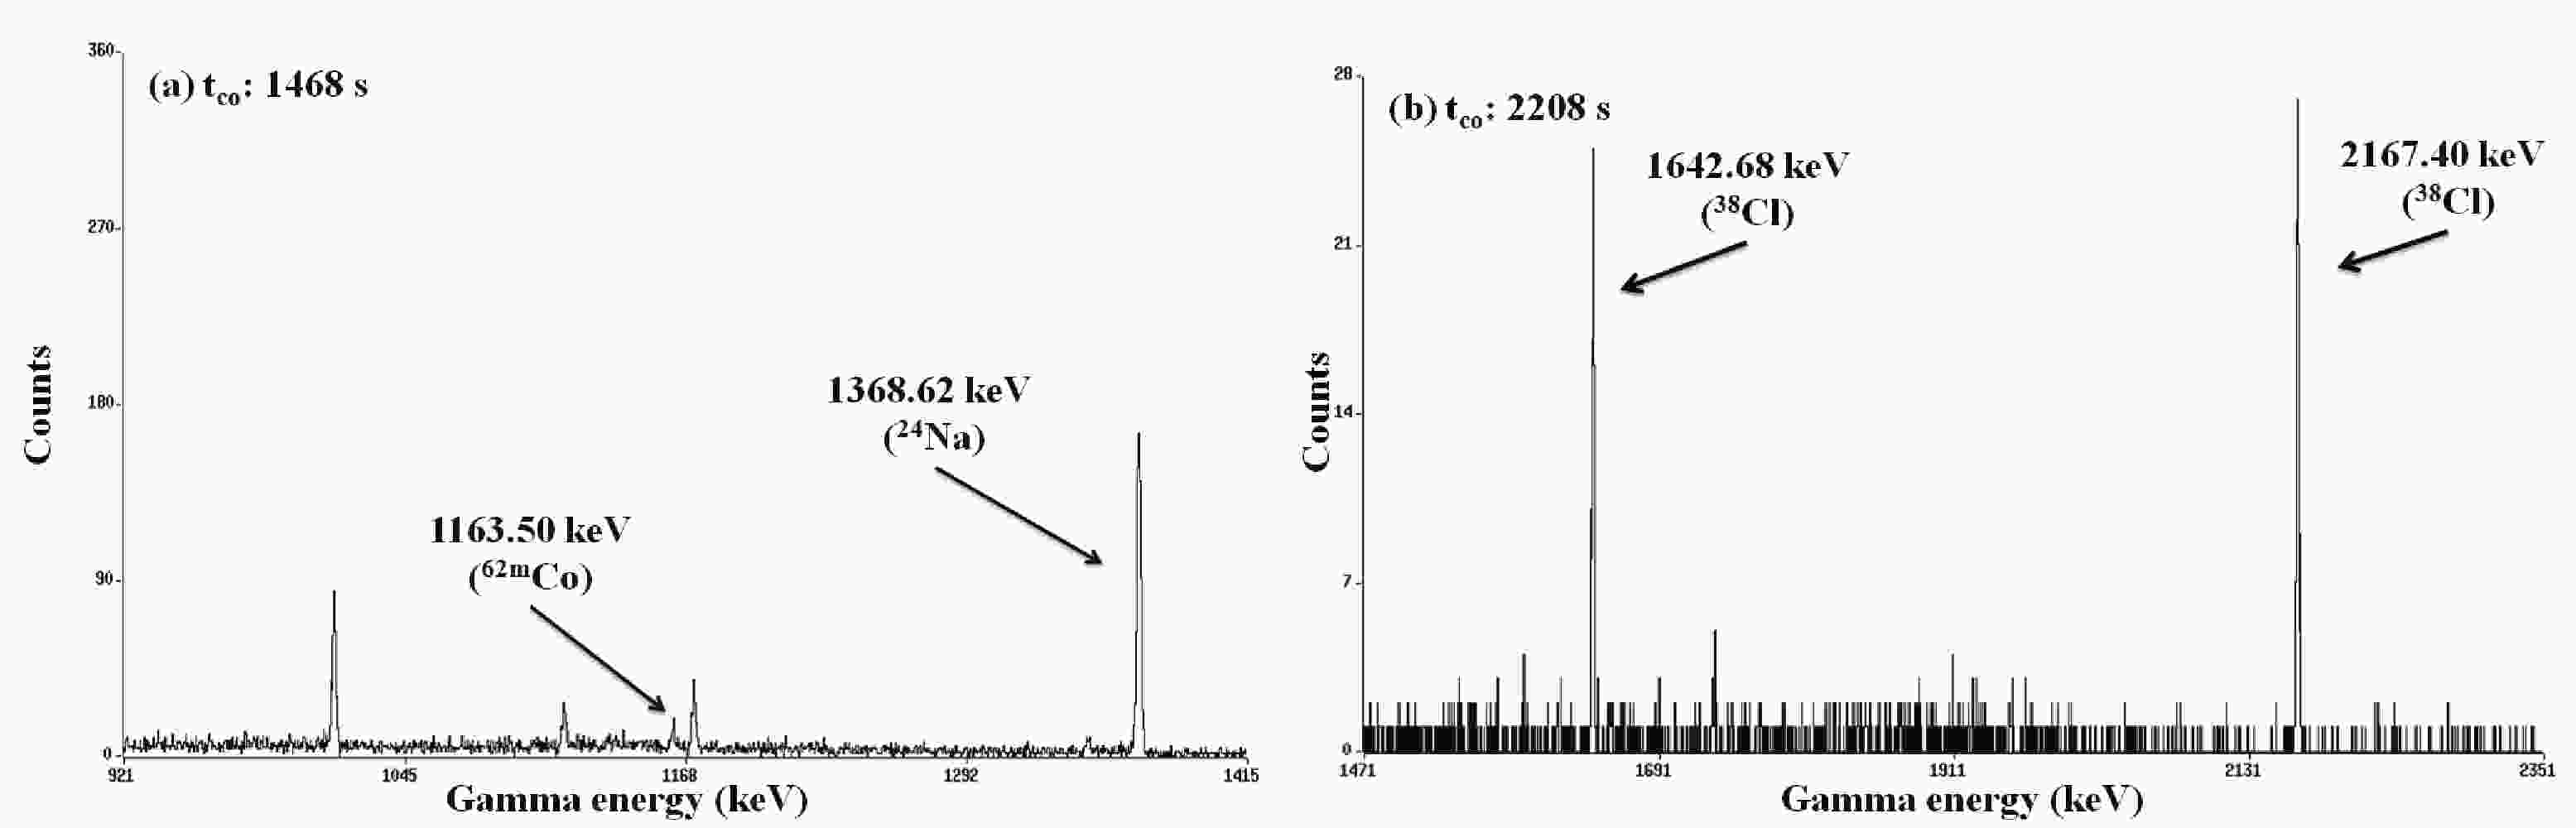
The CAMAC based multi-parameter data acquisition and data analysis programme LAMPS [21] was used for data acquisition, with a low detector dead time. Table 3 contains information on the decay data (retrieved from the ENSDF library) required for data analysis [22]. The characteristic γ-ray produced from the residues of the reactions with a high gamma-ray intensity was used to calculate the neutron activation cross section. The obtained γ-ray spectra from the HPGe detector for all the given reactions are presented in Figs. 1-2. The γ peak counts for
$ ^{41} {\rm{K}}$ (n,α),$ ^{65} {\rm{Cu}}$ (n,α), and$ ^{65} {\rm{Cu}}$ (n,2n) are 130 ± 11.401 (1642.68 keV), 53 ± 7.280 (1163.50 keV), and 98 ± 9.899 (1345.77 keV), respectively. The statistics associated with the cross section of the$ ^{65} {\rm{Cu}}$ (n,2n) reaction may be improved by increasing the counting period. Detailed information related to the calibration and efficiency calculation of the HPGe detector, including its uncertainty quantification and coincidence summimg-effect, is explained in our previous study [23]. The parameters and their correlation coefficients, as given in Section II.(C) of [23], were used for the detector efficiency calculations in the current study. Table 4 summarizes the obtained efficiency value, its uncertainty, and its correlation matrix. This correlation matrix will be used to calculate the total uncertainty in the observed cross section and the correlation matrix between various reaction cross sections.Reaction Residue product Half-life ( $t_{1/2}$ )

$E_{\gamma}$ /keV

$I_{\gamma}$ (%)

Reference $^{65}{\rm{Cu}}$ (n,α)

$^{62m}{\rm{Co}}$ 

13.86 ± 0.09 min 1163.50 70.5 ± 1.4 [24] $^{41}{\rm{K}}$ (n,α)

$^{38}{\rm{Cl}}$ 

37.230 ± 0.014 min 1642.68 32.9 ± 0.5 [25] $^{65}{\rm{Cu}}$ (n,2n)

$^{64}{\rm{Cu}}$ 

12.701 ± 0.002 hr 1345.77 0.475 ± 0.011 [26] $^{27}{\rm{Al}}$ (n,α)

$^{24}{\rm{Na}}$ 

14.997 ± 0.012 hr 1368.62 99.9936 ± 0.0015 [27] Table 3. Decay data with associated uncertainties used for the samples and reference reactions.

Figure 1. Gamma-ray spectra from the HPGe detector with a cooling period of (a) 1468 s & (b) 2208 s.
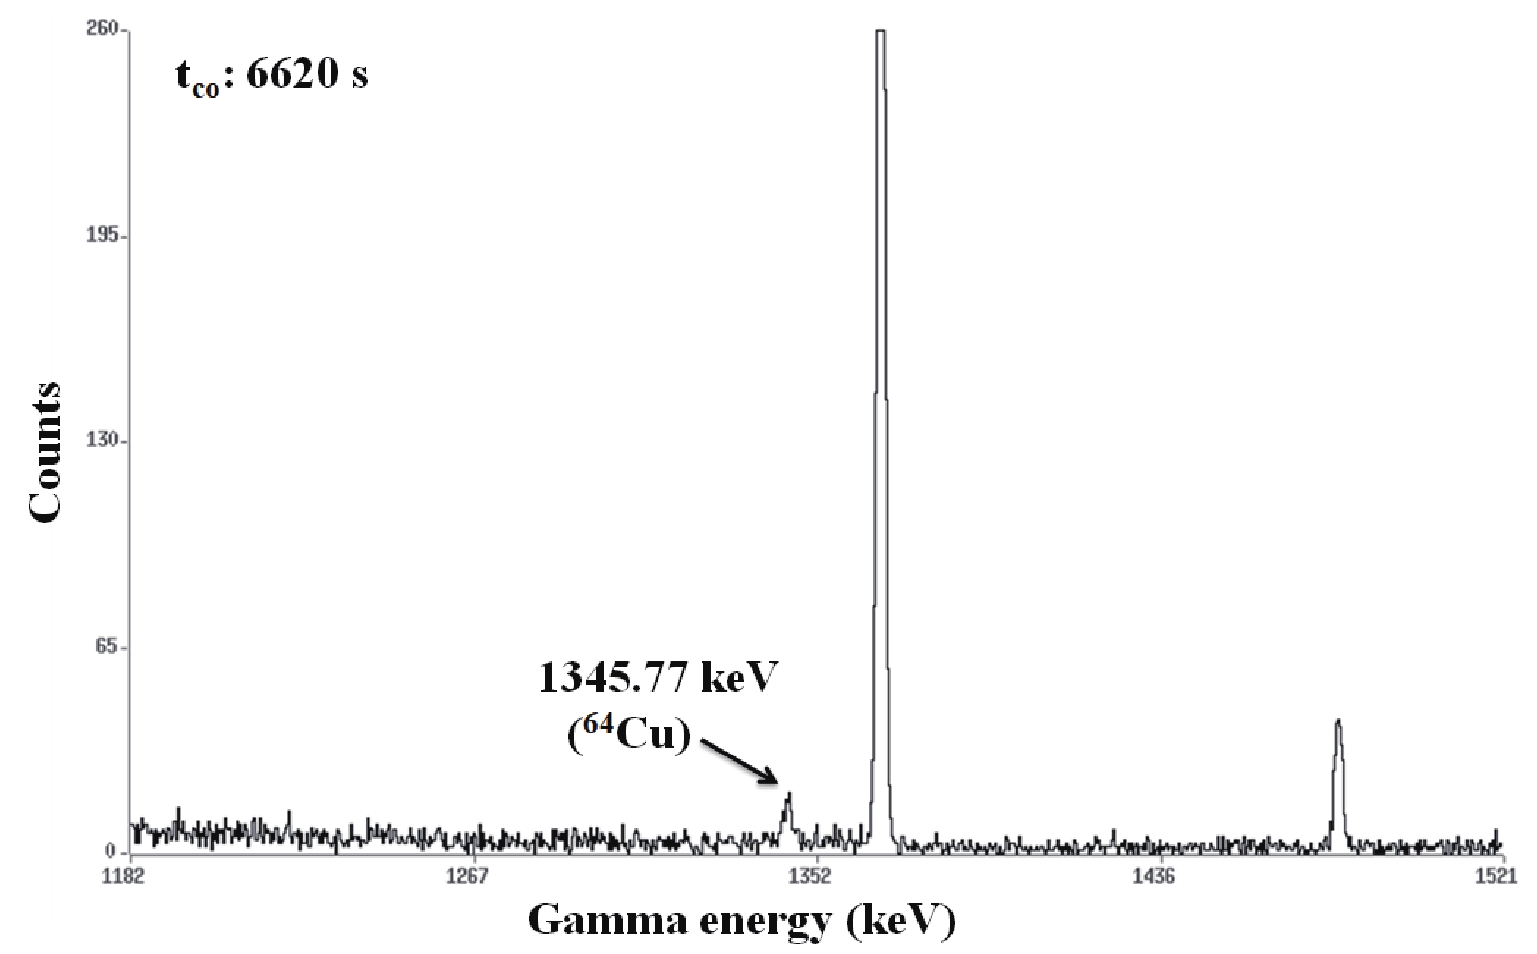
Figure 2. Gamma-ray spectra from the HPGe detector with a cooling period of 6620 s.
Reaction $E_{\gamma}$ /keV

Efficiency Correlation matrix $^{65}{\rm{Cu}}$ (n,α)

$^{62m}{\rm{Co}}$ 

1163.50 0.00897 ± 0.00023 1.0000 $^{41}{\rm{K}}$ (n,α)

$^{38}{\rm{Cl}}$ 

1642.68 0.00810 ± 0.00032 0.9125 1.0000 $^{65}{\rm{Cu}}$ (n,2n)

$^{64}{\rm{Cu}}$ 

1345.77 0.00846 ± 0.00027 0.9679 0.9860 1.0000 $^{27}{\rm{Al}}$ (n,α)

$^{24}{\rm{Na}}$ 

1368.62 0.00842 ± 0.00028 0.9626 0.9892 0.9997 1.0000 Table 4. Interpolated efficiency of the HPGe detector for the corresponding γ-ray energy of the samples, the reference reactions, and their correlation matrix.
-
Using the following neutron activation formula, the neutron induced cross section (
$ \sigma_{s} $ ) for the$ ^{65} {\rm{Cu}}$ (n,α), (n,2n) and$ ^{41} {\rm{K}}$ (n,α) reactions were measured with reference to the$ ^{27} {\rm{Al}}$ (n,α) reaction cross section ($ \sigma_{Al} $ ):$ \small\sigma_{s} = \sigma_{\rm Al} \times \left[\frac{A_{s} \varepsilon_{\rm Al}I_{\rm Al}}{A_{\rm Al} \varepsilon_{s}I_{s}}\right] \times \left[\frac{\lambda_{s}f_{\rm Al}}{\lambda_{\rm Al}f_{s}}\right] \times \left[\frac{a_{\rm Al}N_{\rm Al}}{a_{s}N_{s}}\right] \times \frac{C_{{\rm self}(s)}}{C_{\rm self(Al)}}, $

(1) where
$\sigma_{\rm Al}$ is the reference cross section, ($A_{s,\rm Al}$ ,$I_{s,\rm Al}$ &$\varepsilon_{s,\rm Al}$ ) are the experimentally generated parameters defined as the photo-peak counts of the residues' characteristics γ-rays, γ-ray intensity, and measured HPGe detector efficiency value for the sample and reference reactions, respectively. ($\lambda_{s,\rm Al}$ ,$f_{s,\rm Al}$ ) are the timing factor parameters, where the timing factor ($f_{s,\rm Al}$ ) for the sample and reference reactions was calculated using the following equation:$ \small f_{s,\rm Al} = (1-{\rm e}^{-{\lambda}t_{\rm ir}}) \times ({{\rm e}^{-{\lambda}t_{\rm co}}}) \times (1-{\rm e}^{-{\lambda}t_{\rm ms}}), $

(2) where
$\lambda_{s,\rm Al}$ is the decay constant of the sample and reference reactions, respectively, and symbols$t_{\rm ir}$ ,$t_{\rm co}$ , and$t_{\rm ms}$ denote the timing parameters of this experiment, as described in subsection II.C and listed in Table 2. The samples parameters ($a _{s,\rm Al}$ ,$N _{s,\rm Al}$ ) define the isotopic abundance and number of atoms of a specific isotope in a specific sample, and${{C}}_{\rm self}$ denotes the self-attenuation factor. The IRDFF library's interpolated neutron reference cross section value for the$ ^{27} {\rm{Al}}$ (n,α) reaction at 14.92 ± 0.02 MeV is 0.1092 ± 0.000398 barns. The estimated neutron flux from the given IRDFF reference cross section and γ-ray activity of the$ ^{24} {\rm{Na}}$ residue product is 9.42×10⁷ n/cm2/s, which is corrected through the γ-ray self attenuation process. The subsequent section provides further information on the correction factor for the self attenuation of γ-rays. -
To determine the self-absorption correction factor of the γ-ray interaction within a sample with a thickness (r), the following equation, proposed by [28], was used:
$ C_{\rm self} = \frac{\mu_{m}\rho r}{1-\exp(-\mu_{m}\rho r)}, $

(3) where
$ \mu_{m} $ and ρ are the mass attenuation coefficient and sample density, respectively, retrieved from the XMuDat ver. 1.01 [29] programme. The thickness and density of the sample are given in Table 1. Table 5 provides details regarding the γ-ray self attenuation factor for each given sample.Sample ${\rm{E}}_{\gamma}$ /keV

${{C} }_{\rm self}$ 

Cu 1163.50 1.0030 ± 0.00015 1345.77 1.0028 ± 0.00014 ${\rm{K}}_{2}{\rm{SO}}_{4}$ 

1642.68 1.013 ± 0.0014 Al 1368.62 1.0002 ± 0.00001 Table 5. Self attenuation correction factor for γ-ray interactions within each sample.
-
The essential factors involved in the determination of cross sections are the γ-ray photo-peak counts (
$A _{s,\rm Al}$ ), γ-ray intensity ($I _{s,\rm Al}$ ), efficiency ($\varepsilon_{s,\rm Al}$ ), timing factor ($f _{s,\rm Al}$ ), isotopic abundance ($a _{s,\rm Al}$ ) (the fractional uncertainty in the isotopic abundance ($a _{\rm Al}$ ) of$ ^{27} {\rm{Al}}$ was not considered because this element is mono-isotopic with 100% isotopic abundance), number of target atoms ($N _{s,\rm Al}$ ), and reference cross section ($\sigma_{\rm Al}$ ). The fractional uncertainty (%) from all of these variables was used to transmit the overall uncertainty in the measured reaction cross section. The timing factor ($f _{s,\rm Al}$ ) fractional uncertainty was calculated using the method described in Sec. 4.1.3 of Ref. [30]. In the calculation of the timing factor, we considered the uncertainty in the residues' decay constants because the uncertainties in the$t_{\rm ir}$ ,$t_{\rm co}$ , and$t_{\rm ms}$ timings were negligible. Table 6 highlights the fractional uncertainties in various variables contributing to the measured reaction cross section, which will be used to propagate the covariance matrix between the distinct reaction cross sections. All the irradiated samples were measured with the same detection system and used the same relative reaction cross section. Hence, the detector efficiency and reference cross section accuracy is the same for all three reactions, which shows that the reaction cross sections are correlated with each other. Therefore, once the fractional uncertainties were calculated, the next part of the covariance analysis was to generate the correlation coefficients between each of the attributes associated with the different reactions. The value of the coefficients lies between$ - 1 \leqslant {\rm{Cor}}( \bigtriangleup{x} , \bigtriangleup{x} ) \leqslant + 1$ . The correlation coefficients between the attributes linked to the various reactions are summarized in Table 7, where i, j, and k indicate$ ^{65} {\rm{Cu}}$ (n,α)$ ^{62m} {\rm{Co}}$ ,$ ^{41} {\rm{K}}$ (n,α)$ ^{38} {\rm{Cl}}$ , and$ ^{65} {\rm{Cu}}$ (n,2n)$ ^{64} {\rm{Cu}}$ , respectively. We propagated the total uncertainty and the covariance matrix between two reactions, e.g., ($ \sigma_{s_i},\sigma_{s_j} $ ), from the values given in Tables 6−7 by summing the matrices of 12 subsets (attributes) using the following equation:attributes
(x)fractional uncertainties (%) $^{65}{\rm{Cu}}$ (n,α)

$^{62m}{\rm{Co}}$ 

($\bigtriangleup{x_i}$ )

$^{41}{\rm{K}}$ (n,α)

$^{38}{\rm{Cl}}$ 

($\bigtriangleup{x_j}$ )

$^{65}{\rm{Cu}}$ (n,2n)

$^{64}{\rm{Cu}}$ 

($\bigtriangleup{x_k}$ )

$A_{s}$ 

13.7361 8.7706 10.1015 $A_{\rm Al}$ 

1.1311 1.1311 1.1311 $I_{s}$ 

1.9858 1.5197 2.3157 $I_{\rm Al}$ 

0.0015 0.0015 0.0015 $N_{s}$ 

0.0858 0.0270 0.0858 $N_{\rm Al}$ 

0.4444 0.4444 0.4444 $a_{s}$ 

0.4862 0.0653 0.4862 $\varepsilon_{s}$ 

2.5641 3.9506 3.1914 $\varepsilon_{\rm Al}$ 

3.3254 3.3254 3.3254 $f_{s}$ 

0.2526 0.0134 0.0004 $f_{\rm Al}$ 

0.0054 0.0054 0.0054 $\sigma_{\rm Al}$ 

0.3644 0.3644 0.3644 $C_{\rm self}$ 

0.0152 0.0142 0.1390 Table 6. The fractional uncertainties (%) of the different attributes related to the reaction cross sections measured in this study.
Correlation coefficient ( $\bigtriangleup{x}$ ,

$\bigtriangleup{x}$ )

$A_{s}$ 

$A_{\rm Al}$ 

$I_{s}$ 

$I_{\rm Al}$ 

$N_{s}$ 

$N_{\rm Al}$ 

$a_{s}$ 

$\varepsilon_{s}$ 

$\varepsilon_{\rm Al}$ 

$f_{s}$ 

$f_{\rm Al}$ 

$\sigma_{\rm Al}$ 

$C_{\rm self}$ 

Cor( $\bigtriangleup{x_i}$ ,

$\bigtriangleup{x_i}$ )

1 1 1 1 1 1 1 1 1 1 1 1 1 Cor( $\bigtriangleup{x_i}$ ,

$\bigtriangleup{x_j}$ )

0 1 0 1 0 1 0 0.9125 1 0 1 1 0 Cor( $\bigtriangleup{x_i}$ ,

$\bigtriangleup{x_k}$ )

0 1 0 1 1 1 1 0.9679 1 0 1 1 0 Cor( $\bigtriangleup{x_j}$ ,

$\bigtriangleup{x_j}$ )

1 1 1 1 1 1 1 1 1 1 1 1 1 Cor( $\bigtriangleup{x_j}$ ,

$\bigtriangleup{x_k}$ )

0 1 0 1 0 1 0 0.9860 1 0 1 1 0 Cor( $\bigtriangleup{x_k}$ ,

$\bigtriangleup{x_k}$ )

1 1 1 1 1 1 1 1 1 1 1 1 1 Table 7. Correlation coefficient between attributes related to the different reactions cross sections determined at a neutron energy of 14.92 ± 0.02 MeV.
$ {\rm Cov}(\sigma_{s_i},\sigma_{s_j}) = \mathop \sum \limits_i \mathop \sum \limits_j \bigtriangleup{x_i}\times {\rm Cor}(\bigtriangleup{x_i},\bigtriangleup{x_j}) \times \bigtriangleup{x_j} . $

(4) From the above equation, we generated a [3×3] covariance matrix. Then, the total uncertainty in the measured cross section was obtained using the following formula:
$ (\bigtriangleup\sigma_{s_i})^{2} = {\rm Cov}(\sigma_{s_i},\sigma_{s_i}) . $

(5) We used the equation below to propagate the correlation matrix [3×3] between the reaction cross sections from the total uncertainty and covariance matrix.
$ {\rm Cor}(\sigma_{s_i},\sigma_{s_j}) = \frac{{\rm Cov}(\sigma_{s_i},\sigma_{s_j})}{(\bigtriangleup\sigma_{s_i})^{2} \times (\bigtriangleup\sigma_{s_j})^{2}} . $

(6) A similar procedure was used in literature [23, 30-32]. Table 8 lists the measured reaction cross sections, their total uncertainties, and their correlation matrix.
Reaction Present data [ $\sigma_{s}$ ]

$\Delta\sigma_{s}$ (%)

Correlation matrix $^{65}{\rm{Cu}}$ (n,α)

$^{62m}{\rm{Cu}}$ 

0.00404 ± 0.00059 14.57 1.0000 $^{41}{\rm{K}}$ (n,α)

$^{38}{\rm{Cl}}$ 

0.02509 ± 0.00260 10.37 0.1451 1.0000 $^{65}{\rm{Cu}}$ (n,2n)

$^{64}{\rm{Cu}}$ 

1.03082 ± 0.11776 11.42 0.1237 0.2119 1.0000 Table 8. Experimentally determined reaction cross sections (in barns) with their total uncertainty value and correlation matrix at a neutron energy of 14.92 ± 0.02 MeV.
-
The simulation codes TALYS-1.9 and EMPIRE-3.2 [11, 16] were used to make nuclear model predictions for the current reaction cross sections. To predict the cross section as a function of the energy of the impacting particle, these programs consider the effects of level density parameters and diverse reaction processes (such as a compound nucleus, preequilibrium or direct reaction) [33, 34]. We utilized the code-specified default sets of input parameters for the various nuclear models while performing the calculations. The input parameters that duplicate the results that are in good agreement with the current measured cross sections and cross sectional data from literature are discussed. The nuclear model's projected findings were compared to the nuclear data from JEFF-3.1/A, TENDL-2019, JENDL-4.0, and ENDF/B-VIII.0 [35-38].
We utilized the default “best y” parameters in the TALYS-1.9 nuclear model code to duplicate the measured cross section of all three reactions. The TALYS code proposes this “best y” option, which the user can call the “best y” parameter in the input file. The set of parameters for the best results, such as optical model potentials, level densities, and other characteristics defined for the “best y” parameters can be accessed from the source library of the TALYS code.
We employed the microscopic level density parameters suggested by Hauser-Feshbach, which are used in compound nuclear reaction calculations, for the EMPIRE-3.2 nuclear model calculation to duplicate the obtained cross sections. We used the GSTRFN-1 (MLO1 modified Lorentzian version 1) γ-ray strength function proposed by Plujko [39] for the γ-ray transmission coefficient, which is the EMPIRE code's default model.
-
Table 8 presents the obtained cross sections of the
$ ^{65} {\rm{Cu}}$ (n,α),$ ^{41} {\rm{K}}$ (n,α), and$ ^{65} {\rm{Cu}}$ (n,2n) reactions, measured at an incident energy of 14.92 ± 0.02 MeV, with their total uncertainties and correlation matrix. Plots were also constructed to compare the current results with literature data, nuclear model estimated results, and JEFF-3.1/A, TENDL-2019, JENDL-4.0, and ENDF/B-VIII.0 evaluated nuclear data, as shown in Figs. 3−4. The red square represents the current experimentally measured cross section, while the supplementary symbols shown in Figs. 3−4 reflect data from the EXFOR database. The red and black solid lines represent the theoretically projected curves of TALYS-1.9 and EMPIRE-3.2, respectively. The data from JEFF-3.1/A, TENDL-2019, JENDL-4.0, and ENDF/B-VIII.0 are represented by different colors and symbols, as shown in Figs. 3−4.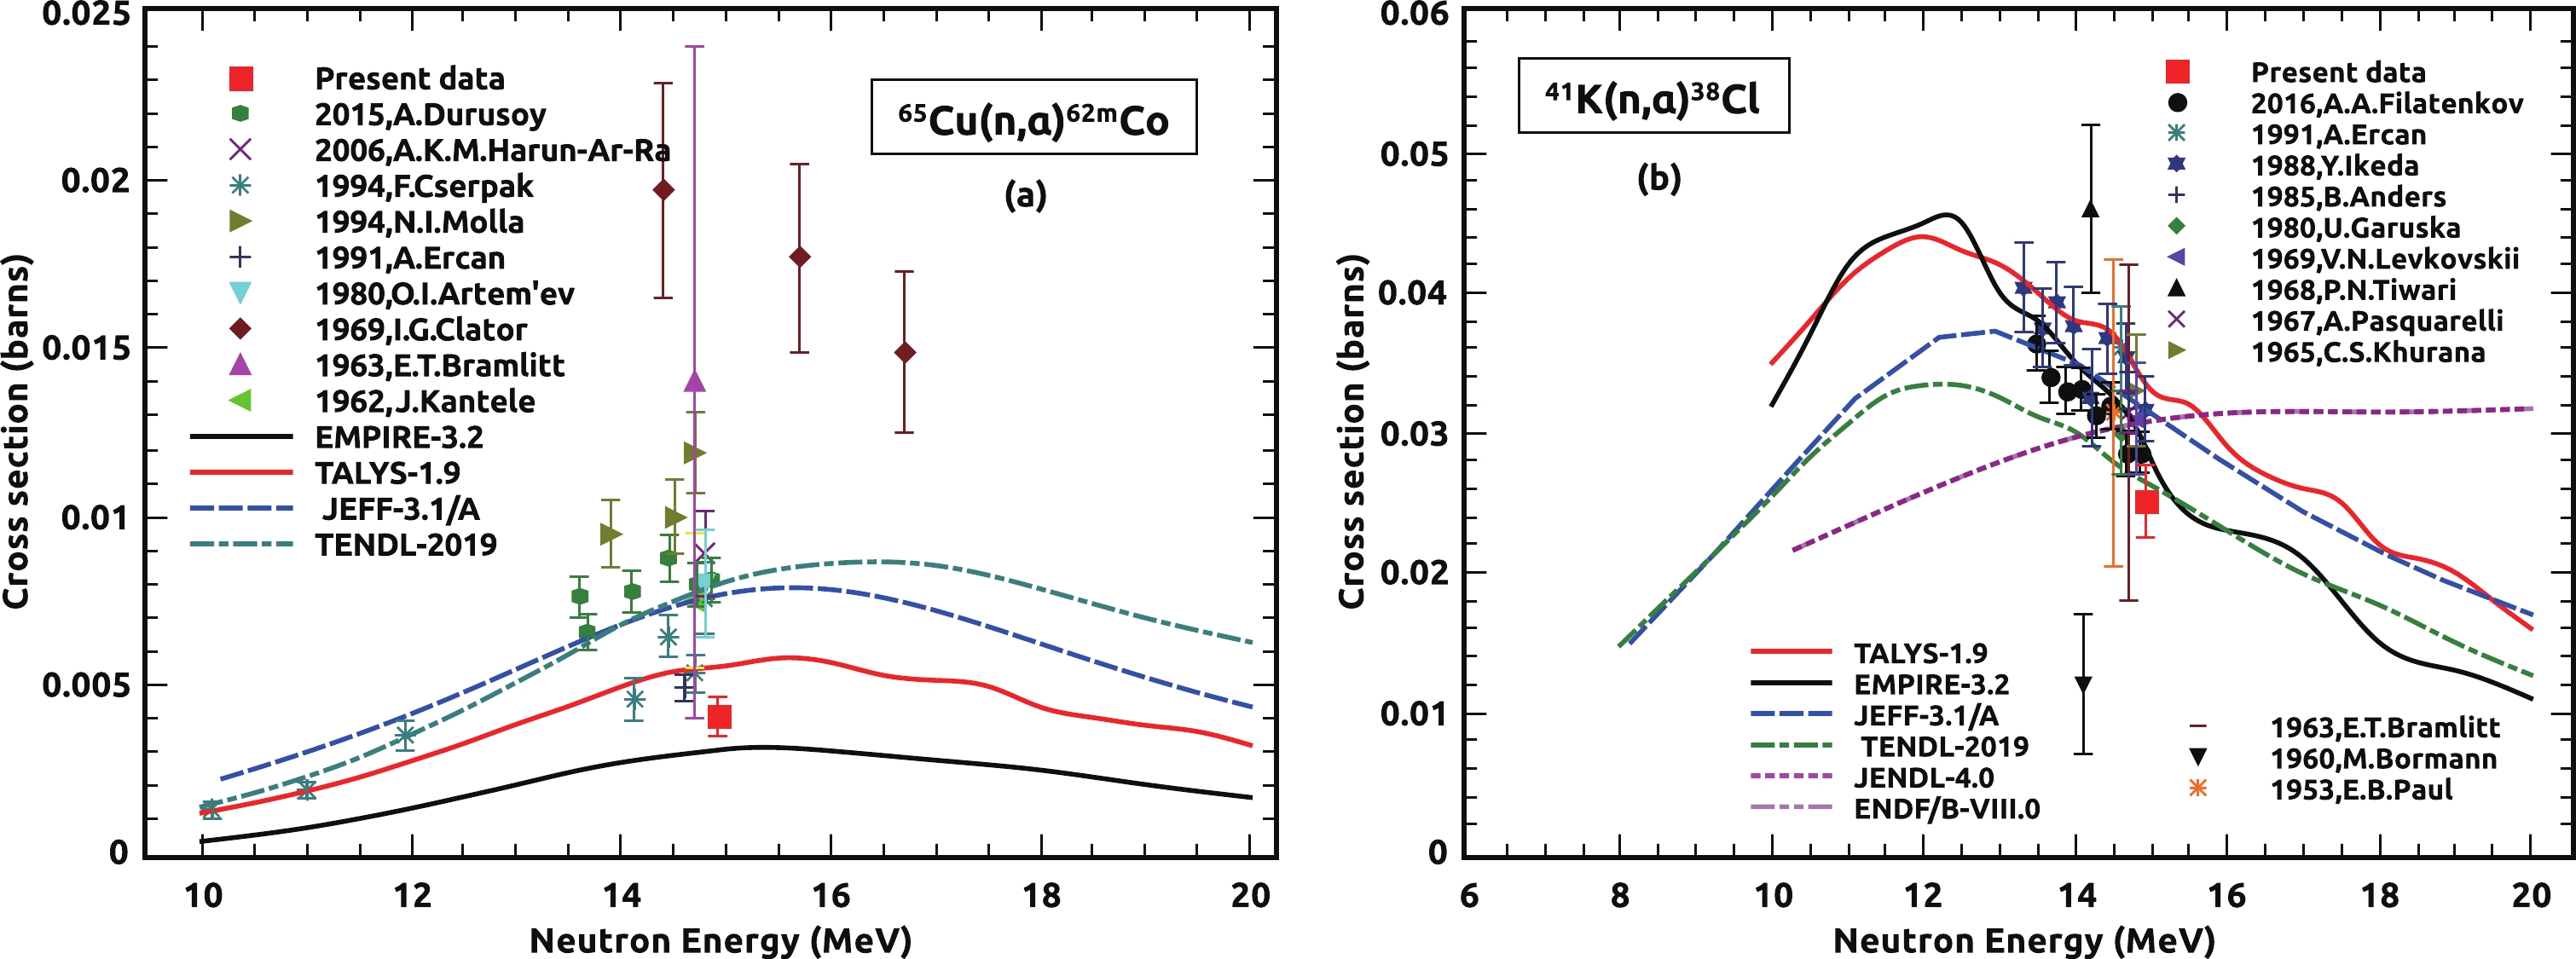
Figure 3. (color online) Comparison of the experiment result of the (n,α) reaction cross section from (a).
$^{65}{\rm{Cu}}$ and (b).$^{41}{\rm{K}}$ isotopes with the literature data, theoretically predicted results, and evaluated nuclear data.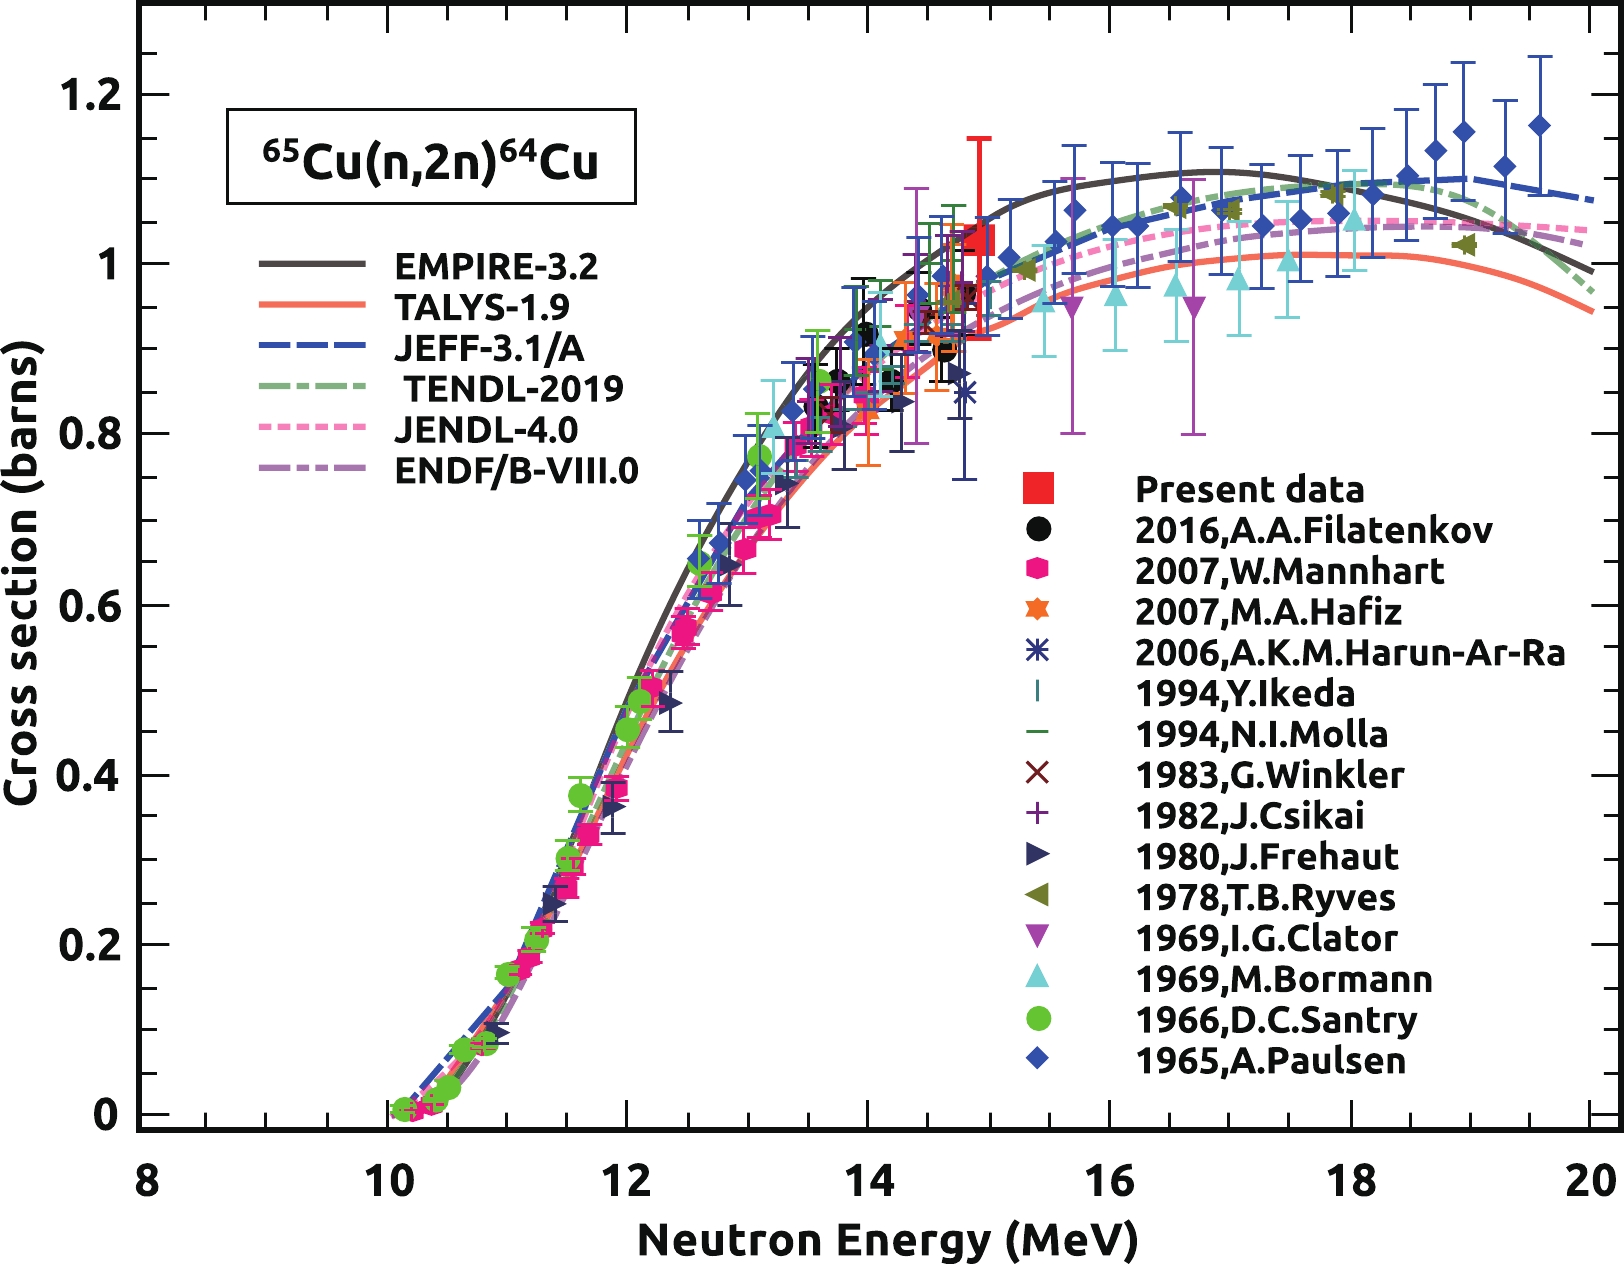
Figure 4. (color online) Comparison of the experiment result of the
$ ^{65} {\rm{Cu}}$ (n,2n)$ ^{64} {\rm{Cu}}$ reaction with the literature data, theoretically predicted results, and evaluated nuclear data. -
The current measured cross section value for the
$ ^{65} {\rm{Cu}}$ (n,α)$ ^{62m} {\rm{Co}}$ reaction is shown in Fig. 3(a) along with the estimated excitation function from the nuclear model, previously observed cross sections, and the evaluated data. The cross sectional data for energies of approximately 14 MeV published by different authors have variations in their cross sectional magnitude, as seen in Fig. 3(a). This mismatch can be recognized from the perspective of the cross section calculation, which indicates the use of alternative decay data attributes or the contribution of another reaction channel. Both difficulties were addressed in the current cross section quantification by using the most recent decay data attributes and taking precise γ-rays counts without the contribution of additional γ-ray counts from other reaction channels. The current measured cross section value has a lower magnitude than the theoretcially predicted results; nevertheless, it is consistent and falls within the range of these predictions. -
Figure 3(b) shows our present measured cross section result for the
$ ^{41} {\rm{K}}$ (n,α)$ ^{38} {\rm{Cl}}$ reaction in comparison with the literature data, calculated excitation function results, and various evaluated data. For the$ ^{41} {\rm{K}}$ (n,α)$ ^{38} {\rm{Cl}}$ reaction, the data deviated from each other less at an energy of approximately 14 MeV than the$ ^{65} {\rm{Cu}}$ (n,α)$ ^{62m} {\rm{Co}}$ reaction, as presented in Fig. 3(a). The nuclear model predicted excitation functions and evaluated data from the JEFF-3.1/A and TENDL-2019 libraries are in good agreement with most of the cross sectional data and the amplitude of the current measured cross section within the limit of experimental uncertainties. At energies above 14 MeV, the evaluated data from JENDL and ENDF show distinct trends compared with the experimental data and theoretically expected results, as shown in Fig. 3(b). -
In Fig. 4, the result of the
$ ^{65} {\rm{Cu}}$ (n,2n)$ ^{64} {\rm{Cu}}$ reaction cross section measurement is shown with theoretically derived results, existing cross sectional data, and available given evaluated data. The obtained result at an energy of 14.92 ± 0.02 MeV for the (n,2n) reaction cross section of the$ ^{65} {\rm{Cu}}$ isotope is consistent with existing data reported by different groups and agrees well with the theoretically predicted results and evaluated data curves, as shown in Fig. 4. In addition, the trend of recorded data points taken from the EXFOR database, computed excitation functions, and evaluated data agree with each other in the defined 10−20 MeV energy range of incident neutrons. -
Experimental data on the neutron induced (n,α) and (n,2n) reaction cross sections of potassium and copper at a neutron energy of 14.92 ± 0.02 MeV are presented in this paper along with a complete uncertainty quantification and correlation matrix. The cross sections were measured using the neutron activation technique with the latest decay data from the ENSDF library. In the γ-ray spectroscopic data analysis, the necessary corrections arising from the coincidence summing-effect and self-attenuation process have been examined. Furthermore, we performed a covariance analysis to calculate the uncertainty of the reaction cross sections measured in this study and the matrix of the correlations between different reaction cross sections. The total uncertainty in the measured cross sections was calculated to be between 11 and 14%. The cross section magnitude achieved in this experiment for the
$ ^{65} {\rm{Cu}}$ (n,α),$ ^{41} {\rm{K}}$ (n,α), and$ ^{65} {\rm{Cu}}$ (n,2n) reactions are consistent with the existing database, TALYS-1.9 and EMPIRE-3.2 calculations, the predicted results, and available evaluated nuclear data.
Measurement of (n,α) and (n,2n) reaction cross sections at a neutron energy of 14.92 ± 0.02 MeV for potassium and copper with uncertainty propagation
- Received Date: 2021-06-10
- Available Online: 2022-01-15
Abstract: Experimentally measured neutron activation cross sections are presented for the


 DownLoad: