-
Spectroscopic factors (SFs) describe the strengths of single-particle states at the Fermi surface of shell closures or quasi-particles and are traditionally considered as a link between studies of nuclear reactions and nuclear structures [1]. SFs extracted from direct nuclear reactions are found to be 30%–40% smaller than shell model predictions [2–4]. Such reduction is generally suggested to originate from nucleon-nucleon (NN) correlations, which cannot be adequately treated in traditional shell model calculations [5, 6]. The quenching of single-particle strength (SPS) is an important topic in nuclear physics (see review [7]). Transfer [8–15], single-nucleon removal [16–24], and quasi-free knockout [25–29] reactions are common probes for the quenching of SPS across a wide region of proton-neutron asymmetry
$ \varDelta S $ , which is defined as the difference between the neutron and proton separation energies of the particles concerned, i.e.,$ \varDelta S = S_n -S_p $ for neutron removal and$ \varDelta S = S_p -S_n $ for proton removal. Experiments using different reactions and/or beam energies are expected to extract consistent nuclear structure information for any nuclei. However, in practice, there are disagreements among these techniques on the degree of the proton-neutron asymmetry dependence of the reduction factors (RFs) of the single-particle strengths,$ R_s $ .A series of systematic studies on the intermediate-energy (mostly between 80–300 MeV/nucleon) single nucleon knockout measurements of various radioactive light nuclei on Be/C targets [17, 19, 24] show a strong dependence of the reduction factors on
$ \varDelta S $ . The situation of single-proton and single-neutron removal reactions over long isotopic chains of medium-mass nuclei seems to be different [22].$ R_s $ for the single-neutron removal on tin isotopes does not show any clear dependence with$ \varDelta S $ , but for the single-neutron removal on same nuclei,$ R_s $ shows a clear decrease with the proton-neutron asymmetry, similar to that in Ref. [24]. In contrast, for transfer reactions [10, 13–15] and ($ p,2p $ ) and ($ p, pn $ ) reactions [25, 26, 28, 29], there is so far no obvious evidence that$ R_s $ depends on$ \varDelta S $ . It is still an open question why the proton-neutron asymmetry dependence of the RFs differs systematically for different reactions. A similar discrepancy exists in structure theoretical calculation [25, 26, 30–33].The Glauber model is widely used in previous systematic studies on knockout reactions [17, 19, 20, 23, 24]. However, the incident energy being large enough is crucial for the validity of the eikonal and sudden approximations, which form the basis of the Glauber model. RFs extracted from knockout reactions with a variety of incident energies can provide significant information to improve the Glauber model in its incident-energy-dependent part [23]. In our previous study [20], we analyzed the single neutron removal cross sections pf the neutron-rich 15-19C isotopes on Be/C targets at incident energies between 50–900 MeV/nucleon. No strong incident energy dependence was found in the RFs of these nuclei within this energy range. In this study, we carry out a systematic analysis of available measurements of one-neutron knockout data for carbon isotopes 9-12,14-20C. With the inclusion of new data measured at higher energies and results with proton-rich carbon isotopes, our goals are (i) to investigate the incident energy dependence in
$ R_s $ throughout a wider energy region up to 2100 MeV/nucleon and (ii) to explore the proton-neutron asymmetry dependence of quenching of single neutron strengths for both proton-rich and neutron-rich carbon isotopes. The$ \varDelta S $ values range from –26.6 to 12.9 MeV for these nuclei. -
For knockout reactions, the experimental one-neutron removal cross sections,
$\sigma_{{-1n}}^{ \rm{exp}}$ , are usually inclusive, that is, contributions from all the bound excited states of the knockout residues were included in the measured data. Therefore, the theoretical one-neutron removal cross sections$\sigma_{{-1n}}^{ \rm{th}}$ were calculated as sums of the single-particle removal cross sections [18]:$ \sigma_{{-1n}}^{ \rm{th}} = \sum\limits_{nlj}\left[\frac{A}{A-1}\right]^{N_{nl}}C^2S(J^{\pi},nlj)\sigma_{ \rm{sp}}(nlj,S_n) , $

(1) where
$ C^2S(J^{\pi},nlj) $ are the shell model SFs, which depend on the spin-parties of the core states,$ J^{\pi} $ , and the quantum numbers of the single-particle states of the removed nucleon, nlj. The factors$ \left[\dfrac{A}{A-1}\right]^{N_{nl}} $ are for the center-of-mass corrections to the shell model SFs, where$ N_{nl} $ is the number of the oscillator quanta associated with the major shell of the removed particle, which depends on the node number n and orbital angular momentum l, and A is the mass number of the composite nucleus [9, 22]. The single-particle cross sections,$ \sigma_{ \rm{sp}} $ , include contributions from both the stripping and diffraction dissociation mechanisms [34], that is,$ \sigma_{ \rm{sp}} = \sigma_{ \rm{dif}}+\sigma_{ \rm{str}} $ .In the Glauber theory, the
$ \sigma^{ \rm{th}} $ calculation requires (i) the final-states spectra and shell model SFs, (ii) the core- and valence-target elastic S-matrices, and (iii) the removed-neutron radial wave-function associated with each bound state of the core nucleus. For (i), the shell model spectroscopic factors$ C^2S(J^{\pi},nlj) $ are obtained from large-basis shell model (LB-SM) calculations with the code OXBASH, using the interaction YSOX [35]. For (ii), with the optical limit of the Glauber theory and the$ t\rho\rho $ approximation, we need the nucleon-nucleon (NN) scattering amplitudes, and the nucleon density distributions of the core nucleus and the valence nucleon, and the target nuclei. To be consistent with our previous analyses of knockout reactions [20], the nucleon density distributions are also obtained with Hartree-Fock calculations based on the Skyrme SkX interaction [36], except that a two-parameter Fermi density with$ \rho_0 = 0.194 $ fm-3,$ c = $ $ 2.214 $ fm, and$ a = 0.425 $ fm is used for 12C.There have been different parametrizations of the NN scattering amplitudes. We used the parameters of Horiuchi et al. [37] in our previous work, which covers an energy range from 30 to 1000 MeV/nucleon. A new measurement at 1.6 GeV/nucleon is performed for the carbon isotopes 10-12C(-n) at the GSI Helmholtzzentrum für Schwerionen-forschung, Darmstadt, Germany [38]. For this reason, we use the new global parameter set developed by Tran et al. [39], which is applicable to reaction cross section
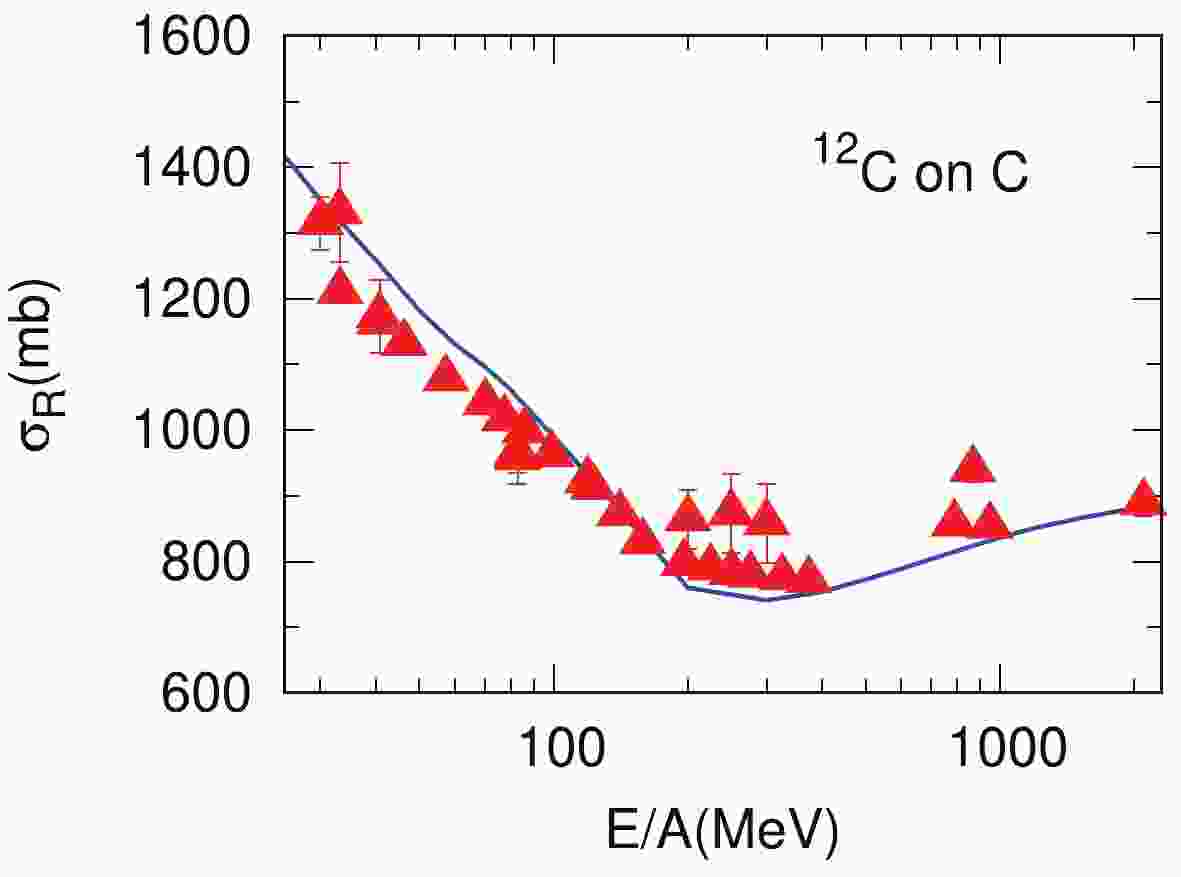
$ \sigma_{\boldsymbol{R}} $ measurements at incident energies from 10 to 2100 MeV/nucleon.As shown in Fig. 1, our calculations show reasonable agreement with the experimental
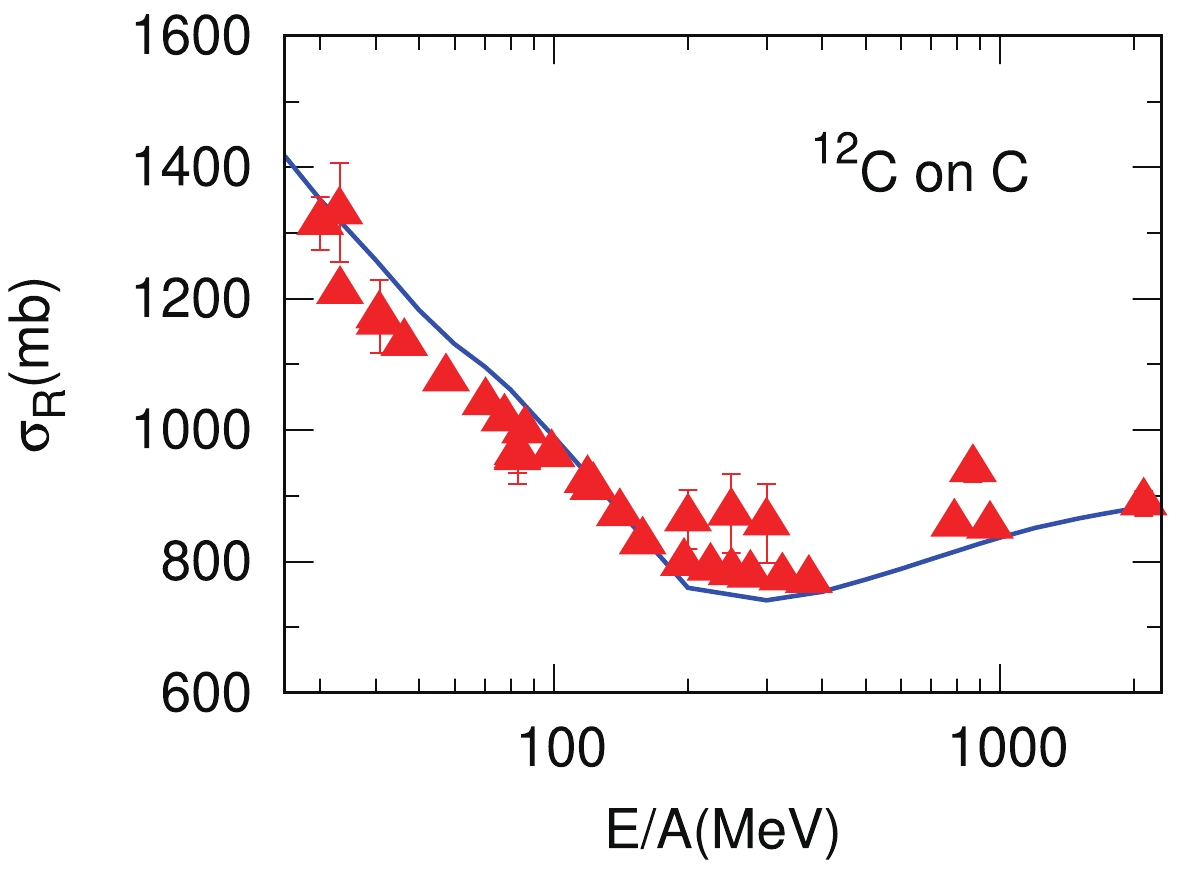
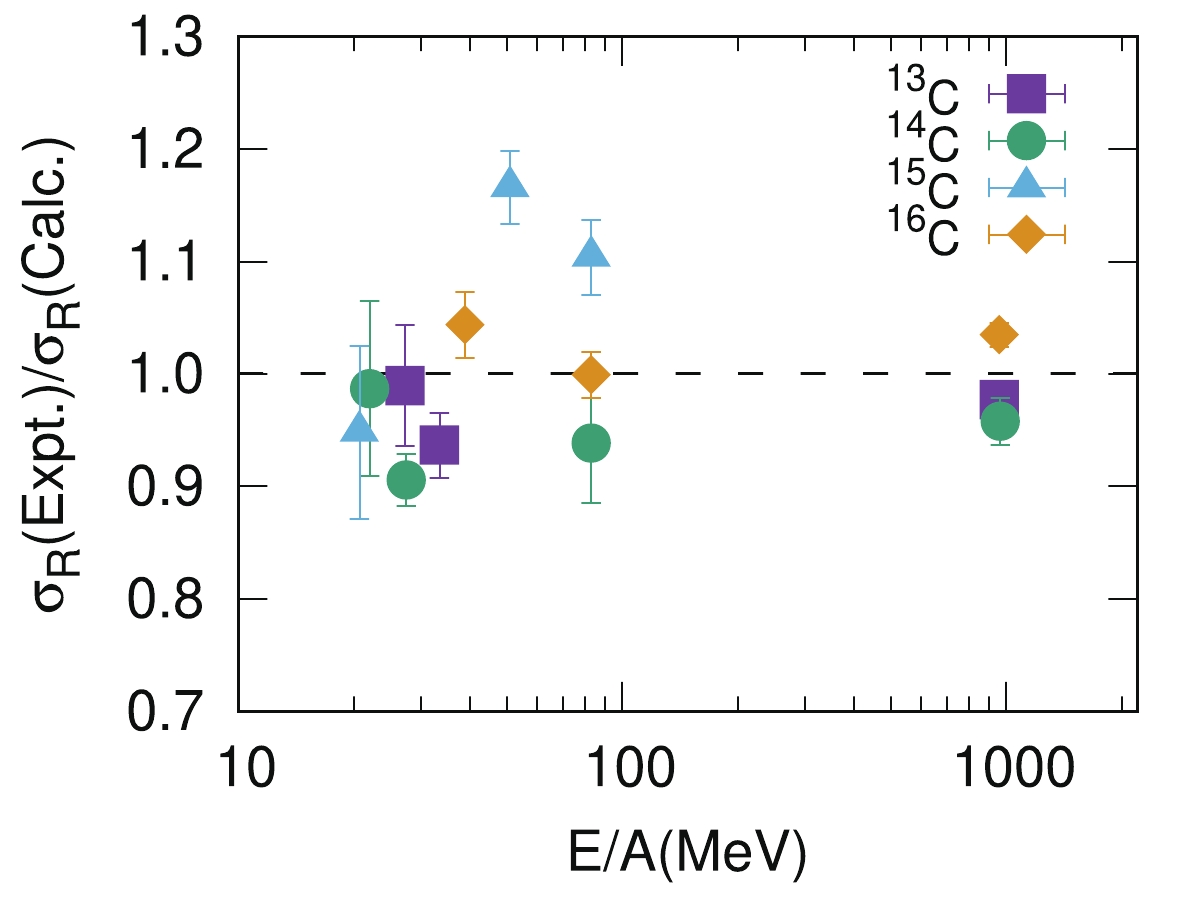
$ \sigma_{\boldsymbol{R}} $ for reactions of 12C on carbon targets in the whole energy range. Figure 2 is a plot of the discrepancy between the data and the calculation for other carbon isotopes: 13-16C. The discrepancies are below 10% except for 15C, which reaches almost 20%. All our calculations are performed with the computer code MOMDIS [40].For (iii), the single-neutron wave functions are obtained by using the Woods-Saxon (WS) potential geometry with a radius parameter
$ r_0 $ = 1.25 fm and a diffuseness$ a_0 $ = 0.7 fm, which are the same as those adopted in analysis of knockout reactions in, e.g., Refs. [18, 20, 23]. The depths of the WS potentials are adjusted to reproduce the experimental separation energy, and the excitation energy of each final state was taken into account. All above data on nuclei used in theoretical calculations are listed in Table 1.Reaction $ \varDelta S $ /MeV

$ E_{\rm{x}} $ /MeV

$ J^{\pi} $ 

nlj $ C^2S $ 

(9C, 8C) 12.93 0.000 $ 0^+ $ 

$ 0p_{3/2} $ 

0.868 (10C, 9C) 17.28 0.000 $ \dfrac{3}{2}^- $ 

$ 0p_{3/2} $ 

1.741 (11C, 10C) 4.43 0.000 $ 0^+ $ 

$ 0p_{3/2} $ 

0.423 3.354 $ \dfrac{3}{2}^- $ 

$ 0p_{3/2} $ 

1.567 (12C, 11C) 2.76 0.000 $ \dfrac{3}{2}^- $ 

$ 0p_{3/2} $ 

2.789 2.000 $ \dfrac{1}{2}^- $ 

$ 0p_{1/2} $ 

0.616 4.804 $ \dfrac{3}{2}^- $ 

$ 0p_{3/2} $ 

0.385 (14C, 13C) −12.66 0.000 $ \dfrac{1}{2}^- $ 

$ 0p_{1/2} $ 

1.580 3.089 $ \dfrac{1}{2}^+ $ 

$ 1s_{1/2} $ 

0.021 3.685 $ \dfrac{3}{2}^- $ 

$ 0p_{3/2} $ 

2.031 3.854 $ \dfrac{5}{2}^+ $ 

$ 0d_{5/2} $ 

0.118 (15C, 14C) −19.86 0.000 $ 0^+ $ 

$ 1s_{1/2} $ 

0.953 6.094 $ 1^- $ 

$ 0p_{3/2} $ 

0.086 $ 0p_{1/2} $ 

1.015 6.589 $ 0^+ $ 

$ 1s_{1/2} $ 

0.007 6.903 $ 0^- $ 

$ 0p_{1/2} $ 

0.410 7.012 $ 2^+ $ 

$ 0d_{5/2} $ 

0.004 7.341 $ 2^- $ 

$ 0p_{3/2} $ 

0.006 (16C, 15C) −18.30 0.000 $ \dfrac{1}{2}^+ $ 

$ 1s_{1/2} $ 

0.734 0.740 $ \dfrac{5}{2}^+ $ 

$ 0d_{5/2} $ 

1.167 (17C, 16C) −22.64 0.000 $ 0^+ $ 

$ 0d_{3/2} $ 

0.032 1.766 $ 2^+ $ 

$ 1s_{1/2} $ 

0.149 $ 0d_{5/2} $ 

1.301 $ 0d_{3/2} $ 

0.034 3.987 $ 2^+ $ 

$ 1s_{1/2} $ 

0.275 $ 0d_{5/2} $ 

0.077 $ 0d_{3/2} $ 

0.024 4.143 $ 4^+ $ 

$ 0d_{5/2} $ 

0.330 (18C, 17C) −21.91 0.000 $ \dfrac{3}{2}^+ $ 

$ 0d_{3/2} $ 

0.088 0.217 $ \dfrac{1}{2}^+ $ 

$ 1s_{1/2} $ 

0.803 0.332 $ \dfrac{5}{2}^+ $ 

$ 0d_{5/2} $ 

2.734 (19C, 18C) −26.09 0.000 $ 0^+ $ 

$ 1s_{1/2} $ 

0.502 1.589 $ 2^+ $ 

$ 0d_{5/2} $ 

0.585 $ 0d_{3/2} $ 

0.003 2.515 $ 2^+ $ 

$ 0d_{5/2} $ 

0.038 $ 0d_{3/2} $ 

0.079 3.972 $ 3^+ $ 

$ 0d_{5/2} $ 

1.682 $ 2^+ $ 

$ 0d_{5/2} $ 

0.793 $ 0d_{3/2} $ 

0.008 (20C, 19C) −26.58 0.000 $ 0^+ $ 

$ 1s_{1/2} $ 

1.201 Table 1. The nuclei information used in theoretical calculations, including ground-state proton-neutron asymmetry
$ \varDelta S $ , bound states of the core nuclei,$ E_{\rm{x}} $ and$ J^{\pi} $ , and their associate single-particle states, nlj of the valence nucleon and single-particle spectroscopic factors ($ C^2S $ ) as results of shell model calculations used in one neutron removal cross section calculation of the carbon isotopes.The RFs in knockout reactions,
$ R_s $ , are defined as the ratio between the experimental and theoretical one-neutron removal cross sections, that is,$ R_s = \sigma_{ \rm{exp}}/\sigma_{ \rm{th}} $ . Once the above parameters are determined, the theoretical one-neutron removal cross sections$ \sigma_{ \rm{th}} $ for the carbon isotopes with carbon and beryllium targets at various energies can be calculated. For$ R_s $ values determined by more than one measurement, we define an averaged reduction factor$ \overline{R_s} $ , which is a weighted mean of the$ R_s $ from each measurement. The weighting factor is chosen to be the reciprocal of the square of$ \varDelta R_s $ :$ w_i = \left[\frac{1}{(\varDelta R_s)_i}\right]^2 , $

(2) $\overline{R_s} = \frac{\sum_i (R_s)_iw_i}{\sum_i w_i} , $

(3) $ \overline{\varDelta R_s} = \frac{1}{\sqrt{\sum_i w_i}} . $

(4) Following the definition in Ref. [18], the effective proton-neutron asymmetry
$ \varDelta S^{ \rm{eff}} $ is given by$ \varDelta S^{ \rm{eff}}(A) = S_n(A)-S_p(A)+\overline{E}_f(A-1), $

(5) where
$ S_n $ and$ S_p $ are the neutron and proton separation energies in the ground state of the target nucleus.$ \overline{E}_f $ is the effective final state excitation energy, which is obtained by weighting the excitation energy$ E^* $ of each state by the corresponding one-neutron removal cross sections. The results are listed in Table 2 together with the corresponding experimental removal cross sections.Reaction Target $ E_{\rm{in}}/{\rm{(MeV/u)}} $ 

$\varDelta S^ {\rm{eff} } /{\rm{MeV} }$ 

$\sigma_{-1n}^ {\rm{exp} }/{\rm{mb} }$ 

$\sigma_{-1n}^ {\rm{th} } /{\rm{mb} }$ 

$ R_s $ 

(9C, 8C) 9Be 66.8 [21] 12.93 3.93±0.88 33.39 0.118±0.026 (10C, 9C) 12C 120 [47] 17.28 23.4±11 62.53 0.374±0.176 9Be 120 [47] 17.28 27.4±13 55.29 0.496±0.235 9Be 1670 [38] 17.28 20.21±0.28 48.42 0.417±0.006 Average 17.30 0.417±0.006 (11C, 10C) 9Be 1670 [38] 7.02 24.44±0.21 58.17 0.420±0.004 (12C, 11C) 12C 94.6 [48] 3.54 53±22 125.35 0.423±0.176 12C 240 [49] 3.54 60.51±11.08 100.49 0.602±0.110 12C 250 [50] 3.54 55.97±4.06 100.20 0.559±0.041 12C 600 [51] 3.54 53.6±0.804 97.32 0.551±0.008 12C 1050 [52] 3.53 44.7±2.8 96.75 0.462±0.029 9Be 1670 [38] 3.54 49.44±0.88 96.07 0.515±0.009 12C 2100 [52] 3.53 46.5±2.3 96.02 0.484±0.024 Average 3.54 0.529±0.006 (14C, 13C) 12C 67 [53] −10.70 65±4 136.85 0.475±0.029 12C 83 [54] −10.69 67±14 133.28 0.503±0.105 12C 235 [23] −10.69 80±7 105.43 0.759±0.066 9Be 700 [55] −10.69 62±9 100.32 0.618±0.090 Average −10.70 0.528±0.025 (15C, 14C) 12C 54 [34] −18.03 137±16 211.42 0.648±0.076 12C 62 [53] −17.98 159±15 201.81 0.788±0.074 12C 83 [54] −17.87 146±23 182.59 0.800±0.126 9Be 103 [56] −17.69 140.2±4.6 141.23 0.993±0.033 12C 237 [23] −17.71 108±11 134.02 0.806±0.082 9Be 700 [55] −17.72 148±23 128.59 1.151±0.179 Average −17.77 0.907±0.025 (16C, 15C) 12C 55 [53] −17.94 65±6 112.07 0.580±0.054 9Be 62 [57] −17.93 77±9 95.19 0.809±0.095 9Be 75 [58] −17.93 81±7 90.98 0.890±0.077 12C 83 [59] −17.93 65±15 102.43 0.635±0.146 12C 239 [23] −17.92 83±8 80.19 1.035±0.100 9Be 700 [55] −17.92 63±19 77.23 0.816±0.246 Average −17.93 0.744±0.036 (17C, 16C) 12C 49 [53] −20.22 84±9 129.97 0.646±0.069 9Be 62 [57] −20.21 115±14 108.30 1.062±0.129 12C 79 [18] −20.21 116±18 117.58 0.987±0.153 9Be 700 [55] −20.28 72±19 99.34 0.725±0.191 12C 904 [52] −20.21 129±22 96.97 1.330±0.227 Average −20.22 0.800±0.053 (18C, 17C) 12C 43 [53] −21.62 115±18 181.22 0.635±0.099 12C 80 [18] −21.62 155±24 162.91 0.951±0.147 9Be 700 [55] −21.62 80±14 124.50 0.643±0.112 Average −21.62 0.702±0.066 (19C, 18C) 9Be 57 [57] −24.00 264±80 192.27 1.373±0.416 9Be 64 [18] −23.96 226±65 186.05 1.215±0.349 9Be 88 [60] −23.87 105±17 169.51 0.619±0.100 12C 243 [61] −23.82 163±12 152.39 1.070±0.079 9Be 700 [55] −23.83 122±32 147.22 0.829±0.217 12C 910 [52] −23.95 233±51 165.44 1.408±0.308 Average −23.85 0.928±0.057 (20C, 19C) 12C 241 [61] −26.58 58±5 60.87 0.953±0.082 Table 2. Results of experimental (
$ \sigma_{-1n}^ {\rm{exp}} $ ) and theoretical inclusive one-neutron removal cross sections ($ \sigma_{-1n}^ {\rm{th}} $ ) for carbon isotopes at different incident energies, the corresponding effective proton-neutron asymmetry$ \varDelta S^ {\rm{eff}} $ , and quenching factors of the neutron spectroscopic factors. -
The reduction factors as a function of the incident energy for each of the carbon isotopes are shown in Fig. 3. The
$ R_s $ for the single-neutron removal still does not show clear dependence with the incident energy, except for 15C, although some measurements at higher beam energies are included. Note that the$ R_s $ values scatter considerably for 15, 17, 19C, which can be due to the large uncertainties in the experimental cross sections. Therefore, more precise measurements for these nuclei are expected. Interestingly, 15, 19C are two examples of neutron halo nucleus. The situation concerning a halo structure in 17C is rather contentious. Maybe it is a halo-like nucleus or neutron skin nucleus. These phenomena may be related to the complex structure of these nuclei. A more detailed study of the halo structure of 15, 17, 19C with different reaction or structure models is needed to clarify it.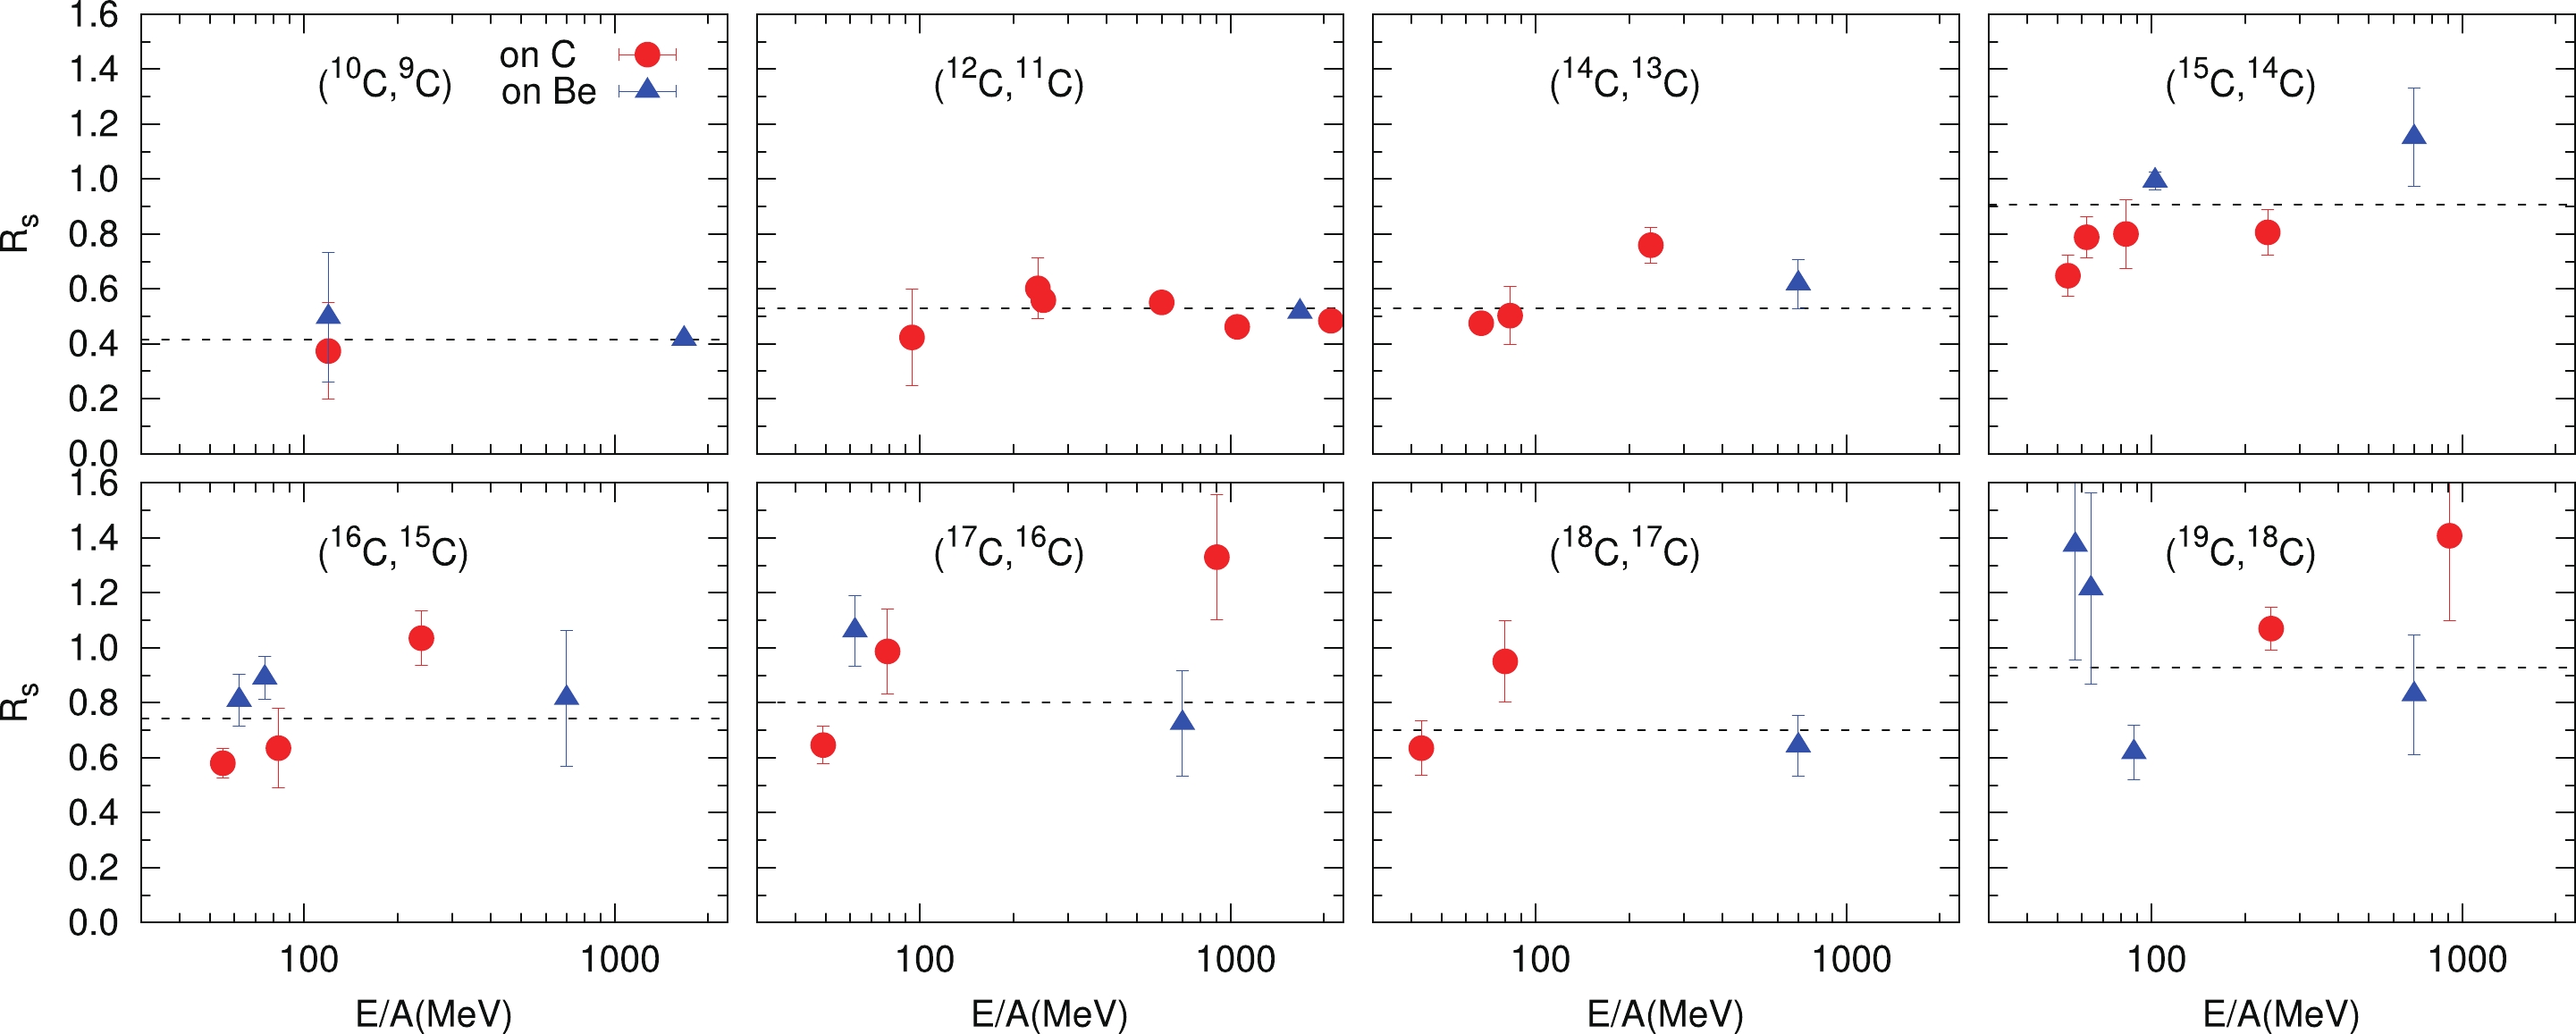
Figure 3. (color online) Reduction factors of the single neutron spectroscopic factors of the carbon isotopes extracted from experimental data at various incident energies. The dashed lines represent the weighted average
$R_s$ values.The averaged reduction factor
$ \overline{R_s} $ are fitted by a linear function on the$ \varDelta S^{ \rm{eff}} $ values,$ \overline{R_s} = a\times \varDelta S^{ \rm{eff}}+b $ . These fittings are made by assuming either (i)$ a = -0.016 $ , which is the same as that in Ref. [24], and b to vary freely, or (ii) both a and b to vary freely. The results are depicted in Fig. 4, where the widths of these bars represent their corresponding$ \chi^2 $ . As can be seen, the averaged reduction factor shows a clear decrease with the proton-neutron asymmetry, although the free slope is weaker than the one observed in Ref. [24].
Figure 4. (color online) Averaged reduction factors from the reactions analyzed in this work (symbols). The green and grey bars represent the linear dependence of Rs on the
$\varDelta S^{ \rm{eff}}$ values fitted assuming a free or a fixed slope, respectively. See the text for details.Slope values for other systematic studies are provided in Table 3, as well as studied nuclei and the proton-neutron asymmetry energy range, including results from single-nucleon removal, transfer, (
$ e,e'p $ ), and quasi-free knockout reactions. Figure 5 shows the slope parameters from linear fits of reduction factors for different reactions. The horizontal line segment represents the slope via a linear fit of all data from a certain compilation, and the band corresponds to fitting results to different sets of the same experimental data depending on the choice of theoretical models and parameters. The blue diamond stands for results from this work. The blue horizontal bands correspond to reduction factors of knockout reactions using only Sn isotopes, with the results from single-neutron removal on the left [22, 62, 63] and those from single-proton removal on the right [22, 62, 63]. The result from a recent compilation of light nuclei knockout measurements by Tostevin [24] is represented by the blue segment. The red line and bands correspond to the linear fit values taken from deuteron single nucleon transfer measurements, including the analyses on Ar/Ca isotopes (left red line) [15] and oxygen isotopes (middle red band) [11, 13], respectively, and a compliation by our previous work (right red band) [14]. The green line corresponds to the slope from a linear fit using ($ e,e'p $ ) data [8]. The purple lines and bands correspond to separate analyses of ($ p,2p $ ) and ($ p,pn $ ) measurements on oxygen, carbon, and nitrogen targets. The ($ p,2p $ ) and ($ p,pn $ ) results from Holl et al. [29], Gómez-Ramos et al. [26], Phuc et al. [28], and Atar et al. [25] are shown in order from left to right. As can be seen, except for ($ e,e'p $ ) reactions, which do not cover a wide asymmetry range, transfer reactions and ($ p,2p $ )/($ p,pn $ ) do not exhibit clear dependence on proton-neutron asymmetry, as observed in knockout reactions on beryllium and carbon targets. Ref. [14] has suggested that the systematical discrepancy between transfer and knockout reactions is not due to the exclusive or inclusive treatment of the experimental data. This discrepancy among the different experimental probes may be due to different reaction descriptions bringing different approximation schemes, model inputs, and uncertainties. Understanding the discrepancy is a key issue in nuclear physics to be solved in the near future, in view of the goal of obtaining consistent nuclear structure information.Reactions Isotopes $ \varDelta S/{\rm{MeV}} $ 

Slope/MeV−1 Data Sets Ref. Knockout(-n) 9-12,14-20C −26.6~17.3 −0.0095 43 present Knockout(-n) 104,110,113-115,121-123,126-135Sn −14.0~8.4 0.0091~0.013 18 [22, 62, 63] Knockout(-p) 104,110,112,120,124,129-133Sn −8.4~13.3 −0.027~−0.024 10 [22, 62, 63] Knockout(-n)/(-p) 9Li, 10Be, 8B, 9,10,12,15,16,19,20C, 14,16,24O, 25F, 29,30Ne, 33Na,22,28Mg,
24,34,36,38,40Si, 43P, 28,36,44S, 32,34,46Ar, 36Ca, 57Ni,71Co−26.6~20.5 −0.016 48 [19, 24] ( $ p, d $ )/(

$ d, p $ )

34,36-41,46Ar, 40-45,47-49Ca −11.3~12.4 0.0014 33 [15] ( $ d, t $ )/(d, 3He)

14,16,18O −18.6~18.6 −0.0076~0.0024 10 [11, 13] ( $ p, d $ )

8He,12,14C, 14,16,18O, 22Ne, 26Mg, 28,30Si, 34S, 34,36,38,46Ar, 40,42,44,48Ca, 46Ti, 56Ni −22.3~18.6 −0.0004~0.0023 103 [14] ( $ e,e'p $ )

7Li, 12C, 16O, 30Si, 31P, 40,48Ca, 51V, 90Zr, 208Pb −7.3~5.9 0.0043 10 [8] ( $ p,2p $ )/(

$ p,pn $ )

10-12C, 21N, 14,16,17,21-23O −22.3~22.3 −0.0060 15 [29] ( $ p,2p $ )/(

$ p,pn $ )

12C, 21N, 13-18,21-23O −22.3~22.3 −0.0031~0.0004 16 [26] ( $ p,2p $ )/(

$ p,pn $ )

10-12C, 21N, 13-18,21-23O −22.3~22.3 −0.0026 18 [28] ( $ p,2p $ )

14,16,17,21,23O −18.6~22.3 −0.0033 5 [25] Table 3. The slope parameters of reduction factors fitted by different experimental results.
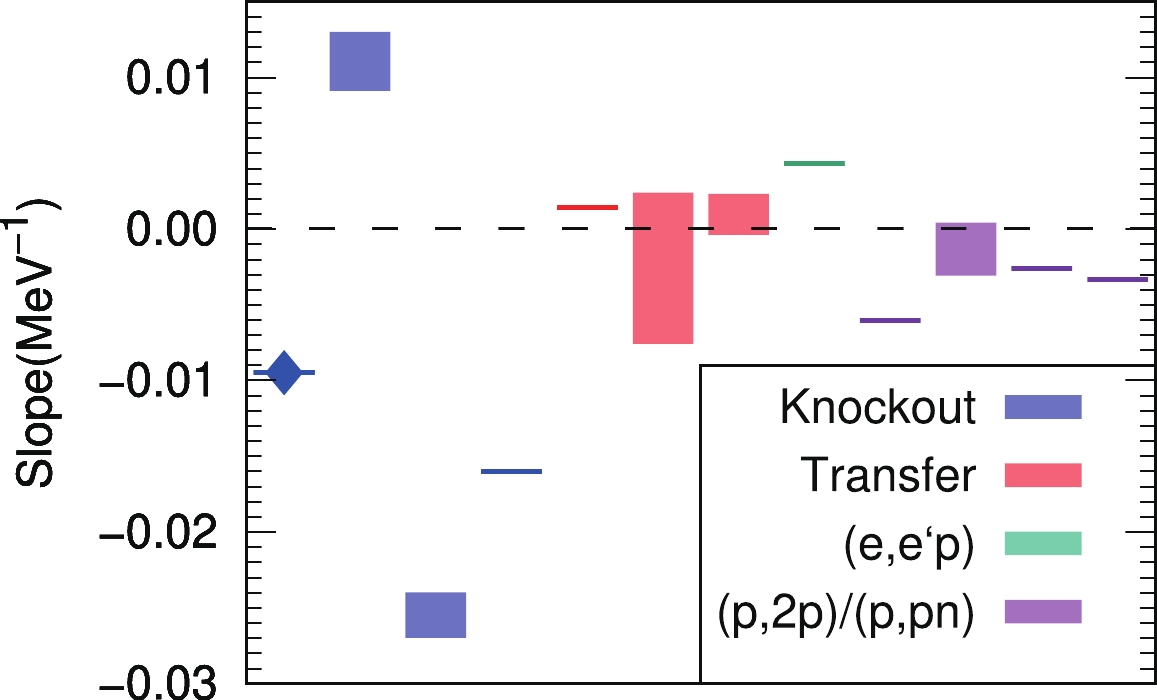
Figure 5. (color online) A summary of reduction-factor slope parameters across different reactions. The blue lines and bands are slope values of knockout reactions extracted from my work and Refs. [19, 22, 24, 62, 63], respectively. The red line and bands correspond to the slope values taken from single nucleon transfer reactions using data from Refs. [11, 13-15], respectively. The green line stands for the slope fitted by (
$e,e'p$ ) data [8]. The purple lines and bands represent the ($p,2p$ )/($p,pn$ ) results from Ref. [25, 26, 28, 29]. See the text for details, and the slope values are provided in Table 3 with corresponding citations. -
In summary, we performed a systematic analysis of the one-neutron removal cross sections of the carbon isotopes, 9-12,14-20C, within a wide energy range from approximately 43 to 2100 MeV/nucleon, using the Glauber model. Our results suggest that a clear proton-neutron asymmetry dependence is seen over a wide range of
$ \varDelta S $ values, which is consistent with the earlier systematic studies on knockout reactions [17, 19, 24]. Our results also show no strong incident energy dependence in the$ R_s $ values of these nuclei within the wide energy range studied. Agreement between this work and our previous work from Ref. [20] indicates that the incident energy dependence plays a minor role in the study of quenching factors.
Quenching of single-particle strengths of carbon isotopes 9-12,14-20C with knockout reactions for incident energies 43–2100 MeV/nucleon
- Received Date: 2021-12-03
- Available Online: 2022-06-15
Abstract: To study the quenching of single-particle strengths of carbon isotopes, a systematic analysis is performed for 9-12,14-20C, with single neutron knockout reactions on Be/C targets, within an energy range from approximately 43 to 2100 MeV/nucleon, using the Glauber model. Incident energies do not show any obvious effect on the resulting values across this wide energy range. The extracted quenching factors are found to be strongly dependent on the proton-neutron asymmetry, which is consistent with the recent analysis of knockout reactions but is inconsistent with the systematics of transfer and quasi-free knockout reactions.


 Abstract
 HTML
HTML Reference
 Related
 PDF
PDF




 DownLoad: