-
At present, considerable research is being conducted to experimentally investigate the nuclear photodisintegration in the energy range above the giant dipole resonance (GDR) and up to the pion production threshold (
$ E_{\rm{th}} \approx 145 $ MeV) [1–7]. The interest in this energy region is caused by the change in the mechanism of photon-nucleus interaction occurring therein. This paves the way for a new line of research that would provide detailed knowledge on the competition between two mechanisms of nuclear photodisintegration, viz., via the GDR excitation and quasideuteron photoabsorption.The data obtained from the photonuclear experiment on bremsstrahlung beams are generally represented in terms of the relative yield or the integrated reaction cross-section [2], average cross-section
$ \langle{\sigma(E_{\gamma {\rm{max}}})}\rangle $ [3–7], or cross-section per equivalent photon$\langle{\sigma(E_{\gamma {\rm{max}}})_{Q}}\rangle$ [4, 8]. The$ \langle{\sigma(E_{\gamma {\rm{max}}})}\rangle $ value depends on the gamma flux in the range from the reaction threshold$ E_{\rm{th}} $ to the end-point bremsstrahlung energy$ E_{\gamma {\rm{max}}} $ . This value reflects the energy dependence of the cross-section$ \sigma(E) $ for the reaction under study, that is, its shape is close to the cross-section$ \sigma(E) $ shape. At the same time, the cross-section per equivalent quantum$\langle{\sigma(E_{\gamma {\rm{max}}})_{Q}}\rangle$ is proportional to the reaction yield, and always increases with the$ E_{\gamma {\rm{max}}} $ increase. Among the disadvantages of using the cross-section, one can mention the effect of bremsstrahlung gamma quanta of energies below the threshold of the reaction under study, as in the calculation of this value, the entire gamma flux that passed through the target is considered.This becomes important in the interpretation of the data obtained from the experiments with the application of the induced activity method, where the gamma-radiation of the reaction product nucleus is registered. Hence, in photoneutron reactions, the final nucleus is determined by the quantity of knocked-on neutrons and is formed at the energy equal to/higher than the threshold energy
$ E_{\rm{th}} $ of the reaction under study, which is constant. In the case of multiparticle photonuclear reactions with the charged-particle presence in the exit channel, the reaction product can be produced via several partial channels, each of which has its own reaction threshold value. For example, in the$ ^{27}{\rm{Al}}(\gamma,x)^{24}{\rm{Na}} $ reaction, the$ ^{24}{\rm{Na}} $ nucleus is formed via three reaction channels, the difference of their threshold energies$ E_{\rm{th}} $ being 7.7 MeV. It has been demonstrated in Ref. [4] that in the calculation of the total flux-averaged cross-section$ \langle{\sigma(E_{\gamma {\rm{max}}})}\rangle $ for the given reaction, it is necessary to take into account the threshold value of each reaction channel. The attempt of using only the$ E_{\rm{th}} $ value of the dominant reaction channel in the calculation leads to an essential error in the$ \langle{\sigma(E_{\gamma {\rm{max}}})}\rangle $ value in the neighborhood of the minimal threshold of the reaction studied. The application of the$\langle{\sigma(E_{\gamma {\rm{max}}})_{{Q}}}\rangle$ value for representing the data of this reaction appears to be more convenient [4].The situation becomes even more complicated for the
$ ^{27}{\rm{Al}}(\gamma,x)^{22}{\rm{Na}} $ reaction, where the final product nucleus can simultaneously be formed in seven partial channels:$x = {{n}}\alpha + {{dt}} + {{npt}} + 2{{n}}{^{3}{\rm{He}}} + {{n2d}} + {{2npd}} + {{2p3n}}$ , with difference of their threshold energies reaching 28.3 MeV. This significant difference in the threshold energies of the reaction channels makes it possible to investigate the contribution of different channels to the production of the final product nucleus$ ^{22}{\rm{Na}} $ . For example, at energies between 22.5 and 60 MeV, it is the channel of the$^{27}{\rm{Al}}(\gamma,{n}\alpha)^{22}{\rm{Na}}$ reaction that is dominant, whereas at energies above 70 MeV, a considerable contribution also originates from the$^{27}{\rm{Al}}(\gamma,{{2p3n}})^{22}{\rm{Na}}$ reaction.Previously, the photodisintegration of the
$ ^{27}{\rm{Al}} $ nucleus with the production of$ ^{22}{\rm{Na}} $ has been investigated in [8, 9]. Those authors have determined the experimental bremsstrahlung flux-averaged cross-section values per equivalent photon,$\langle{\sigma(E_{\gamma {\rm{max}}})_{Q}}\rangle$ , at end-point bremsstrahlung gamma-quantum energies ranging from 250 to 1000 MeV.The present work focuses on measuring the average cross-sections
$ \langle{\sigma(E_{\gamma {\rm{max}}})}\rangle $ and$\langle{\sigma(E_{\gamma {\rm{max}}})_{Q}}\rangle$ for the multichannel photonuclear reaction$ ^{27}{\rm{Al}}(\gamma,x)^{22}{\rm{Na}} $ in the energy range$ E_{\gamma {\rm{max}}} = 35 $ –95 MeV. Consideration has been given to some special features of the calculation of$ \langle{\sigma(E_{\gamma {\rm{max}}})}\rangle $ and$\langle{\sigma(E_{\gamma {\rm{max}}})_{Q}}\rangle$ values. Comparison has been performed with the calculations based on the data for the partial cross-sections$ \sigma(E) $ of the reaction channels (${{n}}\alpha + {{dt}} + {{npt}} + 2{{n}}{^{3}{\rm{He}}} + {{n2d}} + {{2npd}} + {{2p3n}}$ ), computed with the TALYS1.95 code [10] for different level density models. -
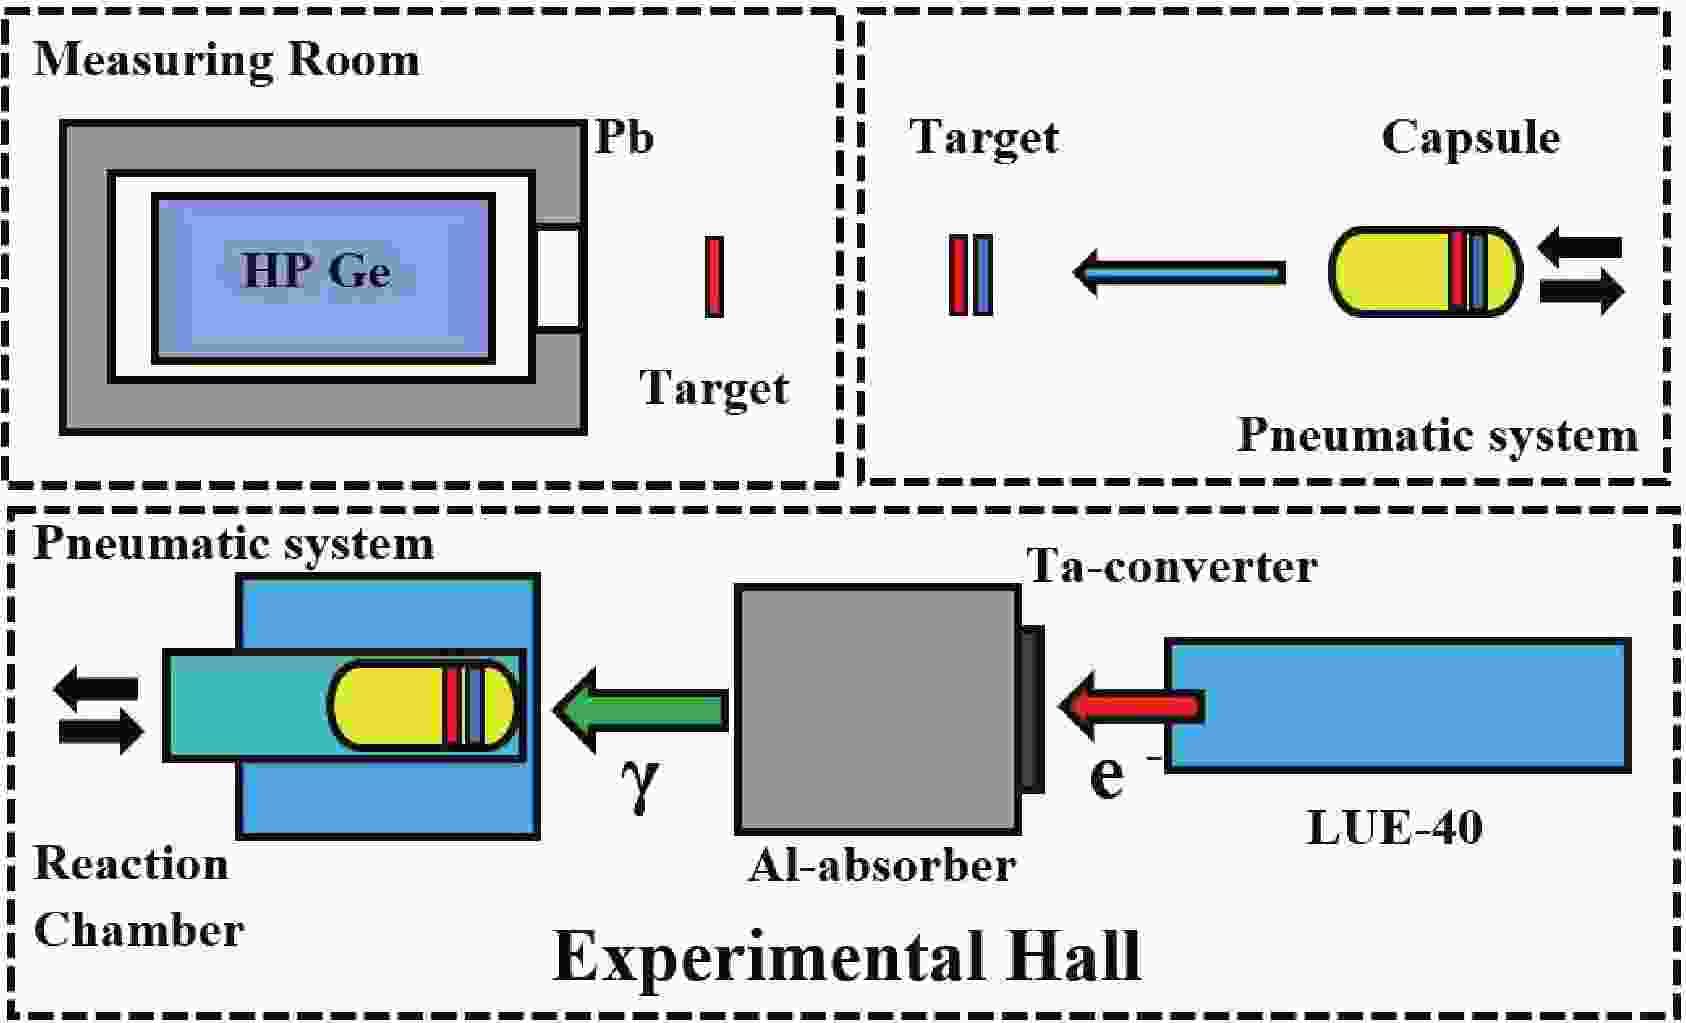
The experiments were performed on the bremsstrahlung γ-beam from the electron linear accelerator LUE-40 NSC KIPT using the method involving the induced activity of the final product nucleus of the reaction, similar to that of Refs. [3, 11]. The schematic diagram of the experiment is presented in Fig. 1.
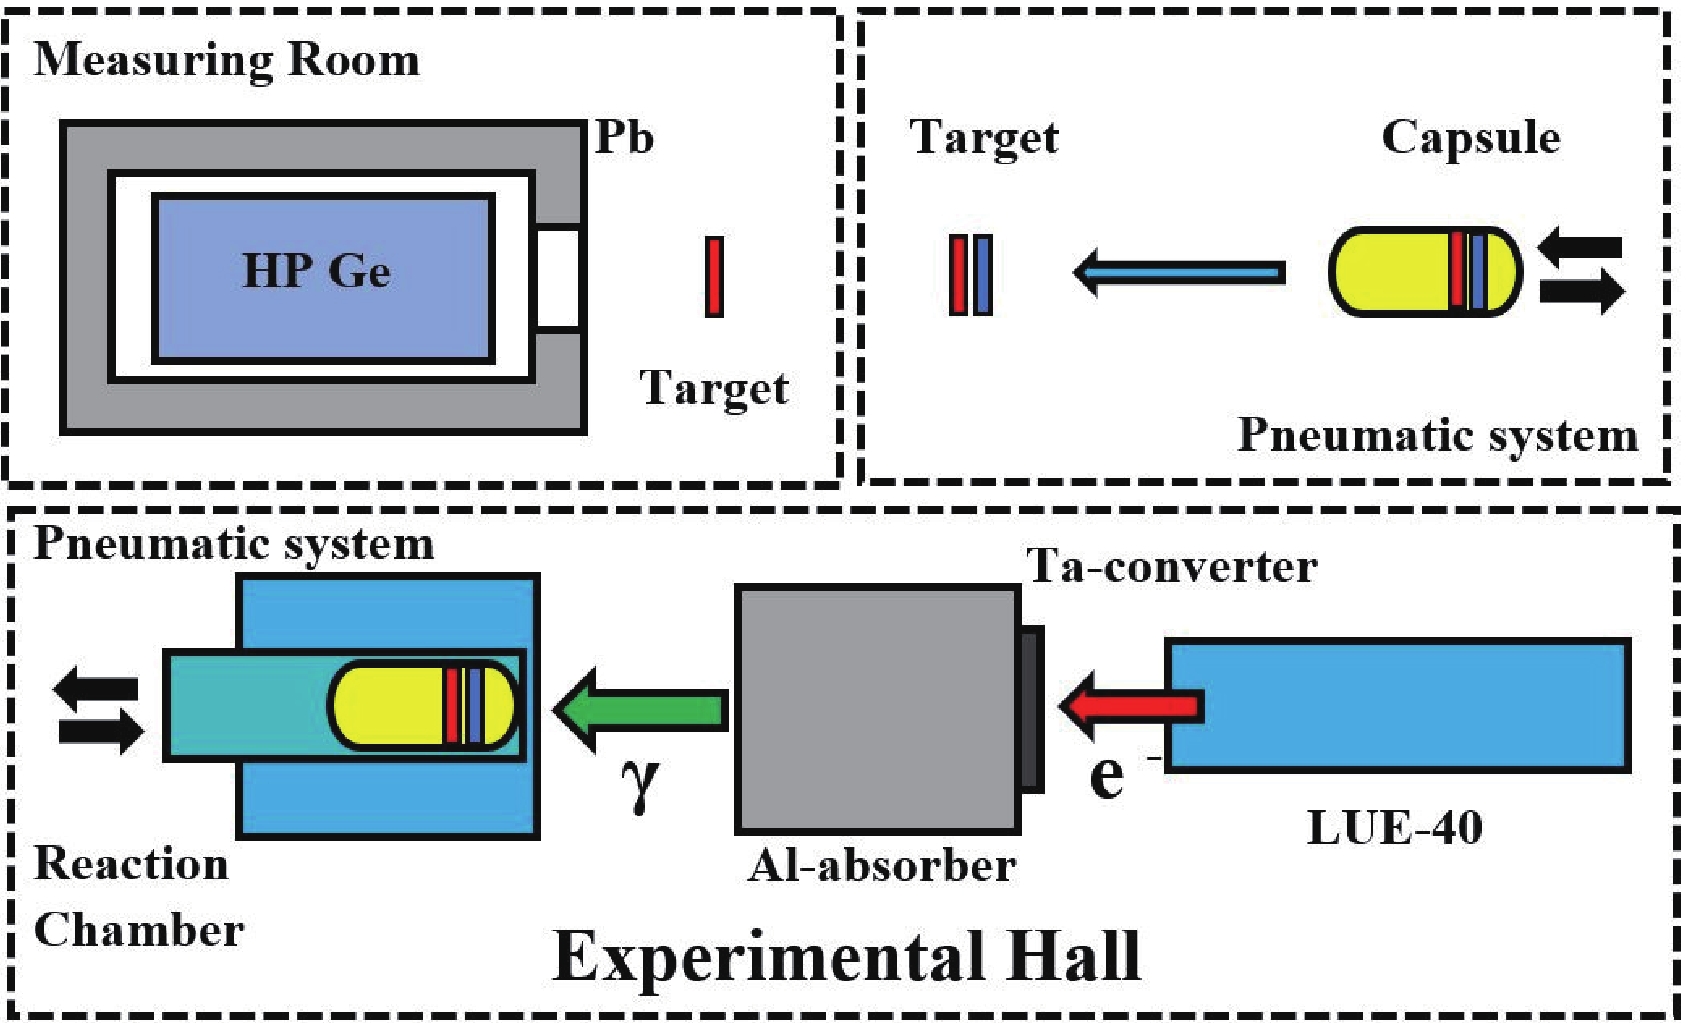
Figure 1. (color online) Schematic block diagram of the experiment. The upper part shows the measuring room, where the exposed target (red color) and the target-monitor (blue color) are extracted from the capsule and are arranged by turn before the HPGe detector for induced γ-activity measurements. The lower part shows the accelerator LUE-40, the Ta-converter, Al-absorber, exposure chamber.
The accelerator parameters enable the change in the energies of accelerated electrons in the range of
$ E_{\rm{e}} = $ 30 to 100 MeV at the average beam current$I_{\rm{e}} = 3\; \mu$ A. With that, the electron energy spectrum width (FWHM) makes$\triangle E_{\rm{e}}/E_{\rm{e}} \sim 1.0\% - 1.5\%$ at a pulse repetition frequency of 50 Hz and a pulse length of$10\; \mu {\rm{s}}$ [12, 13].The bremsstrahlung flux was generated as the pulsed electron beam passed through a 1.05-mm thick tantalum metal plate (radiation length of Ta being
$ \sim4.1 $ mm). The Ta converter was fixed on a massive aluminum cylinder, 100 mm in diameter and 150 mm in thickness. The aluminum cylinder was used for absorption of the electrons that have passed through the converter. The application of the Al absorber resulted in bremsstrahlung spectrum distortion and additional generation of neutrons.The bremsstrahlung flux was computed using the open certified code GEANT4.9.2 [14] considering the real geometry of the experiment, where spatial and energy distributions of the electron beam were taken into account. The program code GEANT4.9.2, PhysList G4LowEnergy allows one to perform calculations with correct consideration of all physical processes for the case of an amorphous target. Similarly, GEANT4.9.2, PhysList QGSP_BIC_HP makes it possible to calculate the neutron yield due to photonuclear reactions from targets of different thickness and atomic charge.
For the experiments,
$ ^{\rm{nat}} {{\rm{Mo}}}$ and$ ^{27}{\rm{Al}} $ targets were prepared in the form of thin discs of 8-mm diameter and thicknesses of 0.1 mm for molybdenum and 1 mm for aluminum, corresponding to the masses$ m \approx $ 60 and 136 mg, respectively. Both targets were simultaneously exposed to bremsstrahlung gamma quanta for$ t_{\rm{irr}} $ = 30 min at all electron energy values. The targets were delivered to the reaction chamber in a special aluminum capsule via the pneumatic conveyor system. After the exposure, both targets were transferred to the measuring room, where they were removed from the capsule, and the induced γ-activity spectra of the targets were registered successively using the HPGe detector. The measurement time was$ t_{\rm{meas}} $ = 30 min for the Mo target, and$ t_{\rm{meas}} $ = 1–4 days for the aluminum target. The induced activity of the aluminum targets was measured after cooling the targets for 5–50 days, thereby eliminating the contribution of intense spectrum lines of the$ ^{24}{\rm{Na}} $ nucleus ($ E_{\gamma} = 1368.6 $ and 2754.0 keV,$ T_{1/2} $ = 14.96 h).The resolution of the HPGe detector Canberra GS-2018 was 1.8 keV (FWHM) for the
$ E_{\gamma} = 1332.5 $ keV γ-line of$ ^{60} {\rm{Co}}$ , and its efficiency was 20% relative to the NaI(Tl) detector, 3 inches in diameter and 3 inches in thickness. The standard radiation sources$ ^{22} {\rm{Na}}$ ,$ ^{60} {\rm{Co}}$ ,$ ^{133} {\rm{Ba}}$ ,$ ^{137} {\rm{Cs}}$ ,$ ^{152} {\rm{Eu}}$ and$ ^{241}{\rm{Am}} $ were used for the energy/efficiency calibration of the spectrometry channel. In γ-ray spectrum measurements, the dead time of the spectrometry channel was not more than 3–5%; it was determined by choosing the appropriate distance between the irradiated sample and the HPGe detector. The γ-ray spectra were analyzed using the Canberra GENIUS2000 software [15]. Figure 2 shows a typical fragment of the γ-radiation spectrum from the aluminum target.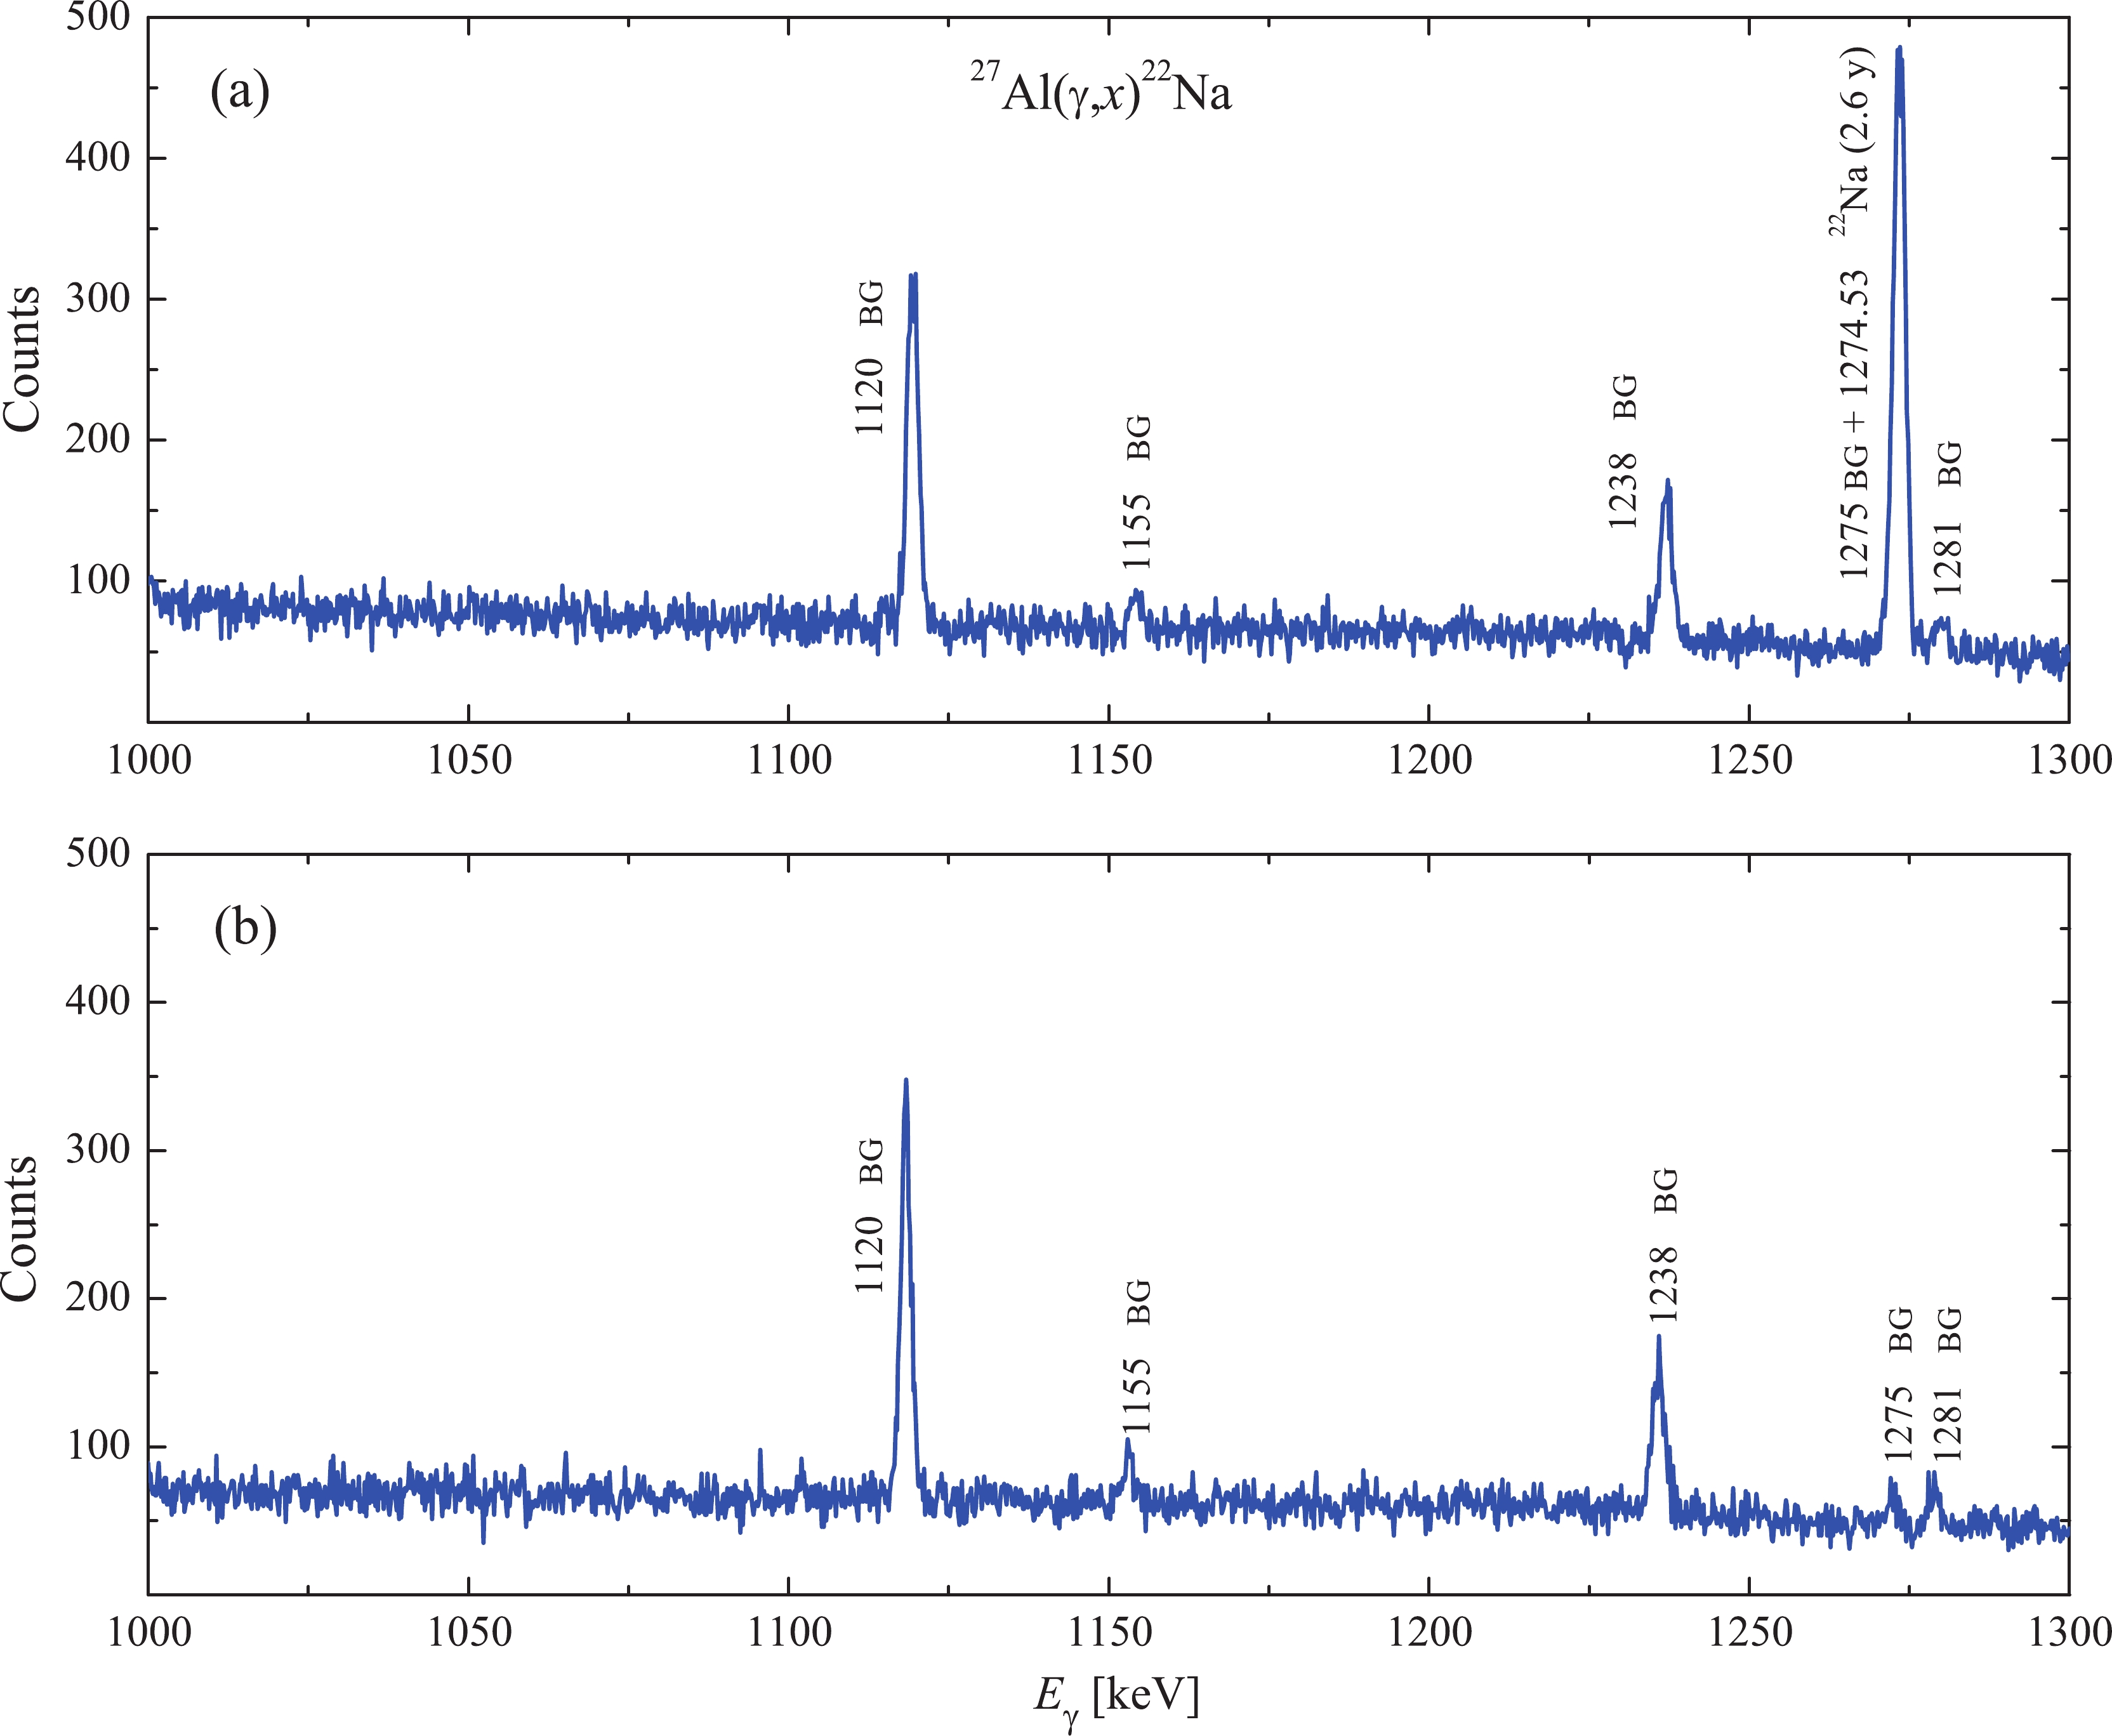
Figure 2. (color online) (a) Part of gamma-ray spectrum from the activated
$ ^{27}{\rm{Al}} $ target of mass 135.486 mg, after exposure to γ-flux with the end-point energy of the bremsstrahlung spectrum$ E_{\gamma {\rm{max}}} = 85.6 $ MeV,$ t_{\rm{cool}} $ = 30 days and$ t_{\rm{meas}} $ = 85 h. The spectrum fragment ranges from 1000 to 1300 keV. The background γ-lines peaks are indicated by the letters BG. (b) Part of gamma-ray natural background spectrum$ t_{\rm{meas}} $ = 95.6 h.The
$ ^{22} {\rm{Na}}$ γ-activity studies of the$ ^{27}{\rm{Al}}(\gamma,x)^{22}{\rm{Na}} $ reaction were performed using the$ E_{\gamma} = 1274.53 $ keV γ-line. The half-life of$ ^{22} {\rm{Na}}$ nucleus is$ T_{1/2} $ = 2.6 years and the intensity of the γ-line is presented in Table 1. The production of$ ^{22} {\rm{Na}}$ is possible in seven partial channels of the reaction:$x = {{n}}\alpha + {{dt}} + {{npt}} + 2{{n}}{^{3}{\rm{He}}} + {{n2d}} + $ $ {{2npd}} + {{2p3n}}$ . The threshold energy difference between the partial channels of the$ ^{27}{\rm{Al}}(\gamma,x)^{22}{\rm{Na}} $ reaction reaches 28.3 MeV, which is rather significant in estimating the bremsstrahlung gamma flux value used in the computation of the total average cross-section$ \langle{\sigma(E_{\gamma {\rm{max}}})}\rangle $ value.Nuclear reaction $ E_{\rm{th}} $ /MeV

Product-nucleus $ T_{1/2} $ 

$ E_{\gamma} $ /keV

$ I_{\gamma} $ (%)

$^{27}{\rm{Al} }(\gamma,{n}\alpha)$ 

22.51 $ ^{22} {\rm{Na}}$ 

2.6019±0.0004 y 1274.53 99.944±0.014 $^{27}{\rm{Al} }(\gamma,{{dt} })$ 

40.10 $^{27}{\rm{Al} }(\gamma,{{npt} })$ 

42.33 $^{27}{\rm{Al} }(\gamma,{2n}{^3{\rm{He} } })$ 

43.09 $^{27}{\rm{Al} }(\gamma,{{n2d} })$ 

46.36 $^{27}{\rm{Al} }(\gamma,{{2npd} })$ 

48.58 $^{27}{\rm{Al} }(\gamma,{{2p3n} })$ 

50.81 $^{100}{\rm{Mo} }(\gamma,{{n} })$ 

8.29 99Mo 65.94±0.01 h 739.50 12.13±0.12 Table 1. Spectroscopic data from Ref. [16] for the product-nuclei from the reactions
$ ^{27}{\rm{Al}}(\gamma,x)^{22}{\rm{Na}} $ and$^{100}{\rm{Mo}}(\gamma,{n})^{99}{\rm{Mo}}$ .The difficulties in measuring the
$ ^{27}{\rm{Al}}(\gamma,x)^{22}{\rm{Na}} $ reaction are partially due to a long half-life of the$ ^{22}{\rm{Na}} $ nucleus ($ T_{1/2} $ = 2.6 years), that leads to the necessity of measuring the target activity for a long time. Under such conditions, consideration must be given to the contribution of the natural background lines to the spectrum of the induced activity spectrum of the sample. As indicated in Refs. [17, 18], the background spectrum exhibits a low-intensity line at an energy of$ \sim 1275$ keV, the contribution of which to$ \triangle A $ of the 1274.53 keV γ-line under study becomes essential at long-time measurement. In the experiment, several measurements of the natural background spectra were carried out at$ t_{\rm{meas}} $ = 72–96 h (for instance, see Fig. 2(b)). The background contribution to the reaction yield was estimated taking into account the measurement times of both the background spectra and the studied target spectra. In the spectra from the$ ^{27}{\rm{Al}} $ targets under study, the contribution of this background line was subtracted. Because the nature of the lines is the same, subtracting the background in this way is the correct procedure. The largest contribution of the background was observed in the spectra measured at low end-point bremsstrahlung gamma energies$ E_{ \gamma \max} $ , and decreased with increasing$ E_{ \gamma \max} $ . Hence, at energies of 90–95 MeV, the background contribution does not exceed 3%, for 60–70 MeV, the background contribution is approximately 8%–5%, and for energies 35–40 MeV, the contribution of background lines reaches 40%–20%.To obtain cross-sections of the reaction, it is necessary to know the exact value of the bremsstrahlung γ-flux on the target, which is usually calculated using the code GEANT4.9.2. Some factors of the experiment can trigger an error: geometric (displacement of the target center relative to the beam axis), inaccuracy of the irradiation dose, current, slight decrease in electron beam energy at long exposures, beam profile, etc. To control the irradiation parameters, targets-monitors are used, which are in the same conditions as the studied target.
The bremsstrahlung γ-flux monitoring by the
$ ^{100}{\rm{Mo}}(\gamma,{\rm{n}})^{99}{\rm{Mo}} $ reaction yield was performed by comparing the experimentally obtained average cross-section values with the computation data. To determine the experimental$ \langle{\sigma(E_{\gamma {\rm{max}}})}\rangle_{\rm{exp}} $ values, we have used the activity$ \triangle A $ for the γ-line of energy$ E_{\gamma} = 739.50 $ keV, and intensity$ I_{\gamma} $ = 12.13% (see Table 1). The average cross-section$ \langle{\sigma(E_{\gamma {\rm{max}}})}\rangle_{\rm{th}} $ values were computed with the cross-sections$ \sigma(E) $ from the TALYS1.95 code. The obtained normalization factor$ k = \langle{\sigma(E_{\gamma {\rm{max}}})}\rangle_{\rm{th}} / \langle{\sigma(E_{\gamma {\rm{max}}})}\rangle_{\rm{exp}} $ represents the deviation of the GEANT4.9.2-computed bremsstrahlung γ-flux from the real γ-flux incident on the target. According, we obtained k values, which varied within 1.08–1.15 (see Fig. 3), and were used to normalize the cross-sections for the studied reaction.
Figure 3. (color online) Flux-average cross-sections
$ \langle{\sigma(E_{\gamma {\rm{max}}})}\rangle $ for the reaction$^{100}{\rm{Mo}}(\gamma,{n})^{99}{\rm{Mo}}$ . Points are experimental data, curve is theoretical calculation using the TALYS1.95 code.We checked the possibility of using the calculated cross-section from TALYS1.95 for the
$^{100}{\rm{Mo}}(\gamma,{{n}})^{99}{\rm{Mo}}$ reaction. A comparison of the experimental cross-sections from [19] with the calculated ones is presented in Fig. 4(a). Using the calculation according to TALYS1.95 and the values of the Lorentz function with free parameters (approximation of the experimental data), we calculated the average cross-sections in the energy range$ E_{\gamma \max} $ = 35–95 MeV for the flux of bremsstrahlung γ-quanta for the real conditions of the experiment (see Fig. 4(b)). The difference between the calculated and experimental average cross-sections in the studied energy range is 1.0%–1.5%.
Figure 4. (color online) (a) The experimental values of the cross-section
$ \sigma(E) $ for the reaction$^{100}{\rm{Mo}}(\gamma,{{n}})^{99}{\rm{Mo}}$ [19], together with their representations by lines calculated using the TALYS1.95 code and the Lorentz function. (b) The flux-average cross-sections$ \langle{\sigma(E_{\gamma {\rm{max}}})}\rangle $ for the reaction$^{100}{\rm{Mo}}(\gamma,{{n}})^{99}{\rm{Mo}}$ calculated using$ \sigma(E) $ from the TALYS1.95 code and the Lorentz function.The Ta-converter and Al-absorber, which were used in the experiment, generate the neutrons that can cause the reaction
$^{100}{\rm{Mo}}({n},{2n})^{99}{\rm{Mo}}$ . Calculations were made for the neutron energy spectrum and the fraction of neutrons of energies above the threshold of this reaction, similar to [20]. The contribution of the$^{100}{\rm{Mo}}({n},{2n})^{99}{\rm{Mo}}$ reaction to the induced activity of the$ ^{99}{\rm{Mo}} $ nucleus was estimated and has been determined to be negligible compared to the contribution of$^{100}{\rm{Mo}}(\gamma,{n})^{99}{\rm{Mo}}$ . The contribution of the reaction$^{100}{\rm{Mo}}(\gamma,{p})^{99}{\rm{Nb}}$ ,$ ^{99}{\rm{Nb}} \xrightarrow{\beta^-} $ $ ^{99}{\rm{Mo}} $ is also negligible.The accuracy of average cross-sections measurements was determined as a quadratic sum of statistical and systematic errors. The statistical error of the observed γ-line is mainly owing to the statistical calculation, and is estimated to vary within 3%–20%.
The systematic errors in the common case originate from the uncertainties associated with the uncertainties of: 1) the exposure time (0.5%), 2) electron current (0.5%), 3) γ-radiation detection efficiency,
$\sim 2$ –3%, which is mainly attributed to the uncertainties of gamma radiation sources and data approximation, and 4) normalization of experimental data to the monitoring reaction yield$^{100}{\rm{Mo}}(\gamma,{n})^{99}{\rm{Mo}}$ , up to 5%.It should be noted that the systematic error in the yield monitoring of the
$^{100}{\rm{Mo}}(\gamma,{n})^{99}{\rm{Mo}}$ reaction stems from three unavoidable errors, each running to$\sim 1$ %. These are the unidentified isotopic composition of natural molybdenum, uncertainty in the γ-line intensity used,$ I_{\gamma} $ [16], and statistical error in determining the area under the normalizing γ-line peak. In our calculations we have used the percentage value of$ ^{100}{\rm{Mo}} $ isotope abundance equal to 9.63% (see Ref. [14]).Hence, the experimental error of the obtained data ranges between 6% and 8%, except for the low-energy case, where the error may amount to
$\sim 17\%-20\%$ . -
The total and partial cross-sections
$ \sigma(E) $ of the$ ^{27}{\rm{Al}}(\gamma,x)^{22}{\rm{Na}} $ reaction were computed for the monochromatic photons with the TALYS1.95 code [10], set in Linux Ubuntu-20.04. The computations were performed for different level density (LD) models. TALYS1.95 includes three phenomenological level density models and three options for microscopic level densities:$ LD 1 $ : Constant temperature + Fermi gas model;$ LD 2 $ : Back-shifted Fermi gas model;$ LD 3 $ : Generalized superfluid model;$ LD 4 $ : Microscopic level densities (Skyrme force) from Goriely’s tables;$ LD 5 $ : Microscopic level densities (Skyrme force) from Hilaire’s combinatorial tables;$ LD 6 $ : Microscopic level densities (temperature dependent HFB, Gogny force) from Hilaire’s combinatorial tables.The TALYS1.95-computed cross-sections
$ \sigma(E) $ were then averaged over the bremsstrahlung flux$ W(E,E_{\gamma {\rm{max}}}) $ in the energy range from the threshold energy of a certain reaction channel,$ E_{\rm{th}} $ , up to the maximum energy of the bremsstrahlung gamma spectrum,$ E_{\gamma {\rm{max}}} = $ 35–95 MeV. Thus, the flux-averaged cross-section values were computed by the following expression:$ \begin{equation} \langle{\sigma(E_{\gamma {\rm{max}}})}\rangle = \frac {\displaystyle\int\nolimits_{E_{\rm{th}}}^{E_{\gamma {\rm{max}}}}\sigma(E)\cdot W(E,E_{\gamma {\rm{max}}}) {\rm d} E} {\displaystyle\int\nolimits_{E_{\rm{th}}}^{E_{\gamma {\rm{max}}}}W(E,E_{\gamma {\rm{max}}}) {\rm d} E}. \end{equation} $

(1) The
$ \langle{\sigma(E_{\gamma {\rm{max}}})}\rangle $ values, calculated in this way, were compared with the experimental average cross-sections, which were determined from the expression:$ {\sigma(E_{\gamma {\rm{max}}})}\rangle = \frac{\lambda \triangle A}{N_x I_{\gamma} \ \varepsilon \Phi(E_{\gamma {\rm{max}}}) (1 - {\rm e}^{(-\lambda t_{\rm{irr}})}) {\rm e}^{(-\lambda t_{\rm{cool}})}(1 - {\rm e}^{(-\lambda t_{\rm{meas}})})}, $

(2) where
$ \triangle A $ is the number of counts of γ-quanta in the full absorption peak (for the γ-line of the investigated reaction),${\rm{\Phi}}(E_{\gamma {\rm{max}}}) = {\displaystyle\int\nolimits_{E_{\rm{th}}}^{E_{\gamma {\rm{max}}}}W(E,E_{\gamma {\rm{max}}}){\rm d}E}$ is the sum of bremsstrahlung quanta in the energy range from the reaction threshold$ E_{\rm{th}} $ up to$ E_{\gamma {\rm{max}}} $ ,$ N_x $ is the number of target atoms,$ I_{\gamma} $ is the intensity of the analyzed γ-quanta, ε is the absolute detection efficiency for the analyzed γ-quanta energy, λ is the decay constant ($ {\rm{ln}}2/T_{1/2} $ );$ t_{\rm{irr}} $ ,$ t_{\rm{cool}} $ and$ t_{\rm{meas}} $ represent the irradiation time, cooling time, and measurement time, respectively. From Eqs. (1) and (2), it is evident that the average cross-section$ \langle{\sigma(E_{\gamma {\rm{max}}})}\rangle $ value is dependent on both the bremsstrahlung flux energy distribution and the reaction threshold energy$ E_{\rm{th}} $ .The TALYS1.95 computation data on the total cross-sections with different level density models LD 1–6 are presented in Fig. 5. It can be observed from the figure that the difference between the reaction cross-sections computed by different models reaches a factor of 2 in the vicinity of the cross-section maximum (
$ \sim \;32$ MeV). Note that the cross-section values at photon energies higher than 50 MeV differ insignificantly, except the LD6 case, where the computed value is significantly lower ($\sim \,30$ %). Hence, in the LD 1–6 models, the relationship among different partial channels of the$ ^{27}{\rm{Al}}(\gamma,x)^{22}{\rm{Na}} $ reaction is substantially different.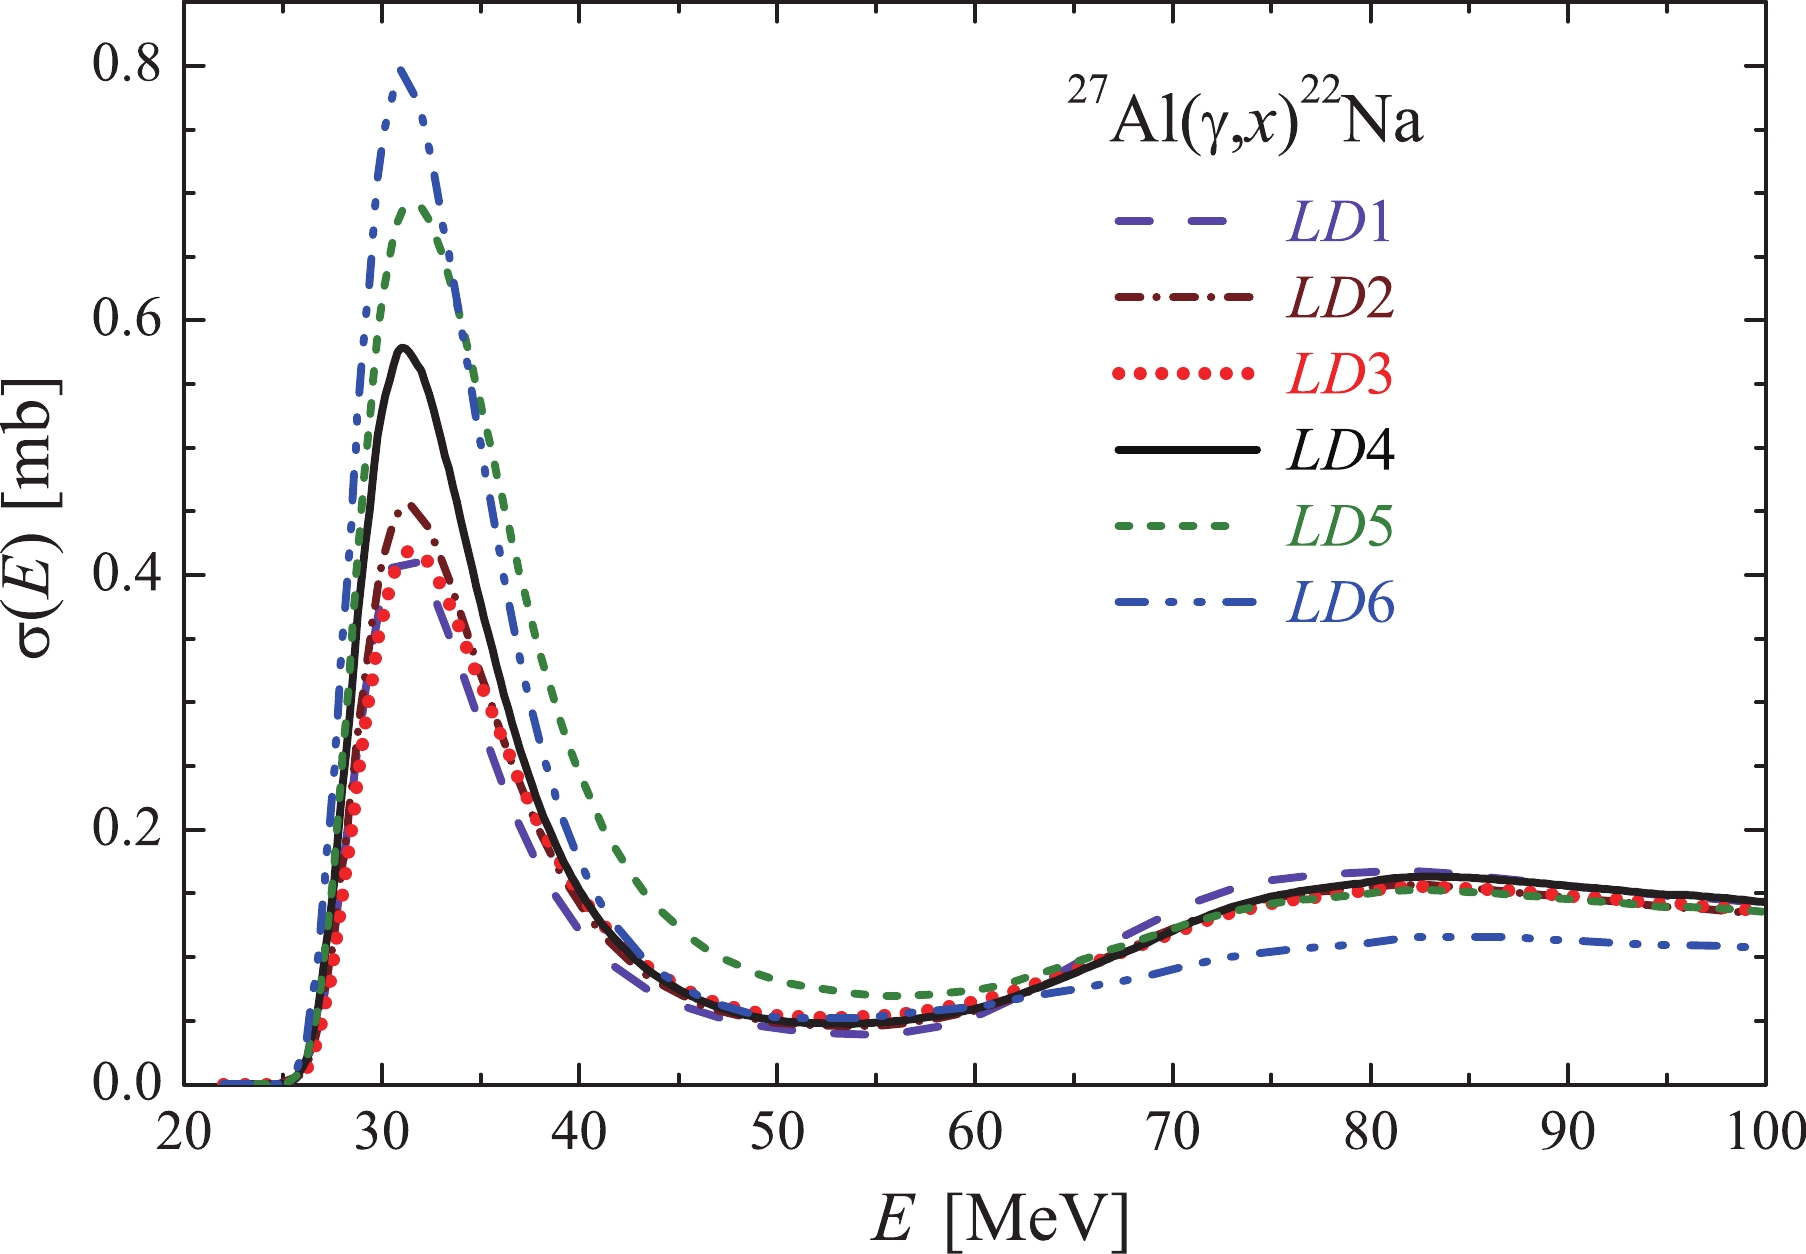
Figure 5. (color online) Total cross-sections
$ \sigma(E) $ for$ ^{22}{\rm{Na}} $ production in the$ ^{27}{\rm{Al}}(\gamma,x)^{22}{\rm{Na}} $ reaction. Computations were made in the TALYS1.95 code with different level density models LD 1–6.The computations for different level densities are distinguished by the contribution of the dominant
$(\gamma,{{n}}\alpha)$ channel to the total reaction cross-section, which manifests itself in the energy region between 25 and 45 MeV. With variations in the level density model from$ LD 1$ to$ LD 6$ , the part of this contribution increases.Although the
$ ^{27}{\rm{Al}}(\gamma,x)^{22}{\rm{Na}} $ total cross-sections values are close for LD 1,2,3, they are significantly different for$LD \;4,5,6$ . Hereinafter, to avoid overloading the figures, we show only the LD1 values instead of the computations by the models LD 1,2,3.As an example, Fig. 6 shows the total and partial cross-sections
$ \sigma(E) $ for the$ ^{27}{\rm{Al}}(\gamma,x)^{22}{\rm{Na}} $ reaction, obtained in the TALYS1.95 code with the LD1 model. The same cross-sections, but averaged over the bremsstrahlung gamma flux, are illustrated in Fig. 7. Note that for calculations of the total flux-averaged cross-section for the reaction under study, it is necessary to add up the average partial cross-sections, each of which is calculated by Eq. (1) with its own threshold$ E_{\rm{th}} $ .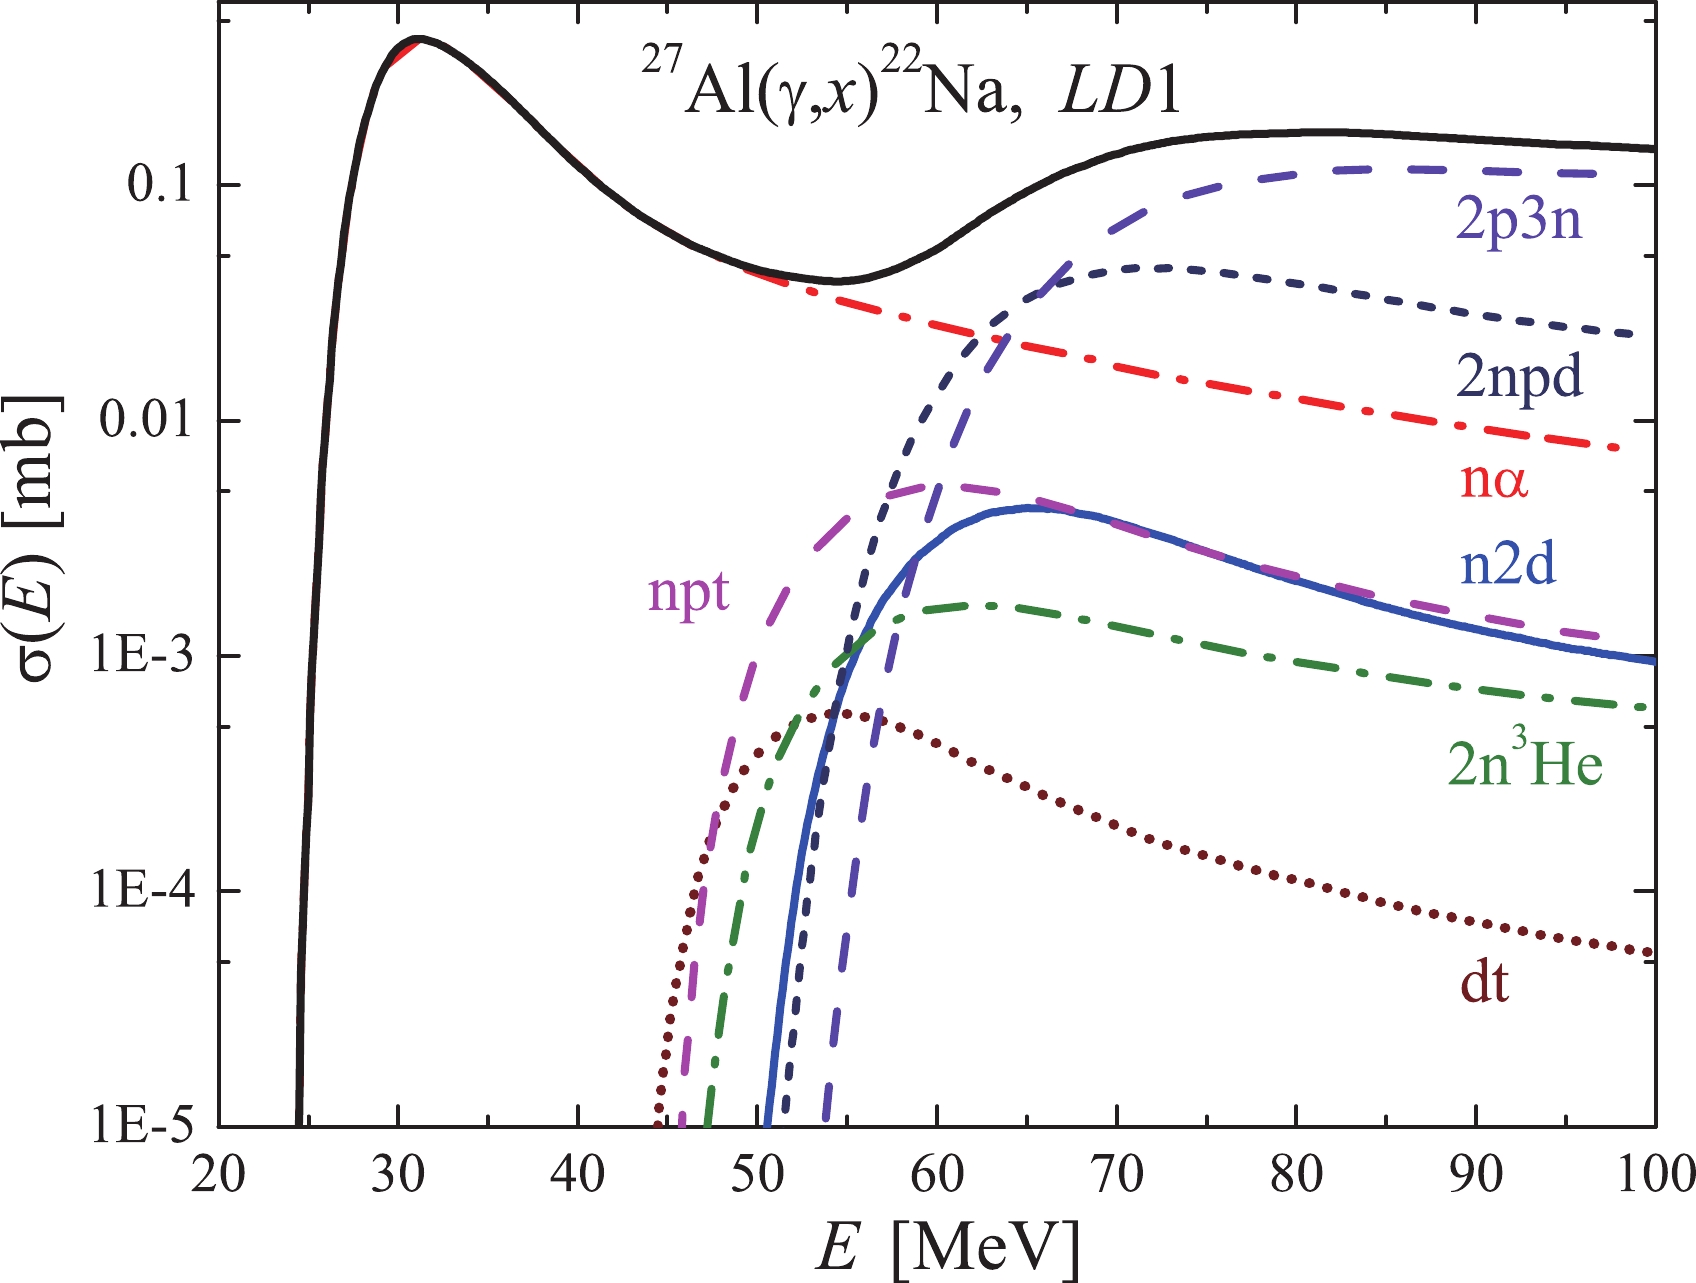
Figure 6. (color online) Cross-sections
$ \sigma(E) $ for$ ^{22}{\rm{Na}} $ production in the$ ^{27}{\rm{Al}}(\gamma,x)^{22}{\rm{Na}} $ reaction, computed with the TALYS1.95 code for the$ LD 1 $ model: total cross-section is black solid curve, and partial cross-section are colored ones.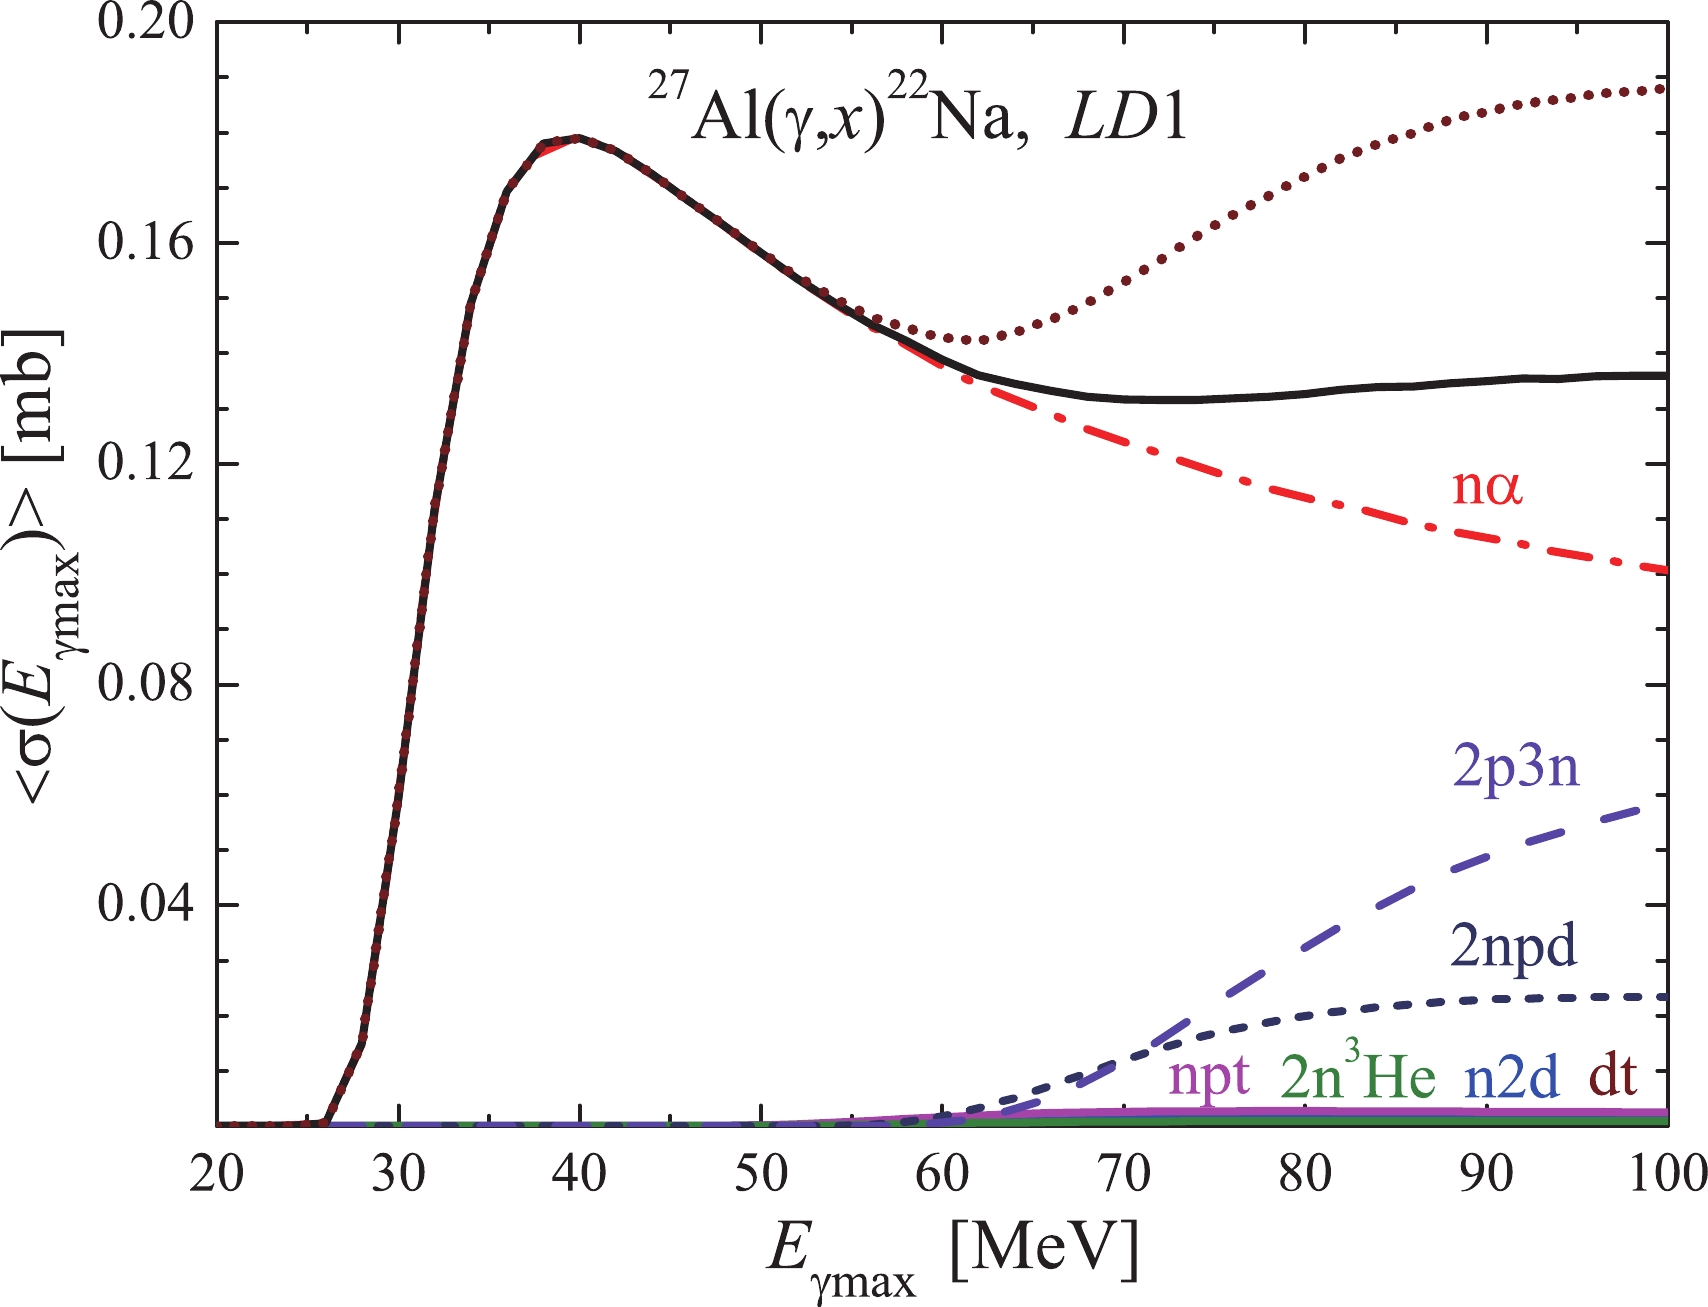
Figure 7. (color online) Flux-averaged cross-sections
$\langle{\sigma(E_{{\gamma {\rm{max}}}})}\rangle$ for$LD 1$ . The total average cross-section is shown in two calculation variants: as a sum of average partial cross-sections with its own$E_{\rm{th}}$ (brown dotted curve), and the total bremsstrahlung flux-averaged cross-section$\sigma(E)$ with$E_{\rm{th}}=$ 22.51 MeV (black solid curve).The calculation data presented in Figs. 5 to 7 demonstrate that for both
$ \sigma(E) $ and flux-averaged$ \langle{\sigma(E_{\gamma {\rm{max}}})}\rangle $ cross-sections, at energies ranging up to 60 MeV, it is the$(\gamma, {n}\alpha)$ reaction channel that is dominant, while at energies above 70 MeV, the contribution of the$(\gamma, {{2p3n}})$ and$(\gamma, {{2npd}})$ reaction cross-sections becomes noticeable. In both cases of the calculated cross-sections,$ \sigma(E) $ and$ \langle{\sigma(E_{\gamma {\rm{max}}})}\rangle $ , the contribution of the$(\gamma, {{2p3n}})$ channel substantially alters the behavior of the energy dependence. Consequently, the characteristic minimum is formed in the total cross-section in the energy range between 50 and 60 MeV.We now draw your attention to two different variants for the calculation of the
$ ^{27}{\rm{Al}}(\gamma,x)^{22}{\rm{Na}} $ total average cross section$ \langle{\sigma(E_{\gamma {\rm{max}}})}\rangle $ , as presented in Fig. 7. One of them (brown dotted curve) was performed as a sum of partial average cross sections, each being calculated with its own reaction threshold$ E_{\rm{th}} $ . The black solid curve shows the total average cross-section$ \langle{\sigma(E_{\gamma {\rm{max}}})}\rangle $ obtained using the bremsstrahlung flux-averaged total cross section$ \sigma(E) $ , taken from the minimal reaction threshold$ E_{\rm{th}} $ = 22.51 MeV. This calculation is in principle incorrect, because Eq. (1) calls for substitution of different reaction thresholds$ E_{\rm{th}} $ for each partial cross-section. As observed in Fig. 7, there is a considerable difference between the two total average cross-sections$ \langle{\sigma(E_{\gamma {\rm{max}}})}\rangle $ after 60 MeV.Experimentally, for average cross-section determination, the flux value calculated from
$ E_{\rm{th}} $ up to$ E_{\gamma {\rm{max}}} $ (Eq. (2)) is adopted. In case of a few reaction thresholds, several different fluxes will emerge, which must be considered in Eq. (2). To calculate the correct$ \langle{\sigma(E_{\gamma {\rm{max}}})}\rangle $ value, a special correction factor ($ RK(E_{\gamma {\rm{max}}}) $ ) should be introduced. This factor is defined as the ratio of two averaged cross-sections (see brown dotted and black solid curves in Fig. 7): one calculated as a sum of average partial cross-sections with proper thresholds$ E_{\rm{th}} $ for each reaction channel, and the other – the total cross-section$ \sigma(E) $ averaged for$ E_{\rm{th}} $ = 22.51 MeV. Note that for each model of LD 1–6, the factor$ RK(E_{\gamma {\rm{max}}}) $ values differ, because the ratios of contributions from different reaction channels are not the same.It is evident from Fig. 7 that the correct calculation of the total average cross-section results in its additional increase at energies beyond 65 MeV, which is owing to the reduction in the gamma-flux value in the numerator of Eq. (1) for high threshold reactions.
It is evident that the dependence of the
$ \langle{\sigma(E_{\gamma {\rm{max}}})}\rangle $ value on the reaction threshold complicates the procedure of experimental cross-section determination. This situation occurs only for multiparticle reactions with charged particle yields. In the case of photoneutron reactions, the threshold is uniquely determined, and the average cross-sections are calculated correctly.To represent the experimental photonuclear reaction data, the average cross-section per equivalent photon is also adopted. It is determined, similar to Ref. [9], by the expression
$ \begin{equation} \langle{\sigma(E_{\gamma {\rm{max}}})}_{Q}\rangle = E_{\gamma {\rm{max}}}\frac {\displaystyle\int\nolimits_{0}^{E_{\gamma {\rm{max}}}}\sigma(E) \cdot W(E,E_{\gamma {\rm{max}}}){\rm d}E} {\displaystyle\int\nolimits_{0}^{E_{\gamma {\rm{max}}}}E\cdot W(E,E_{\gamma {\rm{max}}}){\rm d} E}. \end{equation} $

(3) The comparison between two types of the average cross-sections shows the advantage of using
$\langle{\sigma(E_{\gamma {\rm{max}}})_{Q}}\rangle$ in the case in which, at a certain$ E_{\gamma {\rm{max}}} $ value, several reaction channels with different thresholds$ E_{\rm{th}} $ appear. The calculation of this experimental value needs no correction. Hence, to level out the influence of different thresholds, the experimental average cross-sections$ \langle{\sigma(E_{\gamma {\rm{max}}})}\rangle $ must be corrected using a specially calculated$ RK(E_{\gamma {\rm{max}}}) $ factor. -
Figure 8 presents the data on the total average cross section
$ \langle{\sigma(E_{\gamma {\rm{max}}})}\rangle $ for the$ ^{27}{\rm{Al}}(\gamma,x)^{22}{\rm{Na}} $ reaction, which were obtained both experimentally and computationally (with the TALYS1.95 code). For the$ \langle{\sigma(E_{\gamma {\rm{max}}})}\rangle $ calculations by Eqs. (1) and (2), we have chosen the threshold energy of the dominant$^{27}{\rm{Al}}(\gamma,{n}\alpha)^{22}{\rm{Na}}$ channel,$ E_{\rm{th}} $ = 22.51 MeV.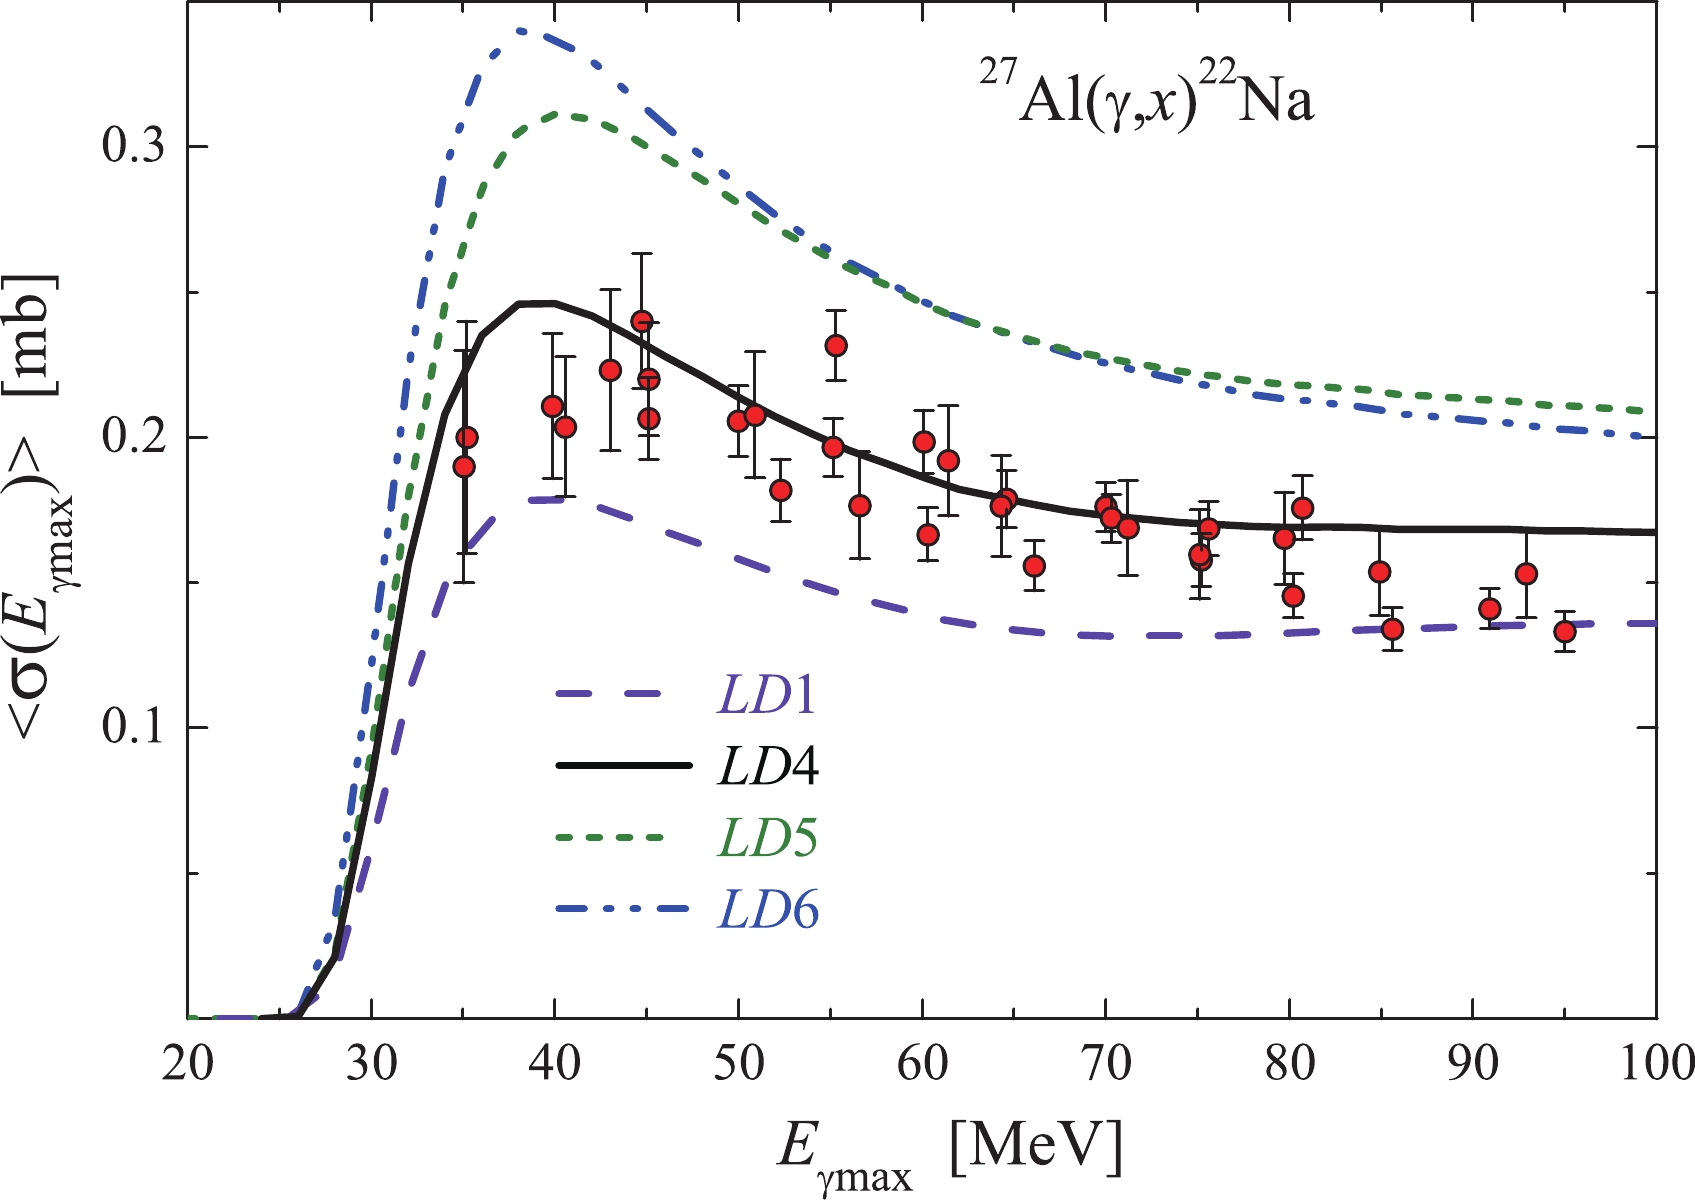
Figure 8. (color online) Total average cross-sections
$\langle{\sigma(E_{{\gamma {\rm{max}}}})}\rangle$ for the reaction$^{27}\text{Al}(\gamma,\textit{x})^{22}\text{Na}$ , calculated with the threshold$E_{ {\rm{th}}}$ = 22.51 MeV: red points – our data; the curves represent the computations by the TALYS1.95 code with the models LD 1, 4, 5, 6.The experimental
$ \langle{\sigma(E_{\gamma {\rm{max}}})}\rangle $ values at energies ranging from 45 MeV to 80 MeV are closest to the values computed by the version with the$ LD4 $ model, while at energies of 35–40 MeV and above 80 MeV, the obtained experimental data lie between the computed$ LD1 $ (coincide with$ LD2,3 $ ) and$ LD4 $ curves. The values calculated with the$ LD 5 $ and$ LD 6 $ models are systematically found above the experimental data.Figure 9 shows the total average cross-sections determined via two calculation variants: one, calculated as a sum of average partial cross-sections (brown dotted curve); and the other, the bremsstrahlung flux-averaged total cross-section
$ \sigma(E) $ with$ E_{\rm{th}} $ = 22.51 MeV (black solid curve). As can be observed, the$ RK(E_{\gamma {\rm{max}}}) $ factor is equal to 1 at low energies, but beginning with 55 MeV, it smoothly increases with the energy$ E_{\gamma {\rm{max}}} $ , reaching 1.27 at 95 MeV for the$ LD 4 $ model. As mentioned above, the$ RK(E_{\gamma {\rm{max}}}) $ value varies depending on the level density model. Its growth rate is maximal for the model$ LD 1 $ (reaching 1.35 at 95 MeV), falls off with an increase in the model number, and equals 1.16 for the$ LD 6 $ model (at 95 MeV).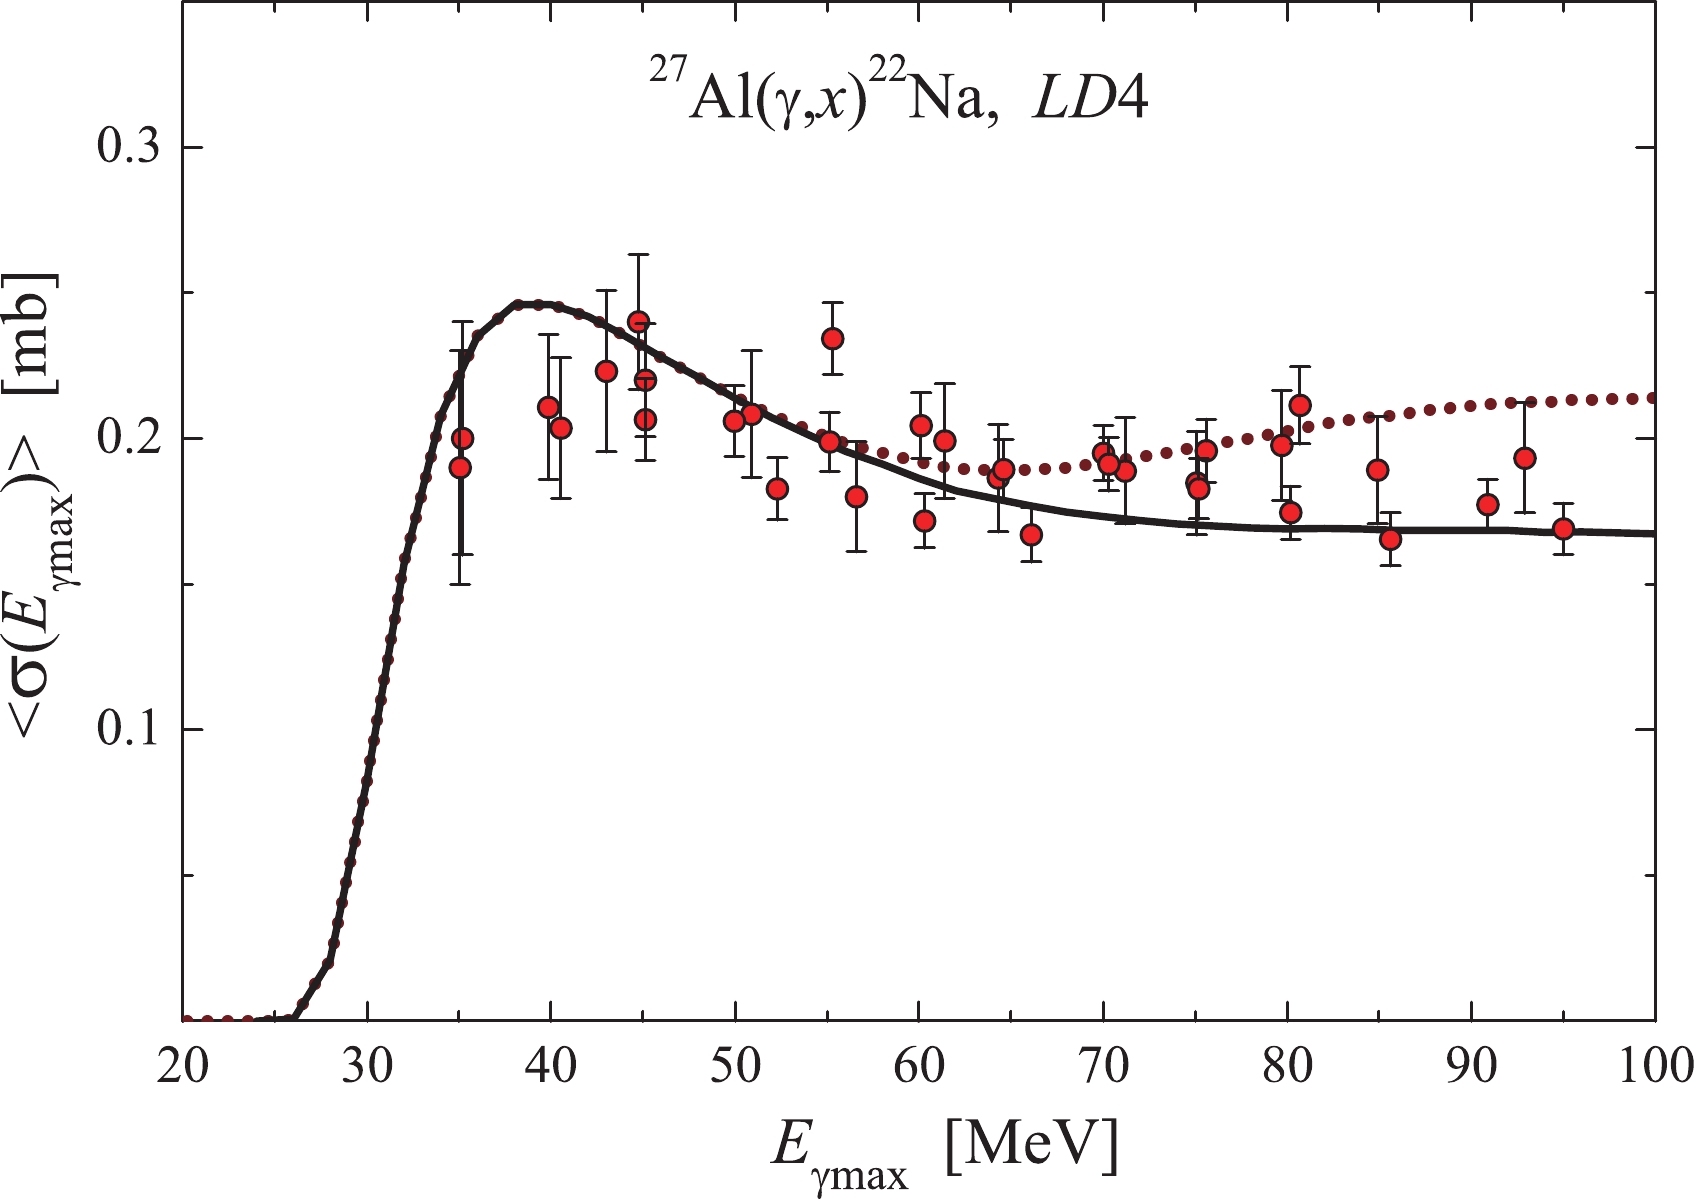
Figure 9. (color online) Total average cross-sections
$\langle{\sigma(E_{{\gamma {\rm{max}}}})}\rangle$ for the reaction$^{27}\text{Al}(\gamma,\textit{x})^{22}\text{Na}$ . The TALYS1.95 (LD4) computations were performed for$E_{\rm{th}}$ = 22.51 MeV (black solid curve), and as a sum of partial average cross-sections (brown dotted curve). The points representing the experimental data have been corrected for the$RK(E_{{\gamma {\rm{max}}}})$ factor for the level density model LD4.The experimental data were multiplied by the
$ RK(E_{\gamma {\rm{max}}}) $ factor for the calculation variant$ LD 4 $ , and are given in Fig. 9. As observed in the figure, the experimental$ \langle{\sigma(E_{\gamma {\rm{max}}})}\rangle $ values lie close to the brown dotted curve. The experimental points at energies lower than 40 MeV and higher than 80 MeV are found somewhat below the mentioned curve. It must be emphasized that the correct experimental data are the ones obtained with the application of the$ RK(E_{\gamma {\rm{max}}}) $ factor, and shown in Fig. 9. -
The experimental data available in the literature on the
$ ^{27}{\rm{Al}}(\gamma,x)^{22}{\rm{Na}} $ reaction were obtained in terms of the average cross-section per equivalent photon, Refs. [8, 9]. For comparison with those data, we have also represented our present results in the form of$\langle{\sigma(E_{\gamma {\rm{max}}})_{Q}}\rangle$ in accordance to Eq. (3).Figure 10 shows the experimental values of the total average cross-section
$\langle{\sigma(E_{\gamma {\rm{max}}})_{Q}}\rangle$ for the$ ^{27}{\rm{Al}}(\gamma,x)^{22}{\rm{Na}} $ reaction, including the data computed using the codes TALYS1.95 and GEANT4.9.2. As in the case of the average cross-section$ \langle{\sigma(E_{\gamma {\rm{max}}})}\rangle $ , the experimental$\langle{\sigma(E_{\gamma {\rm{max}}})_{Q}}\rangle$ values lie between the calculated curves for the$ LD 1 $ and 4 models.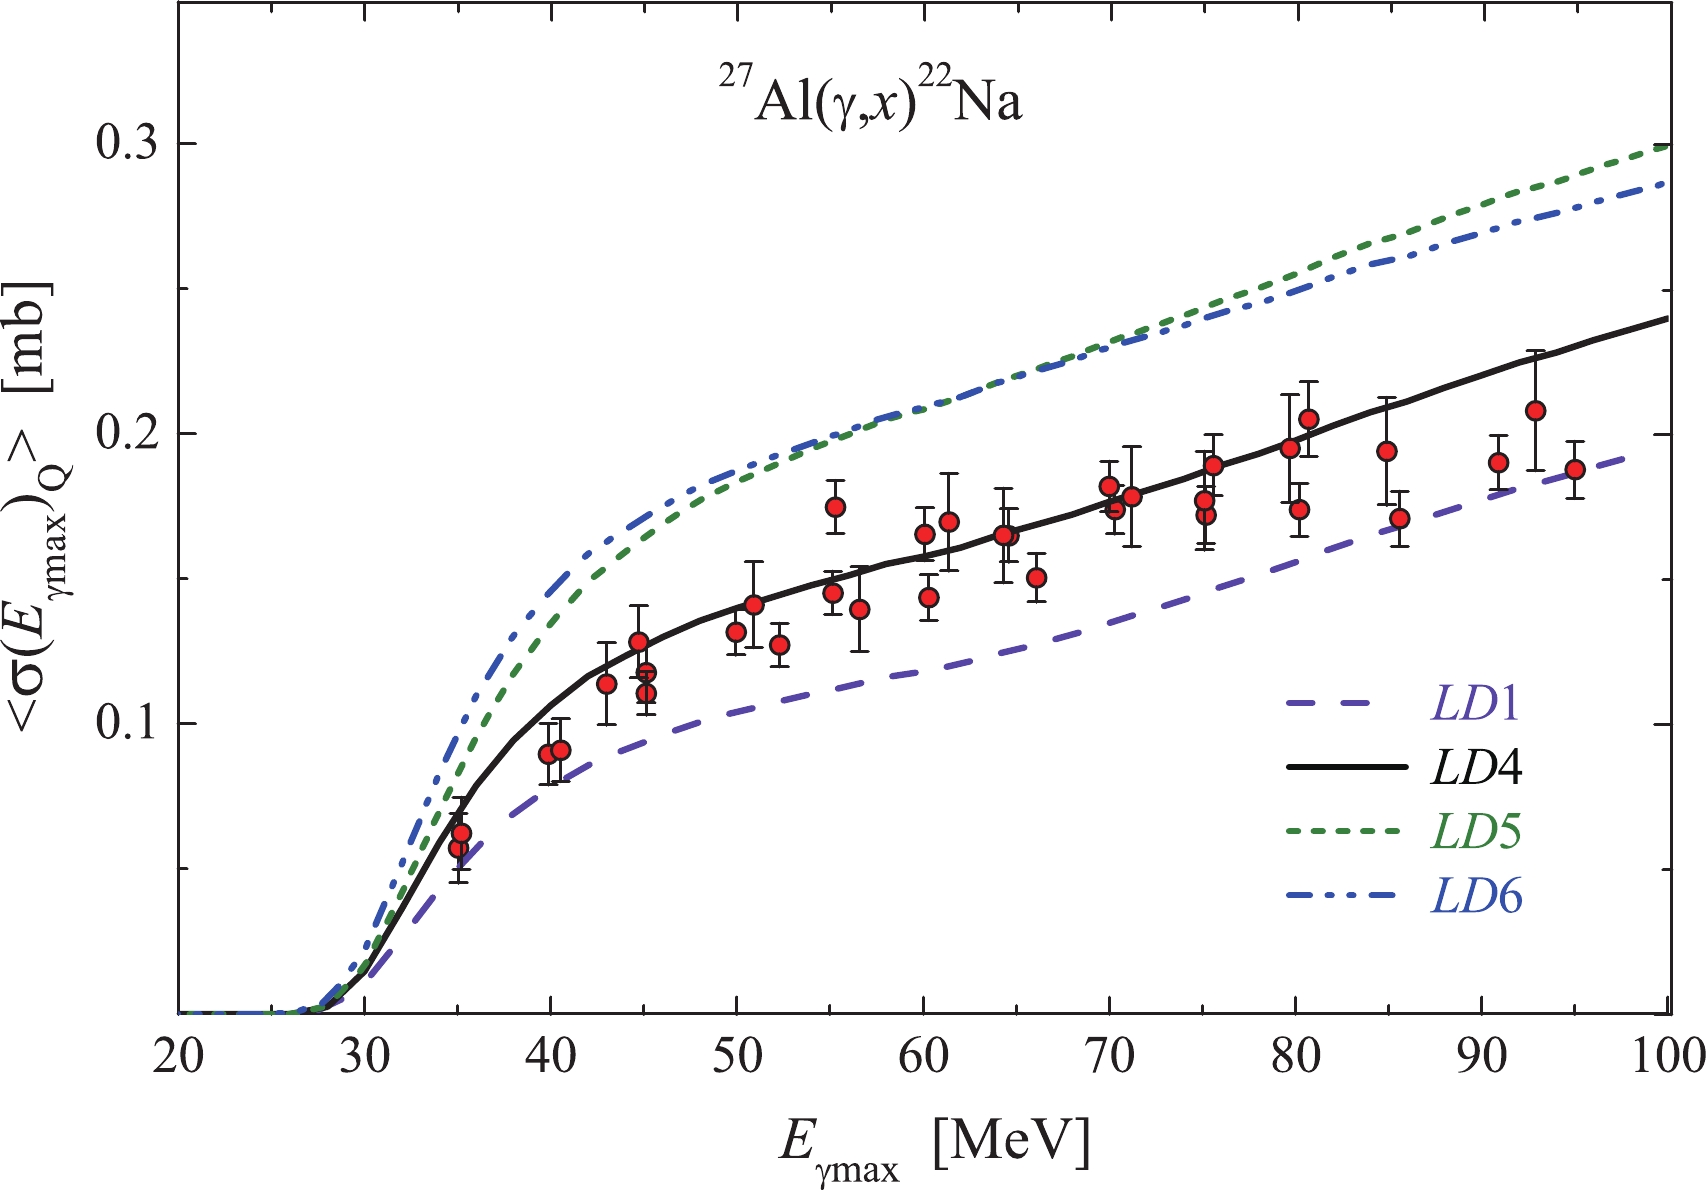
Figure 10. (color online) Total cross-sections per equivalent photon
$\langle{\sigma(E_{\gamma {\rm{max}}})_{Q}}\rangle$ for the$ ^{27}{\rm{Al}}(\gamma,x)^{22}{\rm{Na}} $ reaction. Red points – experimental values; the curves show the TALYS1.95 computations for LD 1, 4, 5, 6 models.Figure 11 shows the experimental
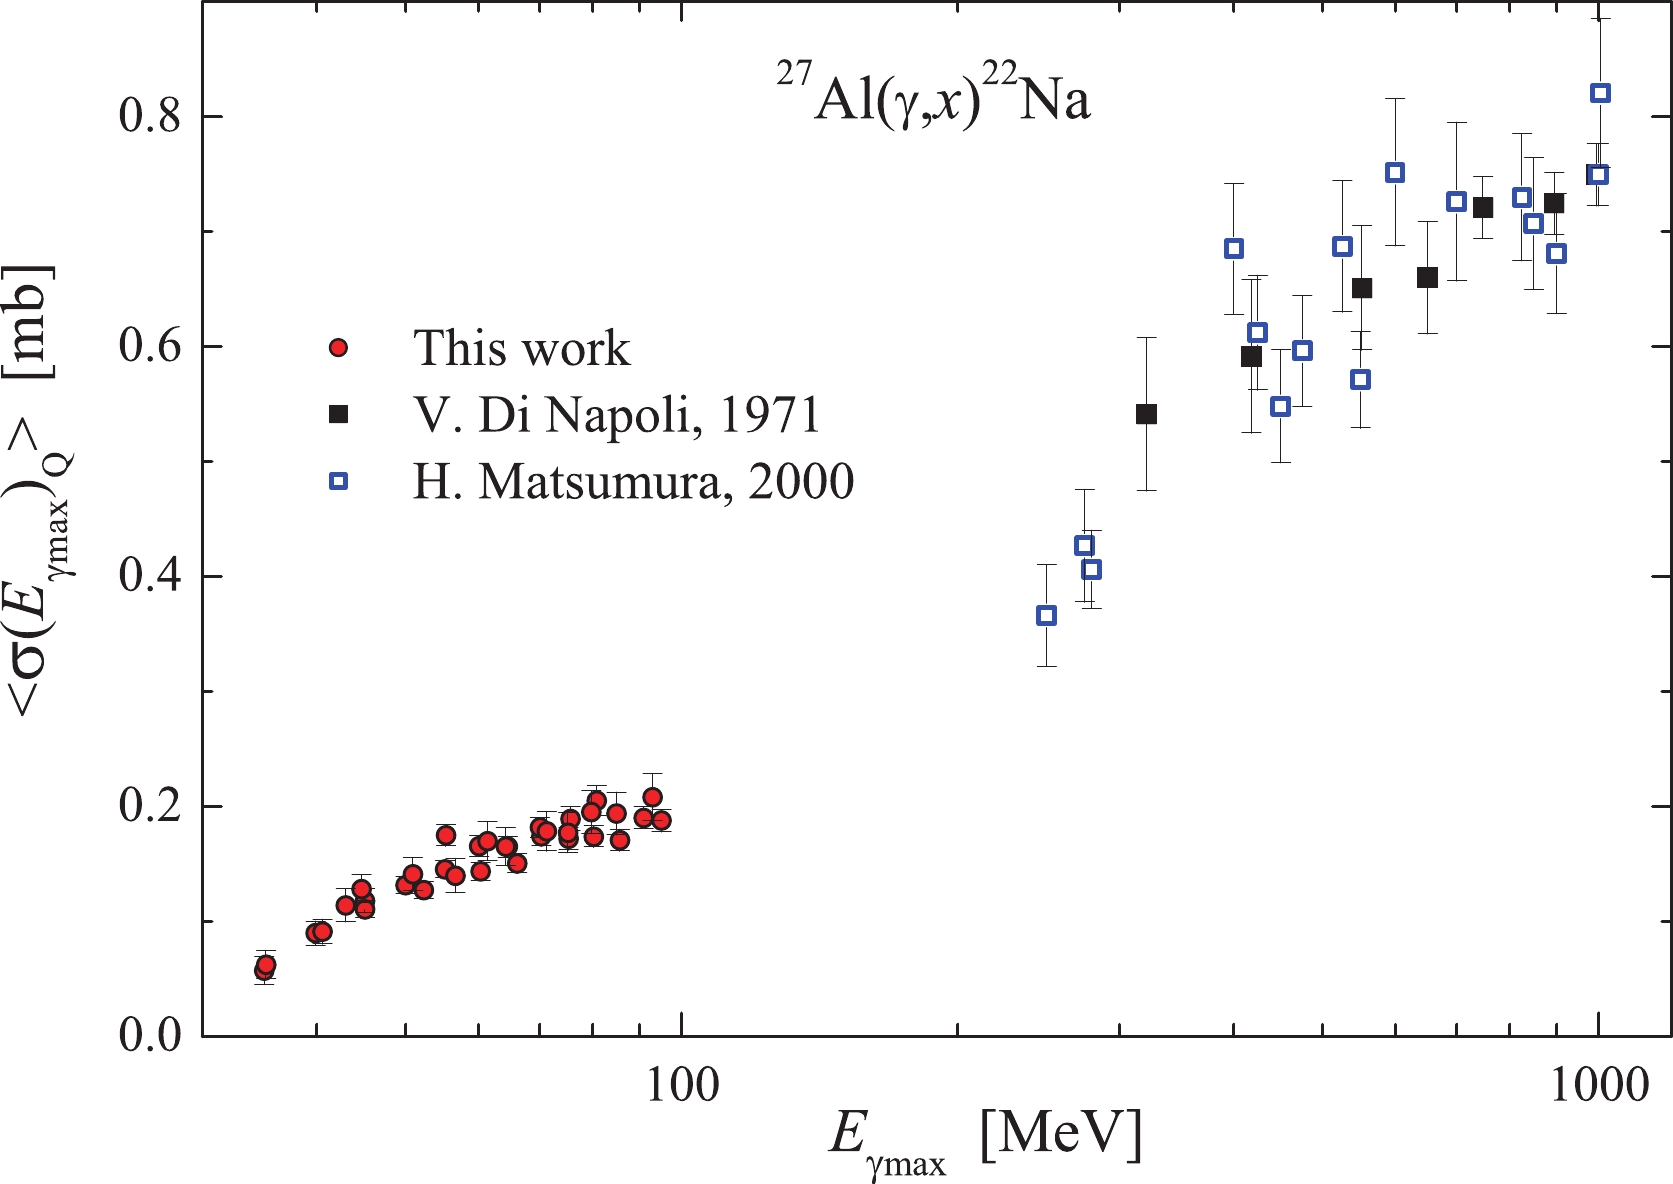
$\langle{\sigma(E_{\gamma {\rm{max}}})_{Q}}\rangle$ data obtained in Refs. [8, 9] at gamma-ray energies ranging from 250 to 1000 MeV. Our present results are an addition to the data of [8, 9] for the 35–95 MeV range.All experimental data available for the reaction
$ ^{27}{\rm{Al}}(\gamma,x)^{22}{\rm{Na}} $ demonstrate that on a semilogarithmic scale, the behavior of$\langle{\sigma(E_{\gamma {\rm{max}}})_{Q}}\rangle$ as a function of energy exhibits a more complex structure as opposed to the linear dependence, previously assumed in Ref. [8] for the energy range from 320 to 1000 MeV. This is owing to the change in the mechanism of gamma-quanta interaction with the nucleus at different energy intervals. Note that for the multiparticle photonuclear reaction$^{27}{\rm{Al}}(\gamma,x;x = {^3{\rm{He}}} + {pd} + {2pn})^{24}{\rm{Na}}$ the linear energy dependence of$\langle{\sigma(E_{\gamma {\rm{max}}})_{Q}}\rangle$ had also been presumed within the range 300–1000 MeV; however, the analysis for a wider energy interval has pointed to its more complicated character [4, 8]. -
This study focused on the first measurements of the total average cross-sections
$ \langle{\sigma(E_{\gamma {\rm{max}}})}\rangle $ , and the cross-sections per equivalent photon$\langle{\sigma(E_{\gamma {\rm{max}}})_{Q}}\rangle$ for the multichannel reaction$^{27}{\rm{Al}}(\gamma,x;x = {\rm{n}}\alpha + {{dt}} + {{npt}} + 2{{n}}{^{3}{\rm{He}}} + $ $ {{2nd}} + {{2npd}} + {{2p3n}})^{22}{\rm{Na}}$ in the energy range$ E_{\gamma {\rm{max}}} $ = 35–95 MeV, using the induced γ-activity method. The bremsstrahlung gamma-quantum flux was computed in the GEANT4.9.2 code, and in addition, it was monitored using the$^{100}{\rm{Mo}}(\gamma,{n})^{99}{\rm{Mo}}$ reaction yield. The obtained$\langle{\sigma(E_{\gamma {\rm{max}}})_{Q}}\rangle$ values were compared with the data of other laboratories.The partial cross-sections
$ \sigma(E) $ for the reaction under study were calculated using the TALYS1.95 code for six variants of the level density model (3 phenomenological level density models and 3 options for microscopic level densities) – LD 1–6.It has been demonstrated that at energies up to 60 MeV, the dominant contribution comes from
$^{27}{\rm{Al}}(\gamma, $ $ { {n}}\alpha)^{22}{\rm{Na}}$ , whereas at 70–95 MeV, the$^{27}{\rm{Al}}(\gamma,{2p3n})$ and$^{27}{\rm{Al}}(\gamma,{2npd})$ reactions also contribute essentially. The threshold difference between$^{27}{\rm{Al}}(\gamma,{{n}}\alpha)$ and$^{27}{\rm{Al}}(\gamma,{{2p3n}})$ reactions amounts to 28.3 MeV. This allows us to investigate the relative contribution of different$^{27}{\rm{Al}}(\gamma, $ $ x)^{22}{\rm{Na}}$ reaction channels over different energy ranges.In the case of the multiparticle reaction with charged particles in the outlet channel, such as the
$ ^{27}{\rm{Al}}(\gamma,x)^{22}{\rm{Na}} $ reaction, the correct calculation of the total average cross-sections$ \langle{\sigma(E_{\gamma {\rm{max}}})}\rangle $ was provided via their computation with the TALYS1.95 code as a sum of partial average cross-sections, each having been calculated with its own reaction threshold$ E_{\rm{th}} $ . The experimental$ \langle{\sigma(E_{\gamma {\rm{max}}})}\rangle $ values were calculated by averaging the cross-sections over the bremsstrahlung flux taken from the minimum threshold$ E_{\rm{th}} $ = 22.51 MeV, and then correcting the obtained values for the corresponding$ RK(E_{\gamma {\rm{max}}}) $ factor. The$ RK(E_{\gamma {\rm{max}}}) $ value was defined as the ratio of two averaged cross-sections: one, calculated as a sum of average partial cross-sections with proper thresholds$ E_{\rm{th}} $ for each reaction channel, and the other, the total cross-section$ \sigma(E) $ averaged for$ E_{\rm{th}} $ = 22.51 MeV.The use of the
$ \langle{\sigma(E_{\gamma {\rm{max}}})}\rangle $ value permits a more detailed consideration of the bremsstrahlung gamma energy dependence of the cross-section, because it is insensitive to the low-energy part of the bremsstrahlung spectrum. However, the cross-sections per equivalent quantum$ \langle{\sigma(E_{\gamma {\rm{max}}})_{\rm{Q}}}\rangle $ are proportional to the reaction yield and always increase with the increasing end-point bremsstrahlung energy$ E_{\gamma {\rm{max}}} $ . The most significant flaw of the representation of cross-sections per equivalent quantum$\langle{\sigma(E_{\gamma {\rm{max}}})_{Q}}\rangle$ is the influence of bremsstrahlung quanta with energies below the threshold of the reaction under study.The results of the present work may be considered as a beneficial addition to the data available in the literature for the energy range of 35–95 MeV.
-
The authors would like to thank the staff of the linear electron accelerator LUE-40 NSC KIPT, Kharkiv, Ukraine, for their cooperation in the realization of the experiment.
Cross-sections for the 27Al(γ, x)22Na multichannel reaction with the 28.3 MeV difference of reaction thresholds
- Received Date: 2021-12-19
- Available Online: 2022-06-15
Abstract: The bremsstrahlung flux-averaged cross-sections


 Abstract
 HTML
HTML Reference
 Related
 PDF
PDF






 DownLoad: