


 Abstract
 HTML
HTML Reference
 Related
 PDF
PDF


-
Rhenium (Re) metal is a high-temperature corrosion-resistant material, and its boron-based alloys are effective neutron absorbers used in the regulation of nuclear reactors [1]. Considering the activation of structural materials in reactors, the related cross-section data are of great significance for the evaluation of safety in fusion reactors. In particular, they can be used to determine the necessary disposal of radioactive waste from reactor structural materials and improve radiation protection procedures. The activation method was used for measurements of nuclear reaction cross-sections in studies [2–4]. The half-life of the ground state of a generated nucleus is essential for the activation method because the evaluated cross-section is related to T1/2 of the populated nucleus [1, 5]. Moreover, the measurement of cross-sections leading to isomer formation or of the generation ratio of the isomer to the ground state (isomeric ratio) has become one of the main directions of investigations on level densities in excited nuclei [6, 7]. Because 184Re has a β-unstable isomer, the level density and decay property can be studied from the viewpoint of statistical models after measuring the reaction cross-section and isomeric ratio of 184m, gRe [5, 6, 8]. As a result, the precise half-life of 184gRe and the isomeric ratio of 184m, gRe are vital for these studies.
To date, the half-life of 184gRe has been measured by four laboratories, and the results are summarized in Table 1. In 1960, E. Bodenstedt measured the half-life of 184gRe to be 38.0 ± 1 d [9], whereas in 1962, B. S. Dzhelepov reported it to be 38.0 ± 0.5 d [10]. In particular, the half-life of 184Re determined in 1962 was once widely regarded as the recommended value. In both measurements, the ground state of 184Re was generated using a deuteron-induced reaction in a nuclear reactor. However, N. R. Johnson discovered a β-unstable isomer with Jπ = 8+ (T1/2 = 169 ± 8 d) of 184Re [11]. Because the deuteron-induced reaction generally introduces a sufficiently large angular momentum to populate the 8+ isomer, these half-lives were determined without accounting for the contamination effect from the decay of the isomer. Thus, the actual half-life of 184gRe was smaller than the recommended value T1/2 = 38.0 ± 0.5 d, and the cross-section measured by the activation method based on this recommended value was larger than the actual value. In 2006, T. Hayakawa measured the half-life of 184gRe populated by the 185Re (γ, n) 184Re reaction from laser Compton scattering γ-rays generated through relativistic engineering, and the measured result was 35.4 ± 0.7 d [5]. The (γ, n) reaction had an advantage in selectively populating the ground state because it did not introduce a large angular momentum. Thus, the ground state of 184Re was expected to be generated with little contamination of the isomer by the 185Re (γ, n)184Re reaction, and this half-life was regarded as the recommended value. Subsequently, Hayakawa reevaluated the data from this experiment in 2008 and found that the half-life of 184gRe was 35.4 ± 0.3 d [12]. Nevertheless, the linearization of the exponential decay function was used to analyze data in both documents, and the uncertainty was solely derived from fit uncertainty [5, 12]. Pommé et al. showed that an incomplete uncertainty estimation based solely on the least-squares fit leads to unrealistic values [13–15]. Moreover, later literature did not provide the basis for decreasing the uncertainty from 0.7 to 0.3, reducing the reliability of the result [12]. Therefore, a new half-life of 184gRe with well-documented uncertainty estimation should be determined to improve the accuracy and trustworthiness of nuclear decay data.
Reference Measurement methods Detector T1/2/d E. Bodenstedt et al. (1960) [9] Deuteron bombarded tungsten/chemical separation NaI 38 ± 1 B. S. Dzhelepov et al. (1962) [10] Deuteron bombarded tungsten/chemical separation Geiger Mueller counters 38 ± 0.5 N. R. Johnson et al.
(1963) [11]Neutron irradiation KReO4/chemical separation NaI 33 ± 3 T. Hayakawa et al. (2006) [5] Lcs γ-ray irradiation 185Re HPGe 35.4 ± 0.7 T. Hayakawa et al. (2008) [12] Lcs γ-ray irradiation 185Re HPGe 35.4 ± 0.3 Table 1. Half-life of 184gRe reported in previous literature.
In this study, the isomeric state and ground state nuclei of 184Re were generated by the 185Re (n, 2n) 184Re reaction of an Re sample bombarded with D-T neutrons, and the half-life was measured with γ-ray spectrometry using the HPGe detector. Because the 185Re (n, 2n) reaction generally brought sufficient angular momentum to populate the 8+ isomer, the counts of the ground state characteristic peaks were contaminated by the γ-ray emitted from the isomer. To eliminate this contamination, the isomeric ratio of 184m, gRe was calculated based on the neutron activation cross-section formula. The method described by Pommé was used to conduct a robust uncertainty assessment [13, 14]. Such a method provides the possibility of determining the half-lives of nuclides containing isomers.
-
Isotopes of 184Re were produced from the 185Re (n, 2n) reaction using a neutron bombarded Re sample. The disk of the Re sample (37.40% 185Re and 62.60% 187Re, approximately 20.0 mm in diameter and 1.5 mm in thickness) was sandwiched between natural niobium foil and zirconium foil, used to determine the neutron energy, both of which had a thickness of 0.1 mm and purities better than 99.99%.
-
Irradiation was carried out using the K-400 Intense Neutron Generator at the China Academy of Engineering Physics (CAEP) and lasted approximately 17 h. The neutron yield was approximately 3~4×10¹⁰ n/4πs. A beam with a deuteron beam energy of 250 keV and a current of 180 µA was used for the production of neutrons via the T (d, n) 4He reaction. The solid tritium-titanium (T-Ti) target used in the generator was approximately 2.59 mg/cm2 thick. A schematic diagram presenting the sample positions in the experiment is shown in Fig. 1. The samples were placed at 30° relative to the deuteron beam direction and centered around the T-Ti target at a distance of approximately 6 cm. During irradiation, the variation in the neutron yield was monitored by accompanying α particles to make corrections for fluctuations in the neutron flux. A neutron energy of 14.8 MeV was determined from the cross-section ratio of the 90Zr (n, 2n) 89Zr to 93Nb (n, 2n) 92mNb reactions.

Figure 1. (color online) Schematic diagram of experimental geometry.
-
The half-life of 184Re and the isomeric ratio of 184m, gRe were determined by measuring the characteristic γ-rays emitted from the generated radionuclides. The γ-rays emitted by the activation sample at different cooling times were obtained from continuous off-line measurements using a calibrated HPGe detector (ORTEC, USA). The signals from the detector preamplifier were first shaped (the shaping time was set to 6 μs), and the data were amplified by ORTEC model 672. An ORTEC model 928 multichannel analyzer unit was used, and the data were collected by the ORTEC MAESTRO software, which provides precise deadtime information.
Before irradiation, a series of standard sources with known activity (60Co, 133Ba, 137Cs, 152Eu, 210Pb, 241Am, and 226Ra) were used to calibrate the efficiency of the HPGe detector. The shielding of the detector consisted of a 20 cm thick layer of lead. The relative efficiency of the detector was 68%, and the energy resolution was 1.82 keV (FWHM) at 1.33 MeV of 60Co. The spectrum was stored in 8092 channels, covering the energy range from 23 to 3080 keV. The typical background rate for the entire energy range is 4.76 s−1. A total of 14 measurements were made at different cooling times, and the individual spectrum was recorded for 1 d. The first measurement began after the irradiated sample cooled for 26 d, and the last measurement was taken after cooling for 205 d. The upper limit of the dead time was set at less than 0.45% for each measurement (especially for the first running Δt1). The dead time uncertainty component was propagated using the initial measurement recorded dead time of 0.45% [16, 17]. In addition, when the detector recorded a γ-ray, a series of pulses were recorded as one signal, although they occupy multiple time intervals, resulting in pulse pile-up. The probability of pulse pile-up was calculated using the Poisson distribution [18]. It was calculated that the probability of no pulse pile-up in all measured γ spectra was greater than 99.86%, and the probability of one pulse pile-up was less than 0.14%. When the probability of pulse pile-up is less than 1%, the influence on the count of the γ characteristic peaks is insignificant and can therefore be ignored. Furthermore, the half-width spectral resolution of the γ characteristic peaks deteriorates if pulse accumulation exists. The half-width resolution of the γ characteristic peaks was calculated and compared with the resolution of γ characteristic peaks with 152Eu and 60Co energies. The relative change was negligible. Figure 2 shows the first and last typical background subtracted γ spectra acquired from the irradiated samples, with the characteristic γ-ray peaks of 184gRe and 184mRe indicated.

Figure 2. (color online) Background subtracted γ spectra of the activation sample with different cooling times (ti) were measured using the HPGe detector; (a) t1 = 26 d and (b) t14 =205 d. The acquisition time of a γ spectrum was 1 d, and the characteristic γ-ray peaks of 184Re and184mRe listed in Table 2 are indicated.
-
The neutron activation cross-section formula was used to calculate the isomeric ratio, which can be defined as [1, 19, 20]
$ \mathrm{\sigma }=\frac{FCA\lambda }{M{N}_{A}\eta \phi {I}_{\text{γ}}\epsilon KSD}, $

(1) where
$ \sigma $ is the fission reaction cross-section;$ F $ is the total correction factor of the counting process, given by$ F={F}_{\rm S}*{F}_{\rm C}*{F}_{\rm g} $ ($ {F}_{\rm S},{F}_{\rm C},{F}_{\rm g} $ are the self-absorption correction factor, cascade coincidence correction factor, and geometric correction factor, respectively);$ C $ is the counts of the characteristic γ-rays;$ A $ is the molecular weight of the irradiated sample;$ \lambda $ is the decay constant of the fission products;$ M $ is the sample mass;$ {N}_{\rm A} $ is the Avogadro constant;$ \eta $ is the abundance of the nuclide;$ \phi $ is the neutron flux;$ {I}_{\text{γ}} $ is the γ emission probability;$ \epsilon $ is the detection efficiency;$ K $ is the neutron flux rate fluctuation correction factor;$ S $ is the generative factor, given by$ 1-{\rm e}^{-\lambda T} $ ,$ T $ is the irradiation time; and$ D $ is the measurement collection factor, given by$D=(1-{\rm e}^{-\lambda t}){\rm e}^{-\lambda \Delta t}$ , where$ t $ is the measurement time and$ \mathrm{\Delta }t $ is the cooling time. Because$ C $ ,$ {I}_{\text{γ}} $ ,$ \epsilon $ , and$ D $ are related to the cooling time and the energy of γ-rays, the formula can be simplified to$ C={C}_{0}D\epsilon {I}_{\text{γ}}={C}_{0}\epsilon {I}_{\text{γ}}(1-{\rm e}^{-\lambda T}){\rm e}^{-\lambda \Delta t}(1-{\rm e}^{-\lambda t}) $

(2) where
$ {C}_{0} $ is a constant. According to this formula, the counts of γ characteristic peaks with energies of 792.067, 894.760, and 903.282 keV emitted from the isomer can be calculated. Because the yields of nuclei in the isomeric and ground states are measured using the same targets under identical irradiation conditions, the isomeric ratio in (n, 2n) reactions can be considered the ratio of the respective yields [6]. In the following, the subscripts$ is $ and$ gr $ represent the isomeric and ground states, respectively:$ IR=\frac{{\sigma }_{is}}{{\sigma }_{gr}}=\frac{{Y}_{is}}{{Y}_{gr}}. $

(3) -
The half-life of 184Re was calculated using the nonlinear fit method, including the half-life of 184gRe before and after deducting the effect of γ-rays from the isomer as well as the half-life of 184mRe. The counting formula for the characteristic γ-rays emitted from the activation sample is defined as [1, 21]
$ C=\frac{M{N}_{A}\eta \phi \sigma {I}_{\gamma }\epsilon F}{\lambda A}(1-{\rm e}^{-\lambda T}){\rm e}^{-\lambda \Delta t}(1-{\rm e}^{-\lambda t}), $

(4) where
$ C $ is the counts of the characteristic γ-rays,$ {N}_{\rm A} $ is the Avogadro constant,$ M $ is the sample mass,$ \eta $ is the abundance of the nuclide,$ \phi $ is the neutron flux,$ \sigma $ is the fission reaction cross-section,$ {I}_{\text{γ}} $ is the γ emission probability,$ \epsilon $ is the detection efficiency,$ F $ is the total correction factor of the counting process, given by$ F={F}_{\rm S}*{F}_{\rm C}*{F}_{\rm g} $ ,$ \lambda $ is the decay constant of the fission products,$ A $ is the molecular weight of the irradiated sample,$ T $ is the irradiation time,$ t $ is the measurement time, and$ \mathrm{\Delta }t $ is the cooling time. Because$ T $ and$ t $ are fixed in this study, it can be simplified to$ \frac{{C}_{i}}{{C}_{0}}={\rm e}^{(-\lambda \Delta {t}_{i})} $

(5) in which
$ {C}_{0} $ is the counts of the characteristic γ-rays before each measurement,$ \lambda $ is the decay constant,$ \Delta t $ is the cooling time, and the subscript$ i $ indicates each measuring point. -
For normally distributed random fluctuations, a rigorous uncertainty propagation factor can be derived from linear regression formulas. The uncertainty on the least-squares solution of the half-life value is [22]
$ \frac{{{\sigma }_{T}}_{1/2}}{{T}_{1/2}}=\frac{1}{\lambda }\frac{1}{\sqrt{var\left(t\right)}}\frac{{\sigma }_{{A}_{w}}}{{A}_{w}} ,$

(6) where
$ var\left(t\right) $ represents the variance of the measurement start times, and$ {{\sigma }_{{A}_{w}}}/{{A}_{w}}=({\Sigma {\left({{{\sigma }_{A}}_{i}}/{{A}_{i}}\right)}^{-2})}^{-1/2} $ is the expected relative uncertainty on the weighted mean activity. For a set of$ n $ activity measurements with the same relative uncertainty$ {\sigma }_{i}={\sigma }_{ A} $ performed equidistant in time over a total period$ T $ , Eq. (7) reduces to [17, 22, 23]$ \frac{{{\sigma }_{T}}_{1/2}}{{T}_{1/2}}=\frac{2}{\lambda T}\sqrt{\frac{3(n-1)}{n(n+1)}}\frac{{\sigma }_{A}}{A} $

(7) in which
$ T $ is the duration of the campaign, and$ {\sigma }_{ A} $ is the measure of the uncertainty for a typical activity measurement. This formula implicitly assumes that the data are independent; thus, it is only applicable to statistical (short-term) variations and not auto-correlated (medium and long-term) variations [13]. A similar approximation formula was derived based on the assumption that the relative impact of a measurement on the fitted half-life is proportional to the time difference with the middle of the campaign and data points are spread somewhat evenly in time over the period T [13, 14, 24].$ \frac{{{\sigma }_{T}}_{1/2}}{{T}_{1/2}}\approx \frac{2}{\lambda T}{\left(\sum _{i=0}^{n-1}\Big|\frac{2i}{n-1}-1\Big|\right)}^{-1/2}\frac{{\sigma }_{A}}{A}\approx \frac{2}{\lambda T}\sqrt{\frac{2}{n+1}}\frac{{\sigma }_{A}}{A}. $

(8) Using Eqs. (7) and (8), a realistic uncertainty can be estimated.
-
The γ-ray characteristic peaks of 184gRe used in the analysis with a branching ratio greater than 10% are shown in Fig. 2. Their energies were 792.067 keV (37.7%), 894.760 keV (15.7%), and 903.282 keV (38.1%). The half-life of the nuclide is usually obtained via the linear fitting of an exponential function. However, linearization of the exponential fit should only be performed if the weighting factors are changed from the inverse variances to the inverse relative variances [13, 14, 17, 25]. The previously reported half-life of 184gRe did not take this into account when analyzing the data [5, 9–12]. Hence, the counts of the γ characteristic peak were fitted with an exponential function by minimizing the squared values of the variance-weighted residuals. Moreover, the half-lives of 184gRe were deduced as 46.77 d (792.067 keV), 47.62 d (894.760 keV), and 46.99 d (903.282 keV), as shown in Fig. 3. The fitting curve passed through the experimental points very well with a correlation coefficient R≈1.0, implying that the γ-ray spectra were in a stable condition during the measurement time of five half-lives. The residuals of the fit, presented in Fig. 3(b), (c), and (d), exhibited a nearly normal distribution, with the majority of the values within the interval (−2, 2). No data were excluded from the fit. It can be seen that the preliminary calculation of the 184gRe half-life was clearly larger, implying that the γ characteristic peak counts of 184gRe were disturbed by γ-rays emitted from the isomer. To eliminate the impact of the γ-rays from the isomer, the generation ratio of the isomer to the ground state of 184Re should be calculated. In addition, the isomeric ratio is useful for verifying the level density and strength of γ decay from the viewpoint of the statistical model [6, 8].
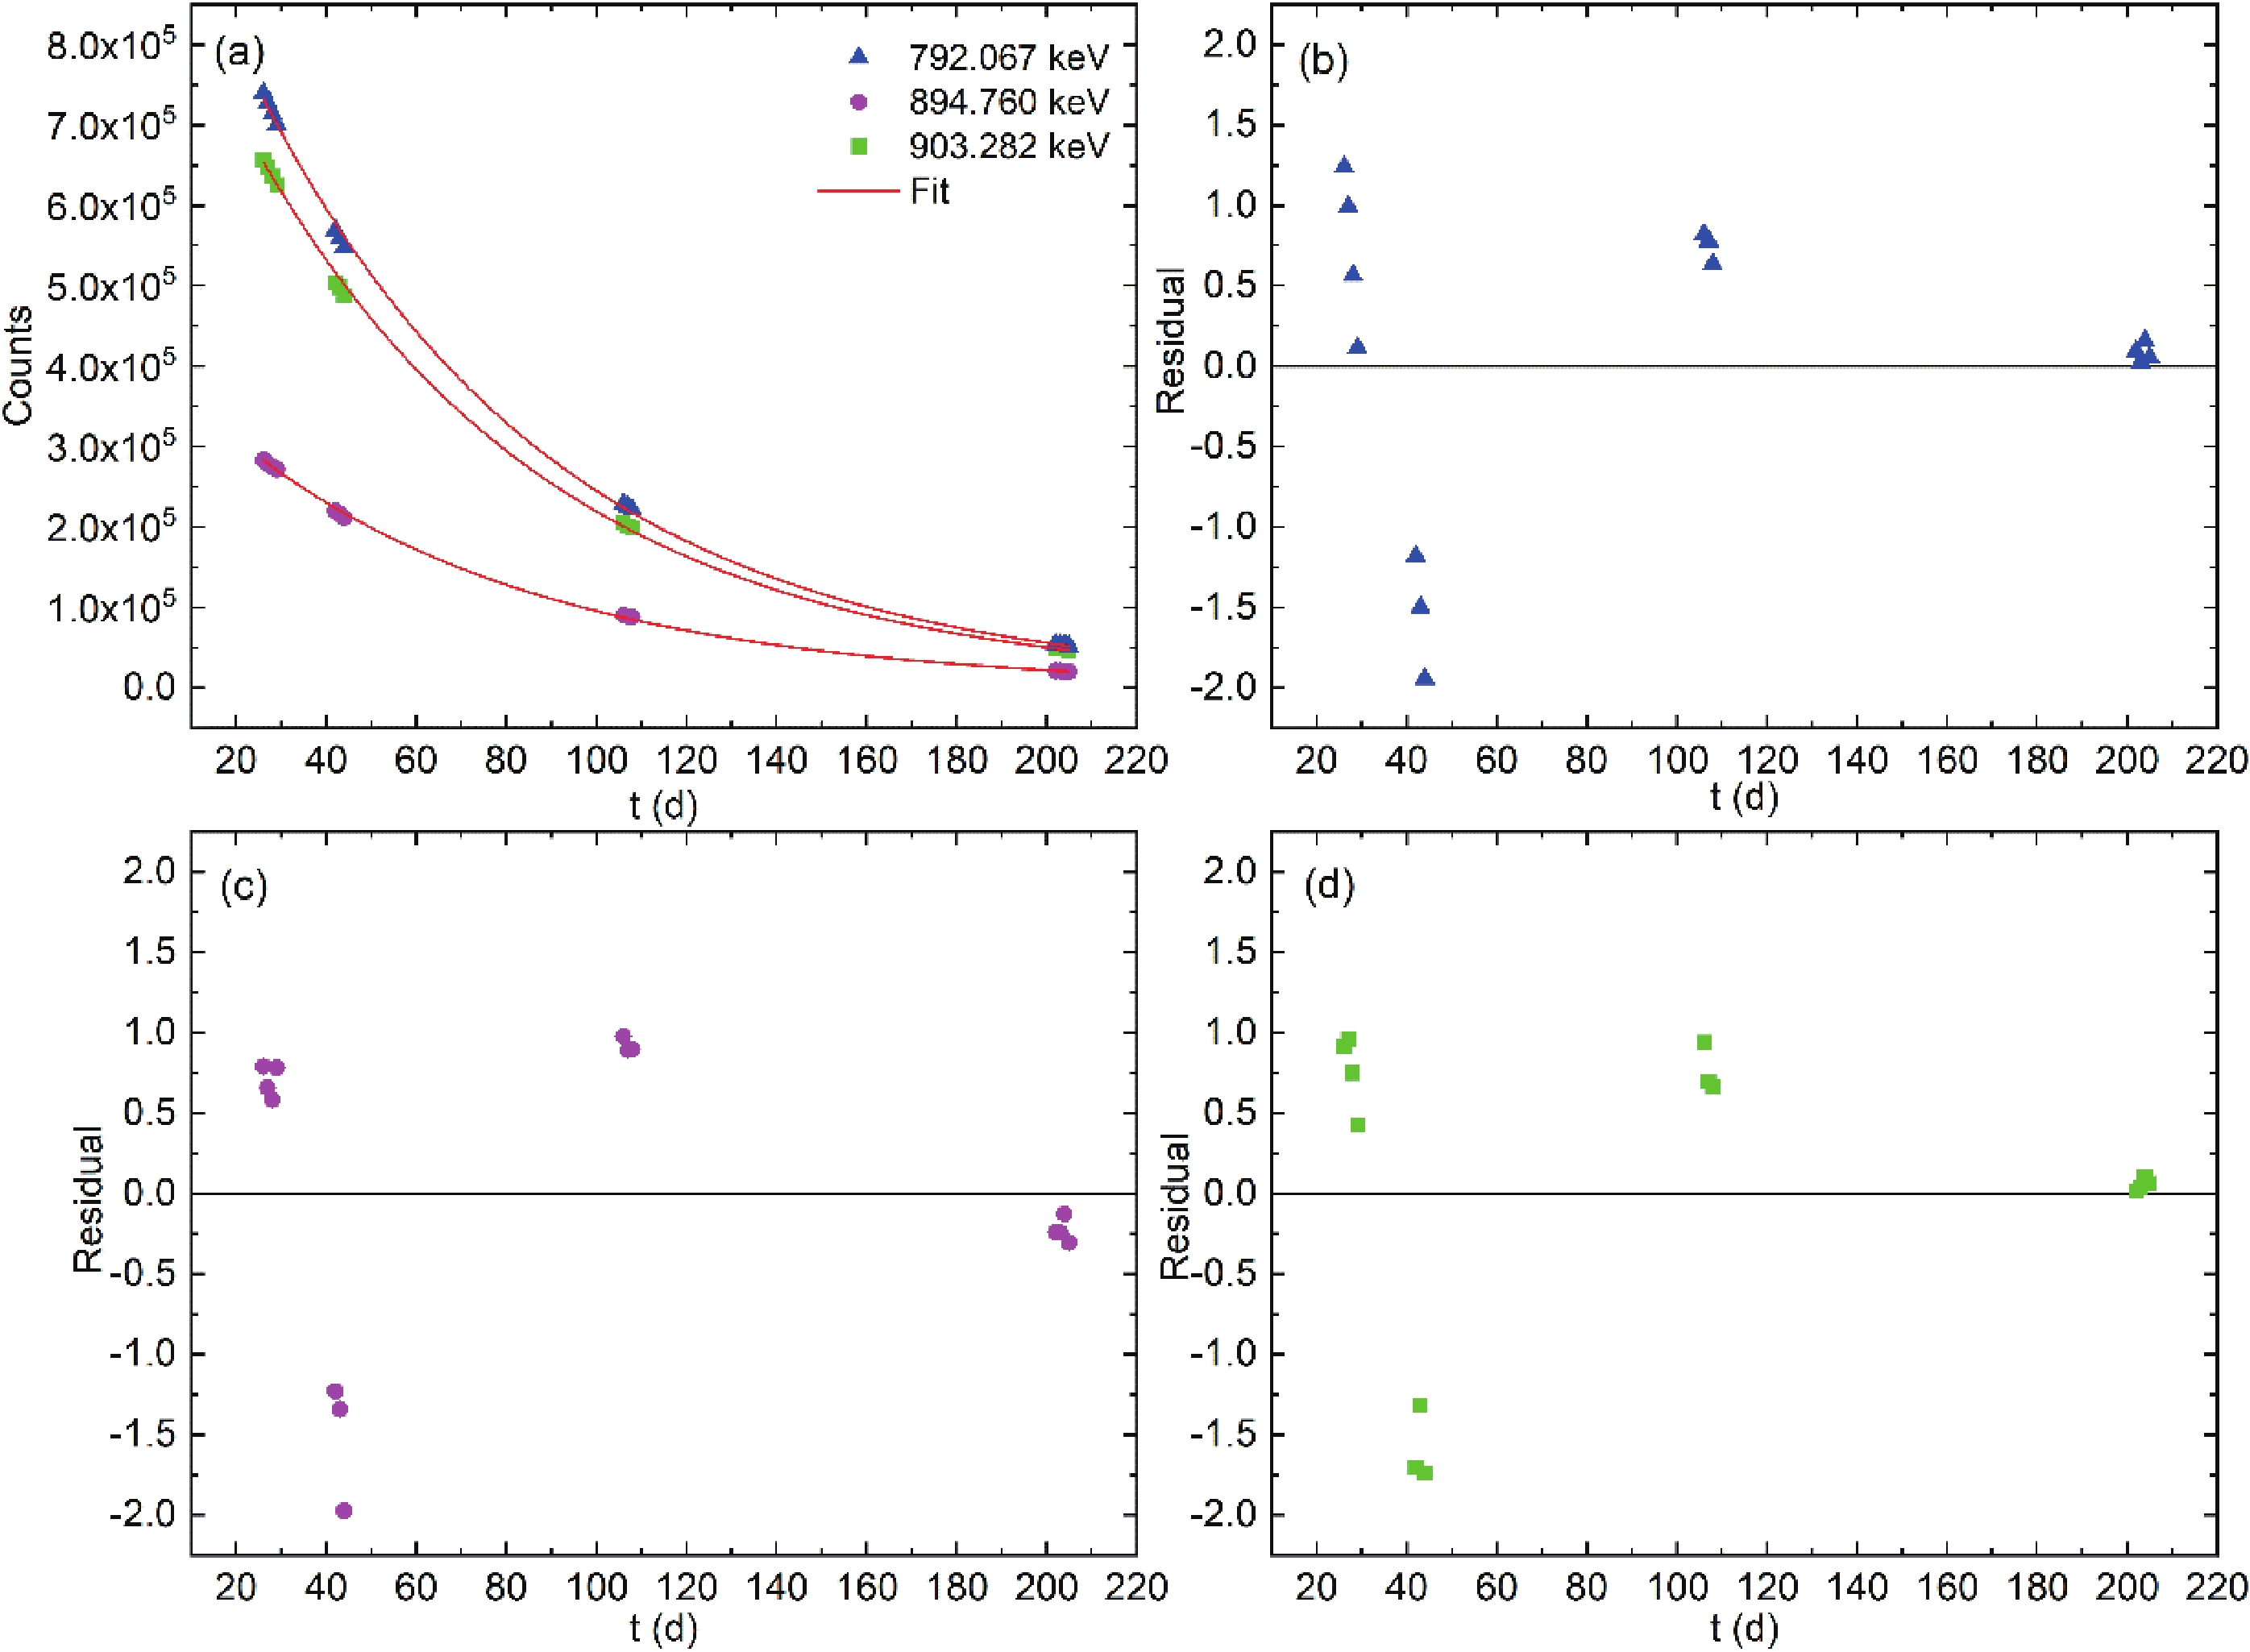
Figure 3. (color online) (a) Nonlinear fitting curve between the counts and ti. Normalized residuals of the measured 184gRe count versus the fitted exponential decay curve; (b) 792.067 keV, (c) 894.760 keV, and (d) 903.282 keV. The residuals show no clear auto-correlation and seem randomly distributed, mostly within two standard uncertainties.
-
Because the nuclide of 184Re is in the transition region between spherical and deformed nuclei, the properties of low-lying excited states change dramatically. The single-particle states of 184Re for a deformed potential are identified in terms of the 5/2[402] proton (parity is +) and the 1/2[510] (parity is –) and 11/2[615] (parity is +) neutron orbits in the Nilsson scheme [26]. The spectrum of low-lying excited states is composed of precisely these orbits. The spectroscopic features of the ground and isomeric states of the nuclei under investigation are given in Table 2. The characteristics of the radioactive decay in the ground and isomeric states, especially the energies of γ-rays (Eγ), fractions per decay (Iγ), and half-life (T1/2), are necessary for identifying nuclei and determining their yields. The half-lives of 184mRe and 184gRe were calculated via exponential fitting of the γ characteristic peaks. It can be seen that the half-life of 184mRe was significantly lower (the recommended half-life is 169 ± 8 d) because the measurement time of 205 d was insufficient to accurately measure the half-life of 184mRe.
Nucleus β2 Ei/keV J π Nucleonic configuration Decay mode Eγ/keV Iγ (%) T1/2/d Counting error (%) 184Re 0.21 0 3- π5/2 [402] + ν1/2 [510] EC (100%) 792.067 37.7 46.77 0.44 894.760 15.7 47.62 0.71 903.282 38.1 46.99 0.46 188 8+ π5/2 [402] + ν11/2 [615] EC (25.50%) 161.269 6.56 162.04 1.21 216.547 9.5 152.40 0.88 318.008 5.81 157.04 1.22 792.067 3.69 894.760 2.76 903.282 3.74 920.933 8.2 159.82 1.46 1173.770 1.23 165.21 3.87 IT (74.50%) 104.739 13.6 164.35 1.17 Table 2. Spectroscopic features of the ground and isomeric states of the nuclides under investigation. The bolded values of Eγ are the energies measured from both the ground and isomeric states of 184Re, and the bolded half-lives are obtained from a mixture of γ-rays emitted from the ground and isomeric states of 184Re. The data source of β2, Ei, and the nucleonic configurations is literature [26], and the source of Eγ and Iγ data is the National Nuclear Data Center [30].
As shown in Fig. 4, the 3− ground state of 184Re mainly decays to 2+ and 3+ excited states and subsequently decays to 184W via γ-decay. In contrast, the 8+ isomer de-excites through two different decay paths, internal γ-decay and β-decay. The isomer decays to the ground state of 184Re through γ-decay cascades with a branching ratio of 74.5%. The other isomer populates a 7− excited state in 184W via β-decay, and the 7− state decays to the ground state of 184W by a γ-decay cascade. Therefore, most γ-rays, including the three γ characteristic peaks of 184gRe (792.067, 894.760, and 903.282 keV) measured in this experiment, can be found in the decay of both the ground state and the isomer, and the half-lives obtained from these γ-rays are affected by both decays. However, the internal decay γ-rays of 104.739 keV and γ-rays from the 7− states, such as 161.269, 216.547, 318.008, 920.933, and 1173.770 keV, are observed only in the isomeric decay. To perform a consistency test and prevent the calculation result from being unreliable due to insufficient data, these six γ-rays were selected for calculation. The γ-rays emitted from 184mRe produced by the 185Re (n, 2n) 184mRe reaction are shown in Table 2. According to Eq. (2), the constant
$ {C}_{0} $ is deduced from parameters known at γ energies of 104.739, 161.269, 216.547, 318.008, 920.933, and 1173.770 keV, including the counts$ C $ , branching ratio$ {I}_{\text{γ}} $ , detection efficiency$ \epsilon $ , irradiation time$ T $ , measurement time$ t $ , and cooling time$ \Delta t $ . Therefore, this constant was used to introduce Eq. (2) to calculate the counts of γ-rays at 792.067, 894.760, and 903.282 keV emitted by the isomeric state. In addition, considering that 74.5% of the isomeric state itself decays into the ground state,$ {I}_{\text{γ}} $ in the formula represents the branching ratio of γ-rays but after considering the influence of this part.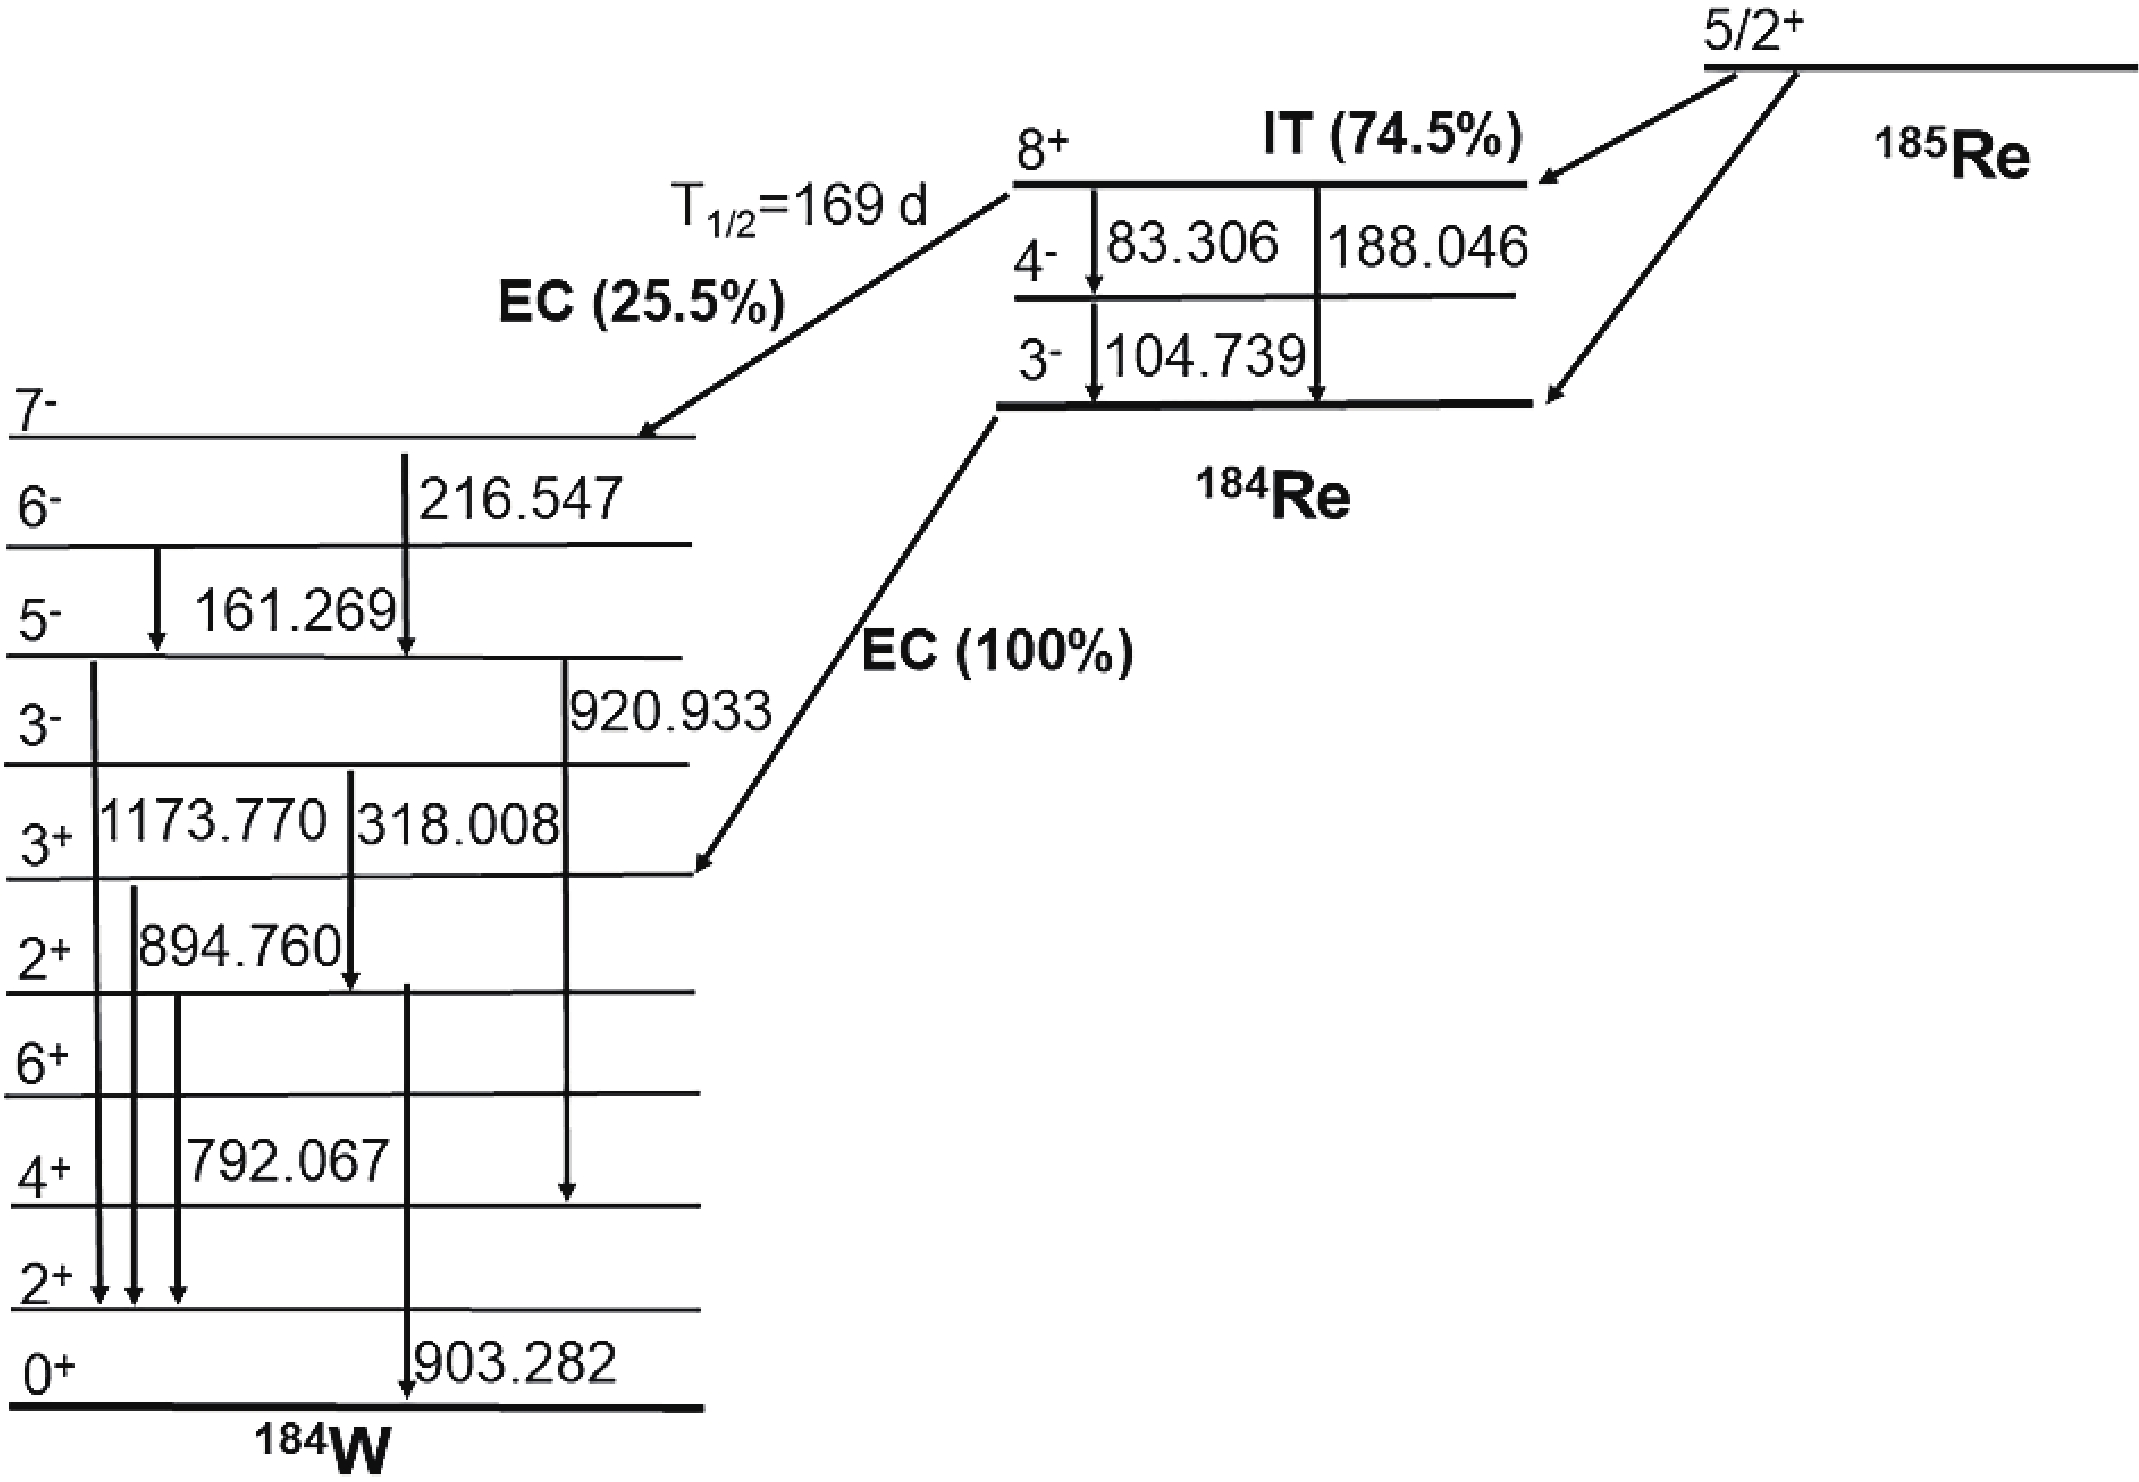
Figure 4. Partial decay scheme of 184Re.
After obtaining the counts of the γ characteristic peak emitted by the isomeric and the ground states, the isomeric ratios at 792.067, 894.760, and 903.282 keV were calculated according to Eq. (3), and the results are shown in Table 3. The final isomeric ratio was the weighted average of the above values, weighted as the square-reciprocal of their corresponding uncertainties [27, 28]. The final isomeric ratio obtained in this manner was 0.29 ± 0.11, which is consistent with the results in literature within the uncertainty (which are also presented in Table 3) [6, 7]. This proves the reliability of the isomeric ratio calculated with experimental data in this study. In addition, the isomeric ratio is useful for verifying the level density and strength of γ decay from the viewpoint of the statistical model [6, 8]. The behavior of the isomer ratios depends on the spin and angular momentum introduced in the target nucleus; therefore, this value can be used to determine parameters that characterize the dependence of the level density on the excitation energy and angular momentum, thereby enabling research on nuclear structures [6, 29].
Table 3. Isomeric ratios of 184Re calculated in this study and the values previously reported.
-
Using Eq. (2), the γ characteristic peak counts of the isomer at 792.067, 894.760, and 903.282 keV were calculated using the constant
$ {C}_{0} $ derived from the other six γ-rays emitted by the isomer (104.739, 161.269, 216.547, 318.008, 920.933, and 1173.770 keV). Therefore, after subtracting the counts of the isomer from the total counts at 792.067, 894.760, and 903.282 keV, the six counts of 184gRe at each corresponding γ energy were obtained. Then, using Eq. (5), the γ characteristic peak counts of 184gRe were fitted as an exponential function by minimizing the squared values of the variance-weighted residuals [21]. The results were 35.12, 36.16, and 35.00 d for 792.067, 894.760, and 903.282 keV, respectively. The fitting residuals presented in Fig. 5 reveal that the majority of data is in the range (–2, 2). The final half-life of 184gRe was taken as the weighted average of the above three values, which is 35.43 d. The weight for each half-life was determined using the high-frequency uncertainty in Table 4. The final standard uncertainty on the half-life was determined using the standard uncertainty on the weighted average and the medium- and low-frequency uncertainty components in quadrature [16].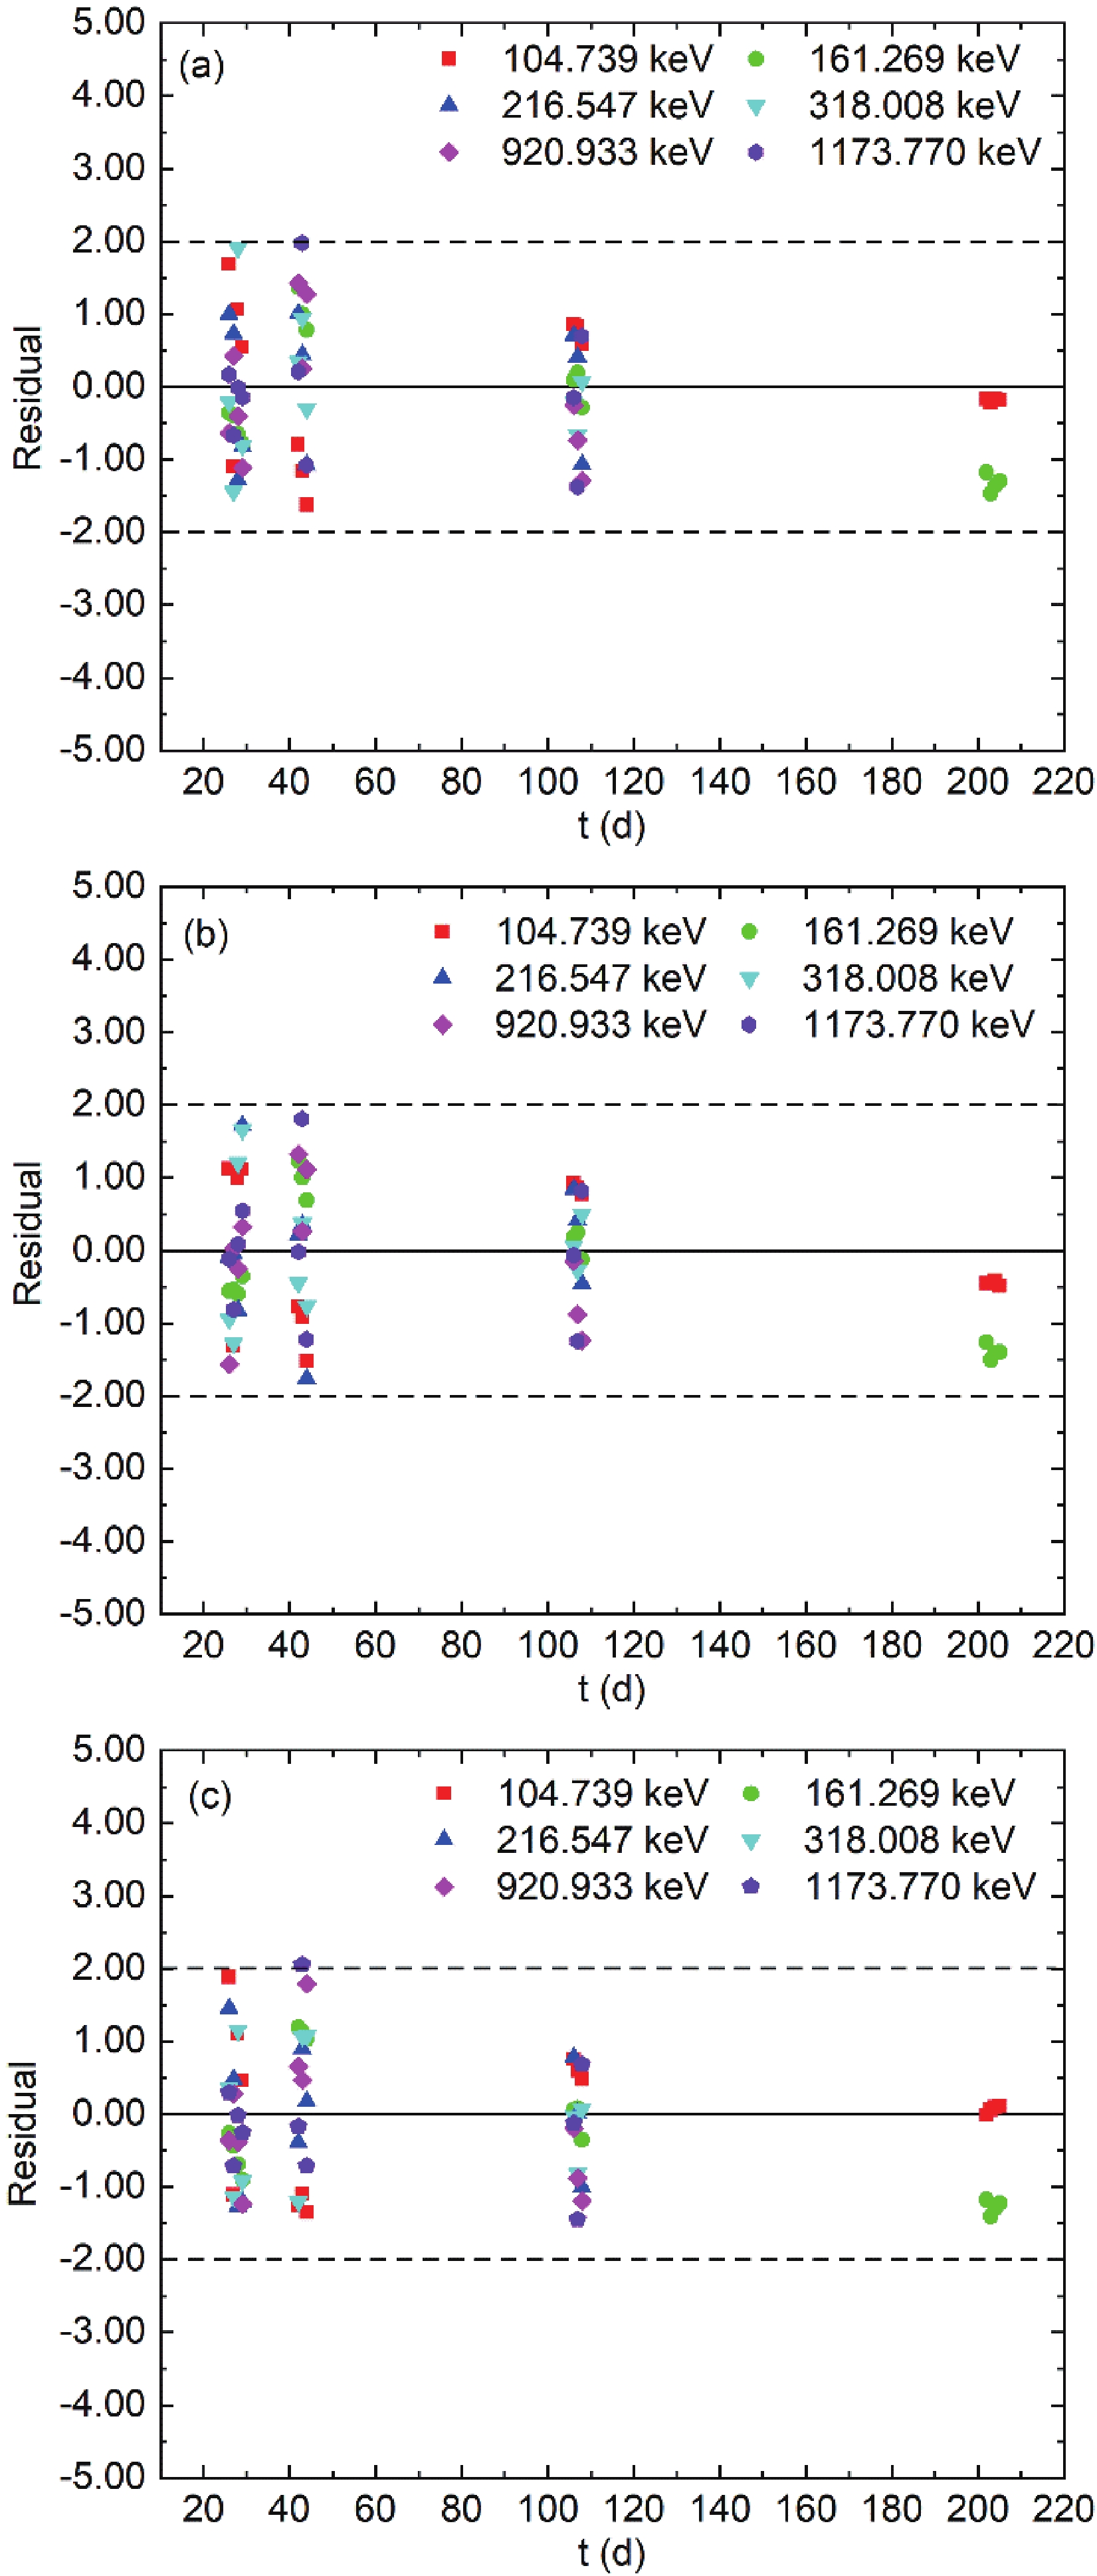
Figure 5. (color online) Normalized residuals of the calculated 184gRe γ characteristic peak counts after deducting the corresponding γ characteristic peak counts emitted from 184mRe versus the fitted exponential decay curve; (a) 792.067 keV, (b) 894.760 keV, and (c) 903.282 keV. The residuals show no clear autocorrelation and seem randomly distributed, mostly within two standard uncertainties.
Components ${ {\mathit{\sigma } }_{\mathit{A} } }/{\mathit{A} }$ (%)

Propagation factor ${ {\mathit{\sigma } }_{ {\mathit{T} }_{1/2} } }/{ {\mathit{T} }_{1/2} }$ (%)

Total (%) High frequency 0.45 Standard deviation of residuals 0.28 0.18 0.05 Medium frequency Trends in residuals 0.15 0.18 0.03 Low frequency Counting uncertainty on 184mRe 1.64 0.21 0.34 Background subtraction 0.38 0.49 0.19 Pulse pile-up and dead time 0.45 0.49 0.22 Table 4. Uncertainty evaluation for the half-life of 184gRe, expressed as relative standard uncertainty.
The uncertainty components were evaluated in accordance with Pommé's technique by considering the high-, medium-, and low-frequency instability contributions and combining these in quadrature to determine the standard uncertainty on the half-life [13]. The evaluation of uncertainty is presented in Table 4. It is important to apply independent uncertainty propagation according to the ‘frequency’ of the uncertainty components. As mentioned in Eq. (8),
$ n $ is the number of measurements for high-frequency instability. For (cyclic) medium frequency components, the value of$ n $ is set equal to the number of periods covered by the measurement campaign. When pertaining to low-frequency instability, the parameter$ n $ receives a new meaning. For low-frequency effects,$ n $ is the occurred frequency [13, 14, 17, 22, 23]. The high frequency instability component is comprised of the standard deviation of the residuals from the least squares fit. This was determined as 0.28%. The medium frequency instability component of the uncertainty was identified as 0.15%, which was the trend of the residual. The low frequency instability components of uncertainty were not visible in the residual plot; therefore, an attentive analysis must be performed. The counting uncertainty introduced in the calculation of γ-rays emitted from 184mRe, background subtraction, pulse pile-up, and dead time correction are all considered low frequency components of the uncertainty. In this study, a conservative approach was used for the analysis part of the low frequency instability components; therefore,$ n $ was set equal to 1 for background correction, pulse pile-up, and dead time correction. However, the contribution of the counting uncertainty introduced in the calculation of γ-rays emitted from 184mRe was deduced from data processing by the weighted least-squares fit. For this,$ n $ was set to the number of measurements. The total uncertainty was 0.45 %, as outlined in Table 4. The final half-life of 184gRe was 35.43 ± 0.16 d.The deduced half-life of 184gRe is listed in Fig. 6 along with previous literature values, where the data represented by the green line in the figure is from the NNDC database [5, 9–12, 15, 30]. As shown in Fig. 6, the uncertainty on our result was significantly lower than the current recommended value. The experiment and ensuing uncertainty evaluation were discussed in detail. This provides a more accurate and reliable half-life for applications using an activation method, such as the calculation of the cross-section of 184Re via the 185Re (n, 2n) 184Re reaction. More importantly, this result demonstrates that an accurate half-life of the ground state can be obtained by eliminating the contamination of γ-rays emitted from the isomer on the counts of the ground state characteristic peaks.
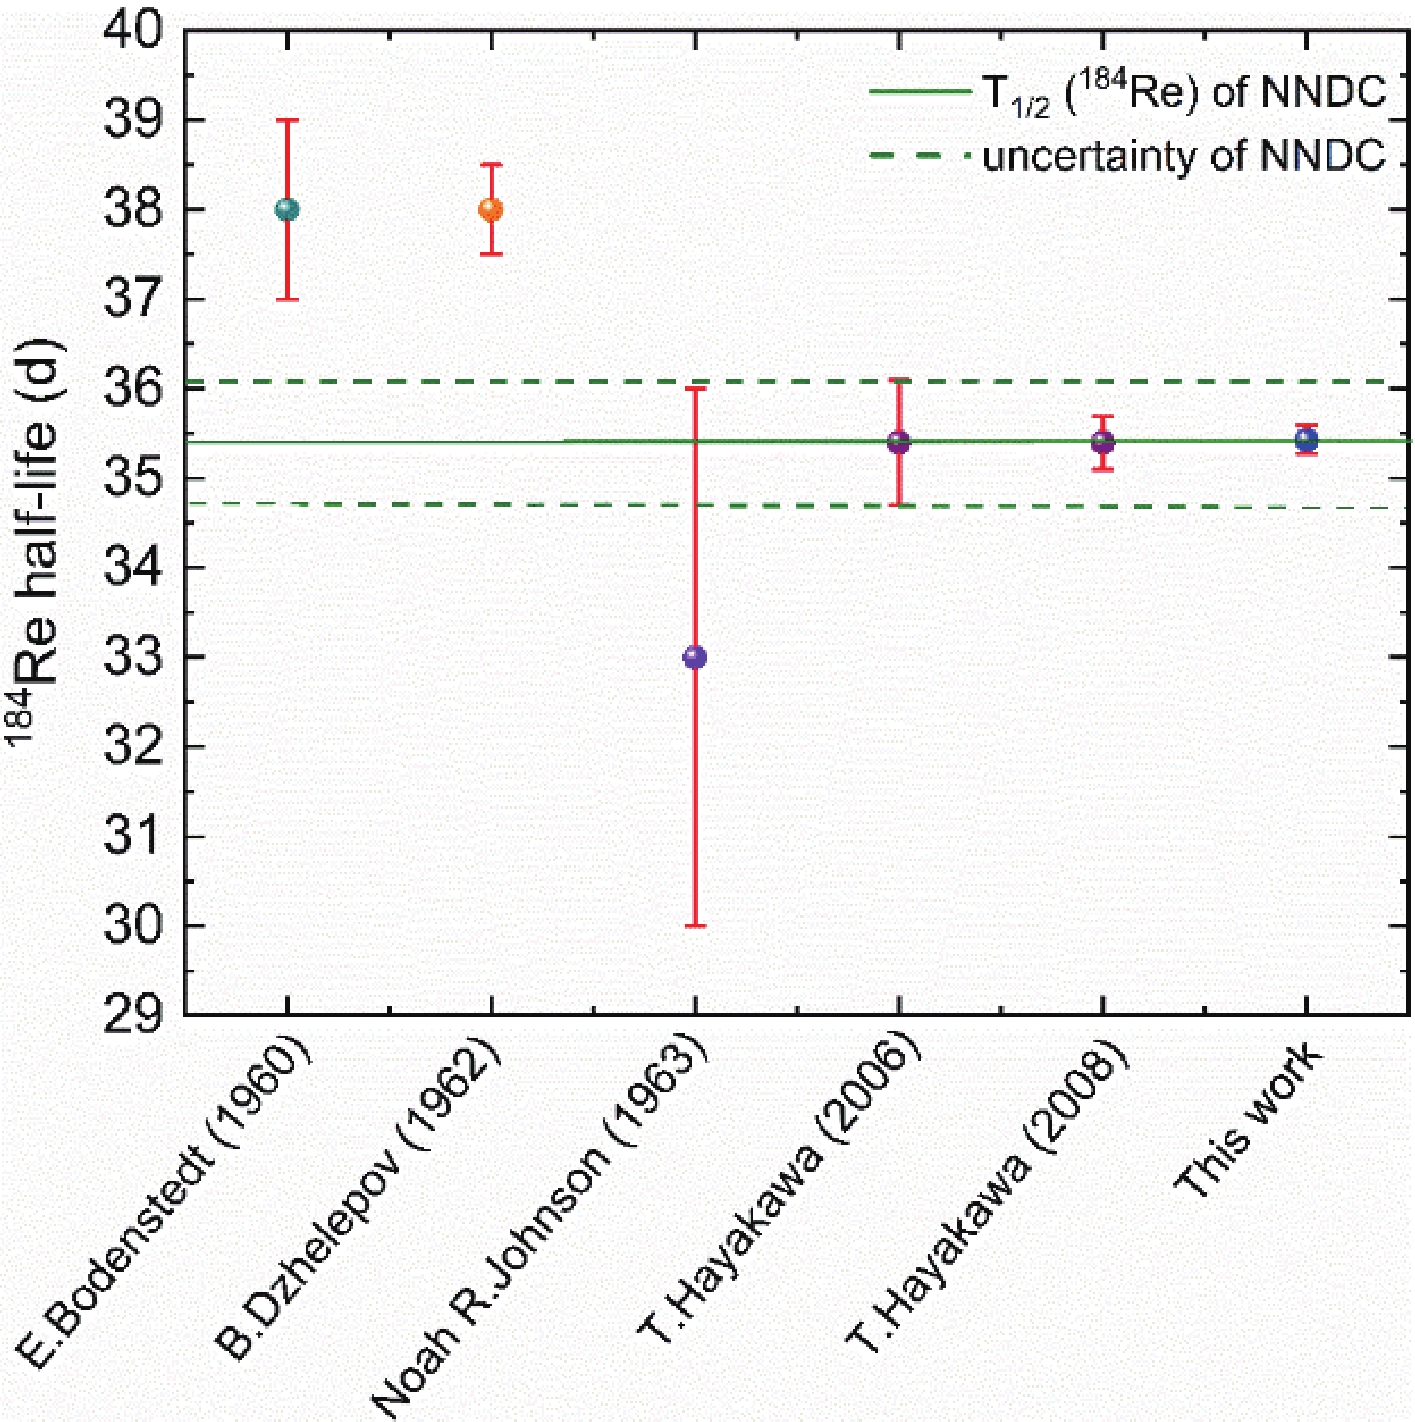
Figure 6. (color online) Half-life of 184gRe calculated in this study compared with the values previously reported.
-
In this study, the isomeric ratio of 184m, gRe and the half-life of 184gRe were measured in the 185Re (n, 2n) reactions at 14.8 MeV, and the uncertainty was discussed in detail. Based on the isomeric ratios formula and weighted average, the upper limit of the isomeric ratio was successfully calculated to be 0.29 ± 0.11, which is consistent with prior results within the uncertainty. By eliminating the contamination of γ-rays emitted from the isomer on the counts of the ground state characteristic peaks, an accurate 184gRe half-life was obtained as 35.43 ± 0.16 d. This uncertainty was significantly lower than that of the recommended value T1/2=35.4 ± 0.7 d. In contrast to previous reports that obtained this uncertainty based only on least square fitting, a careful uncertainty evaluation was performed, and an uncertainty budget was presented. Therefore, the result in this paper is recommended as the new half-life of 184gRe. This result will provide essential information for applications using an activation method, such as the calculation of cross-section. Moreover, this experiment indicates that an accurate half-life of the ground state can be obtained by eliminating the contamination of γ-rays emitted from the isomer, which is crucial for calculating the nuclear data of nuclides containing isomers.
-
The authors are grateful to the staff at the K-400 Intense Neutron Generator at the Chinese Academy of Engineering Physics for their excellent operation of the neutron generator and other support during the experiment.
Determination of the half-life of 184gRe and the isomeric ratio of 184m, gRe induced by D-T neutrons
- Received Date: 2022-03-30
- Available Online: 2022-11-15
Abstract: The isomeric ratio of 184m, gRe and the half-life of 184gRe were measured in the 185Re (n, 2n) 184Re reaction at 14.8 MeV, and the uncertainty was discussed in detail. The measurements were performed using the activation method implemented for a rhenium sample using the K-400 neutron generator at the Chinese Academy of Engineering Physics (CAEP). Isomeric state and ground state nuclei of 184Re were identified by their γ-ray spectra. To eliminate the effect of the γ-ray emitted from the isomer on the counting of the ground state characteristic peaks, the isomeric ratio of 184m, gRe was calculated to be 0.29 ± 0.11 according to the neutron activation cross-section formula. This result is consistent with previous data within the uncertainty and can be used to determine parameters that characterize the dependence of the level density on the excitation energy and angular momentum. Through exponential function fitting and a detailed discussion of the uncertainty evaluation, the half-life of 184gRe was determined as 35.43 ± 0.16 d, which is consistent with the currently recommended value; however, the uncertainty assessment of the latter was barely documented. In addition, this study indicates that the half-life of the ground state can be obtained by eliminating the contamination of γ-rays emitted from the isomer, which provides the possibility of determining the half-lives of nuclides containing isomers.


 DownLoad: