-
In recent years, newly discovered charmonium-like states have attracted great attention owing to their exotic properties [1−4]. These states are above the open-charm threshold, and their strong coupling to hidden-charm processes suggests that they could be candidates for unconventional charmonium states. The study of the properties of these states, through either verifying or excluding possible interpretations about their exotic nature (such as molecular states, tetraquark states, and hybrid states), or establishing the connection between these states and higher excited charmonium states, has the potential to provide more insight into the quark model and a better understanding of quantum chromodynamics (QCD).
The BESIII experiment [5], which operates at the τ-charm factory BEPCII [6], has collected the world's largest
$ e^+e^- $ collision data samples at center-of-mass (CM) energies between 3.81 and 4.60 GeV [7]. In this energy region, charmonium-like states (also called XYZ states), along with higher excited charmonium states, can be produced copiously, and comprehensive studies on these particles can be performed. Moreover, the data can be used in other studies beyond the field of charmonium physics, such as R measurement, or on various topics in charm physics.To shed light on the topics mentioned above, it is essential to measure the production cross sections of these states, which in return requires precise knowledge of the time-integrated luminosities of the relevant data samples.
In this paper, we present the results of luminosity measurements for the XYZ data samples taken by BESIII from December 2016 to May 2017, as well as an update on the previous measurement for the XYZ data samples taken from December 2011 to May 2014 [8]. The update is necessary because a malfunction of the detector that was not modeled in Monte Carlo (MC) simulation, which resulted in an underestimation of the previously measured integrated luminosities, was recently discovered. The measurement is based on the analysis of the Bhabha scattering process
$ e^+e^-\to (\gamma) e^+e^- $ , and the procedure we use is similar to that in a previous BESIII analysis [8]. The process is chosen for its clean signature and large production cross section, which is known with high theoretical precision. These features allow precise measurement with small statistical and systematic uncertainties. -
BESIII is a general purpose detector that operates at the
$ e^+e^- $ collider BEPCII [6]. Owing to the crossing angle of the beams at the interaction point, the$ e^+e^- $ CM system is slightly boosted with respect to the laboratory frame. A detailed description of the facility is given in Ref. [5]. The cylindrical core of the BESIII detector covers 93% of the full solid angle and consists of a helium-based multilayer drift chamber (MDC), plastic scintillator time-of-flight system (TOF), and CsI(Tl) electromagnetic calorimeter (EMC), which are all enclosed in a superconducting solenoidal magnet providing a 1.0 T magnetic field. The solenoid is supported by an octagonal flux-return yoke with resistive plate counter muon identification modules interleaved with steel. The charged-particle momentum resolution at$ 1\; {\rm GeV}/{\rm c} $ is$ 0.5% $ , and the dE/dx resolution is$ 6% $ for electrons from Bhabha scattering. The EMC measures photon energies with a resolution of$ 2.5% $ ($ 5% $ ) at$ 1 $ GeV in the barrel (end-cap) region. The time resolution in the TOF barrel region is 68 ps, whereas that in the end-cap region is 110 ps. The end-cap TOF system was upgraded in 2015 using multi-gap resistive plate chamber technology, providing a time resolution of 60 ps [9−11]. A Geant4 [12] based detector simulation package has been developed to model the detector response.From December 2016 to May 2017, eight datasets were taken at CM energies between 4.19 and 4.28 GeV. These datasets were collected in the vicinity of the
$ Y(4230) $ and$ Y(4320) $ resonances to study the line shapes of the production cross sections and the decay properties of these charmonium-like states. The CM energy ($ E_{{{\rm{CM}}}} $ ) of each data sample has been determined with the process$ e^+e^-\to \mu^+\mu^- $ [13] and is listed in Table 1.Sample $ E_{{{\rm{CM}}}} $ /MeV

$ N_{\rm obs} $ (

$ \times 10^6 $ )

$ N_{\rm cor} $ (

$ \times 10^6 $ )

$ \sigma_{\rm Bhabha} $ /nb

ε (%) $ {\cal L} $ /

$ \rm pb^{-1} $ 

4190 4189.12 32.62 0.04 354.82 17.60 526.7 $ \pm 0.1 \pm 2.2 $ 

4200 4199.15 32.59 0.05 353.88 17.53 526.0 $ \pm 0.1 \pm 2.1 $ 

4210 4209.39 31.73 0.05 352.98 17.40 517.1 $ \pm 0.1 \pm 1.8 $ 

4220 4218.93 31.45 0.05 352.42 17.41 514.6 $ \pm 0.1 \pm 1.8 $ 

4237 4235.77 32.32 0.07 350.79 17.41 530.3 $ \pm 0.1 \pm 2.7 $ 

4246 4243.97 32.65 0.07 350.26 17.38 538.1 $ \pm 0.1 \pm 2.6 $ 

4270 4266.81 31.86 0.08 348.01 17.31 531.1 $ \pm 0.1 \pm 3.1 $ 

4280 4277.78 10.46 0.03 346.92 17.21 175.7 $ \pm 0.1 \pm 1.0 $ 

Table 1. Summary of the integrated luminosity results for the 2016–2017 XYZ data samples.
$ N_{\rm cor} $ is the number of events recovered by the correction for the EMC readout error defined in Sec. IV. The first uncertainties are statistical, and the second uncertainties are systematic.For each dataset, two million Bhabha events are generated with the babayaga@nlo [14] generator using the parameters presented in Table 2. In the simulation, the scattering polar angle of the final state electrons is limited to the range from
$ 20^\circ $ ($ \theta_{\rm min} $ ) to$ 160^\circ $ ($ \theta_{\rm max} $ ), fully covering the detector acceptance. The beam energy is set to the value determined with$ e^+e^-\to \mu^+\mu^- $ events in the same dataset [13], and the energy spread is set to be 1.364 MeV. An energy threshold of 1.0 GeV ($ E_{\rm min} $ ) is applied to the final-state electrons and positrons.Parameter Value $ E_{{{\rm{CM}}}} $ /MeV

$ {\rm{4189.12}} $ 

Beam energy spread/MeV $ {\rm{1.364}} $ 

$ \theta_{\rm min} $ /(

$ ^\circ $ )

$ {\rm{20}} $ 

$ \theta_{\rm max} $ /(

$ ^\circ $ )

$ {\rm{160}} $ 

Maximum acollinearity/( $ ^\circ $ )

$ {\rm{180}} $ 

$ E_{\rm min} $ /GeV

1 $ M( e^+e^-) $ /(GeV/

$ {\rm c}^2 $ )

$> {\rm{3.8}} $ 

Table 2. Parameters of the babayaga@nlo generator for the MC sample at
$ E_{{{\rm{CM}}}}=4.19 $ GeV. For the other energy points, only the$ E_{{{\rm{CM}}}} $ setting changes.The acollinearity of the events (that is, the angle between the electron and the reverse extension line of the positron) and the number of photons from initial/final state radiation are not constrained. Additionally, a selection of the invariant mass of the
$ e^+e^- $ pair ($ M( e^+e^-) $ ) larger than 3.8 GeV/$ {\rm c}^2 $ is applied to reduce the computing time of simulation by avoiding the need to sample over narrow states, such as the$ \psi(2S) $ and$ J/\psi $ resonances. -
Signal Bhabha candidate events must have two oppositely charged good tracks. The good tracks must originate from a cylindrical volume, centered around the interaction point, with a radius of 1 cm perpendicular to the beam axis, and a length of
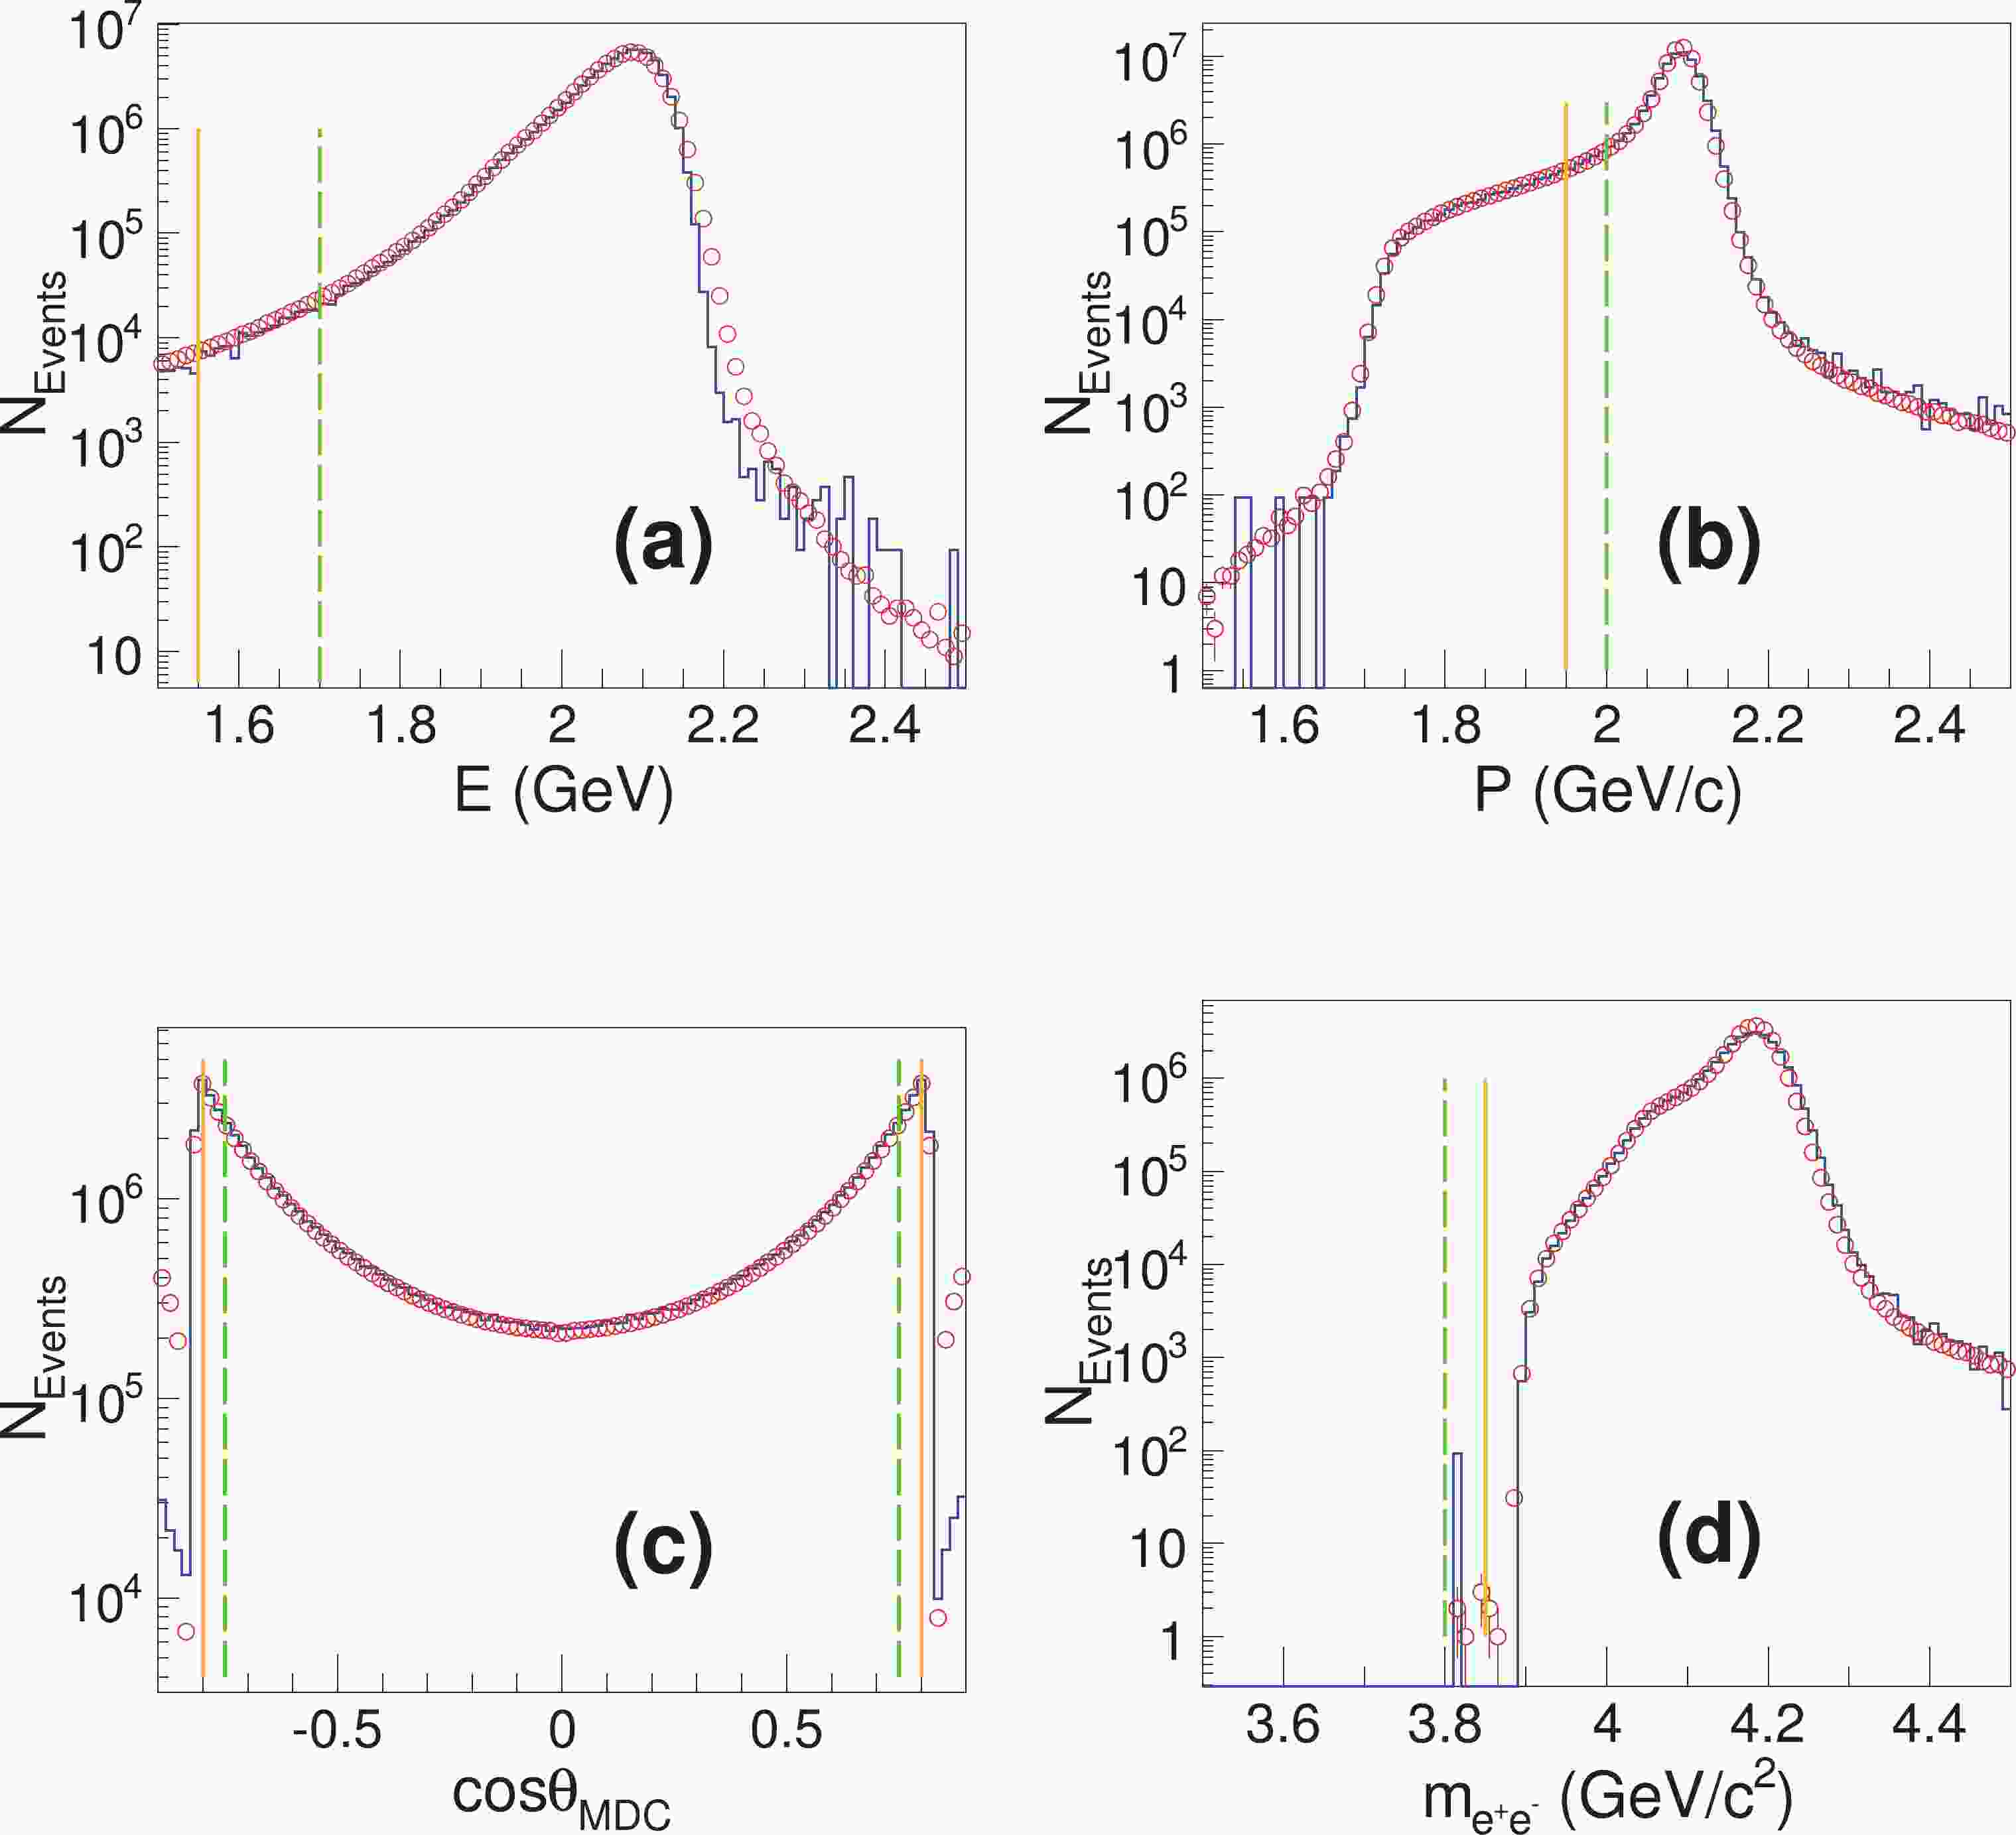
$ \pm $ 10 cm along the beam axis. The polar angle of the tracks$ \theta_{{\rm{MDC}}} $ , measured using the MDC and boosted to the$ e^+e^- $ CM frame, must be in the fiducial volume of$ |\cos\theta_{{\rm{MDC}}}|<0.8 $ . The deposited energy of each track in the EMC must be larger than$ 0.37 \times E_{{{\rm{CM}}}} $ , and the momentum of each track must be larger than$ 0.47 \times E_{{{\rm{CM}}}} $ to reduce background from di-muon pairs or the decays of light resonances, respectively. The invariant mass of the track pair must be larger than 3.85 GeV/$ {\rm c}^2 $ because only events with an invariant mass above 3.8 GeV/$ {\rm c}^2 $ are produced in the MC event generator.As demonstrated by a similar previous analysis [8], the remaining background contribution after applying these selection criteria is negligible.
Figure 1 shows a comparison between data and MC simulation for the kinematic variables previously discussed. There is reasonable agreement between the distributions of all the variables.
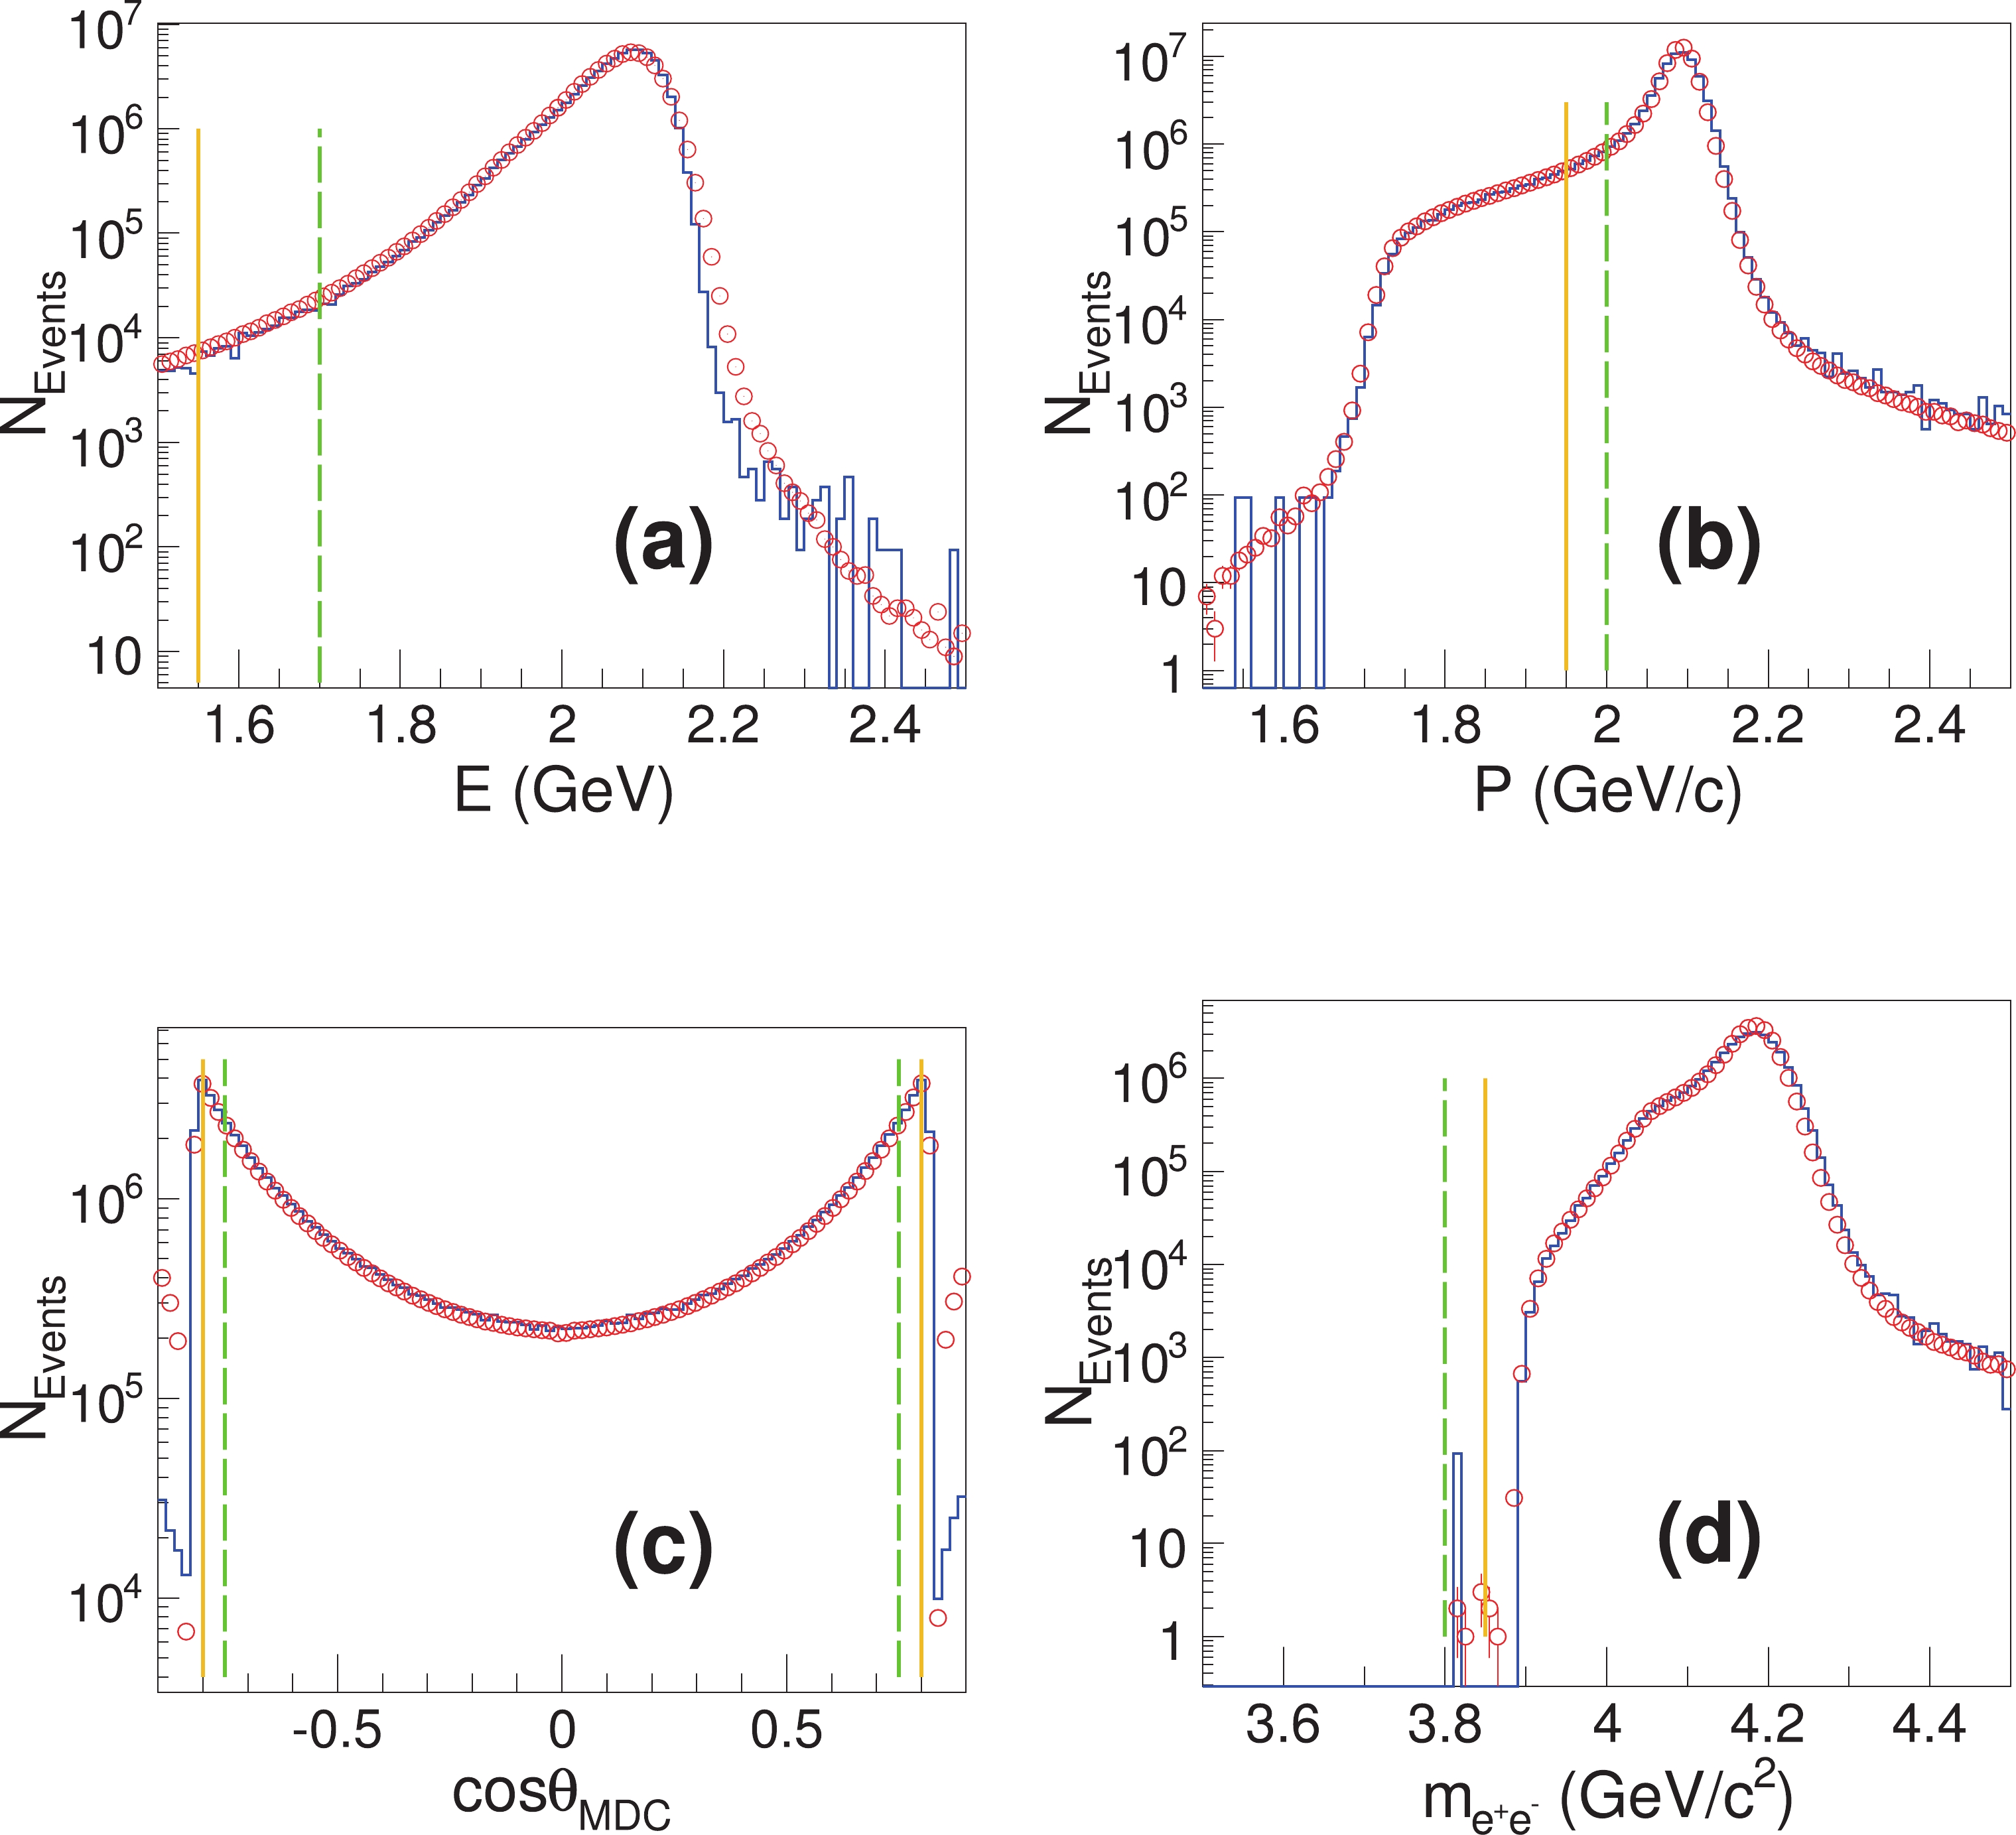
Figure 1. (color online) Data and MC simulation comparison for the variables used in event selection for the 4190 data samples, including the energy deposition in the EMC (a), the momentum (b), and the polar angle θ (c) of electrons and positrons, as well as the invariant mass of the
$ e^+e^- $ pair (d). The red circles indicate data, whereas the blue histograms are the MC distributions. The yellow solid lines mark the thresholds of the standard selection criteria, whereas the green dashed lines indicate altered values used for systematic uncertainty estimation. All the relevant tracks are boosted to the$ e^+e^- $ CM frame. -
The energy deposition in the EMC is used to identify the final state electron/positron tracks. In a study of high energy EMC showers, we found that the EMC electronics occasionally failed to provide valid signals for crystals with high deposited energy. The problem mainly occurred for channels in the absolute polar angle (
$ \cos{{\rm{\theta}}} $ ) ranges (0.6, 0.8) close to the horizontal plane. To illustrate this issue, consider the left plot of Fig. 2, which shows the EMC energy deposition of a typical high energy (approximately 2 GeV) electron or positron shower, where no problem occurs. The shower extends across$ 5\times5 $ crystals, and the deposited energy in crystals numbered (24, 2) is 1592 MeV, one order of magnitude larger than those of nearby crystals. In contrast, the right plot of Fig. 2 shows an example of a shower missing the readout of the EMC energy deposition from one crystal. Here, the largest energy deposition is expected to be found in the crystal numbered (59, 3), but no valid value is recorded, which leads to an underestimation of the total deposited energy of more than 1 GeV. This effect is not simulated in the MC samples and must be corrected.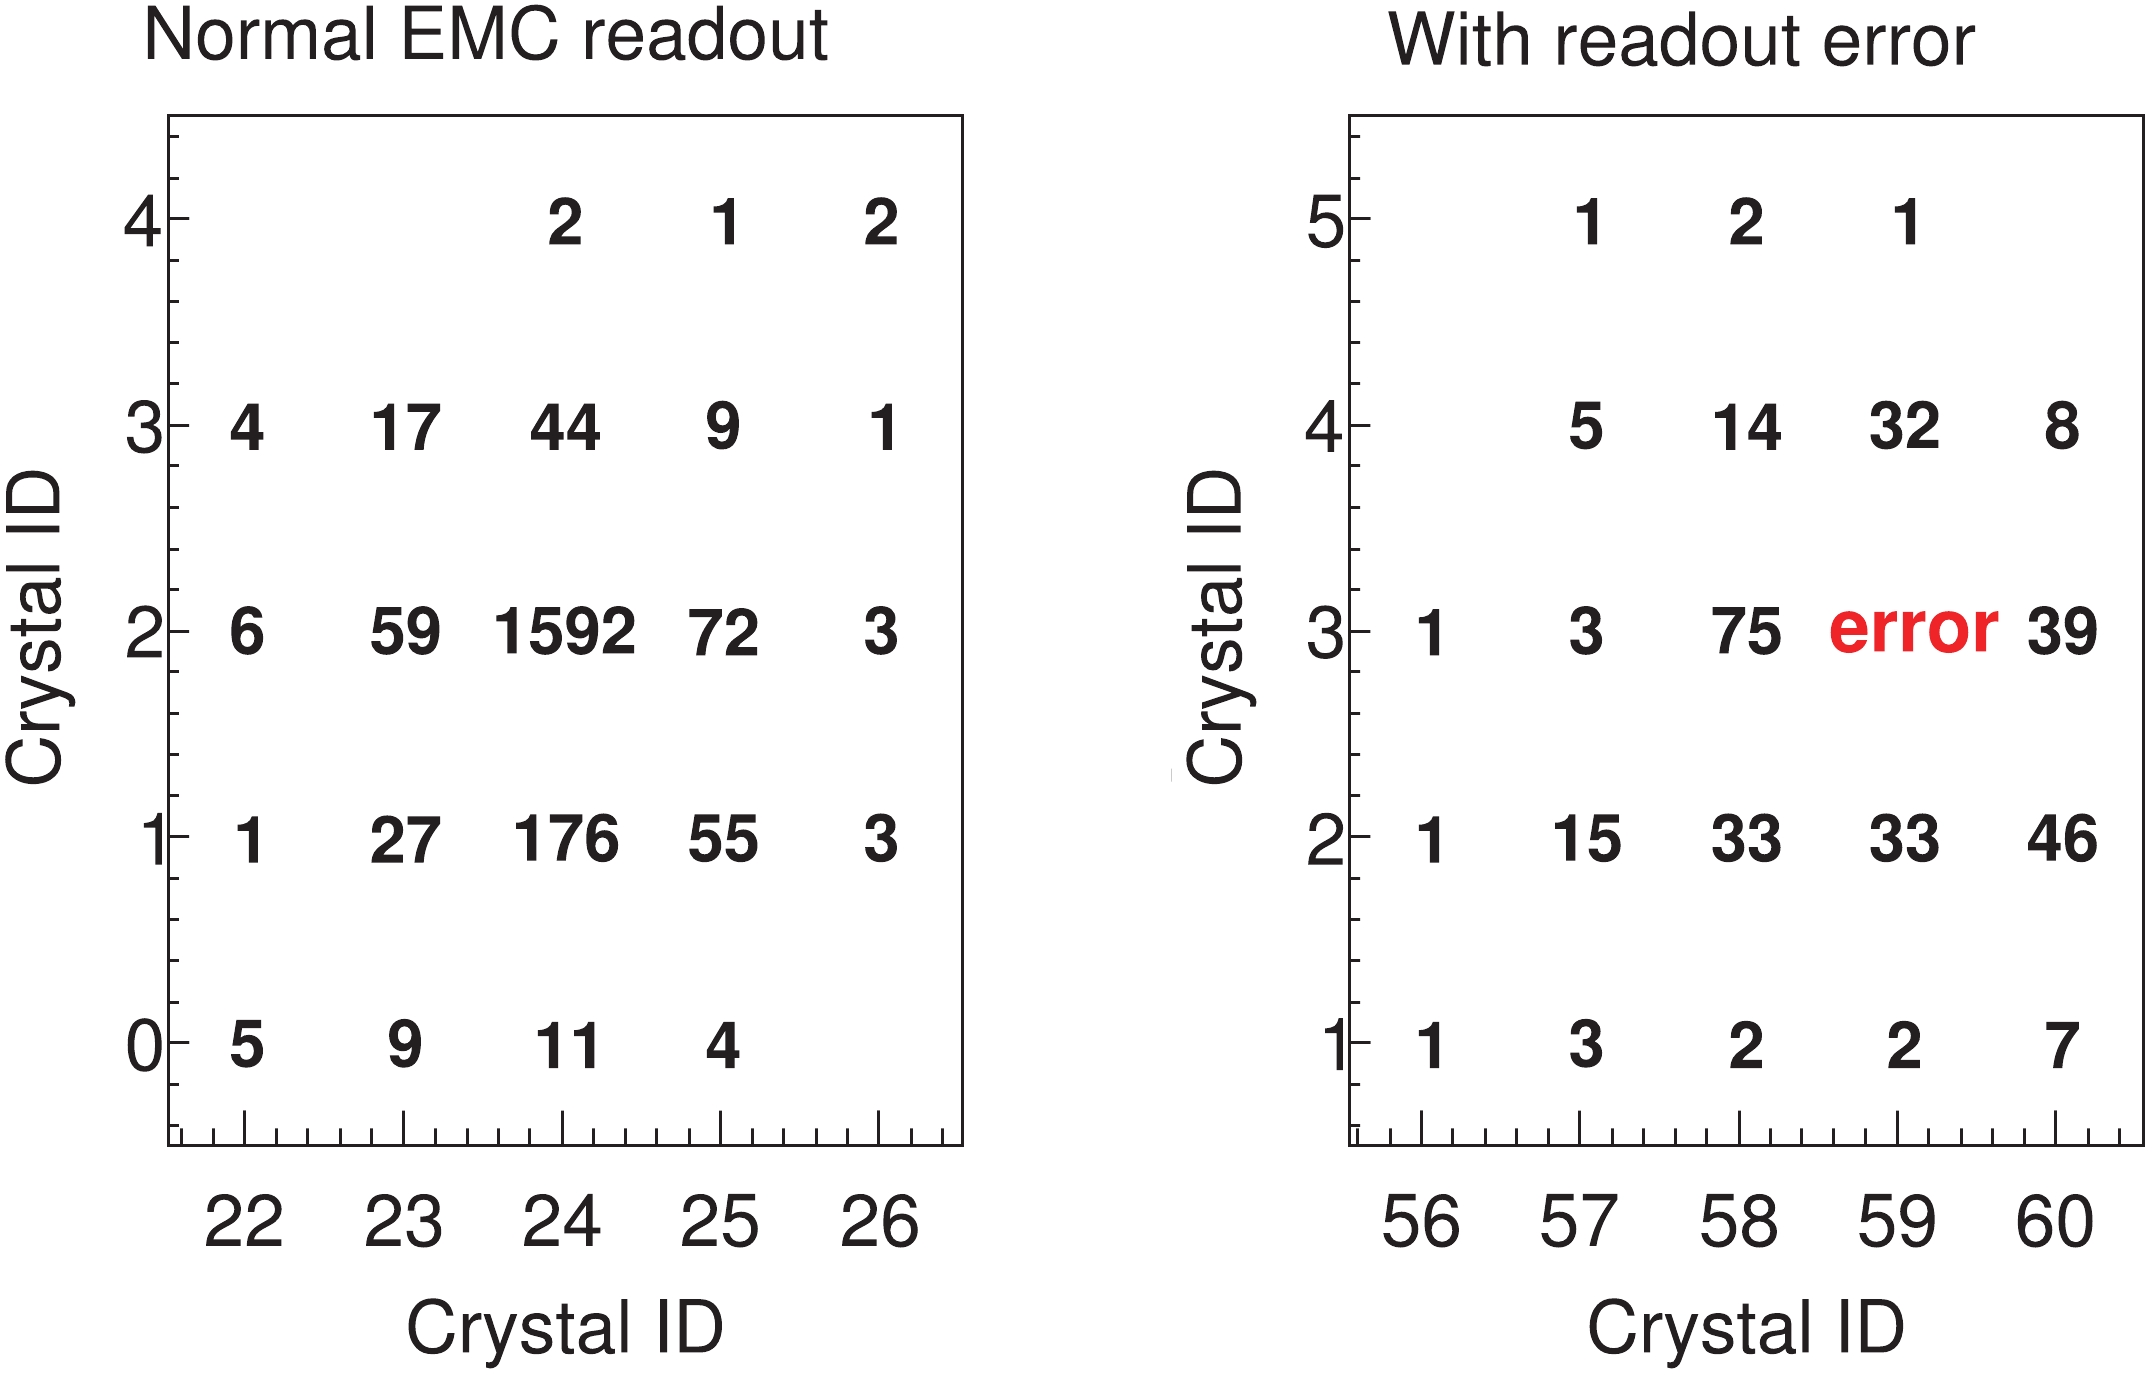
Figure 2. (color online) EMC energy distributions of a normal EMC shower (left) and an abnormal one suffering from EMC readout errors (right). The x-axis and y-axis mark the EMC crystal ID. The number in each bin represents the deposited energy in the crystal (in MeV). The hitmap of the abnormal track is characterized by a missing value in the middle, where major energy deposition is expected.
Although the reason of this problem is still under investigation, the amount of affected events can be estimated by searching for MDC tracks with unexpected EMC information. Figure 3 shows the dielectron deposited energies for events satisfying all the other requirements of our selection criteria for the MC sample and experimental data. In the plots, two abnormal peaks can be found for the data samples, which are not present for the MC sample. These peaks are formed by events in which the reconstructed energy deposition by the charged track in the EMC is missing the readout signal from one crystal. To select these events, we apply all the requirements apart from that on the deposited energy in the EMC. Afterward, we require the deposited energy in the EMC to be larger than
$ 0.37 \times E_{{{\rm{CM}}}} $ for one track and lower than$ 0.15 \times E_{{{\rm{CM}}}} $ for the other. Events in which both tracks are affected by EMC readout errors are rare, and their contribution is considered negligible. Finally, we require the ionization energy loss of both tracks in the MDC to be close to the expected energy loss of electron tracks of the same energy.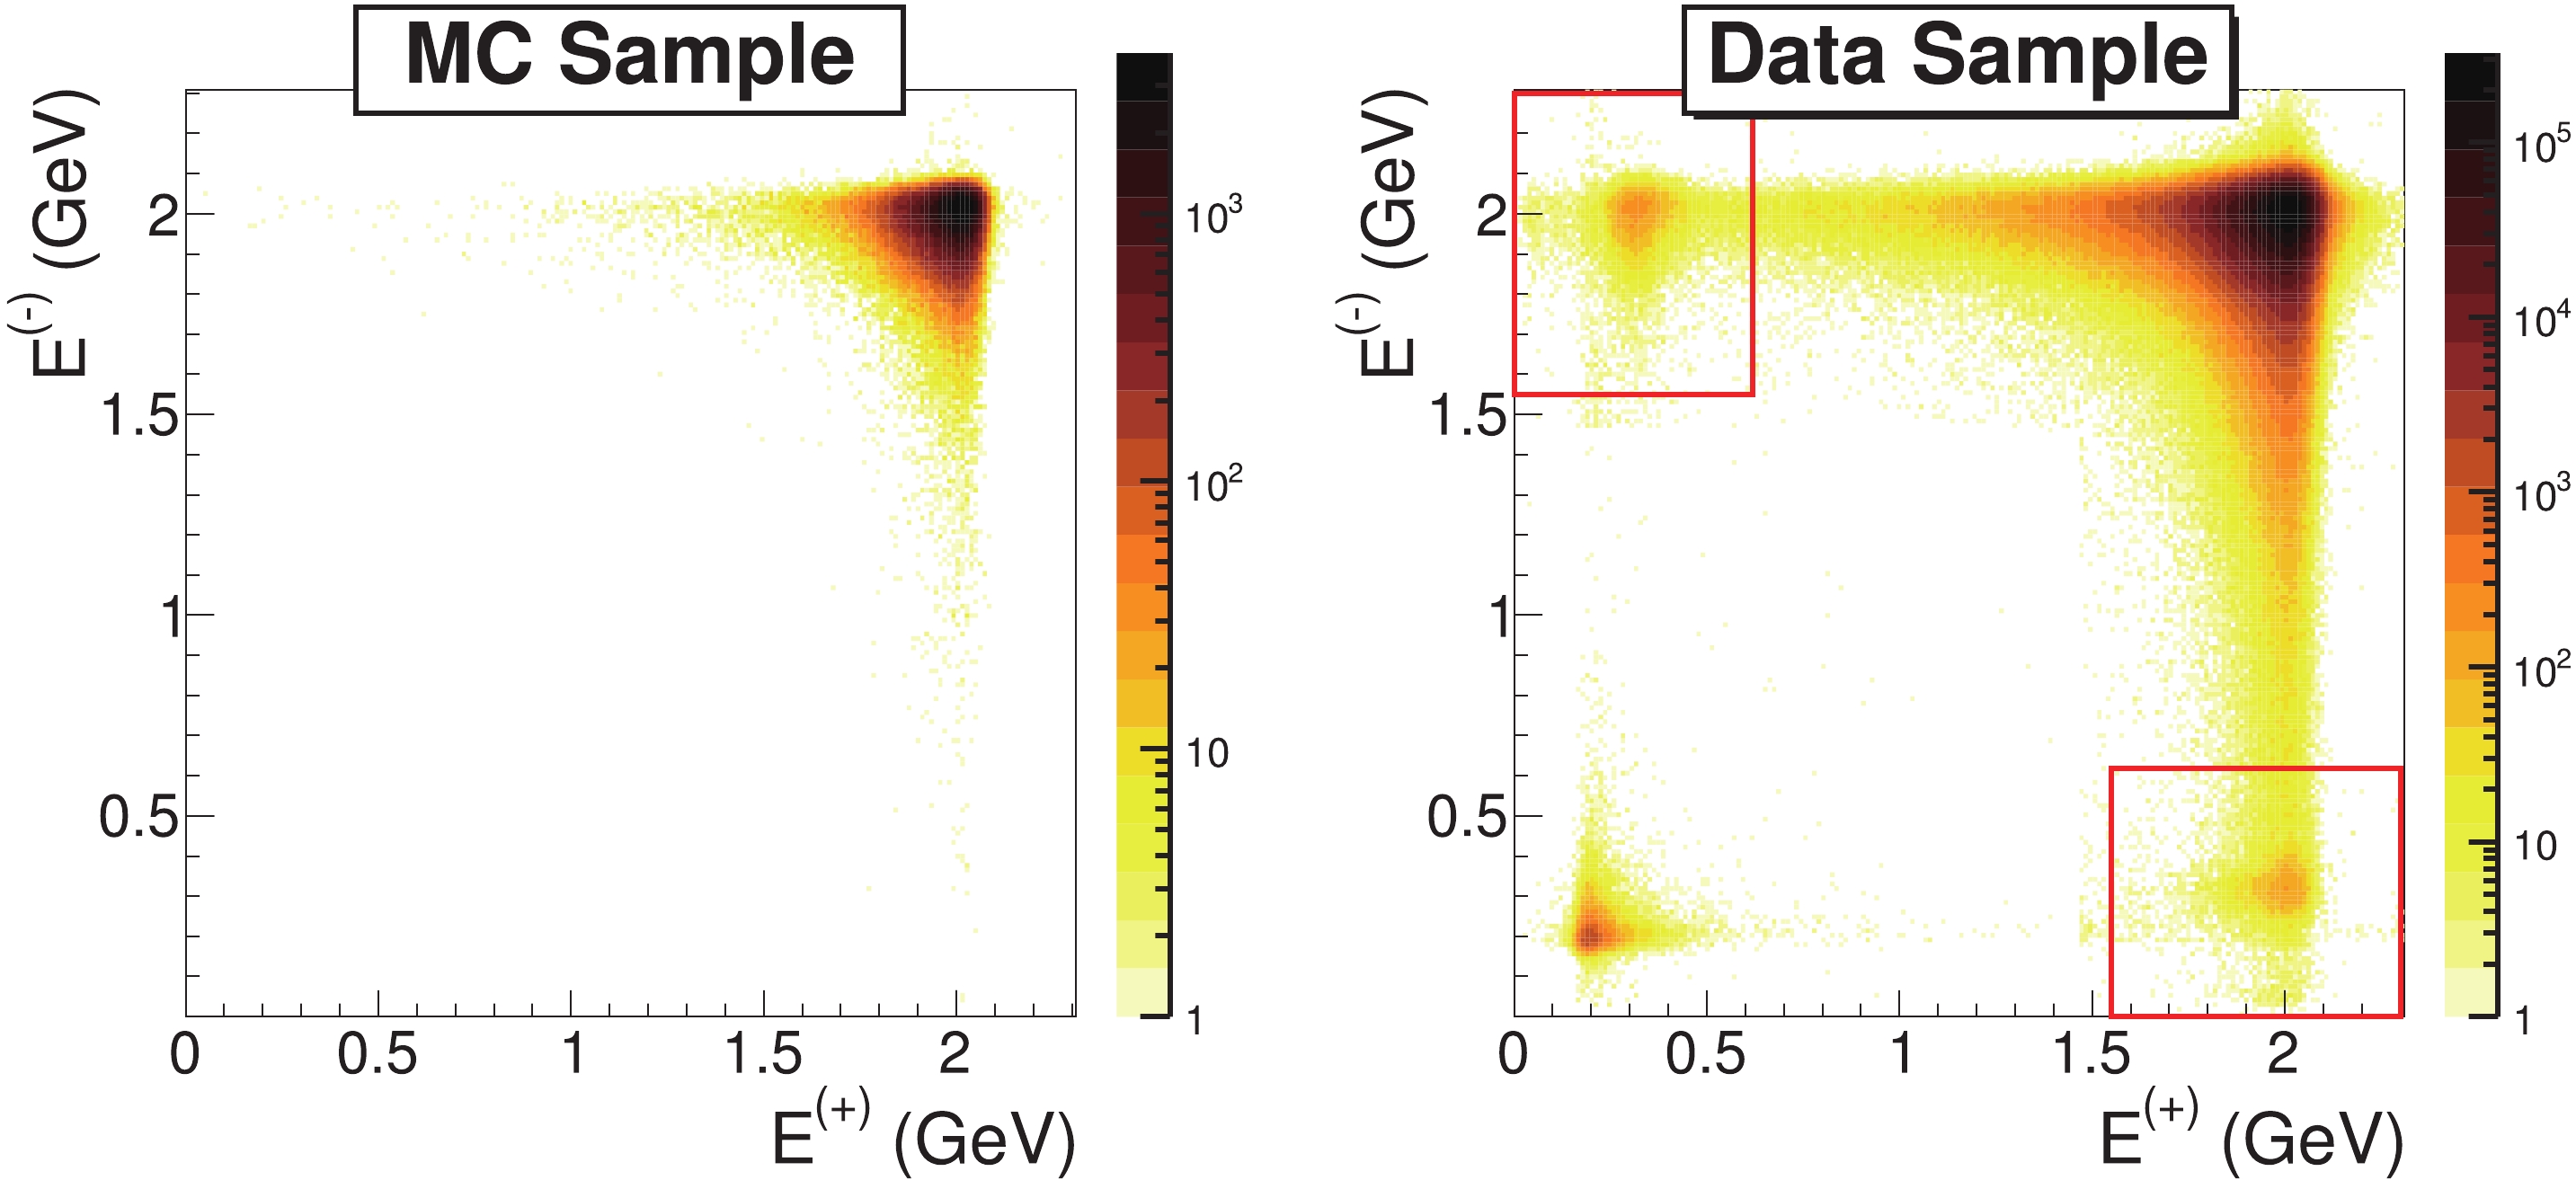
Figure 3. (color online) Deposited energies of positively charged tracks (
$ {E}^{(+)} $ ) and negatively charged tracks ($ {E}^{(-)} $ ) for events satisfying all requirements, except for the EMC energy depositions, for the MC sample (left) and data sample (right) at 4.19 GeV. There are large differences between the energy distributions of the two samples. In the data sample, aside from di-muon events in which the deposited energies of both tracks are low, there are abnormal events where only one track has a low energy deposition (marked by red boxes).Because no normal physics events should be able to pass the above selection, we assume that all the candidates that do are Bhabha events suffering from EMC readout errors. These events are simply added to the sample of observed Bhabha events, whose selection is summarized in Sec. III.
The integrated luminosity is calculated with the equation
$ \begin{equation} {\cal L} = \frac{N_{\rm obs}+N_{\rm cor}}{\sigma_{\rm Bhabha} \times \varepsilon}, \end{equation} $

(1) where
$ N_{\rm obs} $ is the number of observed Bhabha events,$ N_{\rm cor} $ is the number of events recovered by the correction of the EMC readout error,$ \sigma_{\rm Bhabha} $ is the cross section of the Bhabha process, and ε is the efficiency determined with the signal MC sample. The cross sections are calculated using the babayaga@nlo generator with the parameters listed in Table 2. All the input numbers and luminosity results are listed in Table 1. -
The following sources of systematic uncertainties are considered: the tracking efficiency, the requirements on the kinematic variables, the limited sizes of the MC samples, the beam energy measurement, the EMC readout correction, and the MC generator.
To estimate the systematic uncertainty on the tracking efficiency, we employ an alternative selection criterion using information from the EMC only. Here, at least two clusters in the EMC are required; if more than two clusters are present, the most energetic two are identified as the
$ e^+e^- $ pair. The deposited energies of the two clusters must be larger than$ 0.45 \times E_{{{\rm{CM}}}} $ . The polar angle of each cluster must satisfy$ |\cos\theta_{\rm EMC}|<0.8 $ . Additionally,$ \Delta\phi $ must be in the range$ [-40^\circ,\; -5^\circ] $ or$ [5^\circ,\; 40^\circ] $ , where$ \Delta\phi = |\phi_1- \phi_2|- 180^\circ $ , and$ \phi_{1,2} $ are the azimuthal angles of the clusters in the EMC. All the angles are boosted to the$ e^+e^- $ CM frame. The difference between the luminosity obtained through this selection and the original result before the EMC readout correction is taken as the systematic uncertainty arising from tracking efficiency.The systematic uncertainties related to the requirements on the kinematic variables are evaluated by varying the thresholds of the variables. For the requirement on the EMC energy, the alternative threshold is
$ 0.41 \times E_{{{\rm{CM}}}} $ ; for the polar angle, the alternative range is$ [-0.75,\; 0.75] $ ; for the requirement on momentum, the threshold is changed to$ 0.48\times E_{{{\rm{CM}}}} $ . For the invariant mass of the$ e^+e^- $ pair, the alternative threshold is 3.80 GeV/$ {\rm c}^2 $ , and the corresponding uncertainty is found to be negligible.The statistical uncertainties on the MC samples size, each having two million events with a selection efficiency of approximately 17%, are estimated to be 0.2% at each energy point.
The uncertainty on the CM energy measurement is
$ \pm0.6 $ MeV [13]. Its effect on luminosity determination is estimated by repeating the analysis on the same datasets while changing the CM energy value by plus and minus this value. To avoid an additional systematic uncertainty due to the MC data sample size, we obtain the detection efficiency and cross section values through linear extrapolation from nearby energy points. The uncertainty is estimated as the difference in integrated luminosity compared to our standard result. The small difference between the measured beam-energy spread [15] and that used in the generation of the MC samples leads to a negligible bias in the analysis.The systematic uncertainty from the EMC readout correction is estimated by comparing the results with an alternative correcting method, where events with one or two tracks not satisfying the energy requirements are selected, and the correction is estimated by fitting the two-dimensional dE/dx distribution of the two tracks in these events with a model containing three components: Bhabha events, di-muon events, and a background of uniform distribution. The uncertainty is estimated as the difference between the result of the two correction methods.
The uncertainty on the predictions of the babayaga@nlo generator is assigned to be 0.1%, following Ref. [14].
The total uncertainty for each energy point is summarized in Table 3. The uncertainties from different sources are assumed to be independent; therefore, the total uncertainties are obtained by adding the uncertainties in quadrature.
Sample/MeV 4190 4200 4210 4220 4237 4246 4270 4280 Tracking efficiency 0.13 0.17 0.05 0.08 0.24 0.15 0.30 0.29 Requirement on energy 0.12 0.11 0.12 0.14 0.09 0.12 0.13 0.10 Requirement on $ \cos\theta $ 

0.24 0.22 0.21 0.22 0.32 0.37 0.43 0.39 Requirement on momentum 0.14 0.08 0.01 0.00 0.17 0.06 0.09 0.01 CM energy 0.06 0.07 0.00 0.01 0.04 0.04 0.02 0.01 MC sample size 0.2 0.2 0.2 0.2 0.2 0.2 0.2 0.2 Correction of EMC readout error 0.05 0.06 0.08 0.04 0.07 0.06 0.06 0.05 Event generator 0.1 0.1 0.1 0.1 0.1 0.1 0.1 0.1 Total 0.41 0.39 0.35 0.35 0.45 0.50 0.59 0.55 Table 3. Relative systematic uncertainties (in %) for the integrated luminosities of the new XYZ dataset.
-
An update on the integrated luminosities of the 21 data samples collected in 2010–2014, previously reported in Ref. [8], is required to apply the EMC readout correction, as described in the previous section, and include additional events originating from the recovery of data files that were not originally available.
The same procedure described for the 2016–2017 data samples is applied for this update, with the same configurations of the MC generator, the same event selection criteria, and the same EMC readout correction. The babayaga@nlo event generator we use in this analysis has a significantly better precision than the event generator used in the previous analysis [8] (0.1% versus 0.5%), which contributes to the decrease in the total uncertainties.
Table 4 summarizes the updated integrated luminosities with statistical uncertainties, the correction factors due to the EMC readout error, and a comparison with the results of the previous analysis. The results of the three lowest energy points (samples 3810, 3900, and 4009) are not updated because there is no file update and, according to the correlation between the amount of EMC readout correction and the CM energies in other datasets, the EMC readout correction is expected to be negligible at these energy points. We skip the unnecessary update for these data samples to avoid dealing with the computational difficulty of MC sampling over narrow resonances. For the remaining energy points, the updated results are a factor of
$ 0.3% - 4.8% $ larger than the original values.$ E_{\rm cm}/\rm MeV $ 

$ \sigma_{\rm EMC} $ (%)

Updated $ {\cal L} $ /

$ \rm pb^{-1} $ 

Previous $ {\cal L} $ /

$ \rm pb^{-1} $ 

Difference (%) $ 3810 $ 

− − $ 50.54 \pm 0.03 $ 

− $ 3900 $ 

− − $ 52.61 \pm 0.03 \pm 0.51 $ 

− $ 4009 $ 

− − $ 482.0 \pm 0.1 \pm 4.7 $ 

− $ 4090 $ 

$ 0.07 \pm 0.04 $ 

$ 52.86 \pm 0.03 \pm 0.35 $ 

$ 52.63 \pm 0.03 \pm 0.51 $ 

$ +0.43 $ 

$ 4190 $ 

$ 0.19 \pm 0.04 $ 

$ 43.33 \pm 0.03 \pm 0.29 $ 

$ 43.09 \pm 0.03 \pm 0.42 $ 

$ +0.56 $ 

$ 4210 $ 

$ 0.24 \pm 0.00 $ 

$ 54.95 \pm 0.03 \pm 0.36 $ 

$ 54.55 \pm 0.03 \pm 0.53 $ 

$ +0.73 $ 

$ 4220 $ 

$ 0.24 \pm 0.04 $ 

$ 54.60 \pm 0.03 \pm 0.36 $ 

$ 54.13 \pm 0.03 \pm 0.53 $ 

$ +0.86 $ 

$ 4230_1 $ 

$ 0.27 \pm 0.04 $ 

$ 44.54 \pm 0.03 \pm 0.29 $ 

$ 44.40 \pm 0.03 \pm 0.43 $ 

$ +0.32 $ 

$ 4230_2 $ 

$ 0.27 \pm 0.04 $ 

$ 1056.4 \pm 0.1 \pm 7.0 $ 

$ 1047.3 \pm 0.1 \pm 10.1 $ 

$ +0.86 $ 

$ 4245 $ 

$ 0.31 \pm 0.03 $ 

$ 55.88 \pm 0.03 \pm 0.37 $ 

$ 55.59 \pm 0.04 \pm 0.54 $ 

$ +0.53 $ 

$ 4260_{1,2} $ 

$ 0.34 \pm 0.04 $ 

$ 828.4 \pm 0.1 \pm 5.5 $ 

$ 523.7 \pm 0.1 \pm 5.1 $ 

$ +0.32 $ 

$ 302.0 \pm 0.1 \pm 3.0 $ 

$ 4310 $ 

$ 0.51 \pm 0.06 $ 

$ 45.08 \pm 0.03 \pm 0.30 $ 

$ 44.90 \pm 0.03 \pm 0.44 $ 

$ +0.40 $ 

$ 4360 $ 

$ 0.74 \pm 0.06 $ 

$ 544.0 \pm 0.1 \pm 3.6 $ 

$ 540.0 \pm 0.1 \pm 5.2 $ 

$ +0.76 $ 

$ 4390 $ 

$ 0.95 \pm 0.05 $ 

$ 55.57 \pm 0.04 \pm 0.37 $ 

$ 55.18 \pm 0.04 \pm 0.54 $ 

$ +0.70 $ 

$ 4420_1 $ 

$ 1.13 \pm 0.07 $ 

$ 46.80 \pm 0.03 \pm 0.31 $ 

$ 44.67 \pm 0.03 \pm 0.43 $ 

$ +4.77 $ 

$ 4420_2 $ 

$ 1.20 \pm 0.06 $ 

$ 1043.9 \pm 0.1 \pm 6.9 $ 

$ 1028.9 \pm 0.1 \pm 10.0 $ 

$ +1.45 $ 

$ 4470 $ 

$ 1.71 \pm 0.03 $ 

$ 111.09 \pm 0.04 \pm 0.73 $ 

$ 109.94 \pm 0.04 \pm 1.07 $ 

$ +1.05 $ 

$ 4530 $ 

$ 2.38 \pm 0.11 $ 

$ 112.12 \pm 0.04 \pm 0.73 $ 

$ 109.98 \pm 0.04 \pm 1.07 $ 

$ +1.95 $ 

$ 4575 $ 

$ 3.13 \pm 0.14 $ 

$ 48.93 \pm 0.03 \pm 0.32 $ 

$ 47.67 \pm 0.03 \pm 0.46 $ 

$ +2.64 $ 

$ 4600 $ 

$ 3.51 \pm 0.15 $ 

$ 586.9 \pm 0.1 \pm 3.9 $ 

$ 566.9 \pm 0.1 \pm 5.5 $ 

$ +3.52 $ 

Table 4. Updated integrated luminosities of the 2010–2014 XYZ datasets, the correction factor due to the EMC readout error (
$\sigma_{\rm EMC}=N_{\rm cor}/N_{\rm obs}$ ), and a comparison with the previous results [5]. The first uncertainties are statistical, and the second uncertainties are systematic.The discrepancies are mainly caused by the EMC readout correction, and for several datasets, such as
$ 4420_1 $ and$ 4600 $ , there are also contributions from the recovery of data files. Figure 4 shows the correlation between the sizes of the EMC readout correction and the CM energies. This figure shows that the size of this correction increases exponentially as the CM energy increases, indicating that the problem may grow more severe if BESIII is to operate in higher energy zones. Moreover, the fact that the frequencies of EMC readout error fit well to an exponential model may hint at its mechanism.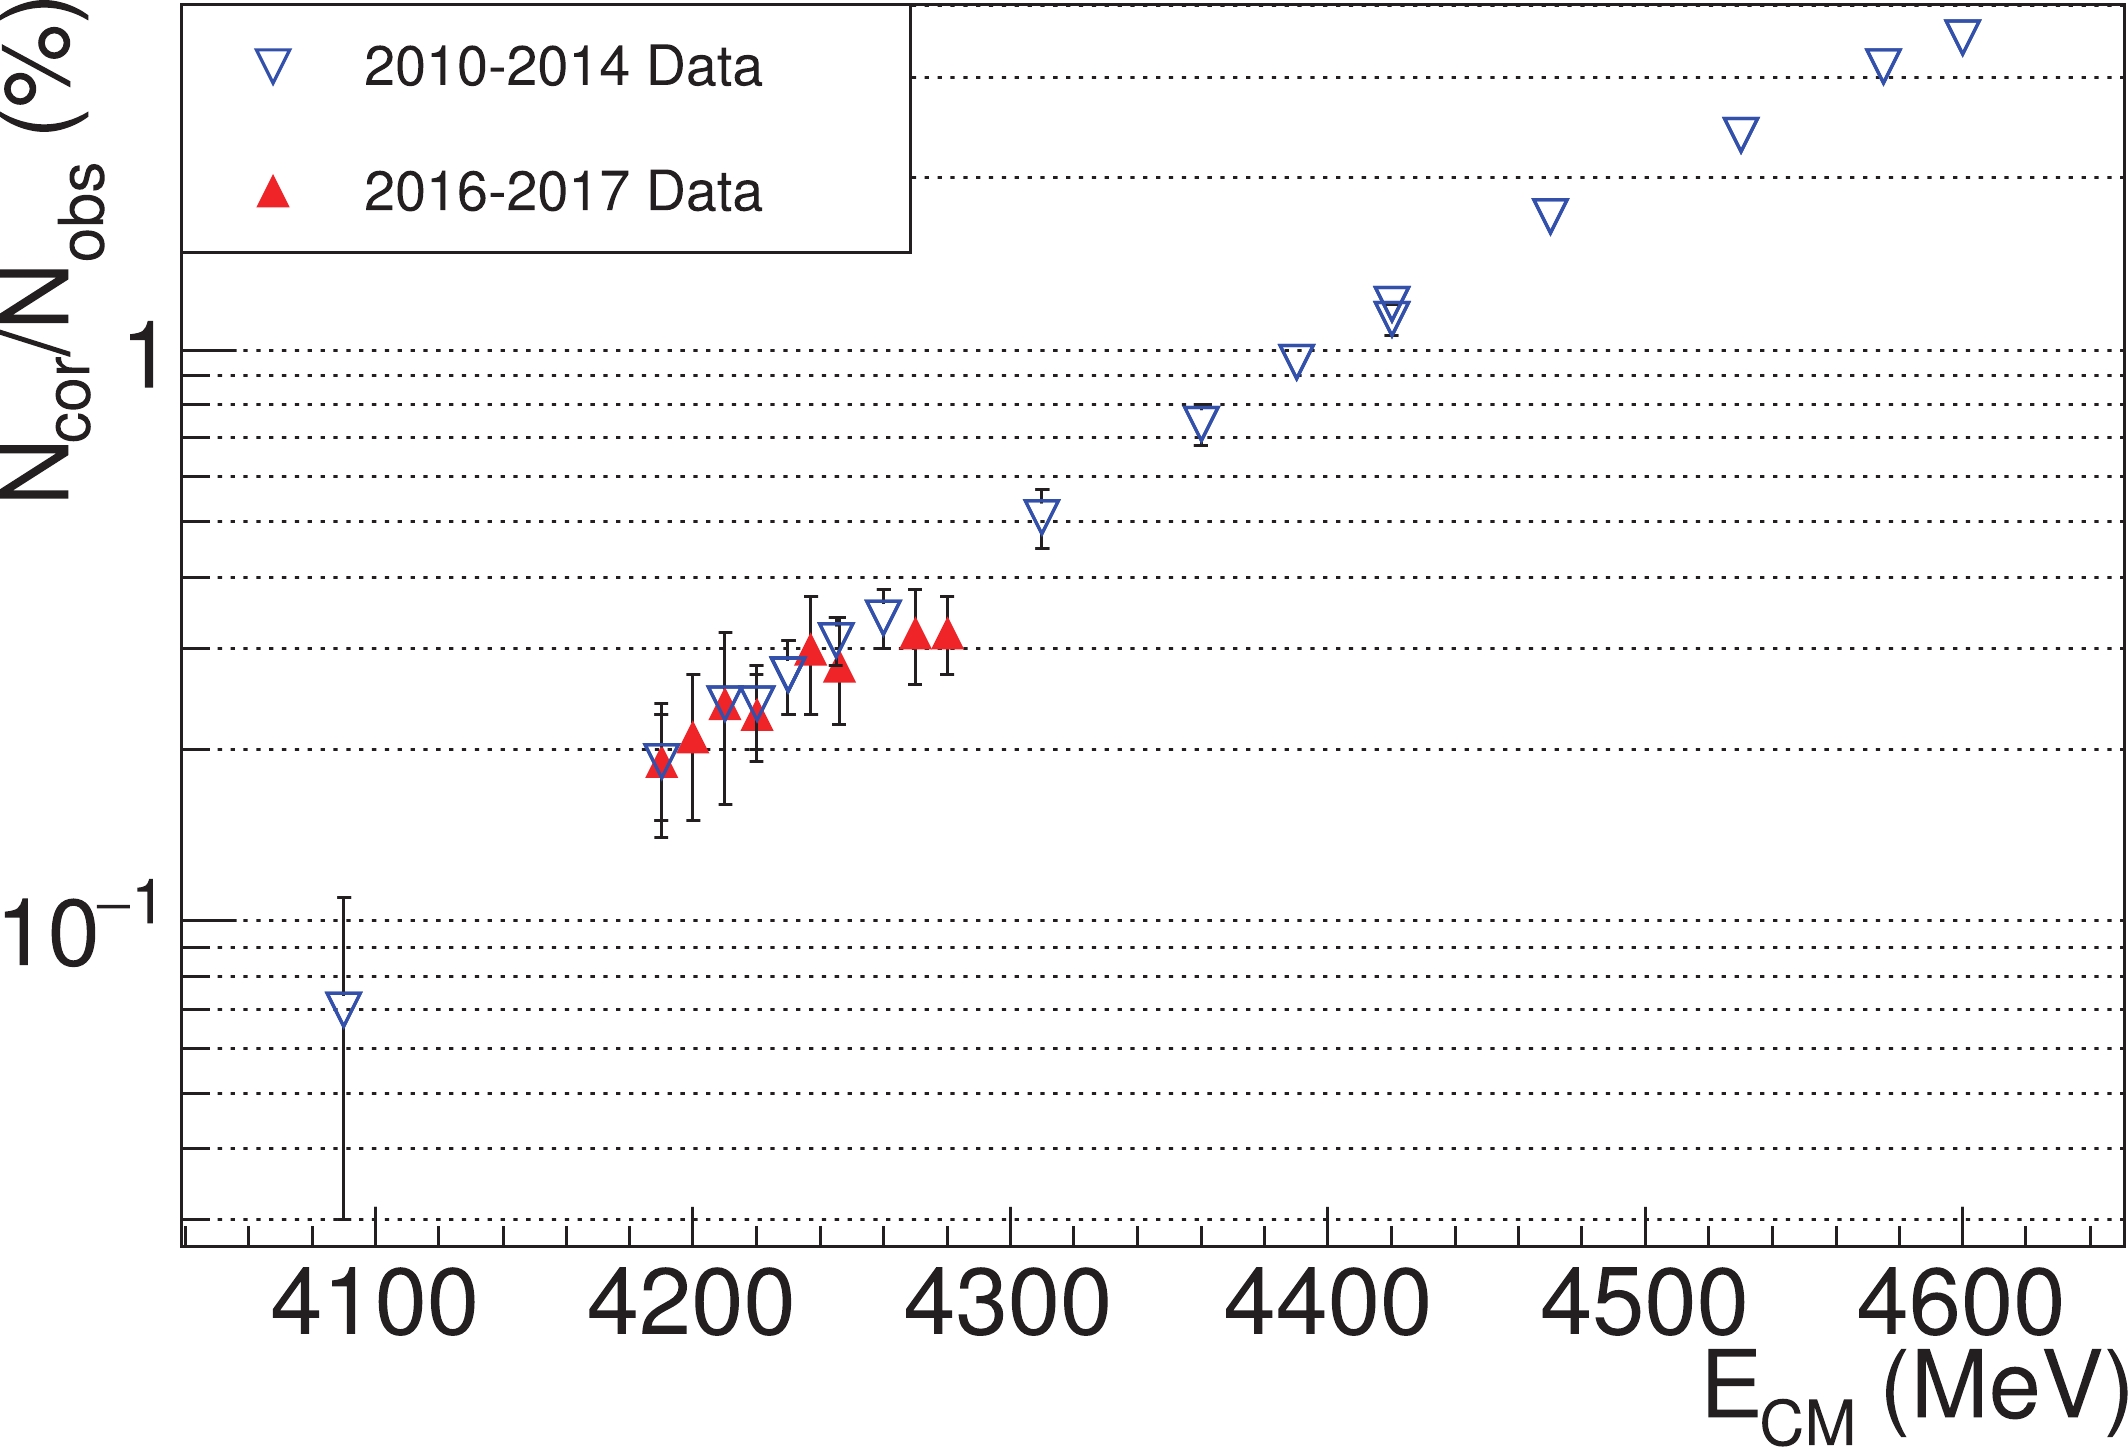
Figure 4. (color online) Logarithm of the relative sizes of the EMC readout correction at different CM energies for the 2010–2014 (blue) and 2016–2017 (red) XYZ datasets. The data points have a seemingly linear relationship, suggesting that the frequencies of the EMC readout errors may increase exponentially as the CM energy further increases.
Systematic uncertainties are assigned following the same procedure as for the 2016–2017 datasets. For each source of uncertainty, we take the maximum uncertainty for all the energy points. These uncertainties from individual sources are then added in quadrature to obtain the total systematic uncertainty. The result is summarized in Table 5. The total systematic uncertainty is determined as 0.66% for all energy points except the lowest three energy points, for which we quote the original uncertainty, 0.97% [8].
Source Relative uncertainty (%) Tracking efficiency $ 0.42 $ 

Requirement on energy $ 0.28 $ 

Requirement on $ \cos\theta $ 

$ 0.14 $ 

Requirement on momentum $ 0.29 $ 

CM energy $ 0.07 $ 

MC sample size $ 0.20 $ 

Correction of EMC readout errors $ 0.15 $ 

Event generator $ 0.10 $ 

Total $ 0.66 $ 

Table 5. Systematic uncertainties on the integrated luminosities of the 2010–2014 XYZ data samples, excluding those at the lowest three energy points. For each source of uncertainty, the maximum value across all energy points is taken as the overall estimation.
-
We measure the integrated luminosities of the XYZ datasets taken at BESIII from 2016 to 2017, and the results are listed in Table 1. Additionally, we update the luminosity measurement of the XYZ data taken from 2010 to 2014, with corrections arising from an improved understanding of the EMC performance and recovery of data files, as shown in Table 4. These high precision results are of fundamental importance for the measurement of the production cross sections of XYZ particles as well as those of conventional charmonium states in this energy range, which will enable a more precise comparison with the predictions of the quark model and an improved understanding of QCD. The results presented in this paper have been used in several recent analyses of the BESIII Collaboration (for example, see Refs. [16–18]) and will be used by many other analyses in the future.
Figure 4 shows that the impact of EMC readout errors may increase exponentially to above 10% as the CM energy increases to approximately 5.0 GeV. This means that the dangerous effect warrants further inspection if BESIII is to operate in higher energy zones with the BEPCII update project in the future.
-
The BESIII Collaboration thanks the staff of BEPCII and the IHEP computing center for their strong support.
Measurement of integrated luminosities at BESIII for data samples at center-of-mass energies between 4.0 and 4.6 GeV
- Received Date: 2022-03-04
- Available Online: 2022-11-15
Abstract: The integrated luminosities of data samples collected in the BESIII experiment in 2016–2017 at center-of-mass energies between 4.19 and 4.28 GeV are measured with a precision better than 1% by analyzing large-angle Bhabha scattering events. The integrated luminosities of old datasets collected in 2010–2014 are updated by considering corrections related to detector performance, offsetting the effect of newly discovered readout errors in the electromagnetic calorimeter, which can haphazardly occur.


 Abstract
 HTML
HTML Reference
 Related
 PDF
PDF



 DownLoad: