


 Abstract
 HTML
HTML Reference
 Related
 PDF
PDF


-
In 2020, BEPCII implemented an energy upgrade project and increased the maximum center-of-mass energy from 4.61 to 4.95 GeV. During the data-taking years of 2020 and 2021, the BESIII experiment collected
$ e^+e^{-} $ annihilation data at 12 center-of-mass energy ($ E_{\rm{cms}} $ ) points between 4.61 and 4.95 GeV. In this energy region, a few charmonium(-like) states can be produced, such as Y(4630) and Y(4660) [1–5], which are potential candidates for multi-quark states other than charmonium states [6]. More strikingly, at 4.68 GeV, the BESIII experiment observed the first candidate for a charged hidden-charm tetraquark with strangeness,$ Z_{cs}(3985)^{+} $ [7]. Note that charge conjugation is always implied. In addition,$ \Lambda_{c}^{+}\bar{\Lambda}_{c}^{-} $ pair-production is open in this energy region. This provides many opportunities for precise measurements of the properties of the lightest charmed baryon$ \Lambda_{c}^{+} $ , with threshold production and quantum coherence of the accumulated$ \Lambda_{c}^{+}\bar{\Lambda}_{c}^{-} $ pairs. In 2014, the BESIII experiment collected 567$ \mathrm{pb}^{-1} $ of$ e^+e^{-} $ annihilation data at 4.599 GeV, which led to many pioneering measurements [8–14]. Approximately ten times more$ \Lambda_{c}^{+}\bar{\Lambda}_{c}^{-} $ pair events are expected to be contained in all data taken above 4.6 GeV, which provides great potential to improve our knowledge of the strong and weak interactions in the charm sector [15]. The$ E_{\rm{cms}} $ and integrated luminosities of these data samples are important inputs for analyses using these data samples.In this paper, we present measurements of
$ E_{\rm{cms}} $ and integrated luminosity for data samples at various energy points, as listed in Table 1. The Beam Energy Measurement System (BEMS) [16], which was installed in 2008, is designed to precisely measure the beam energy based on the energies of Compton back-scattered photons. However, the working range of BEMS is below 4 GeV, which implies that the measurement of$ E_{\rm{cms}} $ for data samples involved in this paper must be performed offline. A novel method of using$ e^+e^{-} \rightarrow\Lambda_{c}^{+}\bar{\Lambda}_{c}^{-} $ events is adopted, which was discussed in the energy measurement for ψ(3770) data at BESIII [17]. In the luminosity measurement, the Bhabha scattering process$ e^+e^{-} \rightarrow (\gamma)\; e^+e^- $ is used, benefiting from its clear signature and large production cross section, which allow for a negligible statistical uncertainty and relatively small systematic uncertainty. A cross check of the luminosity results is performed by analyzing the di-photon process$ e^+e^- \rightarrow (\gamma)\; \gamma\gamma $ .Sample $ E_{\rm{cms}} $ /MeV

$ \mathscr{L}_{\rm{Bhabha}} $ /pb−1

$ \mathscr{L}_{\rm{di-photon}} $ /pb−1

Ratio (%) 4610 4611.86±0.12±0.30 103.65±0.05±0.55 103.37±0.13 99.73±0.59 4620 4628.00±0.06±0.32 521.53±0.11±2.76 520.17±0.28 99.74±0.55 4640 4640.91±0.06±0.38 551.65±0.12±2.92 550.67±0.29 99.82±0.55 4660 4661.24±0.06±0.29 529.43±0.12±2.81 527.53±0.29 99.64±0.55 4680 4681.92±0.08±0.29 1667.39±0.21±8.84 1665.88±0.51 99.91±0.54 4700 4698.82±0.10±0.36 535.54±0.12±2.84 533.66±0.29 99.64±0.55 4740 4739.70±0.20±0.30 163.87±0.07±0.87 165.08±0.16 100.74±0.58 4750 4750.05±0.12±0.29 366.55±0.10±1.94 367.57±0.24 100.28±0.56 4780 4780.54±0.12±0.30 511.47±0.12±2.71 512.03±0.29 100.11±0.55 4840 4843.07±0.20±0.31 525.16±0.12±2.78 526.01±0.30 100.16±0.55 4920 4918.02±0.34±0.34 207.82±0.08±1.10 208.09±0.19 100.13±0.57 4950 4950.93±0.36±0.38 159.28±0.07±0.84 159.85±0.17 100.36±0.58 Table 1. Numerical results for the center-of-mass energy
$ E_{\rm{cms}} $ , the integrated luminosity measured with the Bhabha process$ \mathscr{L}_{\rm{Bhabha}} $ , the integrated luminosity measured with the di-photon process$ \mathscr{L}_{\rm{di-photon} }$ , and their ratio for all data samples. For the$ E_{\rm{cms}} $ and$ \mathscr{L}_{\rm{Bhabha}} $ measurements, the first uncertainty is statistical and the second is systematic. For the$ \mathscr{L}_{\rm{di-photon}} $ measurement, only statistical uncertainties are presented. For the ratio of$ \mathscr{L}_{\rm{di-photon} }$ to$ \mathscr{L}_{\rm{Bhabha}} $ , all presented uncertainties are considered. -
The BESIII detector [18] records symmetric
$ e^+e^- $ collisions provided by the BEPCII storage ring [19], which operates at center-of-mass energies ranging from 2.0 to 4.95 GeV. BESIII has collected large data samples in this energy region [20]. The cylindrical core of the BESIII detector covers 93% of the full solid angle and consists of a helium-based multilayer drift chamber (MDC), plastic scintillator time-of-flight system (TOF), and CsI(Tl) electromagnetic calorimeter (EMC), which are all enclosed in a superconducting solenoidal magnet providing a 1.0 T magnetic field. The solenoid is supported by an octagonal flux-return yoke with resistive plate counter muon identification modules interleaved with steel. The charged-particle momentum resolution at$ 1\; \,\mathrm{GeV}/c $ is 0.5%, and the$ {\rm d}E/{\rm d}x $ resolution is 6% for electrons from Bhabha scattering. The EMC measures photon energies with a resolution of 2.5% (5%) at$ 1\; \,\mathrm{GeV} $ in the barrel (end cap) region. The time resolution in the TOF barrel region is 68 ps, whereas that in the end cap region is 60 ps [21–23].Simulated samples produced with a Geant4-based [24] Monte Carlo (MC) package, which includes a geometric description of the BESIII detector and detector response, are used to determine detection efficiencies and estimate backgrounds. The simulation models the beam energy spread and initial state radiation (ISR) in the
$ e^+e^- $ annihilations with the generator KKMC [25, 26]. The inclusive MC sample includes the production of the process$ \Lambda_{c}^{+}\bar{\Lambda}_{c}^{-} $ using the Born cross section line shape measured by BESIII, open charm processes, the ISR production of vector charmonium(-like) states, and the continuum processes incorporated in KKMC [25, 26]. The known decay modes are modeled with EVTGEN [27, 28] using branching fractions taken from the Particle Data Group (PDG) [29], and the remaining unknown charmonium decays are modeled with LUNDCHARM [30, 31]. Final state radiation (FSR) from charged final state particles is incorporated using PHOTOS [32]. -
In the process
$ e^+e^-\rightarrow \Lambda_c^{+}\bar{\Lambda}_c^{-} $ , each$ \Lambda_c^{+} $ ($ \bar{\Lambda}_c^{-} $ ) baryon carries half the energy of$ E_{\rm{cms}} $ . Hence,$ E_{\rm{cms}} $ is obtained from the calibrated beam energy$ E_{\Lambda_{\rm{c}}} $ using the reconstructed mass of one$ \Lambda_c $ with the following equations:$ \begin{aligned}[b]E_{\rm{cms}} =& 2E_{\Lambda_{\rm{c}}}, \\ E_{\Lambda_{\rm{c}}}^{2} = &E_{\rm{0}}^{2} + m_{\Lambda_c}^{2}c^4 - M_{\rm{BC}}^{2}c^4. \end{aligned} $

(1) Here,
$ E_{\rm{0}} $ is the uncalibrated beam energy, with input values of 2306, 2313, 2320, 2330, 2340, 2350, 2370, 2375, 2390, 2420, 2457, and 2473 MeV for the beam energies of 12 different energy points, and$ m_{\Lambda_c} $ is the known$ \Lambda_{c} $ mass of$ 2286.46\pm0.14 $ $ \,\mathrm{MeV}/c^2 $ [29, 33].$ M_{\rm{BC}} $ is the fitted peak position of the beam-constrained mass of the$ \Lambda_c $ baryon calculated using$ M_{\rm{BC}}c^2 = \sqrt{E_{\rm{0}}^{2}-{p}^{2}_{\Lambda_c}{c^2}} $ , where$ {p}_{\Lambda_c} $ is the momentum of the$ \Lambda_c $ measured in the center-of-mass system of the$ e^+e^- $ collision. Essentially, Eq. (1) is equivalent to$ E_{\Lambda_{\rm{c}}}^{2} = p_{\Lambda_c}^{2}c^2 + m_{\Lambda_c}^{2}c^4 $ . The distributions of$ M_{\rm{BC}} $ , instead of$ p_{\Lambda_c} $ , are fitted because$ M_{\rm{BC}} $ has better resolution and its fit quality is more easily controlled. According to the above analysis, we expect the calibrated beam energy$ E_{\Lambda_{\rm{c}}} $ to be stable when different$ E_{\rm{0}} $ are used, which is well verified by both real data and MC simulations.To perform this measurement, we use the partial reconstruction method, and only one
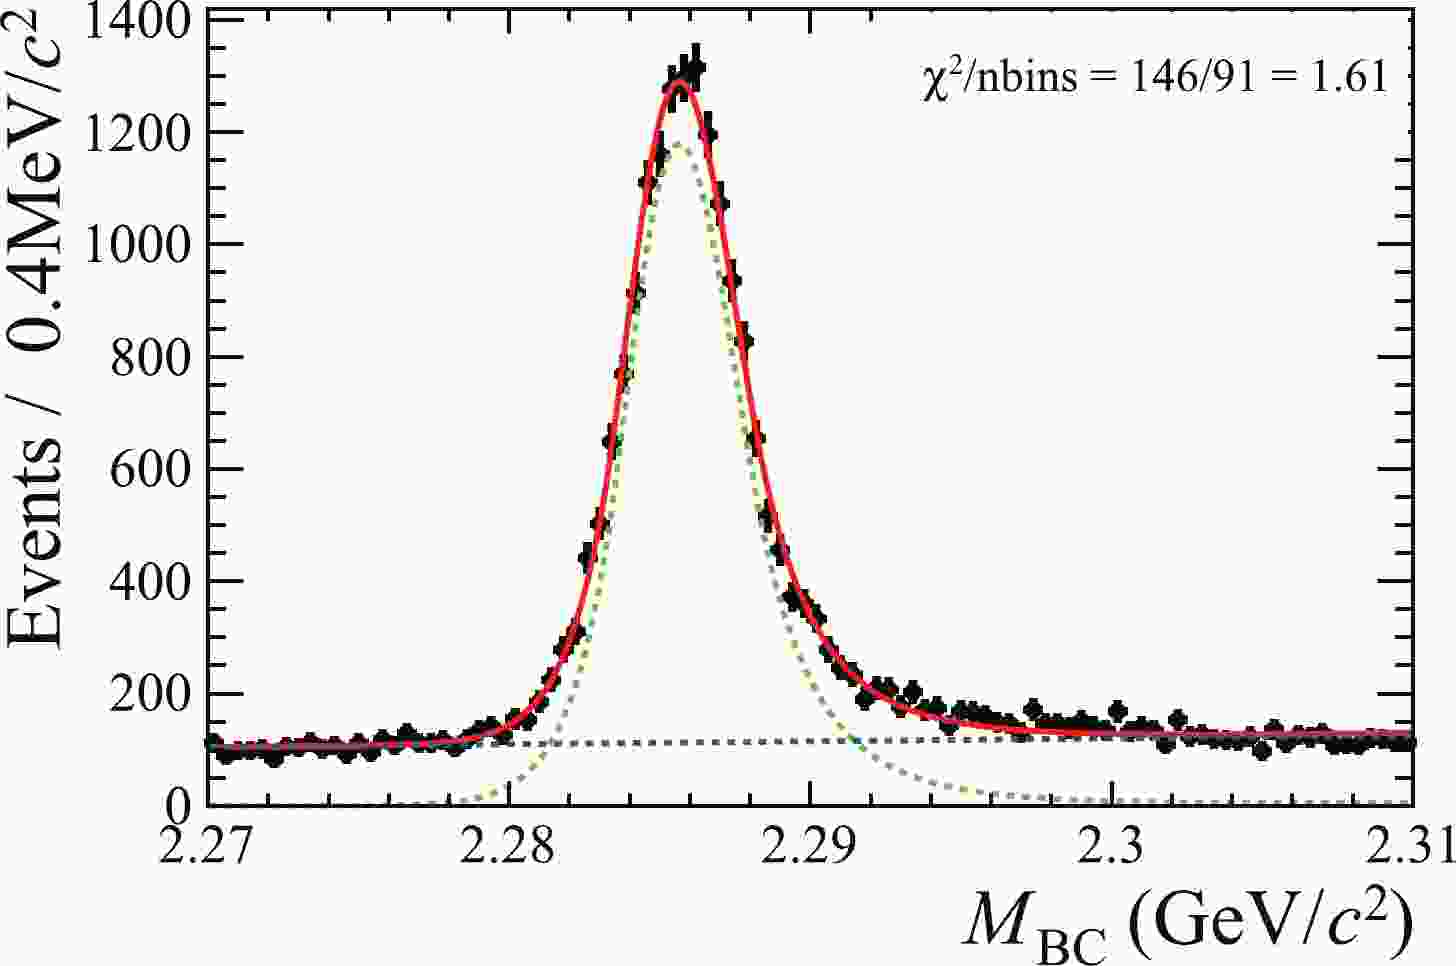
$ \Lambda_c^{+} $ is reconstructed for which the$ \Lambda_{c}^{+}\rightarrow p K^{-} \pi^+ $ channel is used because of its relatively large decay rate and low background contamination. Each charged track must satisfy the following criteria: The distance of the closest approach of every charged track to the$ e^+e^- $ interaction point (IP) must be within 10 cm along the beam direction and within 1 cm on the plane perpendicular to the beam direction. The polar angle θ between the direction of a charged track and that of the positron beam must satisfy$ | \cos\theta|<0.93 $ for an effective measurement in the active volume of the MDC. The$ {\rm d}E/{\rm d}x $ information recorded by the MDC and time-of-flight information measured by the TOF are combined to calculate particle identification (PID) probabilities for various particle hypotheses. Tracks are identified as protons if their PID probabilities ($ {\cal{P}} $ ) satisfy$ {\cal{P}}(p)> {\cal{P}}(K) $ and$ {\cal{P}}(p)>{\cal{P}}(\pi) $ , whereas charged kaons and pions are identified using$ {\cal{P}}(K)>{\cal{P}}(\pi) $ and$ {\cal{P}}(\pi)>{\cal{P}}(K) $ , respectively. All$ p K^{-} \pi^+ $ combinations in one event are kept for further study. In the fit to the$ M_{\rm{BC}} $ distributions, the signals are described by the Bukin function [34], and the backgrounds are described by a linear function. The fit result of the 4680 MeV data sample is shown in Fig. 1.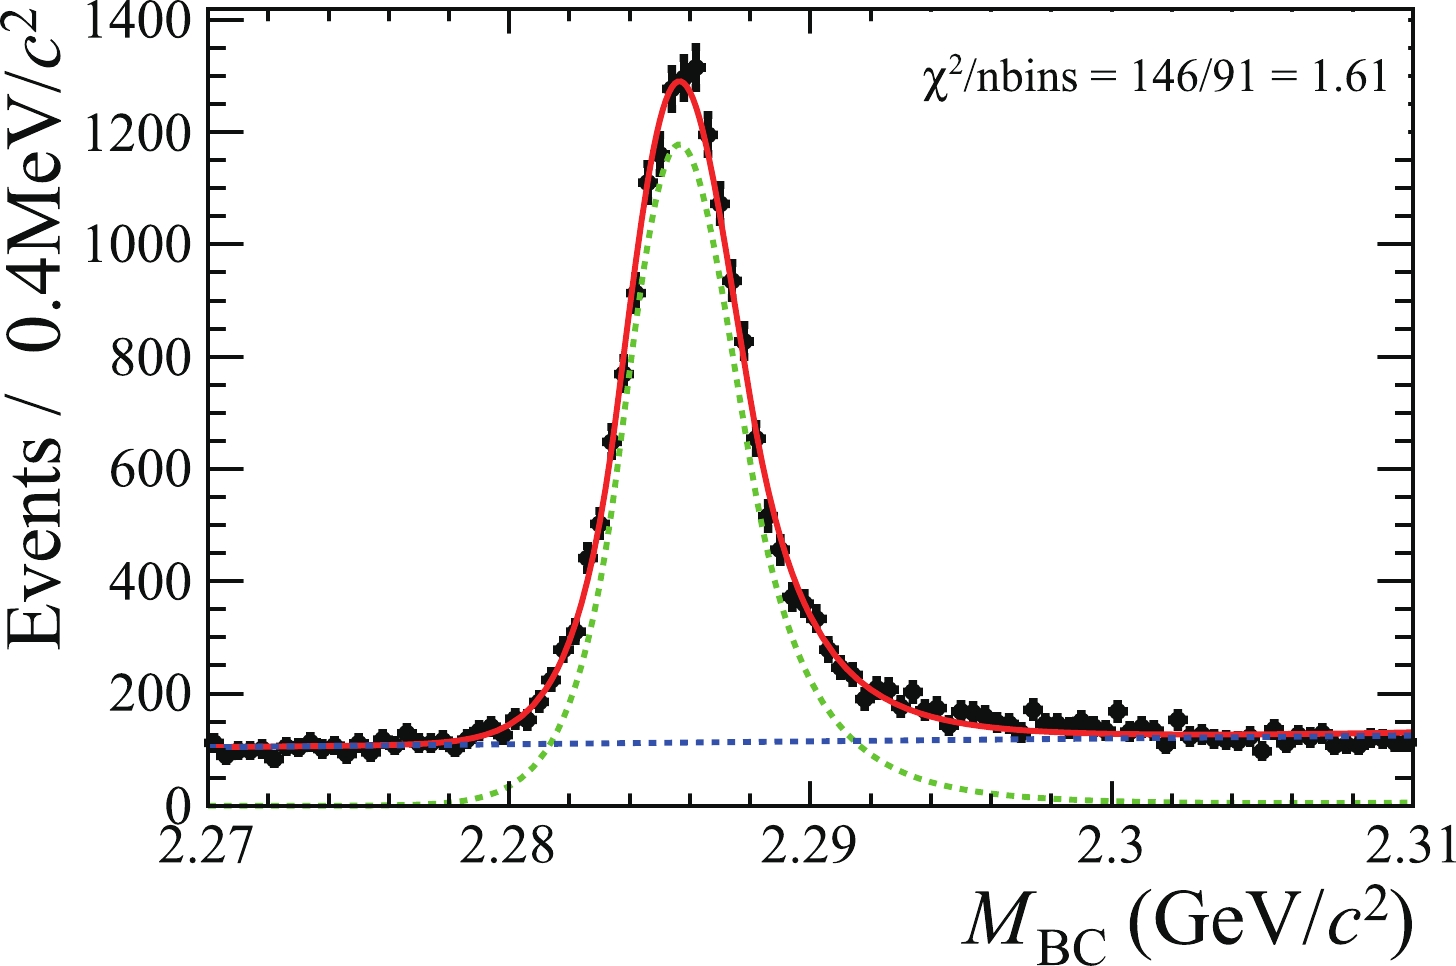
Figure 1. (color online) Fit to the
$M_{\rm{BC}}$ distribution for$\Lambda_{c}^{+}\rightarrow p K^{-} \pi^+$ candidates from the 4680 MeV data sample. The dotted green line is the fitted signal, and the dotted blue line is the fitted background. The black dots with error bars are data, and the red line is the sum of fit functions.To validate the analysis method, an input and output (I/O) check based on the inclusive MC simulation is performed. Systematic shifts (0.09 ~ 0.25 MeV) are noticed between the measured beam energies and the true simulated input values, mainly due to the ISR effect. The shifts at different energy points are considered as individual correction factors. The final values of the determined
$ E_{\rm{cms}} $ are listed in Table 1.The systematic uncertainty on the
$ E_{\rm{cms}} $ measurement originates mainly from the uncertainty on the$ \Lambda_{c} $ mass quoted from the PDG, which is 0.28 MeV (twice the uncertainty on the$ \Lambda_{c} $ PDG mass). Other small uncertainties are due to the$ M_{\rm{BC}} $ fit range and ISR correction. For the fit range, we vary the fit boundary and repeat the$ M_{\rm{BC}} $ fit. The maximum relative changes of$ E_{\rm{cms}} $ are taken as systematic uncertainties.For ISR correction, we consider the cross section line shape and the influence of the background. An alternative cross section line shape is first obtained by varying the measured Born cross section line shape of the
$ e^+e^- \to \Lambda_c^+\bar{\Lambda}_c^- $ process within uncertainties. The alternative and nominal line shape are used to generate signal MC samples of the process$ e^+e^- \to \Lambda_{c}^{+}\bar{\Lambda}_{c}^{-} $ , where one$ \Lambda_c $ decays to$ pK\pi $ , and the other$ \Lambda_c $ decays inclusively, and then the I/O procedure is repeated to obtain the ISR correction factors. The differences in the ISR correction factors are regarded as systematic uncertainties. To consider the potential effect of background simulation, the difference in ISR correction between the signal MC sample and the inclusive MC sample is regarded as a systematic uncertainty.For the signal and background shapes, the uncertainties are negligible based on MC simulation studies. A summary of systematic uncertainties is given in Table 2. For each energy point, the total systematic uncertainty is taken as the quadrature sum of each item.
Source Sample 4610 4620 4640 4660 4680 4700 4740 4750 4780 4840 4920 4950 PDG mass 0.28 0.28 0.28 0.28 0.28 0.28 0.28 0.28 0.28 0.28 0.28 0.28 Fit range 0.04 0.14 0.22 0.04 0.04 0.14 0.04 0.04 0.04 0.02 0.17 0.24 ISR correction 0.10 0.06 0.13 0.07 0.06 0.17 0.11 0.04 0.09 0.13 0.09 0.08 Total 0.30 0.32 0.38 0.29 0.29 0.36 0.30 0.29 0.30 0.31 0.34 0.38 Table 2. Systematic uncertainties on the
$ E_{\rm{cms}} $ measurement (in MeV). For each energy point, the total systematic uncertainty corresponds to the quadrature sum of each item.We validate the energy measurements to the 12 data samples using the
$ e^+e^- \rightarrow D^+D^{*-} $ process, where$ D^+ $ is reconstructed via$ D^+ \rightarrow K^-\pi^+\pi^+ $ . The recoil mass of$ D^+ $ ,$ RM_{D^+} $ , is defined as$ \begin{eqnarray} RM_{D^+} = \sqrt{(E_{\rm{cms}}-E_{D^+})^2/c^4-(\overrightarrow{p}_{\rm{cms}}-\overrightarrow{p}_{D^+})^2/c^2}, \end{eqnarray} $

(2) where
$ E_{D^+} $ ($ \overrightarrow{p}_{D^+} $ ) is the energy (momentum) of the reconstructed$ D^+ $ . The total energy (momentum) of the initial$ e^+e^- $ system,$ E_{\rm{cms}} $ ($ \overrightarrow{p}_{\rm{cms}} $ ), is input according to our measurement. The peak values of the$ RM_{D^+} $ distributions correspond to the known mass of$ D^{*-} $ [29]. To improve the mass resolution [35], the variable$ RM_{D^+} + M_{D^+}-m_{D^+} $ is adopted to represent the$ D^+ $ recoil mass spectrum, where$ M_{D^+} $ is the$ D^+ $ invariant mass, and$ m_{D^+} $ is the known$ D^+ $ mass [29]. The Bukin function is used to fit the$ RM_{D^+} + M_{D^+}-m_{D^+} $ distribution to obtain the peak mass position, in which the tail shapes in the signal function are fixed according to the MC simulation of the process$ e^+e^- \rightarrow D^+D^{*-} $ . Following the same procedure used for ISR correction in the nominal analysis, the measured mass of$ D^{*-} $ in the validation sample is consistent with the known$ D^{*-} $ mass [29]. Figure 2 shows the mass difference at each energy point, which is consistent with zero and hence validates the measured center-of-mass energies.
Figure 2. (color online) Difference between the measured
$D^{*-}$ mass, using the validation sample of$e^+e^- \rightarrow D^+D^{*-}$ , and the known$D^{*-}$ mass at each energy point [29]. The points with error bars are from data, and the green band is the uncertainty due to that of the$E_{\rm{cms}}$ value. -
The integrated luminosity of the data sample is determined using
$ \begin{eqnarray} \mathscr{L} = \frac{N^{\rm{obs}}_{e^+e^-\rightarrow X}} { \sigma^{\rm{obs}}_{e^+e^-\rightarrow X} \times \epsilon_{e^+e^-\rightarrow X}}, \end{eqnarray} $

(3) where X denotes any specific final state produced in
$ e^{+}e^{-} $ annihilations,$ N^{\rm{obs}}_{e^{+}e^{-}\rightarrow X} $ is the observed yield for the$ e^{+}e^{-}\rightarrow X $ process,$ \mathscr{L} $ is the integrated luminosity for data, and$ \sigma^{\rm{obs}}_{e^{+}e^{-}\rightarrow X} $ is the visible cross section. Here, the Bhabha process ($ e^{+}e^{-}\rightarrow (\gamma)e^{+}e^{-} $ ) is analyzed in the nominal method, and the di-photon$ e^+e^-\rightarrow (\gamma)\; \gamma\gamma $ process serves as a cross check channel. The observed cross sections for the two processes are provided by the BabaYaga@NLO generator [36] with 0.1% precision. The configuration parameters for the BabaYaga@NLO generator used in generating Bhabha events are listed in Table 3.Parameter Value $E_{\rm{cms}}$ 

Refer to Table 1 Beam energy spread 1.58 MeV MinThetaAngle 20° MaxThetaAngle 160° Maximum Acollinearity 180° NSearch 4000000 RunningAlpha 1 Number of photon −1 Table 3. Configuration of the BabaYaga@NLO generator used for simulating Bhabha events.
The criteria used to select Bhabha candidates include the following: We require only two oppositely charged tracks (nCharged) detected in the MDC that satisfy
$ | \cos\theta|< $ 0.8, and the distance requirement of the closest approach of each charged track to the IP is the same as described in Section III. Figure 3 shows the distributions of momentum, polar angle$ \cos\theta $ , and azimuthal angle ϕ for the electron and positron tracks measured in the MDC in the data and signal MC samples. Good consistency between data and MC simulation is shown. The momentum of each track must be larger than 2$ \,\mathrm{GeV}/c $ to reject backgrounds from hadronic processes. In addition, to suppress the backgrounds from di-photon process,$ |\Delta\phi^{\rm{EMC}}| $ must be in the range [5$ ^{\circ} $ , 40$ ^{\circ} $ ], where$ \Delta\phi^{\rm{EMC}} $ =$ |\phi^{\rm{EMC}}_1 - \phi^{\rm{EMC}}_2| - $ 180$ ^{\circ} $ , and$ \phi^{\rm{EMC}}_{1,2} $ are the azimuthal angles of the two clusters produced by the electron and positron in the EMC in the center-of-mass frame.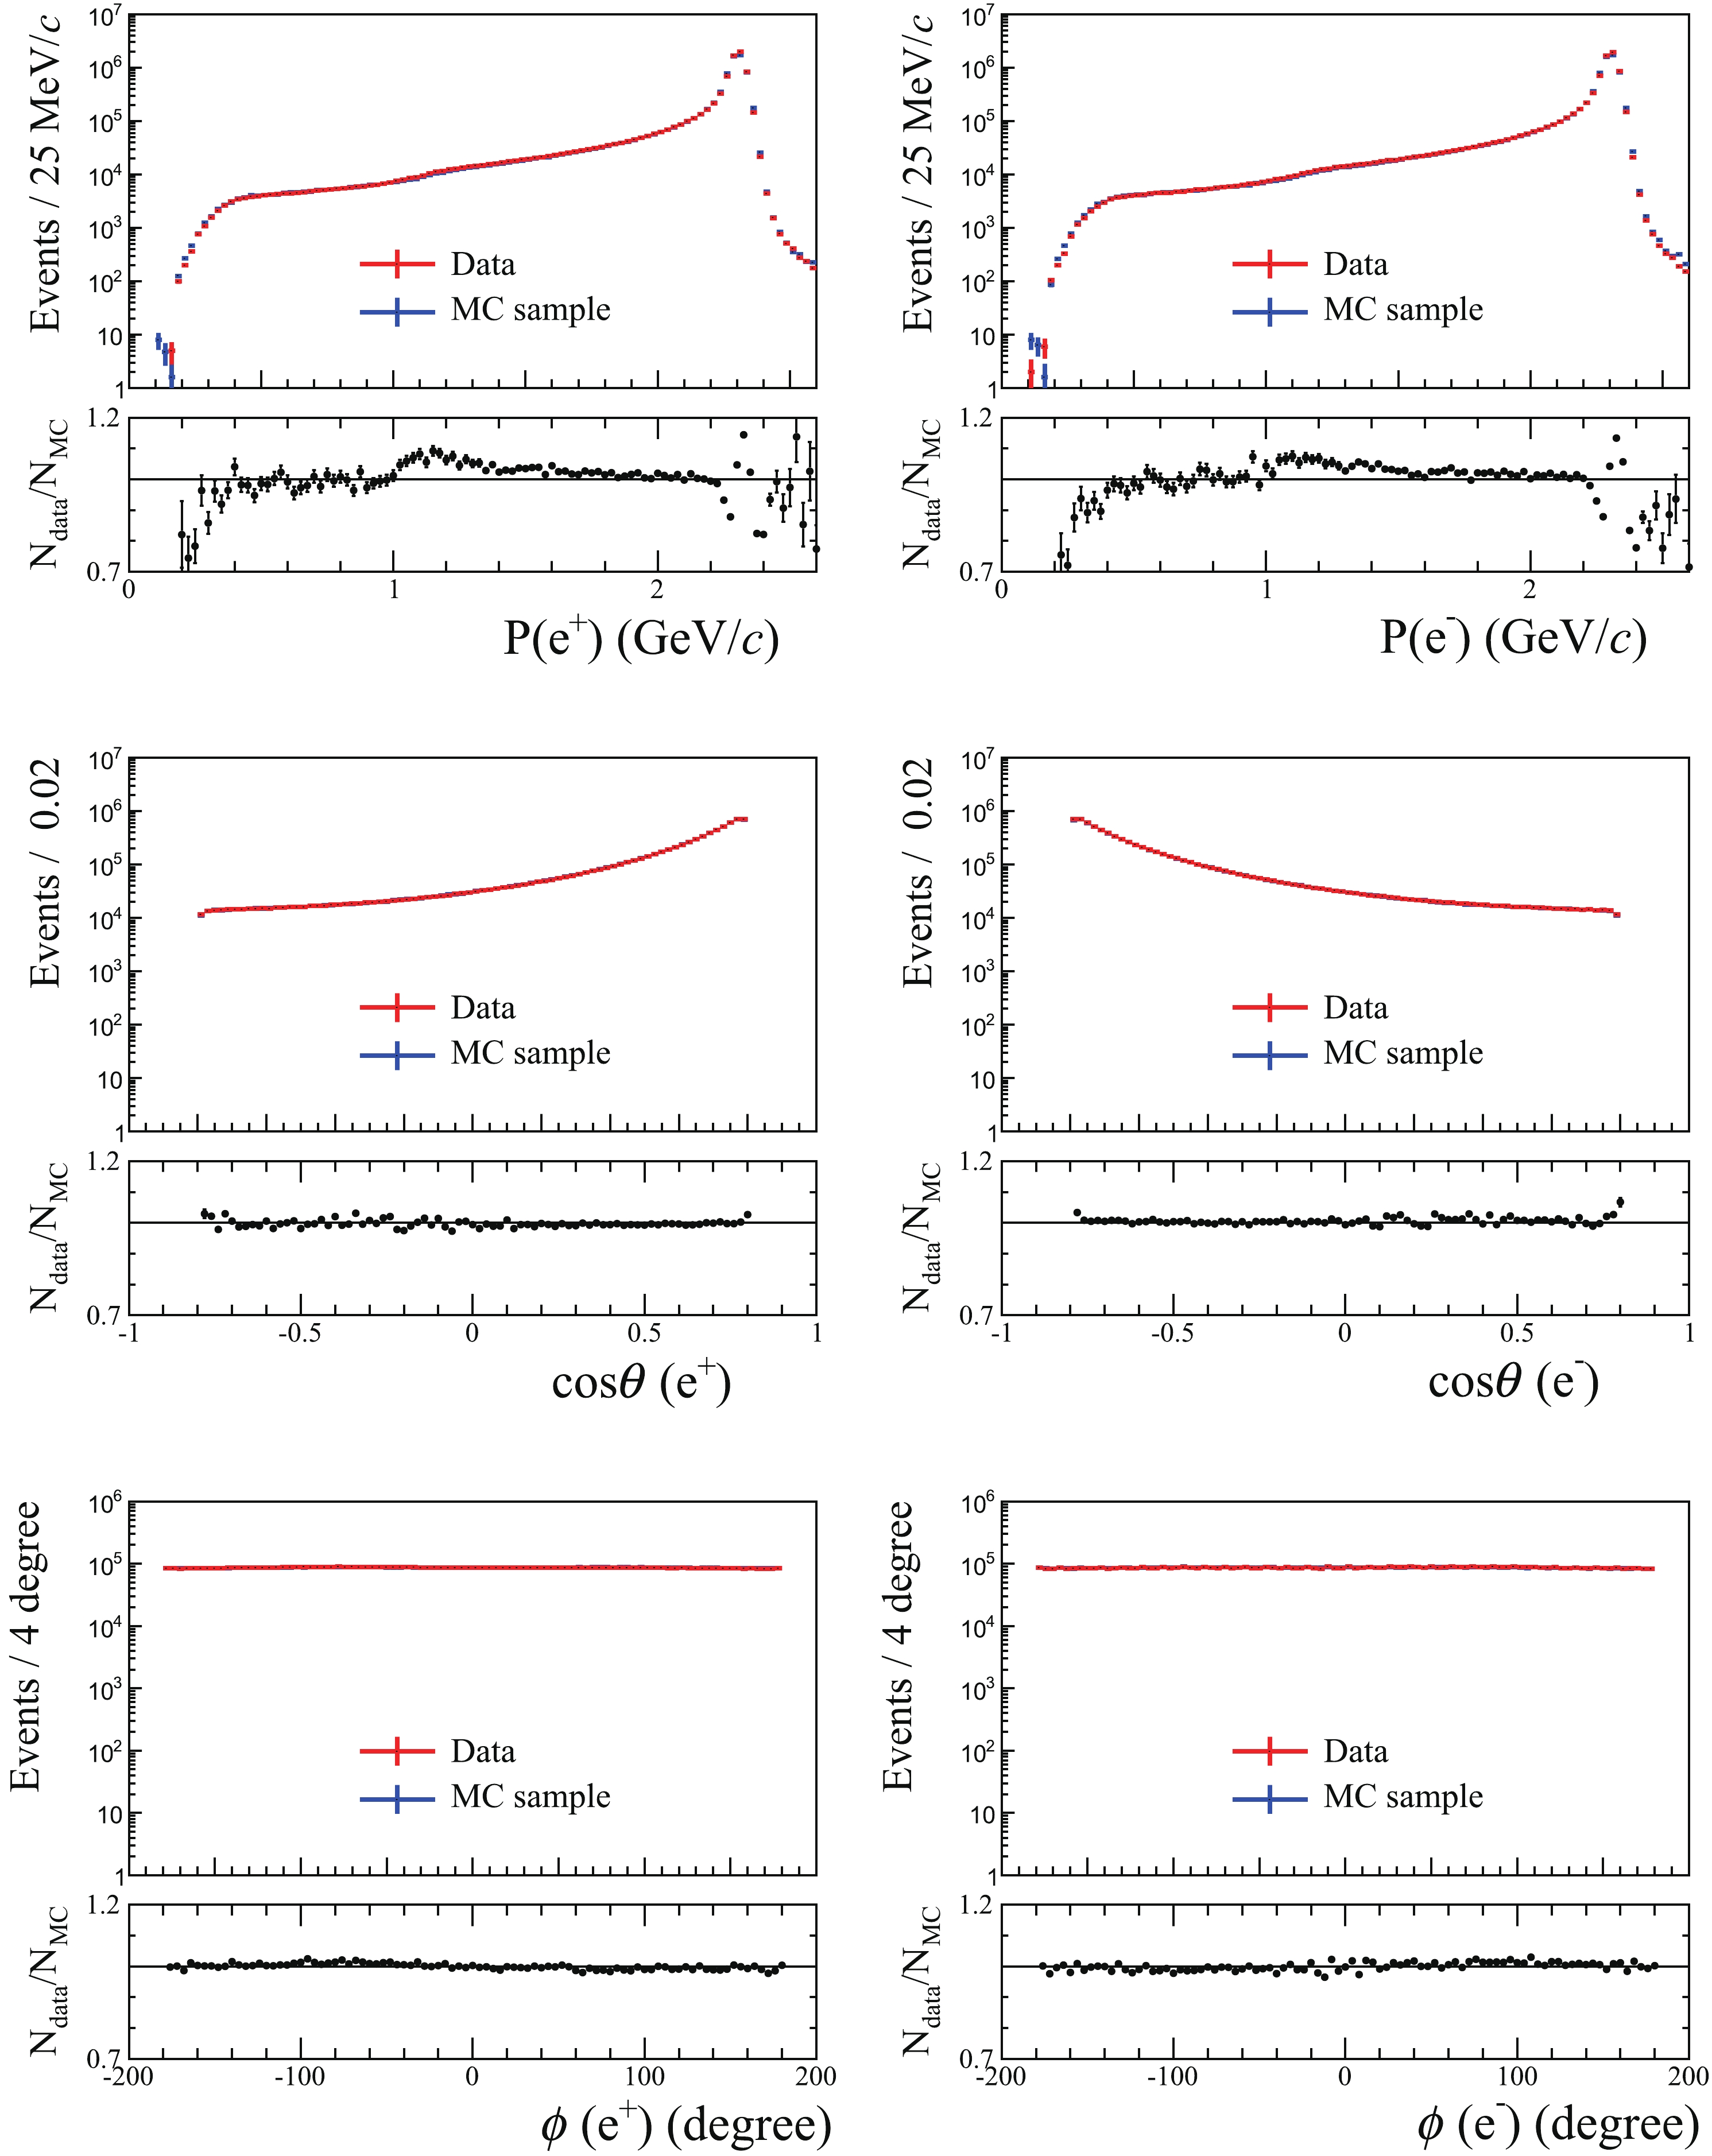
Figure 3. (color online) Comparisons between the data and MC samples at the 4620 MeV energy point for the momentum (top),
$\cos\theta$ (middle), and ϕ (bottom) distributions of$e^+$ (left) and$e^-$ (right) in Bhabha events.$N_{\rm data}/N_{\rm MC}$ is the ratio of the data and MC samples. The red points with error bars are data, and the blue points are MC samples. The sizes of the MC samples are normalized to those in data. Except for the variable to be shown, all other requirements used in event selection are applied. Although the comparison shows inconsistency in the high momentum region of the momentum spectrum, this would not have a significant effect on the final results.Figure 4 shows the two-dimensional
$ E^{\rm{EMC}} $ distributions of$ e^+ $ and$ e^- $ in Bhabha candidate events, where$ E^{\rm{EMC}} $ is the output of the deposited energies of clusters in the EMC. Owing to the unexpected saturation effect [37] from a small fraction of EMC electronic readouts,$ E^{\rm{EMC}} $ of the electron and positron becomes underestimated and distributes around 0.4 GeV, which is significantly less than the expected energies. As shown in Fig. 4(a), a fraction ($ 2%\sim9%$ ) of the electron or positron tracks, depending on the track momentum, is influenced by the EMC saturation effect. To evaluate the relative size of this effect, the sample is divided into two categories: NORMAL SAMPLE ($ E^{\rm{EMC}}(e^+)>1\; \,\mathrm{GeV} $ and$ E^{\rm{EMC}}(e^-)>1\; \,\mathrm{GeV} $ ) without saturated$ e^+e^- $ EMC clusters, and SATURATION SAMPLE ($ E^{\rm{EMC}}(e^+)<1\; \,\mathrm{GeV} $ or$ E^{\rm{EMC}}(e^-)< 1\; \,\mathrm{GeV} $ ) with at least one saturated$ e^+ $ or$ e^- $ EMC cluster. However, as shown in Fig. 4(b), MC simulations do not reflect the saturation effect. To obtain the total signal yields that correctly match the MC-determined efficiency, the signal yields in both the NORMAL SAMPLE and SATURATION SAMPLE are included.
Figure 4. (color online) Two-dimensional distributions of
$ E^{\rm{EMC}}(e^-) $ versus$ E^{\rm{EMC}}(e^+) $ in data (a), the Bhabha MC sample (b), and background MC samples (c) for the 4620 MeV energy point. Three kinematic regions are presented: the red square region [$ E^{\rm{EMC}}(e^+)>1\; \,\mathrm{GeV} $ and$ E^{\rm{EMC}}(e^-)>1\; \,\mathrm{GeV} $ ] for the NORMAL SAMPLE, and the remaining regions for the SATURATION SAMPLE. The dimuon backgrounds are concentrated in the blue square [$ E^{\rm{EMC}}(e^+)<1\; \,\mathrm{GeV} $ and$ E^{\rm{EMC}}(e^-)<1\; \,\mathrm{GeV} $ ], as shown in plot (c).For the NORMAL SAMPLE, backgrounds are negligible compared to the statistics of the signal yields. This is validated using the background MC sample, which contains the inclusive MC sample and all QED events except the Bhabha signal, as shown in Fig. 4(c). Hence, the survived NORMAL SAMPLE is taken as the signal. For the SATURATION SAMPLE, a portion of the background originates from the dimuon process
$ e^+e^-\to\mu^+\mu^- $ , as indicated in Fig. 4(c). To extract the signal yields, the normalized pulse height,$ PH_{\rm{norm}} $ , from the specific ionization energy lost by the charged track in the MDC is adopted to distinguish Bhabha events from the dimuon backgrounds. Figure 5 shows the fit to the$ PH_{\rm{norm}} $ distribution, where the signals peak at approximately 1.0 for the electron, and the dimuon backgrounds peak at approximately 0.86. In the fit, the shape of the electron signals is modeled using the electron sample in the NORMAL SAMPLE, and the muon shape is taken from the control sample of the dimuon process, where the penetration depth of the dimuon tracks in the muon counter must be larger than 10 cm and is implemented for data in the background region ($ E^{\rm{EMC}}(e^+)<1\; \,\mathrm{GeV} $ and$ E^{\rm{EMC}}(e^-)< 1\; \,\mathrm{GeV} $ ) in Fig. 4(a). The fitted yields of the Bhabha process are taken as signals in the SATURATION SAMPLE.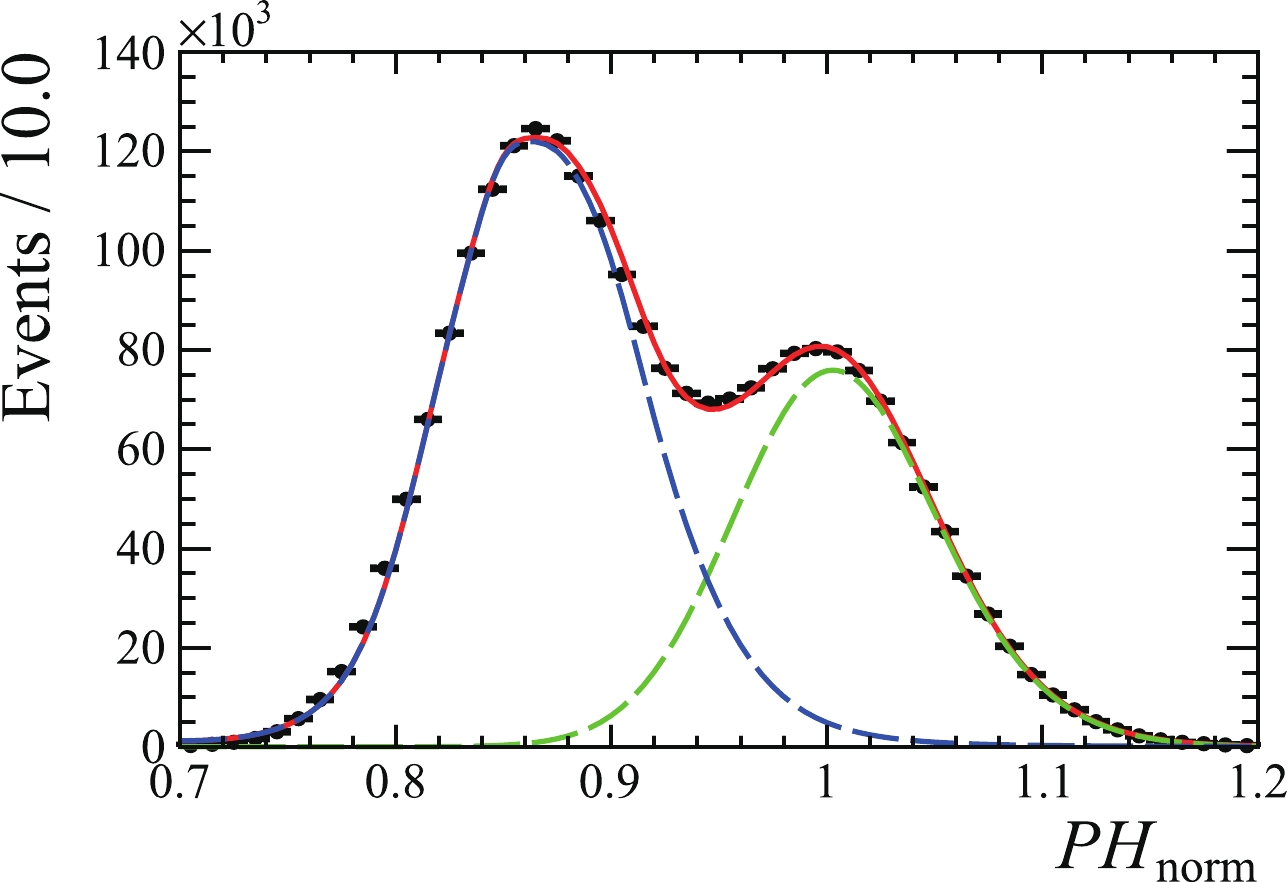
Figure 5. (color online) Fit to the
$ PH_{\rm{norm}}$ distribution in the SATURATION SAMPLE from the 4620 MeV data sample. The black dots with error bars are data, the red line is the total fit, the long dashed blue line is background dominated by the dimuon process, and the dashed green line represents saturation events.The sum of the signal yields in the NORMAL SAMPLE and SATURATION SAMPLE is taken as the total yield of the Bhabha events. The detection efficiency is estimated using the Bhabha MC samples, and the observed Bhabha cross section is calculated with the BabaYaga@NLO generator. Therefore, the integrated luminosity of the data sample is calculated using Eq. (3), and the corresponding results for the 12 energy points are given in Table 1. The statistical precision of the measured luminosity is better than 0.05% at each energy point.
Sources of systematic uncertainties in the luminosity measurement are summarized in Table 4. For the 12 energy points, common systematic uncertainties are assigned. Details are discussed below.
Source Uncertainty (%) Tracking efficiency 0.30 nCharged requirement 0.10 Momentum requirement 0.18 $\cos\theta$ requirement

0.30 Saturation events 0.20 BabaYaga@NLO generator 0.10 MC statistics 0.05 Cross section 0.09 Total 0.53 Table 4. Systematic uncertainties on the luminosity measurement. The total systematic uncertainty corresponds to the quadrature sum of each item.
High momentum electron samples are selected to study the systematic uncertainties due to tracking, the nCharged requirement, the momentum requirement, and the
$ \cos\theta $ requirement. We select one$ e^{+} $ with a momentum larger than 2$ \,\mathrm{GeV}/c $ and$ E^{\rm{EMC}}(e^+) $ greater than 1 GeV as the positron candidate from the Bhabha process and take the recoil$ e^{-} $ as the control sample to study the efficiency of the selection criteria. The relative efficiency difference between the control sample and Bhabha MC sample is regarded as the systematic uncertainty.For estimation of the signal yields, the main systematic issue is in the extraction of the signal yields in the SATURATION SAMPLE. As a check, a different method of counting the number of survived events is adopted after removing the dimuon backgrounds by discarding events in the regions
$ E^{\rm{EMC}}(e^+)<1\; \,\mathrm{GeV} $ and$ E^{\rm{EMC}}(e^-)< 1\; \,\mathrm{GeV} $ . In the remaining events of the SATURATION SAMPLE, there is a small fraction of backgrounds (approximately 0.50%), which is neglected. The resultant luminosity differs from the nominal result by 0.20%, which is taken as the systematic uncertainty.For the BabaYaga@NLO generator, the theoretical uncertainty on the cross section calculation is assigned to be 0.10% [36]. The systematic uncertainty caused by MC statistics is estimated to be 0.05% according to the generated 5 million Bhabha MC events for each energy point.
To study the effect of
$ E_{\rm{cms}} $ uncertainty on the cross section calculation in the BabaYaga@NLO generator, the input values of$ E_{\rm{cms}} $ are varied within 2 MeV, and the corresponding maximum change in the obtained cross section is taken as the systematic uncertainty.As a cross check, the di-photon process is used to obtain the luminosity. To select the signal candidates, we require that there be at least two shower clusters in the EMC and no charged tracks detected in the MDC. The clusters must satisfy
$ | \cos\theta^{\rm{EMC}}|<0.8 $ . To select back-to-back photon showers and reduce the backgrounds of Bhabha events, their angles with respect to the IP must be larger than 178$ ^{\circ} $ , and$ \Delta\phi^{\rm{EMC}} $ of the two showers must be within [$ -3^{\circ} $ ,$ 3^{\circ} $ ]. To account for the EMC saturation effect and reduce the dimuon backgrounds, the hit number of one EMC shower must be larger than 20. These requirements are optimized based on the inclusive MC sample. The cross section and detection efficiency are determined by the BabaYaga@ NLO generator. Using Eq. (3), the resultant luminosity results at different energy points and the ratios between the measured luminosities based on the Bhabha and di-photon processes are consistent with unity, as shown in Table 1. -
The center-of-mass energies and integrated luminosities of
$ e^+e^- $ annihilation data between 4.61 and 4.95 GeV collected from 2020 to 2021 by the BESIII detector at the BEPCII collider are measured with high precision. By adopting a novel method for analyzing$ \Lambda_{c}^{+}\bar{\Lambda}_{c}^{-} $ pair-production in electron-position annihilations, the center-of-mass energies are measured with a precision of ~0.6 MeV, which is dominated by the precision of the known$ \Lambda_c $ mass. The integrated luminosities of the collected data samples are measured with a precision better than 1% by analyzing large-angle Bhabha scattering events after considering the EMC saturation effect. These results offer fundamental inputs for physics analyses based on these data samples. -
The BESIII Collaboration thanks the staff of BEPCII and the IHEP computing center for their strong support.
Luminosities and energies of e+e− collision data taken between ${\sqrt{\boldsymbol s}}$ =4.61 GeV and 4.95 GeV at BESIII
- Received Date: 2022-05-11
- Available Online: 2022-11-15
Abstract: From December 2019 to June 2021, the BESIII experiment collected approximately 5.85 fb−1 of data at center-of-mass energies between 4.61 and 4.95 GeV. This is the highest collision energy BEPCII has reached to date. The accumulated


 DownLoad: