


 Abstract
 HTML
HTML Reference
 Related
 PDF
PDF


-
The 238U neutron capture cross-section is of primary significance for the performance and reliable operation of diverse reactor systems. At present, the primary worldwide commercial nuclear power reactor categories consist of light water reactors (PWRs and BWRs) and heavy water reactors (HWRs), which are fueled by low-enriched uranium (about 3% 235U) and natural uranium (99.28% 238U), respectively, similarly
for certain Generation IV nuclear reactors [1] and accelerator-driven subcritical systems (ADSs) [2]. The capturing of neutrons by the substantial amount of 238U in the fuels will have a certain impact on the secure performance of these reactors. Moreover, fast breeder reactors (FBRs) are based on the 238U-239Pu fuel cycle, in which the fertile isotope 238U is used as the breeder material to regenerate the fissile nuclide 239Pu. The radionuclide 239Pu is produced by the 238U (n, γ) reaction and two consecutive beta decays of 239U [3, 4]. The yield of 239Pu relies on the 238U (n, γ)239U reaction cross-section, resulting in the requirement to determine the precise reaction cross-sectional values of 238U (n, γ)239U to anticipate the dynamical behaviors of complicated arrangements and security [4, 5]. Meanwhile, the value of the conversion ratio, the ratio of the amount of nuclear fuel produced by the fast reactor operation to the consumption, depends on the 238U neutron capture cross-section. It can reach the necessary value to realize the self-sustainment of nuclear fuel in FBRs. Consequently, the reaction cross-section of 238U (n, γ)239U is an incredibly valuable nuclear physics parameter for the implementation of a system on the basis of the 238U-239Pu fuel cycle and is intimately involved in fuel multiplication. Physical-based measurements for the 238U (n, γ)239U reaction cross-sections in the incident neutron energy region of 0.025–20 MeV [4–25] have been sufficiently well documented by several investigators. The majority of these experimental values are centralized in the region of the neutron energy provided by the reactors, electrostatic accelerators, and high-voltage multipliers. Nevertheless, the cross-section measurements were performed at only eight energy points within the 3.0–7.0 MeV [4, 6, 7, 18] energy region, and the measurement values are still relatively inaccurate and vary widely for the same energy point. Moreover, it is apparent that there are substantial variations among the evaluation databases for this energy region with three distinct tendencies; in particular, the ENDF/B-VIII.0 [26] and CENDL-3.2 [27] databases reach a maximum difference of 81.2% at a neutron energy of 7 MeV. The experimental values obtained by Panitkin et al. [24] are compatible with the evaluation database CENDL-3.2 but are superior to the ENDF/B-VIII.0 and ROSFOND-2010 [28] databases in the 3.0–7.0 MeV energy region. In contrast, the experimental measurements of Mulik et al. [4] at 5.9 ± 0.5 MeV neutron energy and the data of S.Mukherjee et al. [7] at 5.1 ± 0.2 MeV are in general accordance with the evaluation databases ENDF/B-VIII.0 and ROSFOND-2010, respectively, yet far inferior to the evaluation data of CENDL-3.2. As stated above, accurate measurements of the reaction cross-sectional values of 238U (n, γ)239U in the 3.0–7.0 MeV neutron energy region are critical for the assessment of cross-section data.
In this study, the reaction cross-sections of 238U (n, γ)239U have been experimentally measured at neutron energies of 6.117 ± 0.119 MeV, 4.626 ± 0.086 MeV, and 3.622 ± 0.348 MeV employing the off-line γ-ray spectroscopy method and the relative activation approach. Unavoidable experimental considerations such as neutron fluence fluctuations, the counting of geometric corrections when measuring γ-rays, the scattering effects of neutrons across the layers of cooled water and the tube wall material of the target head, self-absorption of γ-rays, and self-shielding of neutrons due to the sample thickness have been taken into account and revised in this experiment. In addition, the cross-sections of the 238U (n, γ)239U reaction were calculated theoretically with original parametric TALYS-1.9 [29]. Lastly, the experimental measurements presented in this paper are discussed by comparing them with the theoretical calculations, previous experimentally measured values, and the evaluation data available for ROSFOND-2010, CENDL-3.2, and ENDF/B-VIII.0.
-
The experiment was performed on a 3 MV tandem accelerator at the Sichuan University. The monoenergetic neutrons were derived from the D (d, n)3He reaction, whereby the D-beam stream generated by the 3 MV tandem accelerator was used to bombard the solid titanium deuteride (D-Ti) target. Mo was used as the substrate and was covered with a Ti film to adsorb D nuclei. The D-beam energies of this experiment were 1.5 MeV and 3 MeV, and the beam intensities were 13 μA and 22 μA, respectively. The neutron energy changes with the neutron emission angle. The distribution of the neutron energy with respect to the angle of the D-beams with energies of 1.5 MeV and 3 MeV incident on the D target is as shown in Fig. 1. The mass thickness of the D-Ti target was 2.01 mg/cm 2, and the D to Ti atomic adsorption ratio was 1.77. A circulating cooled water stream was utilized to neutralize the heat generated on the Mo substrate during the nuclear reaction to avoid localized overheating of the target.
Figure 1. (color online) Distribution of neutron energy according to angle.
-
In this experiment, U3O8 black powder with a purity of more than 99.9% was kept in an oven (temperature 60 °C) for 12 h to remove moisture. It was removed and then pressed into three disk-shaped samples with a diameter of 20 mm. The mass thicknesses of the samples were 0.9724 g/cm2, 0.9742 g/cm2, and 0.9855 g/cm2 (numbered as S1, S2, and S3, respectively). The U3O8 samples were sandwiched between two Au flakes and covered with a 0.3 mm thick Cd case outside. Au flakes with the same diameter as the samples and a thickness of approximately 0.1 mm were availed to identify the flux of the neutrons at the sample using the 197Au (n, γ)198Au reaction. The influence of slow thermal neutrons was eliminated by utilizing a Cd case with a large thermal neutron capture cross-section.
Neutron irradiation was initiated after sample preparation. The S1 sample was irradiated for 12 h with a D-beam energy of 3 MeV at an angle of 0° and a distance of 3.063 cm from the D-Ti target. The S2 and S3 samples were also irradiated for 12 h with a D-beam energy of 1.5 MeV at an angle of 0° and a distance of 4.814 cm and at an angle of 60° and a distance of 4.497 cm from the D-Ti target, respectively, and aligned with the center of the D-Ti target. The BF3 neutron counter meter was positioned parallel to the D-beam stream at 388 cm from the target head to supervise the stability of the neutron fluence throughout the hall in real time during the experiment. The experimental layout is illustrated in Fig. 2.
Figure 2. (color online) Diagram of the experimental layout for neutron irradiation with the D (d, n)3He reaction (plotted using arbitrary scale).
-
After the samples had been irradiated for 12 h and cooled for an adequate amount of time (2.7–43 h for Au flakes and 3.5–48 h for U3O8 samples), the characteristic γ-rays produced were measured with a single-ended coaxial low-background GEM30P4-76 HPGe detector with an energy resolution of 850 eV FWHM at 122 keV and 1.85 keV FWHM at 1.33 MeV [6, 30] as well as a 30% relative efficiency. The working high voltage was +2 kV, which was provided by ORTEC's 659 high-voltage power supply; the main amplifier 672 (pulse linear amplifier) had an adjustment multiple of 65 times and a time constant of 6 μs. Calibration of the detector efficiency used the standard source calibrating method, using the 152Eu and 137Cs standard sources with known activities to obtain the source peak detection efficiency. The distance transformation method was used to eliminate the cascade coincidence effect produced by the 152Eu multiple γ-ray source, so as to receive the efficiency fitting curve of the HPGe detector at a distance of 5 cm from the probe, thereby obtaining the full-energy peak detection efficiencies for the required characteristic γ-rays, as shown inFig. 3. A representative γ-ray spectrum for the irradiated U3O8 sample is presented in Fig. 4, in which the relevant γ-rays have already been labeled. For comparison, part of the gamma spectrum of the U3O8 sample without neutron irradiation is showed in Fig. 5.
Figure 3. (color online) Fitted curve of full-energy peak detection efficiency at 5 cm.
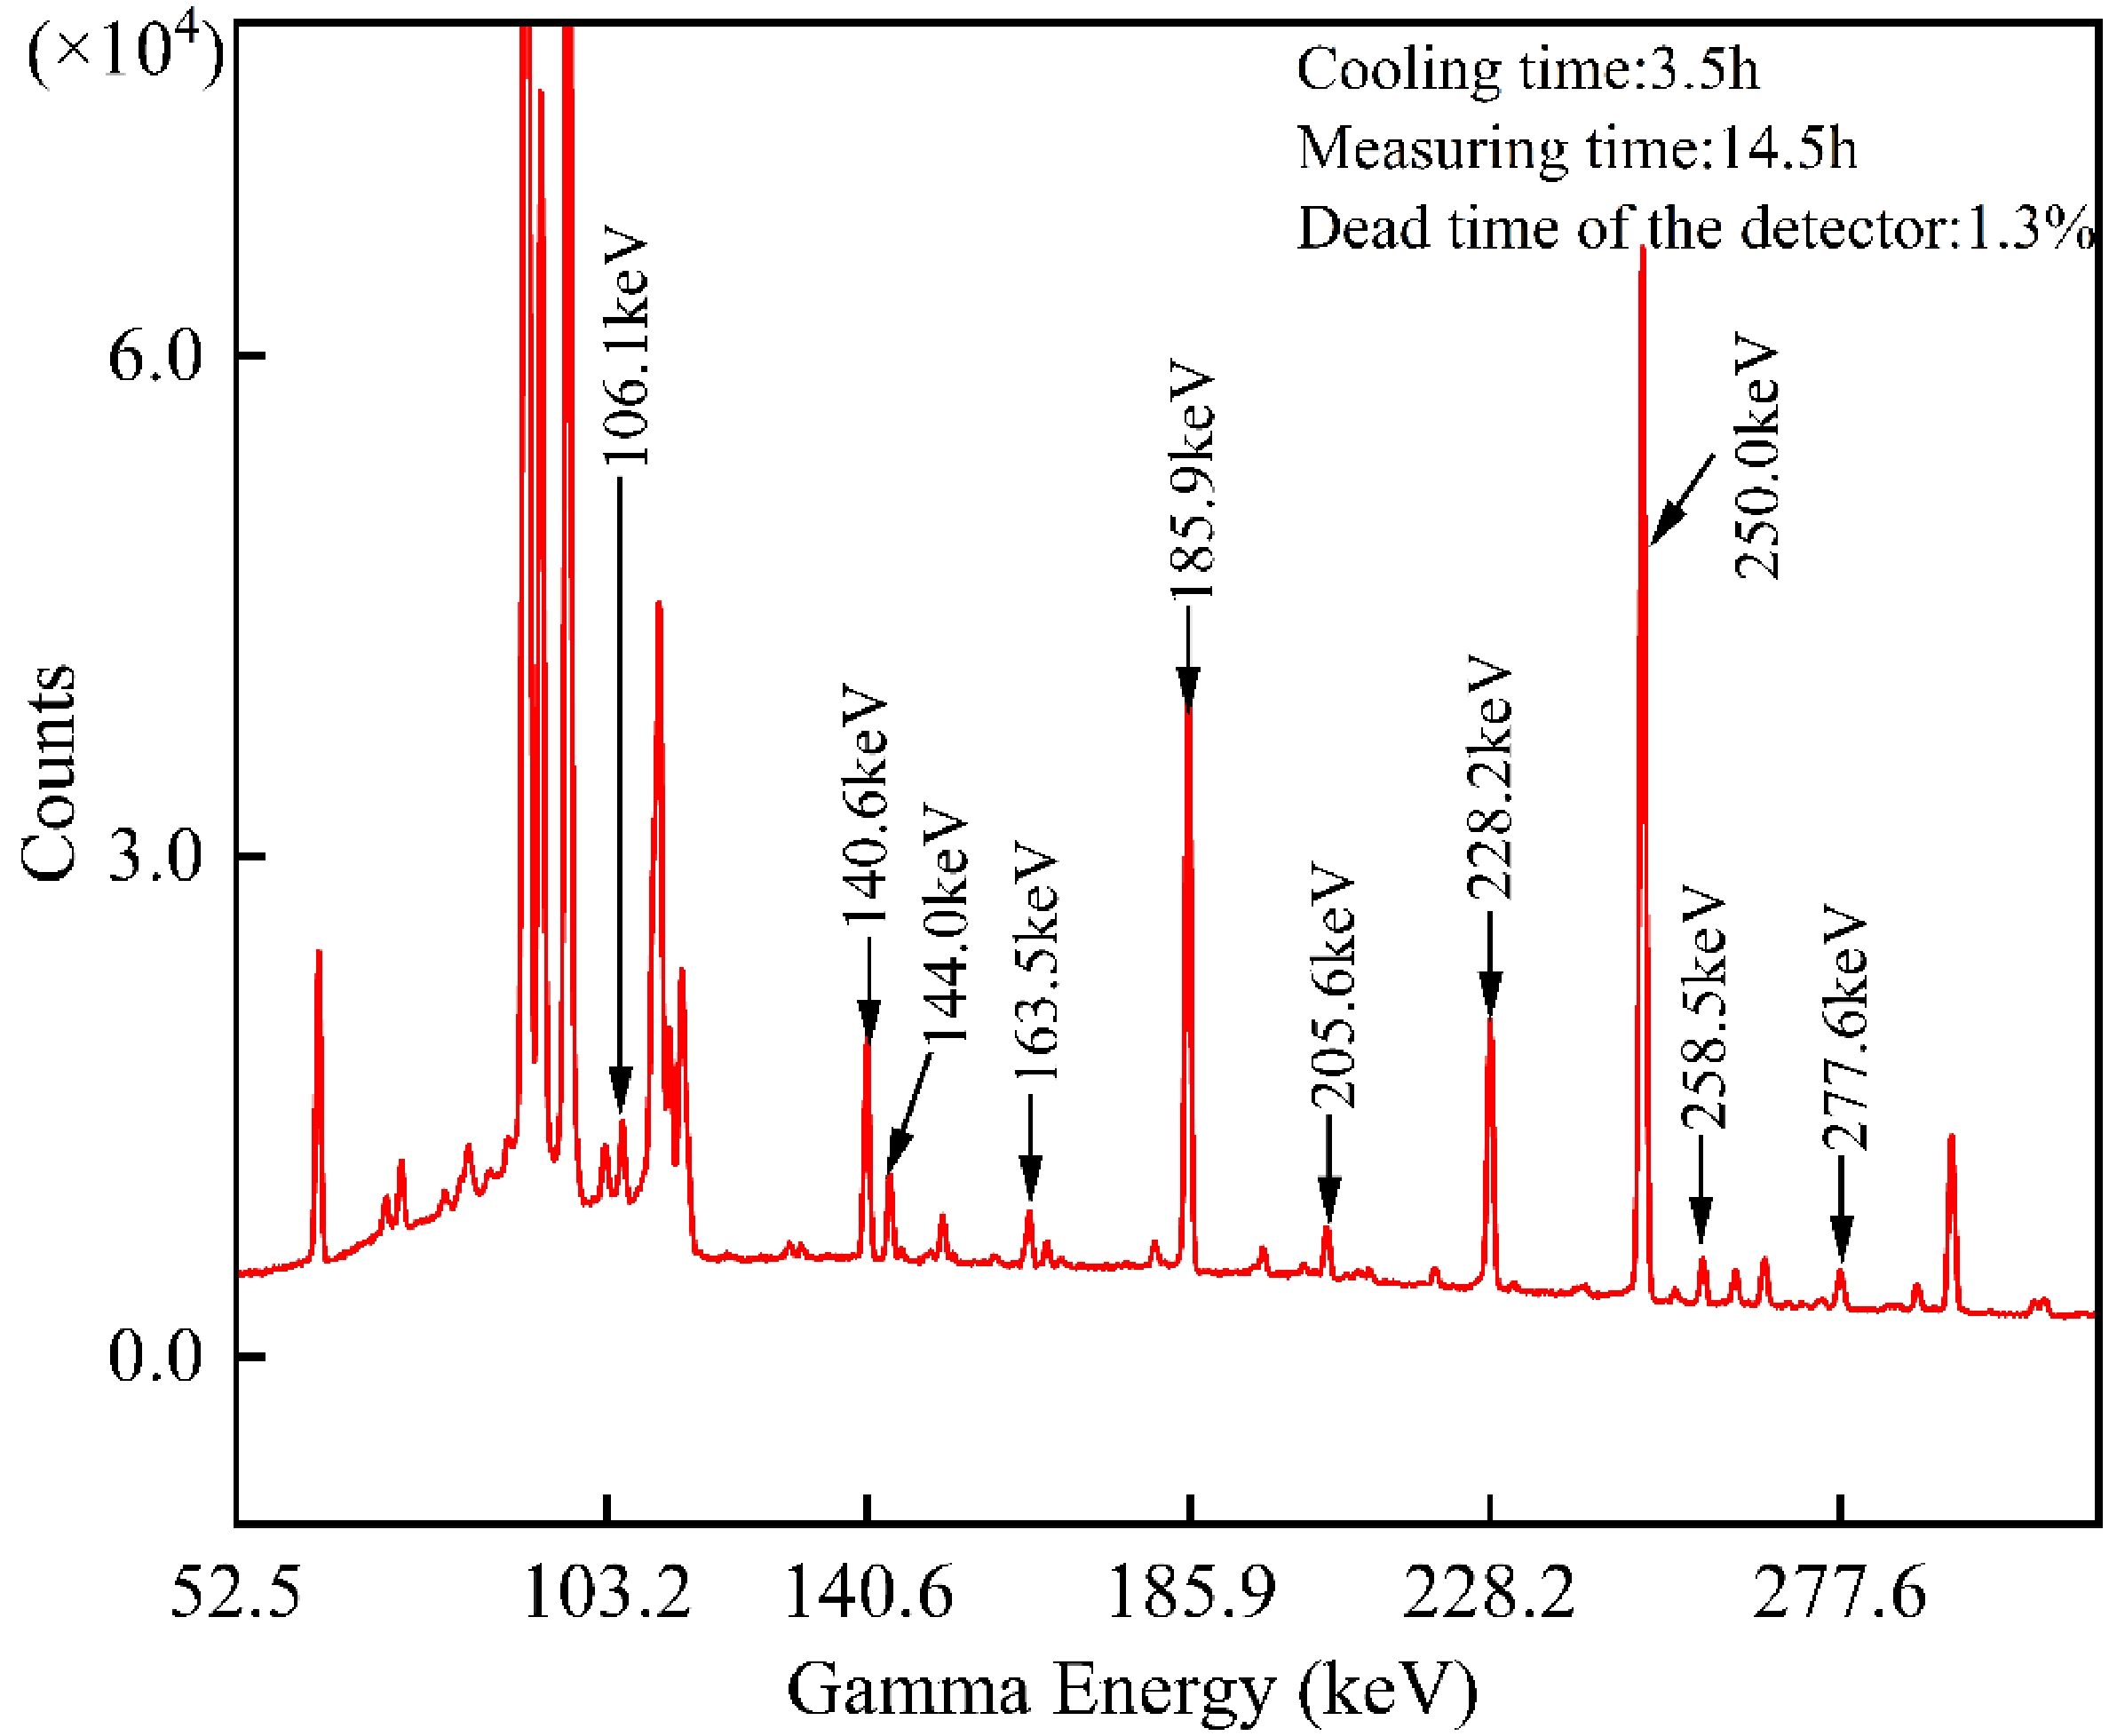
Figure 4. (color online) Partial γ-ray spectrum of irradiated U3O8 with the relevant γ-rays marked.

Figure 5. (color online) Part of gamma spectrum of U3O8 sample without neutron irradiation.
-
The average neutron energy
$ {\stackrel{-}{E}}_{n} $ at a particular angle is calculated from the average D-beam energy$ {\stackrel{-}{E}}_{d} $ incident on the D-Ti target with a specific thickness according to nuclear reaction kinetics under non-relativistic conditions. Taking into account the effect of the finite geometrical tensor angle on the neutron energy distribution at the sample, the average neutron energy$ {\stackrel{-}{E}}_{n} $ in the 0° direction is calculated by the following equations:$ {\bar E_n} = \frac{{2{d^2}}}{{{R^2}}}\int_0^\theta {{E_n}} (\theta ,{\bar E_d})\frac{{\tan \theta }}{{{{\cos }^2}\theta }}{\rm d}\theta , $

(1) with
$ {\bar E_d} = \frac{{\displaystyle\int_{{E_e}}^{{E_0}} {\dfrac{{{\sigma _T}({E_d})}}{{\dfrac{{{\rm d}E}}{{{\rm d}X}}({E_d})}}{E_d}{\rm d}{E_d}} }}{{\displaystyle\int_{{E_e}}^{{E_0}} {\dfrac{{{\sigma _T}({E_d})}}{{\dfrac{{{\rm d}E}}{{{\rm d}X}}({E_d})}}{\rm d}{E_d}} }}, $

(2) $ \Delta X = \int_{{E_e}}^{{E_0}} {\frac{1}{{\dfrac{{{\rm d}E}}{{{\rm d}X}}({E_d})}}{\rm d}{E_d}}, $

(3) where
$ {\bar{E}}_{d} $ is the average D-beam energy due to the energy deposited by the D-beam onto the D-Ti target, d is the distance of the sample from the target, and R is the sample radius. σT (Ed) is the cross-section of the D (d, n)3He reaction. E0 is the initial energy of the D-beam, and the final energy Ee is obtained by numerical integration based on the energy loss rate${\rm d}E/{\rm d}X$ (the unit is keV/mg$ \cdot $ cm-2) of D inthe D-Ti target and the target thickness $ \Delta X $ (the unit is mg/cm2) as given in Equation (3). Similarly, the average neutron energy in the 60° direction is obtained by taking into account the effects of the target thickness and geometrical tensor angle. Neutron energy dispersion depends on the extent of the spreading of the neutron energy distribution. The neutron energy dispersion caused by the target thickness is derived from half of the difference between the neutron energy corresponding to the initial energy E0 and the final energy Ee of the incident D nucleus. The total neutron energy dispersion$ \Delta {\bar{E}}_{n} $ is the squared sum of the energy dispersion due to the target thickness and the energy dispersion induced by the finite tensor angle. Therefore, neutron energies of 6.117 ± 0.119 MeV, 4.626 ± 0.086 MeV, and 3.622 ± 0.348 MeV were calculated for this experiment. -
The decay schematic of the radionuclide 239U generated by the U3O8 sample after neutron irradiation is shown below:
$ {}_{92}^{238}{\rm U}(n,\gamma ){}_{92}^{239}{\rm U}\xrightarrow{{{\beta ^ - }(100\% ),23.45\min }}{}_{93}^{239}{\rm Np}\xrightarrow{{{\beta ^ - }(100\% ),2.36d}}{}_{94}^{239}{\rm Pu}. $

The decay parameters of the generated radionuclides 239U and 239Np are all from NuDat3.0 [31] and are listed in Table 1. It can be found that the radioisotope 239U has a relatively short half-life of only 23.45 min, and that the characteristic γ-ray intensity greater than 50% has an energy of only 74.66 keV. The characteristic γ-rays with 74.66 keV produced by 239U are of low energy, and the measurement of the full-energy peak by this characteristic γ-ray with the HPGe detector has a large uncertainty. In addition, owing to the γ-ray self-absorption effect of the sample, it is hardly possible to accurately determine the amount of 239U by net counts of the full-energy peak of the characteristic γ-rays generated by 239U. Therefore, the characteristic γ-rays with 277.6 keV originating from the primary
$ {\beta }^{-} $ decay product 239Np with a longer half-life are more appropriate. However, the method of calculating the cross-sections by the characteristic γ-ray spectrum of 239Np causes certain errors. Mainly, it neglects the effect of the decay of 239U on the number growth of 239Np within 1.5 h after the end of irradiation and considers it as the decay of 239Np according to the exponential decay law during this time [32]. According to the work of Qiu et al. [32], the indirect measurement of cross-sections using decay products is meaningful when the difference between the half-lives of the parent and daughter nuclei is large (the ratios of the decay constants > 10). It is clear that the decay chain of 239U satisfies this requirement (decay constant ratio is 144.7); thus, it is not necessary to measure the characteristic γ-rays of the direct product 239U in the process of measuring the neutron capture cross-sections of 238U, and the error introduced by this treatment is negligible at 0.2%. Moreover, after cooling for at least 3 h (more than five half-lives of 239U), more than 99.9% of 239U will have decayed to generate 239Np. Considering the above, the 238U neutron capture cross-sections are determined from the net counts of the characteristic γ-ray full-energy peak of 239Np. The 239Np radionuclide is recognizable by the characteristic γ-rays of 106.1 keV, 228.2 keV, and 277.6 keV, whose intensities all surpass 10%. Nevertheless, the γ-rays at 277.6 keV were preferred over others in the calculations because the γ-rays at 106.1 keV and 228.2 keV are subjected to interference by the γ-rays at 103.2 keV and 228.2 keV originating from the fission products 153Sm (T1/2 = 46.284 h) and 132Te (T1/2 = 3.204 d), respectively [4–6]. In this experiment, the 197Au (n, γ)198Au reaction was applied to measure the neutron fluence at the U3O8 sample with the following equations:Table 1. Relevant decay data of the radionuclides 198Au, 239U, and 239Np.
$ \varphi = \frac{{{\lambda _{\rm Au}}{A_{\rm Au}}(\frac{{{t_c}}}{{{t_l}}})}}{{{\varepsilon _{\rm Au}}{I_{\rm Au}}{\sigma _{\rm Au}}{N_{\rm Au}}\left( {1 - {{\rm e}^{ - {\lambda _{\rm Au}}{t_0}}}} \right){{\rm e}^{ - {\lambda _{\rm Au}}{t_1}}}\left( {1 - {{\rm e}^{ - {\lambda _{\rm Au}}{t_c}}}} \right)}} $

(4) with
$ {N_{\rm Au}} = \frac{W}{M}{N_A}f ,$

(5) where εAu is the full-energy peak efficiency of the characteristic γ-ray produced by the Au sample, IAu is the γ-ray intensity, σAu is the standard reference cross-section originating from ENDF/B-VIII.0, and NAu is the number of atoms of 197Au (the calculation formula of NAu is shown in Equation (4); W is the sample weight, M is the relative atomic mass, NA is the Avogadro constant, and f is the natural abundance of the sample). λAu is the decay constant of the radionuclide 198Au, and AAu refers to the net counts of the characteristic γ-ray full-energy peak. t0, t1, tc, and tl are the total neutron irradiation time, chilling time, measuring time according to the clock, and measurement of the living time, respectively. Having determined the neutron flux at the U3O8 sample, the neutron capture cross-section of 238U is inferred with the following equations:
$ {\sigma _u} = \frac{{{{(\varepsilon INT)}_{\rm Au}}}}{{{{(\varepsilon INT)}_u}}} \cdot \frac{{{{(A\lambda \frac{{{t_c}}}{{{t_l}}})}_u}}}{{{{(A\lambda \frac{{{t_c}}}{{{t_l}}})}_{\rm Au}}}} \cdot {\sigma _{\rm Au}} $

(6) with
$ T = (1 - {{\rm e}^{ - \lambda {t_0}}}){{\rm e}^{ - \lambda {t_1}}}(1 - {{\rm e}^{^{ - \lambda {t_c}}}}). $

(7) -
During the experimental determination of the reaction cross-section of 238U (n, γ)239U, many factors inevitably affect the ultimate values of the experiment. Therefore, the experimental correction of the 238U neutron capture cross-section is particularly important. The primary revision elements concern five components: neutron fluence fluctuation effect Ff, sample self-absorption effect Fγ and the counting geometric correction Fg when measuring γ-rays, the neutron scattering effect FS induced by the layer of cooled water and the tube wall materials of the target head, and the neutron self-shielding effect Fa due to the thickness of the sample itself. Among them, the neutron scattering effect FS, the counting geometric correction Fg, and the neutron self-shielding effect Fa are simulated by the Monte Carlo program, while the neutron fluence fluctuation effect Ff and the γ-rays self-absorption effect Fγ are calculated by theoretical formulas.
Due to the instability of the intensity of the D-beam generated by the ion source in the 3 MV tandem accelerator as well as the divergence of the beam point striking the target, it is inevitable that the neutron fluence will fluctuate during the neutron irradiation process. Therefore, based on the neutron fluence real-time detection system of the BF3 neutron counter meter (the real-time monitoring result of the stability of the neutron fluence in the laboratory lobby is presented in Fig. 6), Ff is determined according to the following equation:
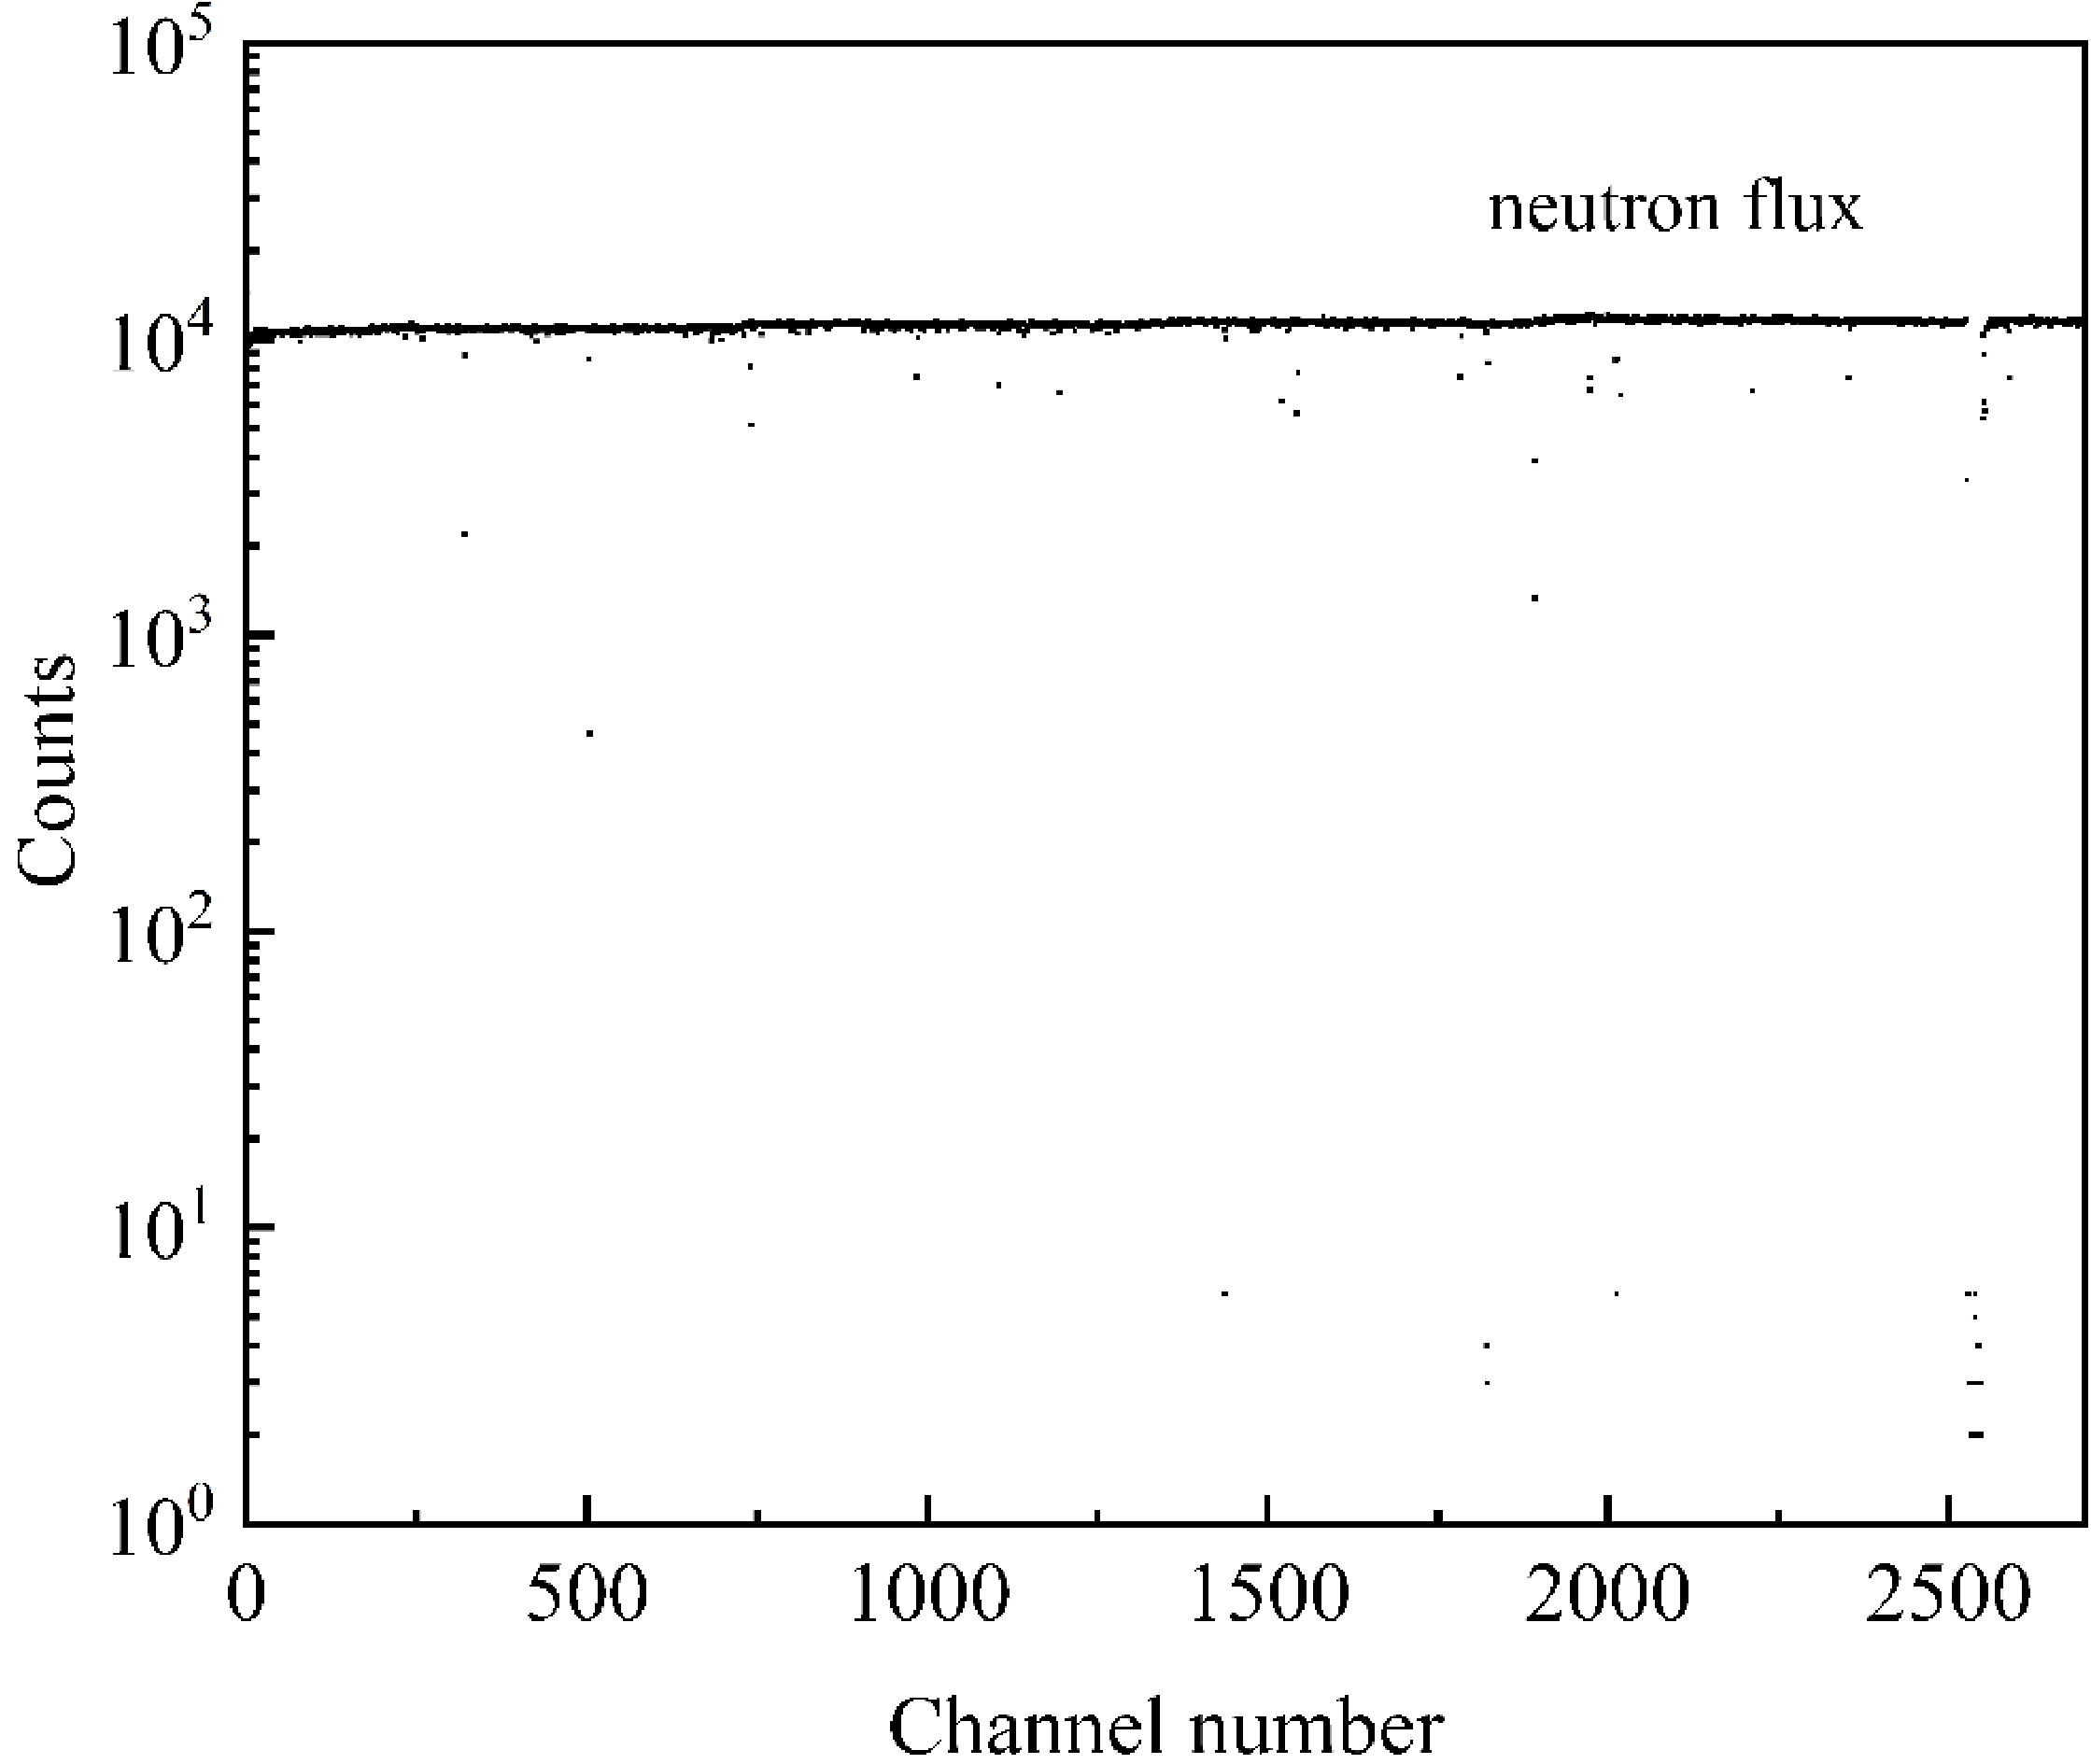
Figure 6. Counting versus time for BF3 neutron counter meter.
$ {F_f} = \frac{{\displaystyle\sum\limits_{i = 1}^{i = n} {{\varphi _i}(1 - {{\rm e}^{ - \lambda {t_i}}}){{\rm e}^{ - \lambda {T_i}}}} }}{{\displaystyle\sum\limits_{i = 1}^{i = n} {{\varphi _i}{t_i}/T(1 - {{\rm e}^{ - \lambda T}})} }}, $

(8) where T is the total neutron irradiation time, which is divided equally into n parts, and ti represents the irradiation time of the i-th interval taken arbitrarily. Ti is the time interval ranging from the starting moment of ti+1 to the termination of the neutron irradiation. λ is the decay constant of radionuclides 198Au or 239Np.
The interactions of γ-rays with the substance when the characteristic γ-rays generated after irradiation pass through the sample with a limited thickness contribute to the γ-ray self-absorption effect. Fγ is obtained by the equation below:
$ {F_\gamma } = \frac{{{\mu _m}{t_m}}}{{1 - {{\rm e}^{ - {\mu _m}{t_m}}}}}, $

(9) where the parameters tm and µm originate from the NIST-XCOM [35] data and indicate the mass thickness in g/cm2 and the mass attenuation coefficient in cm2/g, respectively. The mass attenuation coefficient of the 411.8 keV γ-ray is 0.1919 cm2/g in the Au sample, and that of the 277.6 keV γ-ray is 0.5018 cm2/g in the U3O8 sample.
In the experiment, the scattered neutrons and the scattering effect interfere with the experimental results to a certain extent when the neutrons emitted from the accelerator cross the layers of cooled water and the tube wall material of the target head. Therefore, the Monte Carlo program GEANT4 is used to simulate and calculate this [6, 30, 36]. The number of target radionuclides Nr was calculated firstly under the actual conditions (the presence of the surrounding materials). Afterwards, Nl was calculated for under ideal experimental circumstances, for which the layers of cooled water and the tube wall material of the target head were neglected. The radionuclide decay effect caused by time is not considered. Consequently, FS = Nr /Nl is derived as the correction factor for low-energy scattered neutrons.
The standard sources used in the calibration of the detection efficiency of the high-purity germanium γ-spectrometer system are point sources, but in practice, it is impossible to neglect the influence on the measured counts of the γ-spectrometer due to the large geometry of the samples (ϕ = 20 mm). Therefore, the counting geometric correction factor Fg = Nd /Nm, where Nd, Nm are the γ-ray counts of the simulated point source and the real sample size in the Monte Carlo program, respectively.
Indeed, the partial neutrons are progressively attracted by the sample itself via nuclear reactions when neutrons cross a sample with finite thickness, resulting in an attenuation of the neutron fluence. The sample is separated into n equal parts in order to work out the neutron self-shielding effect Fa. Suppose that the numbers of radionuclides generated in each part are N1, N2, ..., Ni, ..., Nn [6]; accordingly, the neutron fluence attenuation coefficient is given by the following equation:
$ {F_a} = \frac{{n{N_1}}}{{\displaystyle\sum\limits_{i = 1}^{i = n} {{N_i}} }}. $

(10) Ultimately, Fall is formulated according to the following equation, and the results are presented inTable 2.
En/MeV $ \dfrac{{{F_{\gamma U}}}}{{{F_{\gamma\rm Au}}}} $ 

$ \dfrac{{{F_{sU}}}}{{{F_{s \rm Au}}}} $ 

$\dfrac{ { {F_{aU} } } }{ { {F_{a\rm Au} } } }$ 

$\dfrac{ { {F_{fU} } } }{ { {F_{f\rm Au} } } }$ 

$\dfrac{ { {F_{gU} } } }{ { {F_{g\rm Au} } } }$ 

Fall 6.117 ± 0.119 1.2181 1.0535 0.9351 0.9657 0.9892 1.1463 4.626 ± 0.086 1.2184 0.9867 0.9628 1.0245 0.9814 1.1638 3.622 ± 0.348 1.2170 0.8879 1.0205 1.0245 0.9833 1.1109 Table 2. Summary of a variety of experimental correction results.
$ {F_{\rm all}} = \frac{{{{({F_f} \cdot {F_\gamma } \cdot {F_s} \cdot {F_a} \cdot {F_g})}_U}}}{{{{({F_f} \cdot {F_\gamma } \cdot {F_s} \cdot {F_a} \cdot {F_g})}_{\rm Au}}}}. $

(11) -
The uncertainty analysis of the nuclear reaction cross-sections is one of the essential indexes to evaluate the cross-section data in cross-section measurement work. With an increasing demand for accuracy in various experimental cross-section data and the improvement of experimental instruments, the uncertainty of cross-sectional data should be urgently mitigated [37]. The main sources of error in this experiment are systematic and statistical uncertainties. According to formula (6), the uncertainties of the cross-section results consist primarily of the statistical errors of the full-energy peak net counts (AAu, Au) of the characteristic γ-rays, calibration errors of the detector (ξ = εAu/εu), errors in the value of σAu as the standard cross-section, errors in the intensities of the γ-ray (Iu), and errors in the radionuclide half-lifes (T1/2). Due to mutual independence between these parameters, the overall uncertainties of the experimental measurements in terms of the following equations are available.
$\begin{aligned}[b]\\[-5pt] \frac{{\Delta {\sigma _u}}}{{{\sigma _u}}} = \sqrt {{{\left(\frac{{\Delta {\sigma _{\rm Au}}}}{{{\sigma _{\rm Au}}}}\right)}^2} + {{\left(\frac{{\Delta \xi }}{\xi }\right)}^2} + {{\left(\frac{{\Delta {I_u}}}{{{I_u}}}\right)}^2} + {{\left(\frac{{\Delta {A_{\rm Au}}}}{{{A_{\rm Au}}}}\right)}^2} + {{\left(\frac{{\Delta {A_u}}}{{{A_u}}}\right)}^2} + {{\left(\frac{{\Delta {T_u}}}{{{T_u}}}\right)}^2} + {{\left(\frac{{\Delta {T_{\rm Au}}}}{{{T_{\rm Au}}}}\right)}^2}} .\end{aligned}$ 
(12) The uncertainties in the half-life ∆T1/2 of the radionuclides 198Au and 239Np arise from the ENSDF Library [38]. The relative standard uncertainties of σAu are derived from ENDF/B-VIII.0. The total uncertainties are determined in the region from 3.478% to 7.450% and summarized in Table 3.
${E_n}/\rm MeV$ 

Relative uncertainty ∆x/x (%) $\dfrac{ {\Delta {\sigma _{\rm Au} } } }{ { {\sigma _{\rm Au} } } }$ 

$ \dfrac{{\Delta \xi }}{\xi } $ 

$ \dfrac{{\Delta {I_u}}}{{{I_u}}} $ 

$\dfrac{ {\Delta {A_{\rm Au} } } }{ { {A_{\rm Au} } } }$ 

$ \dfrac{{\Delta {A_u}}}{{{A_u}}} $ 

$\dfrac{ {\Delta {T_u} } }{ { {T_u} } }$ 

$\dfrac{ {\Delta {T_{\rm Au} } } }{ { {T_{\rm Au} } } }$ 

$ \dfrac{{\Delta {\sigma _u}}}{{{\sigma _u}}} $ 

6.117 ± 0.119 7.094 0.612 0.551 1.950 0.835 0.004 0.007 7.450 4.626 ± 0.086 4.450 0.612 0.551 0.912 1.392 0.004 0.007 4.822 3.622 ± 0.348 2.469 0.612 0.551 1.456 1.790 0.004 0.007 3.478 Table 3. Summarized relative uncertainty for each parameter as well as experimentally measured cross-sectional values ∆x/x (%).
-
In the current study, the reaction cross-sections of 238U (n, γ)239U have been determined employing the relative activation approach at neutron energies of 6.117 ± 0.119 MeV, 4.626 ± 0.086 MeV, and 3.622 ± 0.348 MeV. A summary of the experimentally measured cross-section values and the corresponding uncertainties at the corresponding energies is presented in Table 4. The reaction cross-sectional values of 238U (n, γ)239U derived from the ROSFOND-2010, CENDL-3.2, and ENDF/B-VIII.0 evaluation databases in the 0.8–12 MeV energy region are plotted in Fig. 7 together with the experimental measurements.
En/MeV $ {\sigma _u}/\rm mb $ 

$ \Delta {\sigma _u}/\rm mb $ 

6.117 ± 0.119 1.051 0.078 4.626 ± 0.086 4.437 0.214 3.622 ± 0.348 11.960 0.416 Table 4. Summary of experimental cross-sectional measurements and their uncertainties.
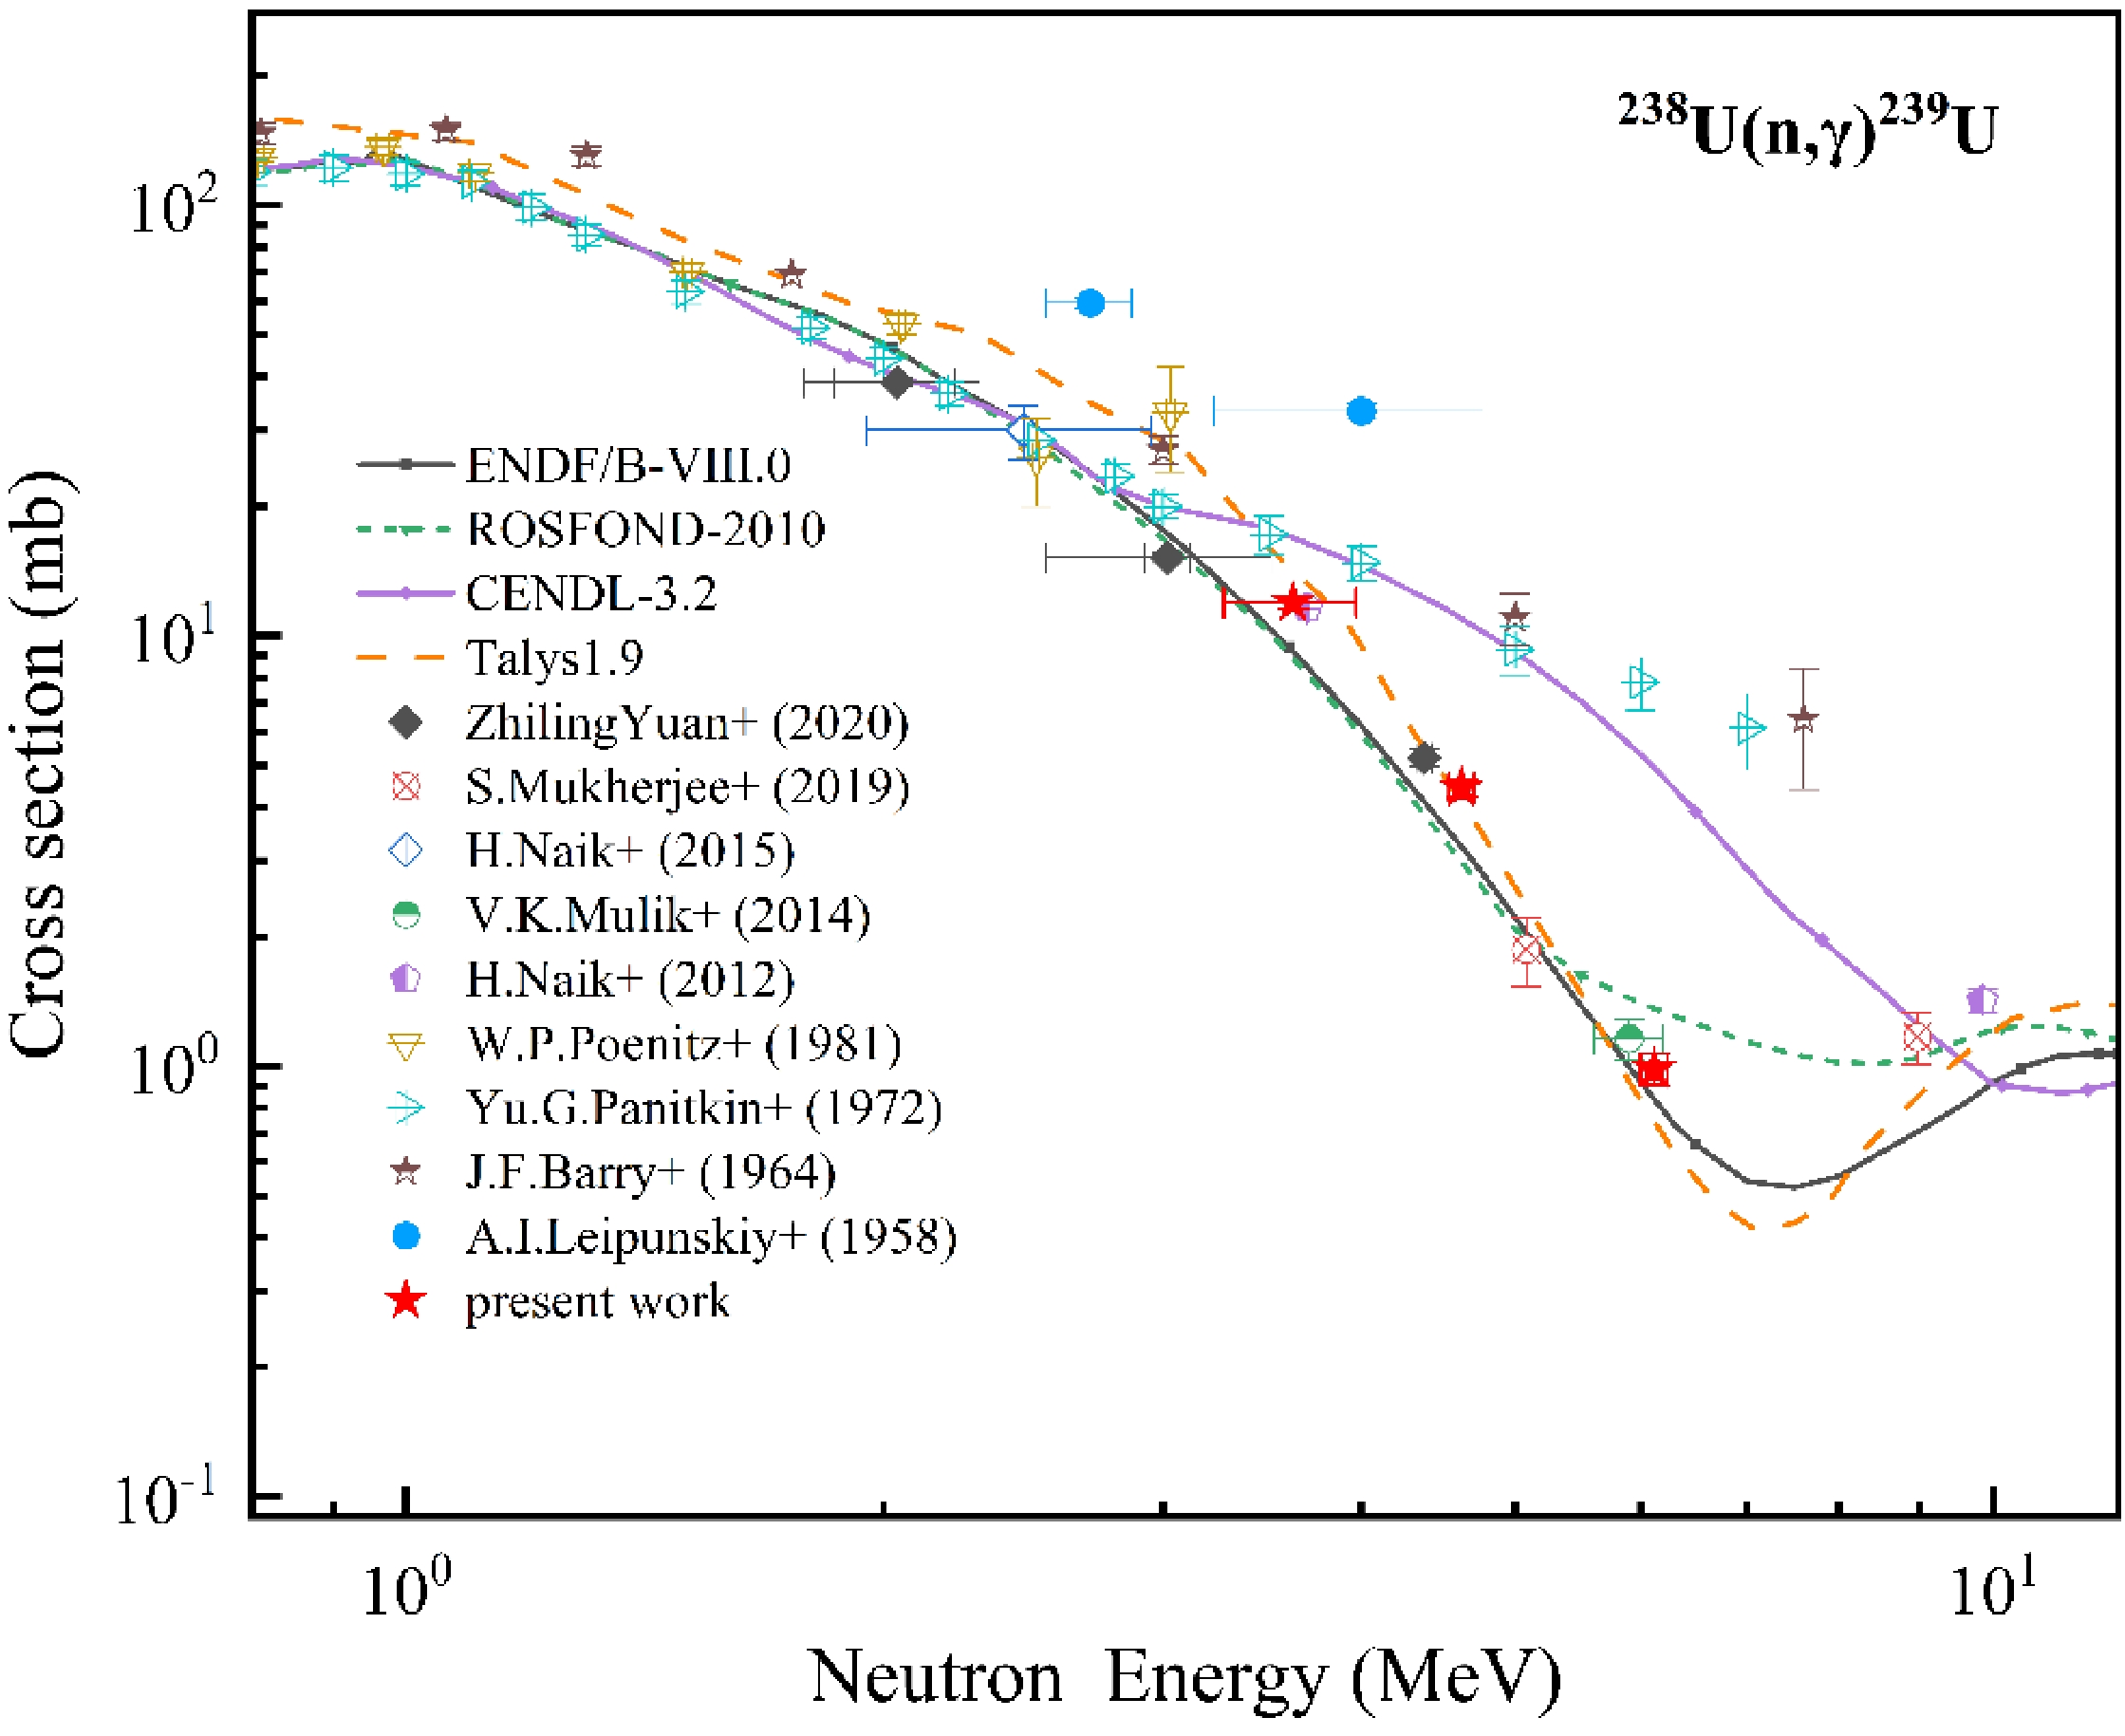
Figure 7. (color online) Graphical representation of experimental, evaluated, and theoretically calculated cross-sectional values for 238U (n, γ)239U reaction.
Theoretical calculations of nuclear data are an essential part of the nuclear data measurement and assessment process. TALYS-1.9 is the computational code used to simulate and analyze various nuclear reactions by means of established physical models and optimized parameter settings. The model structure and parameters are taken from the RIPL library [39]. It can calculate the nuclear reactions of a variety of incident particles (n, p, t, 3He, γ, α) with an energy between 0–200 MeV for a target nucleus mass number from 12 to 339. Moreover, it is available with a variety of required information including all cross-sections and each reaction channel cross-section as well as angular distributions and double differential cross-sections of the emitted particles. Therefore, the TALYS-1.9 program is used to perform theoretical simulation calculations of the reaction cross-section of 238U (n, γ)239U in the present work. The theoretical calculation results of the 238U (n, γ)239U reaction cross-section with neutron energies ranging from 0.8 to 12 MeV are illustrated in Fig. 7.
It can be clearly demonstrated that there are significant differences between the evaluation databases for the neutron energies in the range of 3.0–7.0 MeV. Within this energy region, the experimental values of Panitkin et al. [24] are more compatible with the cross-sectional values of the database CENDL-3.2 and superior to those of ROSFOND-2010 and ENDF/B-VIII.0. In addition, the results of this experiment at neutron energies of 3.622 ± 0.348 MeV, 4.626 ± 0.086 MeV, and 6.117 ± 0.119 MeV are in accordance with the evaluation data of ENDF/B-VIII.0 but marginally higher and in general agreement with the theoretical calculation results of TALYS-1.9. Moreover, the trend shown differs from those of the
evaluation databases of CENDL-3.2 and ROSFOND-2010, which clarified the variances between the evaluation databases. In addition, the experimentally measured value is in agreement with the experimental result of H.Naik et al. [20] at 3.622 MeV. From the evaluation data, the neutron capture cross-section of 238U declines sharply from 0.8 to 7.5 MeV before rising progressively. The valleys generated are primarily ascribed to the 238U (n, 2n) 237U reaction [4, 6, 7, 10, 17]. In the range of the neutron energy 0.8–6 MeV and 8–12 MeV, the theoretical calculation data obtained by the initially parameterized TALYS-1.9 are marginally superior to those obtained using the ENDF/B-VIII.0 and ROSFOND-2010 evaluation databases; however, they are inferior to the evaluation data in the 6–8 MeV energy region. -
The relative activation approach was employed to measure the neutron capture cross-sections of 238U in the 3.0–7.0 MeV energy region with a range of modifications applied in the current work. The experimental cross-sectional values at the neutron energies of 3.622 ± 0.348 MeV, 4.626 ± 0.086 MeV, and 6.117 ± 0.119 MeV approach the ENDF/B-Ⅷ.0 evaluation data and are in general agreement with the theoretical calculation results of TALYS-1.9. The experimental measurements enrich the 238U related nuclear databases and clarify the discrepancies between the evaluation databases. Furthermore, the cross-sections of the 238U (n, γ)239U reaction were calculated theoretically with the initially parameterized TALYS-1.9 program. These results suggest novel perspectives for perfecting nuclear models applied in the calculation of cross-sections as well as for implementation into the system on the basis of the 238U-239Pu fuel cycle, which is intimately associated with fuel multiplication.
Cross-sections of the 238U (n, γ) 239U reaction in the 3.0–7.0 MeV energy region measured by relative activation method
- Received Date: 2022-09-06
- Available Online: 2023-02-15
Abstract: The reaction cross-sections of 238U (n, γ)239U have been experimentally determined at neutron energies of 6.117 ± 0.119 MeV, 4.626 ± 0.086 MeV, and 3.622 ± 0.348 MeV employing the relative activation approach along with the off-line γ-ray spectroscopy method. The D (d, n)3He reaction was utilized to obtain monoenergetic neutrons of the required energy, and the 197Au (n, γ)198Au reaction cross-sections were adopted as the referential standard to ascertain the neutron capture cross-sections of 238U. Furthermore, the effects of low-energy scattered neutrons, neutron fluence fluctuations, counting of geometric corrections when measuring γ-rays, and neutron and γ-ray self-absorption caused by the sample thickness have been considered and revised in the present work. For a comparison with experimental results, the cross-sections of the 238U (n, γ)239U reaction were calculated theoretically with the original parametric TALYS-1.9 program. The experimental measurements were in contrast to previous experimental results and the evaluation data available for ROSFOND-2010, CENDL-3.2 and ENDF/B-VIII.0.


 DownLoad: