


 Abstract
 HTML
HTML Reference
 Related
 PDF
PDF


-
Although nuclear fission was discovered more than 80 years ago, experimental and theoretical studies on it are still far from being complete [1, 2]. Detailed data on the fission cross section, fission-fragment mass, kinetic energy distributions, fission neutron spectrum, and γ-ray spectrum are urgently needed for generation-IV reactor modeling of fuel inventory, reactor decay heat estimation in accident scenario modeling, nuclear material safeguard monitoring, and exploration of nuclear fission theory [3]. Because 238U is associated with 235U in a conventional reactor and with 239Pu in a fast reactor, the fission product yields (FPYs) of 238U at different neutron energies are important for both conventional and fast reactors [4, 5]. With the development of a thorium uranium circulating reactor and a fast neutron breeder reactor, the knowledge of 238U(n, f) fission reaction induced by a 14 MeV neutron is significant. For example, 147Nd plays a key role in nuclear fuel burnup monitoring, and there is a 11.86% discrepancy in previous measured data [3].
Several papers reported that the fission yields for the 14 MeV neutron-induced fission of 238U were measured using radiochemistry and mass spectrometry. The general shape of the mass yield curve has been determined [6–10]. In 1975, D.E. Adams et al. [8] measured 46 mass chain yields of 238U induced by 14.8 MeV neutrons using a radiochemical technique. Although the existing radiochemical technologies could isolate all the fission products, each element presents specific challenges and introduces varying degrees of systematic uncertainties. As one of the most accurate techniques for measuring fission products, mass spectrometry is not suitable for all fission products due to the half-life of fission nuclides.
Numerous investigations on measuring cumulative fission yields by off-line and γ-ray spectrometry are being conducted as a result of the development of the high purity germanium gamma spectrometer [11–19]. Recently, a number of studies paid close attention to the dependence of cumulative fission yield on incident-neutron energy. In 2010, J. Laurec et al. [12] performed a series of FPY measurements on 233U, 235U, 238U, and 239Pu in fields of thermal neutrons, fission neutrons, and 14.7-MeV neutrons. In 2011, M. Mac Innes [17] determined fission product yields for 14 MeV neutrons on 235U, 238U, and 239Pu. All studies revealed that the FPY data around 14 MeV neutrons were sparse, owing primarily to the lack of suitable monoenergetic neutron sources.
To address the issue of insufficient precision for FPYs at the 14 MeV neutron energy range, we conduct an investigation with fission induced by 14 MeV neutrons on 238U. Our goal is to perform a thorough high-precision self-consistent study that will provide accurate relative information at the 14 MeV neutron energy range.
-
Before using the D-T neutron to induce 238U fission, two natural triuranium octaoxide (U3O8) powder samples (99.9% purity) were made into round disks of 20 mm diameter with thicknesses 1.1 mm (U-1 sample) and 1.0 mm (U-2 sample). Each sample was placed between a Nb foil (diameter: 20 mm, thickness: 0.01 mm, purity: 99.999%) and Zr foil (diameter: 20 mm, thickness: 0.01 mm, purity: 99.99%). A 93Nb(n, 2n)92mNb reaction was used to monitor neutron flux, and the decay data are summarized in Table 1. Simultaneously, the sandwich sample was covered with a Cd box for preventing scattering of thermal neutrons. During the irradiation, three sandwich samples were placed approximately 6.0 cm away from the T-Ti target relative to the deuteron beam’s incident direction at 35° (see Fig. 1).
Activation products Half-life of product T1/2 Gamma-ray energy/keV Gamma-ray intensity Iγ (%) 90Zr(n,2n)89Zr
93Nb(n,2n)92mNb
91Sr
92Sr
93Y
95Zr
97Zr
99Mo
103Ru
105Ru
127Sb
128Sn
131I
132Te
133I
134Te
135I
140Ba
142La
143Ce
147Nd
149Nd78.41±0.12 h
10.15±0.02 d
9.65±0.06 h
2.611±0.017 h
10.18±0.08 h
64.032±0.006 d
16.749±0.008 h
65.924±0.006 h
39.247±0.013 d
4.44±0.02 h
3.85±0.05 d
59.07±0.14 min
8.0252±0.0006 d
3.204±0.013 d
20.83±0.08 h
40.8±0.8 min
6.58±0.03 h
12.7527±0.0023 d
91.1±0.5 min
33.039±0.006 h
10.98±0.01 d
1.728±0.001 h909.15
934.44
1024.3
1383.93
266.9
756.73
743.36
739.5
610.3
724.4
685.7
482.3
364.49
228.1
529.87
767.2
1260.41
537.26
641.3
293.27
531.01
270.1799.04±0.03
99.15±0.04
33.5±1.1
90±6
7.3±1.1
54.38±0.22
93.09±0.16
12.20±0.16
5.76±0.06
47.3±0.5
36.8±2.0
59±7
81.5±0.8
88±3
87.0±2.3
29.5±1.4
28.7±0.9
24.39±0.22
47.4±0.5
42.8±0.4
13.4±0.3
10.7±0.5Table 1. The decay data of monitor reaction and fission products.
Figure 1. (color online) Schematic diagram of experimental geometry [22].
The irradiation was carried out on the K-400 neutron generator (the yield is approximately 3 × 10¹⁰ n/4πs) at Institute of Nuclear Physics and Chemistry, China Academy of Engineering Physics. In order to obtain a mass distribution of fission products as completely as possible, the fission product nuclei with different lifetimes should be irradiated in batches. The irradiation time of the U-1 sample was 60 min for the measurement of fission product nuclei with a lifetime of a few hours. To measure longer-lived fission product nuclei, the U-2 sample was irradiated for 17 h. The T(d, n)4He reaction with a deuteron beam (250 keV, 180 μA) produced 14 MeV neutrons. The energies of neutrons were measured using the cross-section ratio of 93Nb(n, 2n)92mNb to 90Zr(n, 2n)89Zr reaction and compared with results of mean neutron energy calculation [20, 21], which were 14.7 ± 0.2 at 35°. The Au-Si detector relative to the deuteron beam at 135° monitored the accompanying 4He particle to measure the neutron yield and neutron flux per 10 s, which would give a correction for neutron fluctuation.
-
Before irradiation, a series of standard point sources (22Na, 60Co, 133Ba,137Cs, 152Eu) of known activity were used to determine the absolute full energy peak efficiency of a lead-shielded high purity germanium detector (HPGe type: GEM60P, produced by ORTEC) with a relative efficiency of 68% and an energy resolution of 1.82 keV at 1.33 MeV for 60Co. The detection efficiencies (
$ {\epsilon }_{p} $ ) for the point source placed at distances of 4.5 cm and 9 cm from the detector were both determined by Eq. (1) [23]:$ {\epsilon }_{p}=\frac{C}{{A}_{0}{\rm e}^{-\lambda t}\mathrm{\Delta }t{I}_{\gamma }}, $

(1) where C is the number of counts during the counting time,
$ {A}_{0} $ is the source activity at the time of manufacture,$ t $ is the time elapsed from the date of manufacture to the start time of counting,$ \lambda $ is the decay constant, and$ {I}_{\gamma } $ is the decay γ intensity.In order to obtain the detector efficiencies at the characteristic γ energies of the fission nuclides, the dependence of the full energy peak efficiency versus the energy was described by an exponential function, as expressed in Eq. (2) [24]. The fitting parameter values are given in Fig. 2.
Figure 2. (color online) The fitted efficiency curve and measured efficiency data.
$ \epsilon \left(E\right)={\epsilon }_{0}\mathrm{exp}\left(-E/{E}_{0}\right)+{\epsilon }_{C}. $

(2) -
After completion of the neutron irradiation and sufficient cooling, the two U samples and Nb samples were transferred to a pre-calibrated HPGe detector. The data acquisition was carried out using the program MAESTRO. By extending the sample cooling time or increasing the distance between the sample and the detector, it is possible to significantly lessen the impact of dead time on the statistical count of high purity germanium detectors with high count rate samples. Therefore, the U-1 sample was measured at a distance of 9 cm from the detector after 76.53 min of cooling. In order to improve the accuracy of short-lived nuclide counting, it is necessary to perform dead time correction. The U-1 and U-2 samples were measured after 22.08 h and 20.59 days, respectively, at a distance of 4.5 cm from the detector, and the dead time was negligible.
As shown in Fig. 3, hundreds of different energy characteristic gamma rays were measured by a high-purity germanium detector. In order to identify whether each gamma ray is emitted by the radionuclide of interest, the decay curve analysis method is adopted to identify the radionuclide by measuring the half-life of the radionuclide, which has been discussed in our previous article [25]. We take the 743.36 keV γ-ray produced by the 97Zr nucleus as an example, which may be affected by the very close energy γ-ray (743.66 keV, 16.1%) from 130Sn (T1/2=3.72 min) and by the 743.3 keV (100%) gamma ray from 128Sb (T1/2=9.05 h). Because the half-life of 130Sn is short and the cumulative fission yield of 128Sb is one order of magnitude lower than that of 97Zr, there is a good agreement between the half-life obtained by periodical measurement as shown in Fig. 4 (17.04 h) and the recommended half-life (16.75 h) of 97Zr. When the relative deviation between the experimental value and recommended value is less than 5%, it will be selected for the final fission yield calculation [18]. By using this method, twenty characteristic gamma rays (as shown in Fig. 4) were selected to calculate the fission yield. The decay characteristics of the product radioisotopes are summarized in Table 1.

Figure 3. (color online) The background subtracted gamma spectrum of different fission products of the 238U sample. (a) U-1 sample at 9 cm with 1369 s lifetime; (b) U-1 sample at 4.5 cm with 3600 s lifetime; (c) U-2 sample at 4.5 cm with 10800 s lifetime.
Figure 4. (color online) Relationship between measurement time of 97Zr and logarithm of characteristic peak counts.
-
The number of detected γ-rays corresponding to the activity of fission products was obtained from their total peak areas by subtracting the linear Compton background. The number of detected γ-rays under the photo-peak of an individual fission product is related to their cumulative yields as follows [4]:
$ Y=\frac{C\lambda {f}_{\rm all}}{\mathrm{\Phi }{\sigma }_{f}{N}_{u}\epsilon {I}_{\gamma }(1-{\rm e}^{-\lambda {t}_{1}}){\rm e}^{-\lambda {t}_{2}}(1-{\rm e}^{-\lambda {t}_{3}})}, $

(3) where
$ C $ is the net area of the photoelectric peak of the measured characteristic gamma rays; λ is the decay constant of the fission product;$ {\sigma }_{f} $ is the fission cross section of 238U at the neutron energy used;$ {N}_{u} $ is the number of 238U in the target;$ \epsilon $ is the detection efficiency of the high purity germanium detector system;$ {t}_{1} $ ,$ {t}_{2} $ , and$ {t}_{3} $ denote the irradiation time, cooling time, and real measurement time, respectively;${f}_{\rm all}$ is the correction factor; and$ \mathrm{\Phi } $ is the neutron flux, which can be obtained from the monitor foil Nb as shown in Eq. (4):$ \mathrm{\Phi }=\frac{{C}'{\lambda }'{f}_{\rm all}'}{{N}'{\sigma }'{\epsilon }'{I}_{\gamma }'(1-{\rm e}^{-{\lambda }'{t}_{1}}){\rm e}^{-{\lambda }'{t}_{2}'}(1-{\rm e}^{-{\lambda }'{t}_{3}'})}, $

(4) where
${C}'$ is the net area of the photoelectric peak of the measured characteristic gamma rays of 92mNb;${\lambda }'$ is the decay constant of 92mNb;${\sigma }'$ is the cross section of the 93Nb(n, 2n)92mNb reaction at the neutron energy used;${N}'$ is the number of 93Nb in the monitor target;${\epsilon }'$ is the detection efficiency of the 934.44 keV γ ray in the high purity germanium detector;$ {t}_{1} $ ,${t}_{2}'$ , and${t}_{3}'$ denote the irradiation time, cooling time, and real measurement time of the Nb sample, respectively; and${f}_{\rm all}'$ is the correction factor. -
In the nuclear reaction data measurement by the activation method there are some corrections such as photon attenuation, neutron flux fluctuation, cascade summing correction, scattered neutron correction, dead time correction, and isotopic impurities. The main correction factor
${f}_{\rm all}$ in Eq. (3) and main uncertainty sources are introduced in this section. -
Gamma rays are emitted throughout the target volume and experience self-absorption before reaching the detector, which causes the count reduction. Before determining the yield, the self-absorption effect must be corrected to establish the absolute activity of any fission products in the target. According to the attenuation law of γ-rays in matter, the correction factor can be calculated as expressed in Eq. (5):
$ F=\frac{1-{\rm e}^{-\mu \left(E\right)x}}{\mu \left(E\right)x}, $

(5) where
$ \mu \left(E\right) $ is the energy-dependent mass attenuation coefficient (cm2·g−1), and x is the product of the material density and “effective” thickness of the sample (g·cm−2). Values for$ \mu \left(E\right) $ for uranium metal were obtained from the National Institute of Standards & Measurements: XCOM database [26]. According to the ratio of U and O, the total mass attenuation coefficient of different gamma ray energies of U and O materials could be obtained by interpolation. -
The accelerator neutron source cannot be completely stable during long time irradiation; hence, the neutron injection rate fluctuates to a certain extent and needs to be corrected. The correction factor K is calculated using Eq. (6):
$ K=\left[\sum _{i}^{L}{\mathrm{\Phi }}_{i}(1-{\rm e}^{-\lambda \mathrm{\Delta }{t}_{i}}){\rm e}^{-\lambda {T}_{i}}\right]\Big/\mathrm{\Phi }S, $

(6) where
$ L $ is number of time intervals into which the irradiation time is divided,$ \mathrm{\Delta }{t}_{i} $ is the duration of the${i}_{\rm th}$ time interval,$ {T}_{i} $ is time interval from the end of the${i}_{\rm th}$ interval to the end of irradiation, and$ {\mathrm{\Phi }}_{i} $ is neutron flux averaged over the sample during$ \mathrm{\Delta }{t}_{i} $ . -
For the fission product yield measurement, cascade summing correction is non-negligible. Because of the time consistency, it is possible that one or more of the γ-rays are simultaneously recorded by the HPGe detector, resulting in the count addition or loss of the characteristic gamma-ray peak. This effect is particularly position dependent for each fission product [18]. The correction factor of cascade summing can be simply written as Eq. (7). A detailed calculation of cascade coincidence correction coefficient can be found in Ref. [27]:
$ C=S/{S}' , $

(7) where
$ S $ is the full-energy peak intensity of the characteristic γ ray if there is no cascade coincidence effect, and${S}'$ is the actual observed full-energy peak intensity of the characteristic γ ray.The correction factors of photon attenuation, neutron flux fluctuation, and cascade summing correction as well as the total correction factor are summarized in Table 2.
Fission products Photon attenuation Beam fluctuation Coincidence summing Total correction factor 91Sr
92Sr
93Y
95Zr
97Zr
99Mo
103Ru
105Ru
127Sb
128Sn
131I
132Te
133I
134Te
135I
140Ba
142La
143Ce
147Nd
149Nd1.0063
1.0049
1.0586
1.0089
1.0091
1.1401
1.0115
1.0095
1.0102
1.0165
1.0282
1.0821
1.0142
1.0087
1.0052
1.0139
1.0109
1.0430
1.0141
1.05670.9991
0.9961
0.9992
1.0001
0.9996
1.0001
1.000
0.9978
0.9950
0.9894
0.9961
1.0001
0.9997
1.1094
0.9986
1.0001
0.993
0.9999
0.9977
0.99391.0229
1.0034
1.0064
0.9848
1.0037
1.0052
1.0313
1.0124
1.0024
1.0002
0.9999
1.0025
1.0815
1.0012
0.9978
1.0145
1.0006
0.9992
1.0075
1.00091.0284
1.0044
1.0645
0.9937
1.0124
1.1461
1.0432
1.0198
1.0076
1.0059
1.0241
1.0849
1.0965
1.1204
1.0016
1.0287
1.0044
1.0421
1.0194
1.0512Table 2. Values of correction factors.
-
The main uncertainties in the presented measurements are summarized in Table 3, which include photoelectric peak area (0.1%–5%), gamma ray emission probability (0.1%–15%), photoelectric peak detection efficiency (2.0%–3.0%), half-life (0.01%–0.93%), and coincidence summing (3%). The cross-section uncertainty (0.6%) of the 238U(n, f) reaction was obtained by an interpolation method from literature [28]. The total uncertainty (4.62%–16.45%) in the present work is the quadratic summation of the given uncertainties.
Source of uncertainty Magnitude (%) Photoelectric peak area
Detection efficiency
Gamma ray emission probability
Cross section of 238U(n, f)[26]
Half-life
γ-ray absorption
Target mass
Neutron flux correction
Coincidence summing0.1–5
≤3
0.1–15
0.6
0.01–0.93
1
0.01
0.5
≤3Total 4.62–16.45 Table 3. Sources of uncertainties and their magnitudes.
-
As can be seen from Table 4, twenty cumulative fission product yields were determined for 238U targets at 14.7 MeV incident neutron energy. The given error for each nuclide is the corresponding total uncertainty in the presented experiment. The experimental results in Table 4 were obtained by the direct gamma ray and radiochemistry method. Adams’ data induced by 14.8 MeV neutrons were measured based on radiochemistry. There exists approximately a 5%–20% difference between presented results and Adams’ data [8]. For the light mass region, the cumulative fission yields in the presented work are lower than in Adams’ work. However, for most nuclides at heavy mass region, the results are higher than Adams’ results, beside 127Sb, 128Sn, and 143Ce. The fission yields of irradiated 238U targets results in M. Innes’ [17] and J. Laurec’s [12] works are directly measured by gamma spectrometer without chemical separation. The yields measured in the presented work are comparable with M. Innes’ and J. Laurec’s works. Comparing with J. Laurec’s data, it can be seen that the fission yields obtained by the presented work are consistent with the literature value within the experimental error range, except for 105Ru,127Sb, and 143Ce. M. Innes’s work is significantly higher than the previous results. Partial discrepancies between the presented work and M. Innes’s data at 14 MeV neutron energy regions are more than 25%. All the results show that the analysis methods of gamma spectrum and data processing in present work are reliable.
Fission product Present work at 14.7 MeV Adams at 14.8 MeV M. Innes at 14 MeV J. Laurec at 14.7 MeV 91Sr
92Sr
93Y
95Zr
97Zr
99Mo
103Ru
105Ru
127Sb
128Sn
131I
132Te
133I
134Te
135I
140Ba
142La
143Ce
147Nd
149Nd3.56±0.21
3.78±0.30
3.99±0.63
4.75±0.21
5.08±0.22
5.40±0.26
4.70±0.23
2.83±0.13
1.05±0.19
1.15±0.12
4.24±0.19
4.91±0.20
5.30±0.24
6.70±0.34
5.60±0.30
4.76±0.21
4.08±0.19
2.96±0.13
2.08±0.11
0.97±0.074.14±0.37
3.93±0.42
4.63±0.24
5.21±0.27
5.55±0.58
5.60±0.50
5.04±0.28
2.90±0.38
1.53±0.15
1.46±0.19
\
4.11±0.31
5.68±0.51
6.35±0.30
5.39±0.44
4.54±0.40
3.81±0.28
4.25±0.10
1.97±0.09
1.69±0.154.89±0.18
\
\
5.48±0.21
5.26±0.28
5.26±0.20
3.40±0.22
1.96±0.09
2.32±0.16
\
4.72±0.21
4.24±0.17
4.25±0.19
\
\
4.67±0.18
\
\
1.71±0.08
\\
\
\
4.92±0.12
5.18±0.14
5.79±0.13
4.64±0.12
3.36±0.15
1.35±0.07
\
4.08±0.11
4.72±0.19
5.50±0.24
\
\
4.56±0.11
\
3.86±0.10
1.94±0.10
\Table 4. Fission product yield results obtained from neutron-induced fission of 238U around 14 MeV.
As H. Naik showed, the mass chain yields could be obtained from the fission product yields by using a charge distribution correction [4]. However, the difference between the cumulative fission and the mass chain yields is much less than 1%. Thus, the fission product yields are used to substitute the mass chain yields directly. Figure 5(a) shows the presented FPY results and total uncertainties along with the evaluated nuclear data and experimental data in Table 2. Figure 5(b) shows that the majority of discrepancies between evaluations ENDF/B-VIII.0 [29] and JEFF-3.3 [30] are 0.1%–40%. Most of the fission products yields in the presented work are 3%–12% lower than that in ENDF/B-VIII.0 in the light mass region. However, when A=100, the fission yield of JEFF-3.3 is 20% higher than that of ENDF/B-VIII.0. Compared with those of ENDF/B-VIII.0, the presented data are in better agreement with JEFF-3.3 in the light mass region. It is obvious that the fission yields of ENDF/B-VIII.0 in the heavy mass region have a higher consistency with JEFF-3.3 than those in the light mass region. Except for 127Sb, 128Sn, and 143Ce, the present results are consistent with those of ENDF/B-VIII.0 and JEFF-3.3 in the heavy mass region within the uncertainty. There is a lack of evaluation data on the fission yield of 238U with the 14 MeV neutron in the CENDL-3.2 library [31], and the experimental data in this energy region are insufficient; therefore, the present work can lay a foundation for the establishment of the CENDL-3.2 library.
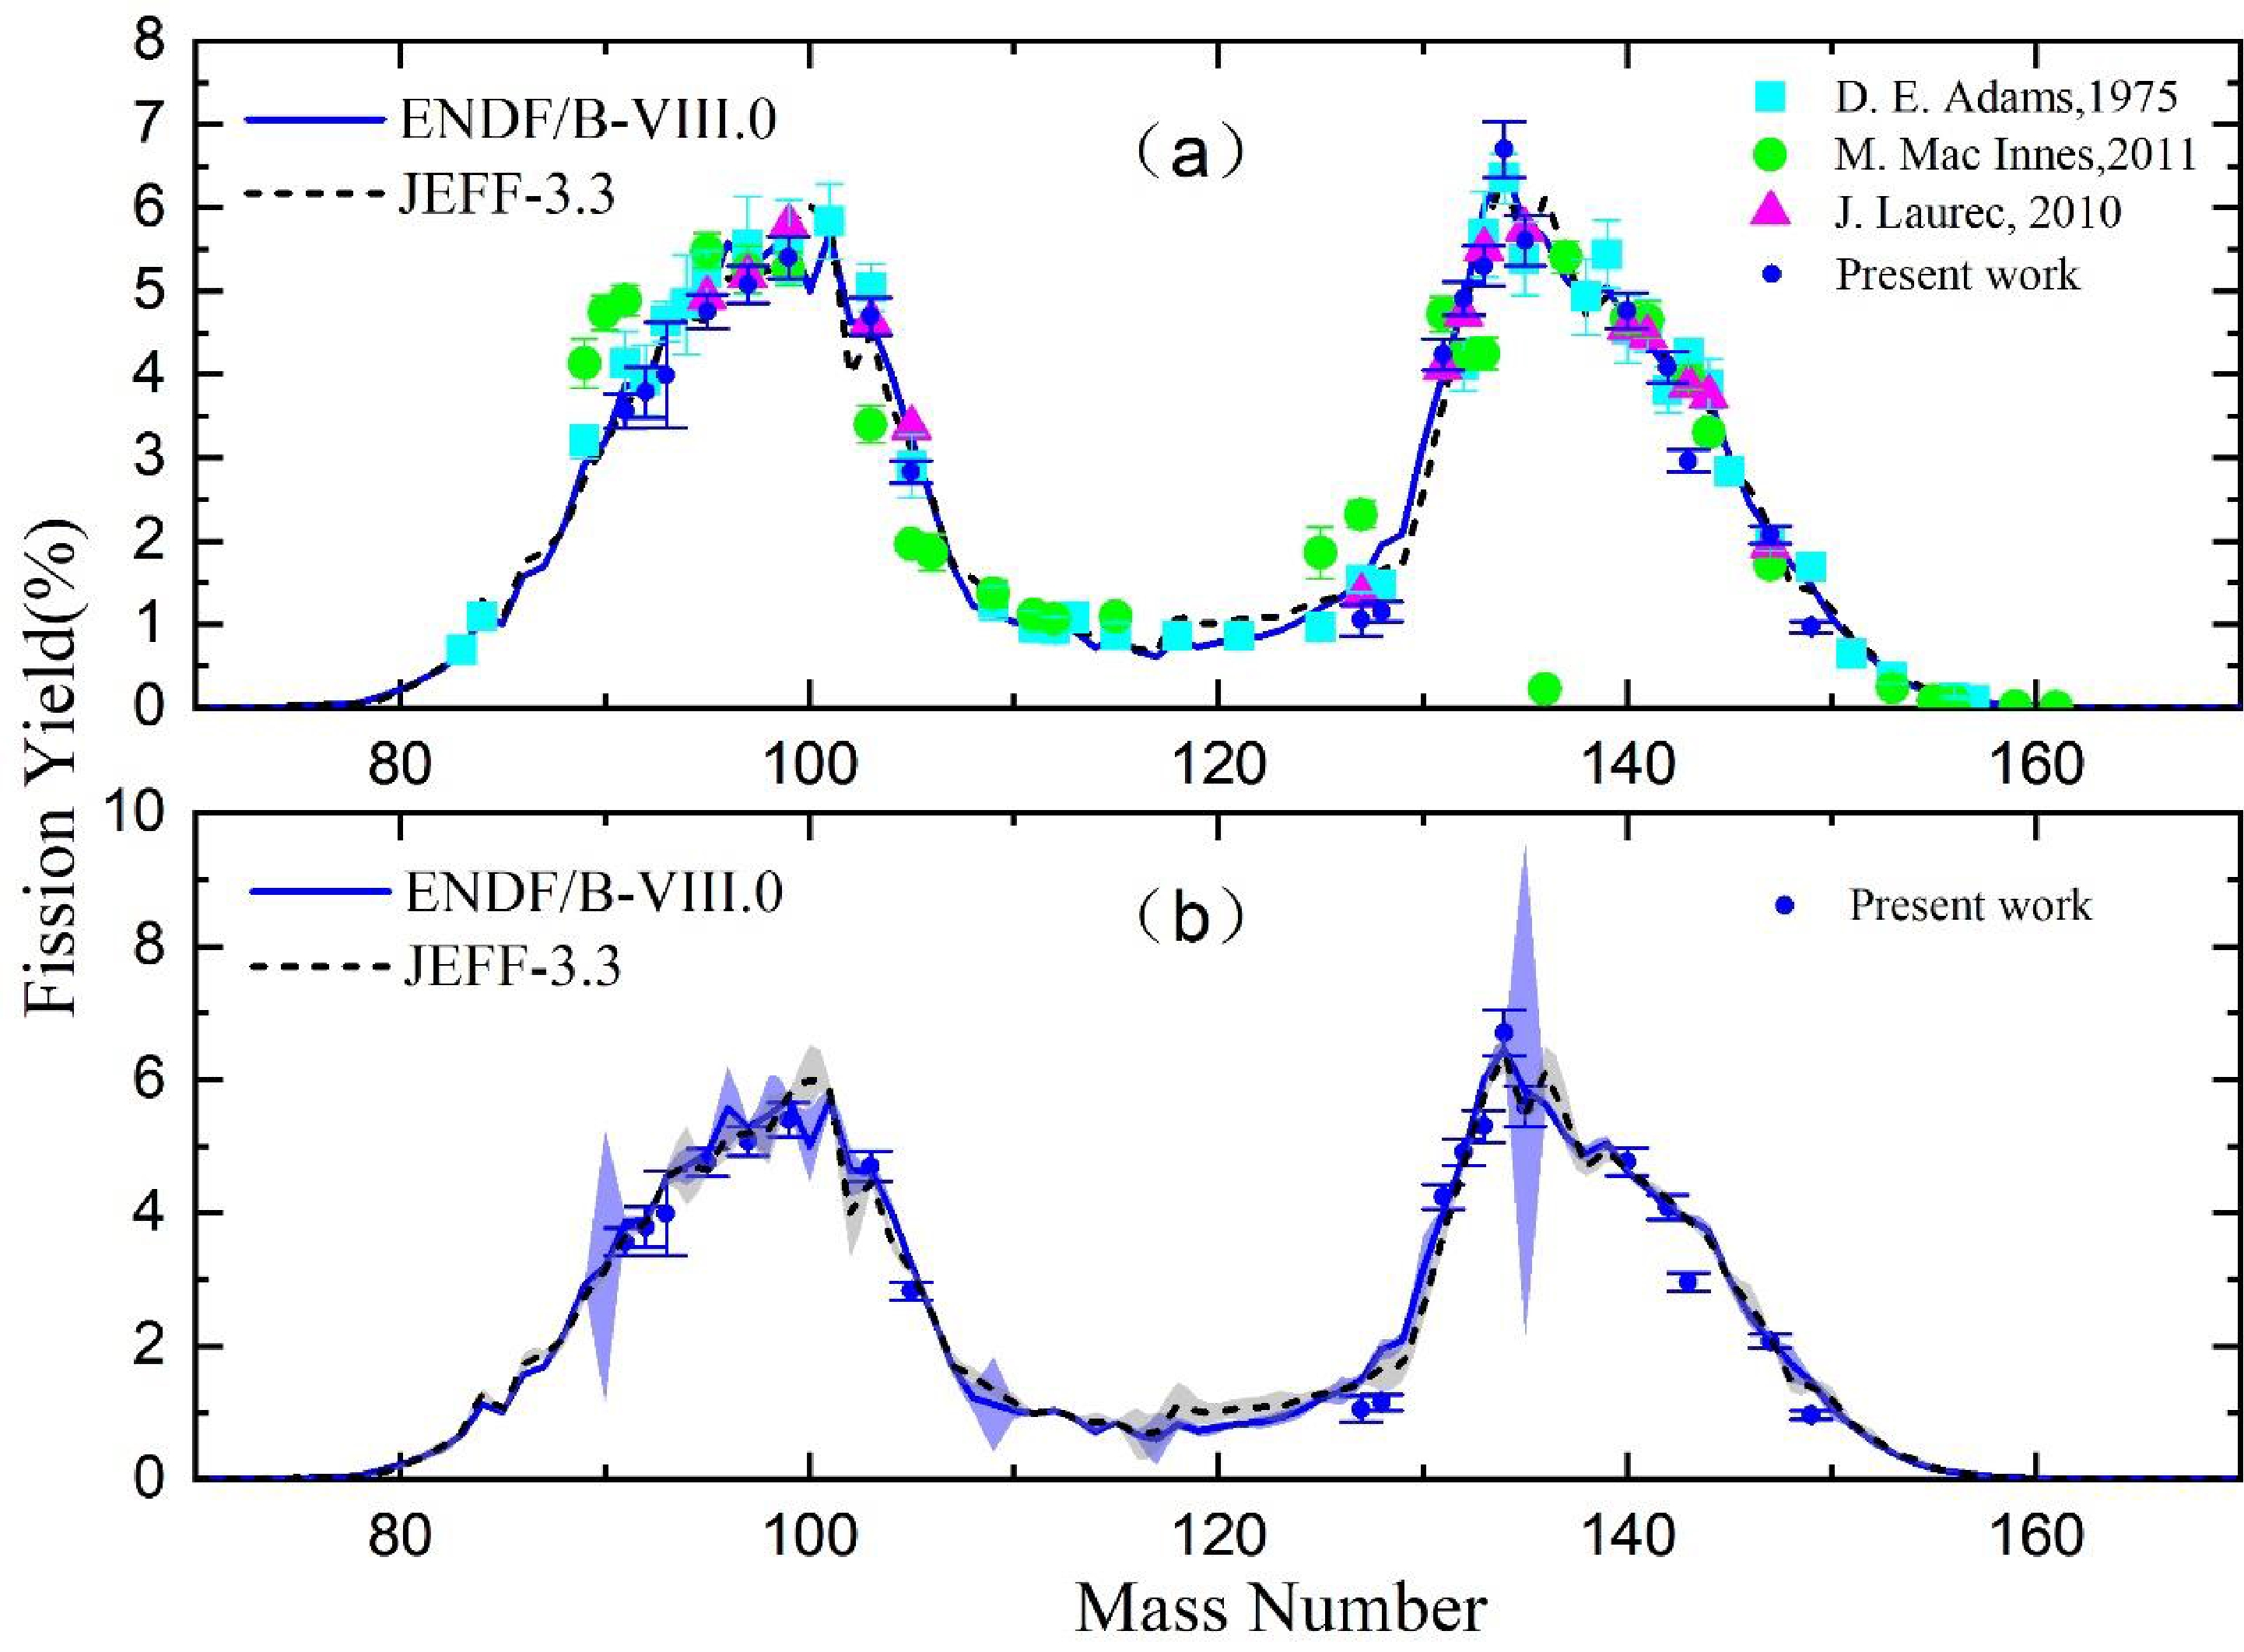
Figure 5. (color online) Present data compared to the fission product yield distributions from the evaluated nuclear data and experimental data in Table 2 (a). The light blue and light grey areas correspond to the uncertainties of ENDF/B-VIII.0 and JEFF-3.3, respectively (b).
-
A consistent set of high-quality cumulative fission product yield of 238U measurements were measured with 14 MeV neutrons using an off-line γ-ray spectrometric technique. The experiment was performed with a quasi-monoenergetic neutron generator. After a series of corrections, the cumulative fission product yields for each identified fission product ranging from 92Sr to 147Nd in the 238U(n, f) reaction are given along with the total uncertainty for each. The twenty cumulative fission product yields in general agree well with existing data. ENDF/B-VIII.0 and JEFF-3.3 presented the evaluated cumulative fission yield data of the 238U reaction at 14 MeV. Our results are consistent with the evaluated yields of JEFF-3.3 but are lower than those of ENDF/B-VIII.0 in terms of light mass peak. The accuracies of fission yields were improved for most mass numbers. Our systematic measurement provides data support for the design of a generation-IV reactor and lays the foundation for the construction of evaluated nuclear databases.
Cumulative fission yield measurements with 14.7 MeV neutrons on 238U
- Received Date: 2022-08-28
- Available Online: 2023-02-15
Abstract: The fission yield data in the 14 MeV energy neutron induced fission of 238U play an important role in decay heat calculations and generation-IV reactor designs. In order to accurately measure fission product yields (FPYs) of 238U induced by 14 MeV neutrons, the cumulative yields of fission products ranging from 92Sr to 147Nd in the 238U(n, f) reaction with a 14.7 MeV neutron were determined using an off-line γ-ray spectrometric technique. The 14.7 MeV quasi-monoenergetic neutron beam was provided by the K-400 D-T neutron generator at China Academy of Engineering Physics (CAEP). Fission products were measured by a low background high purity germanium gamma spectrometer. The neutron flux was obtained from the 93Nb (n, 2n)92mNb reaction, and the mean neutron energy was calculated using the cross-section ratios for the 90Zr(n, 2n)89Zr and 93Nb(n, 2n)92mNb reactions. With a series of corrections, high precision cumulative yields of 20 fission products were obtained. Our FPYs for the 238U(n, f) reaction at 14.7 MeV were compared with the existing experimental nuclear reaction data and evaluated nuclear data, respectively. The results will be helpful in the design of a generation-IV reactor and the construction of evaluated fission yield databases.


 DownLoad: