-
For thulium (Tm), the creation of (n, 2n) reaction products is especially sensitive to high-energy neutrons above the (n, 2n) threshold, such as neutrons around 14 MeV; therefore, thulium is an important radiochemical diagnostic element for determining neutron fluencies, and the 169Tm(n, 2n)168Tm reaction cross sections are important data for neutron diagnostics [1, 2].
Several studies have provided data for the 169Tm(n, 2n)168Tm reaction from the threshold to 28 MeV [3−13]. Bayhurst et al. [4] measured the data at incident neutron energies between 8.65 and 28 MeV with an uncertainty of 5%−10%. Gamma-rays of the product were measured using an NaI detector; however, they did not measure the data for 9.5−13 MeV and 14.2−16.0 MeV. Veeser et al. [6] measured the data from 14.7 to 24 MeV with an uncertainty of 5%−47% using large liquid scintillators, and Luo et al. [11] measured the data from 13.5 to 14.8 MeV with an uncertainty of 4%−5%. These data are approximately 10% lower than most other measurements around 14 MeV. In 2016, Champine et al. [12] reported new data between 17 and 21 MeV. They used quasimonoenergetic neutrons produced by the 2H(d, n)3He reaction; however, the deuterons induced break-up reactions on the structural materials of the deuterium gas cell and the deuterium gas itself, thus creating a substantial number of contamination neutrons. This resulted in large corrections to the cross-section data, and hence, the uncertainty given in Ref. [12] ranged from 7% to 60%. In 2021 Finch et al. [13] reported new data between 14.8 and 21.1 MeV; they used three HPGe detectors, and the uncertainty ranged from 5.6% to 6.6%. There are obvious discrepancies among these experimental data, especially at incident energies of 13 to 18 MeV. There are also discrepancies among the evaluated data from ENDF/B-VIII.0 [14], JENDL-4.0 [15], and JEFF-3.3 [16] in the energy range 12-20 MeV. In particular, data from JEFF-3.3 are approximately 10%−20% lower than those from ENDF/B-VIII.0 and JENDL-4.0 between 16 and 20 MeV.
Therefore, more precise measurements in this energy range are needed to clarify the discrepancies among the existing data and guide evaluations. The purpose of this study is to precisely determine the 169Tm(n, 2n)168Tm reaction cross sections in the 12−19.8 MeV energy range.
For the precision of 169Tm(n, 2n)168Tm cross section measurement, two-ring orientation assembly was designed and successfully used to measure the (n, 2n) reaction cross section data for several other nuclei [10, 17]. Neutron flux was monitored using the BF3 detector. The radioactivity of the products was measured using a Ge detector (GEM60P type). The measurements were performed relative to the 93Nb(n, 2n)92mNb cross section [18]. The cross sections of the 169Tm(n, 2n)168Tm reaction were measured from 12 to 19.8 MeV and compared with previous experimental data and evaluated data. Model calculations were also performed with the UNF code [19].
This paper is organized as follows. The experimental procedure is presented in Sec. II, the data processing procedure is described in Sec. III, the theoretical calculation is briefly presented in Sec. IV, results and discussion are provided in Sec. V, and conclusions are given in Sec. VI.
-
12−19.8 MeV neutrons were produced via the D-T reaction on the target assembly at the 5SDH-2 1.7 MV Tandem accelerator. The incident deuteron beam energy and intensity were 3.276 MeV and approximately 7 μA, respectively. The target assembly was designed to be a single-tube construction to reduce the scattering neutrons caused by target assembly. The diameter of the titanium-tritide (TiT) target active area was 12 mm. The air-cooled device was used to cool the TiT target. The distance from the TiT target to the ground was approximately 3 m, and the distance to the wall and ceiling was greater than 5 m, so that the scattering neutrons from the environment were reduced.
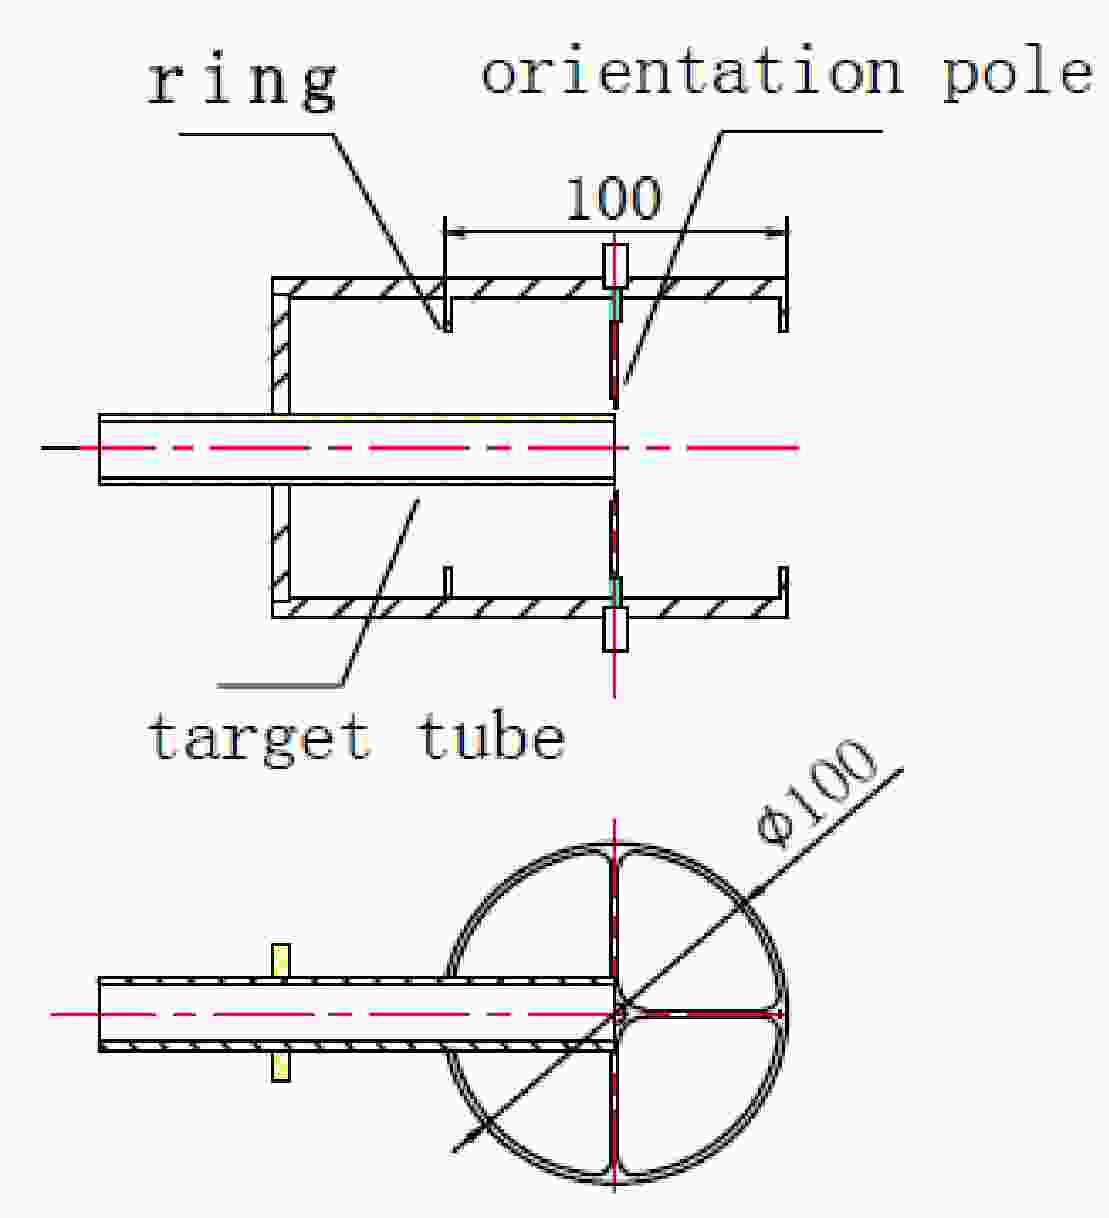
The sample assembly is shown in Fig. 1. It was a two-ring orientation assembly. The neutron source was surrounded by the two-ring orientation assembly with a radius of 5 cm. It was jointed with the target tube using a stainless steel sleeve. The sample assembly was slightly adjusted through two center orientation poles to ensure that the line crossing the two ring centers threaded the TiT target center. The rings (as shown in Fig. 1) were scaled from 0° to 180°.
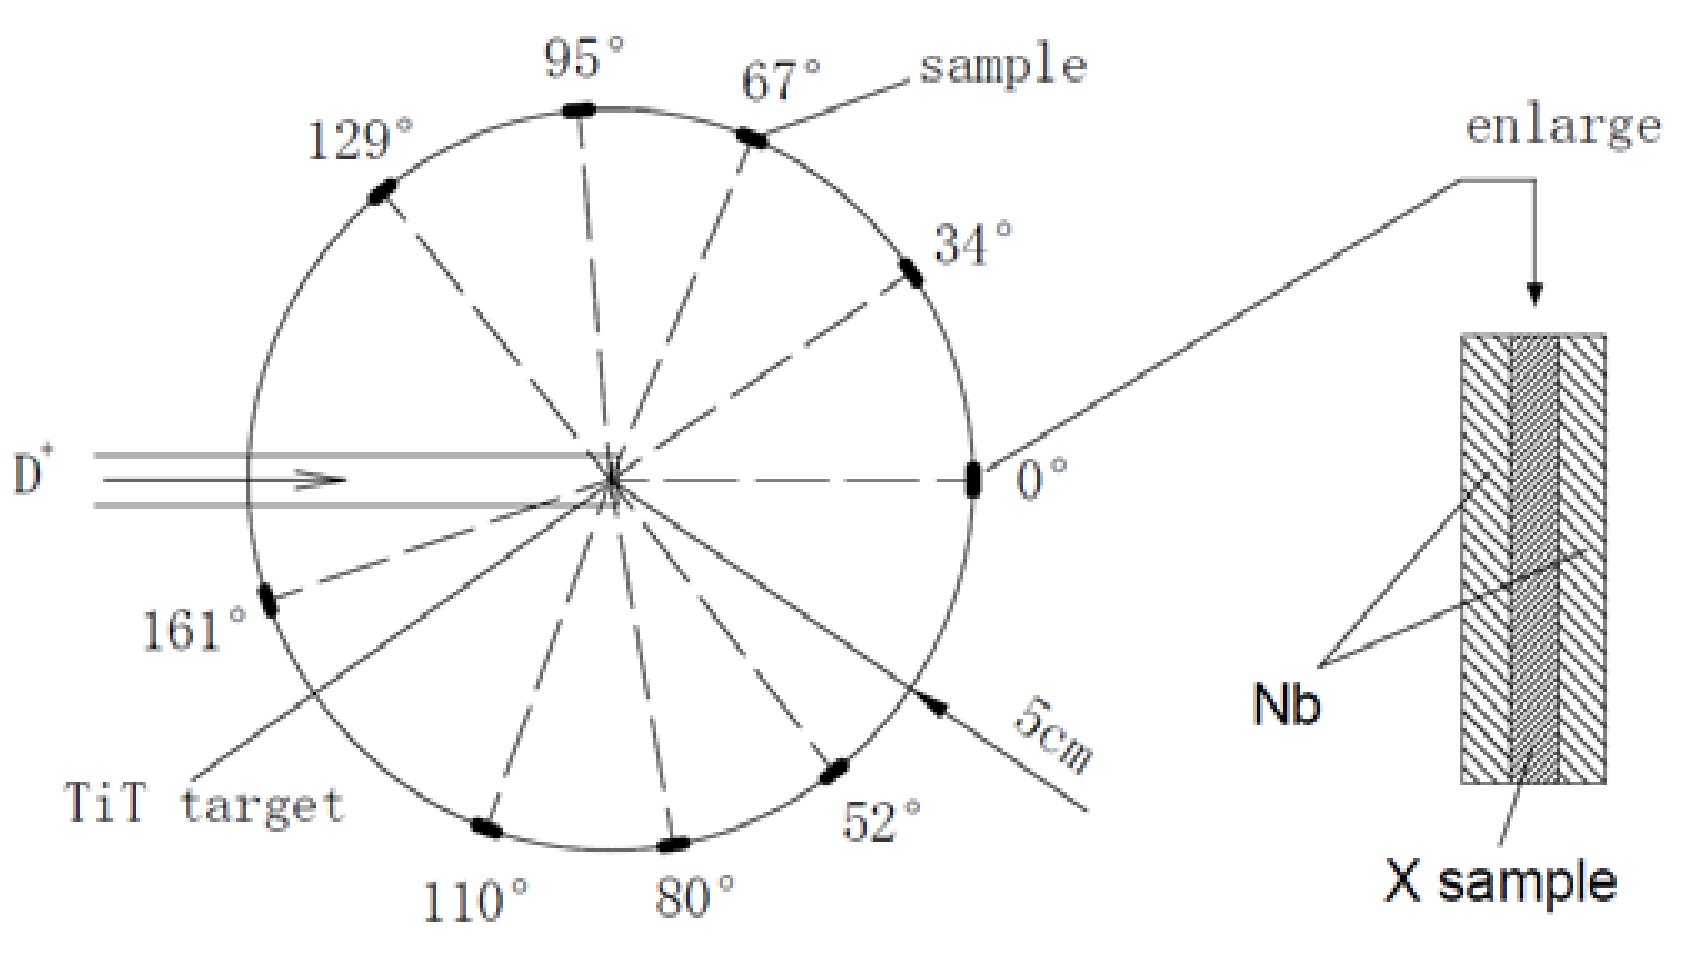
The sample position in the experiment is shown in Fig. 2. Every sample was sandwiched between two niobium foils with a thickness of 0.5 mm. The samples were fixed at locations with angles of 0−161 degrees with respect to the deuteron beam direction, so that simultaneous irradiations could be performed in the range 12−19.8 MeV, and the distance from the TiT target to the samples was 5 cm, where the neutron beam could practically be considered monoenergetic.
After deducting the half-target loss, the induced deuteron particle average energy was calculated at a high accelerator voltage and TiT target thickness. The neutron energy and energy resolution of the 0° direction were calculated using the TARGET program based on the geometry parameters of the target tube in this experiment. The neutron energy-angle distribution for 0°−180° with the 5 cm distance from the TiT target to the samples was provided using the NEUYIE program in the DROSG-200 program package. The calculated neutron energy-angle distribution from 0° to 180° was the same as that in Ref. [17].
The two-ring orientation assembly ensured the samples' precise orientation and reduced the scattering neutron background produced by the assembly's material.
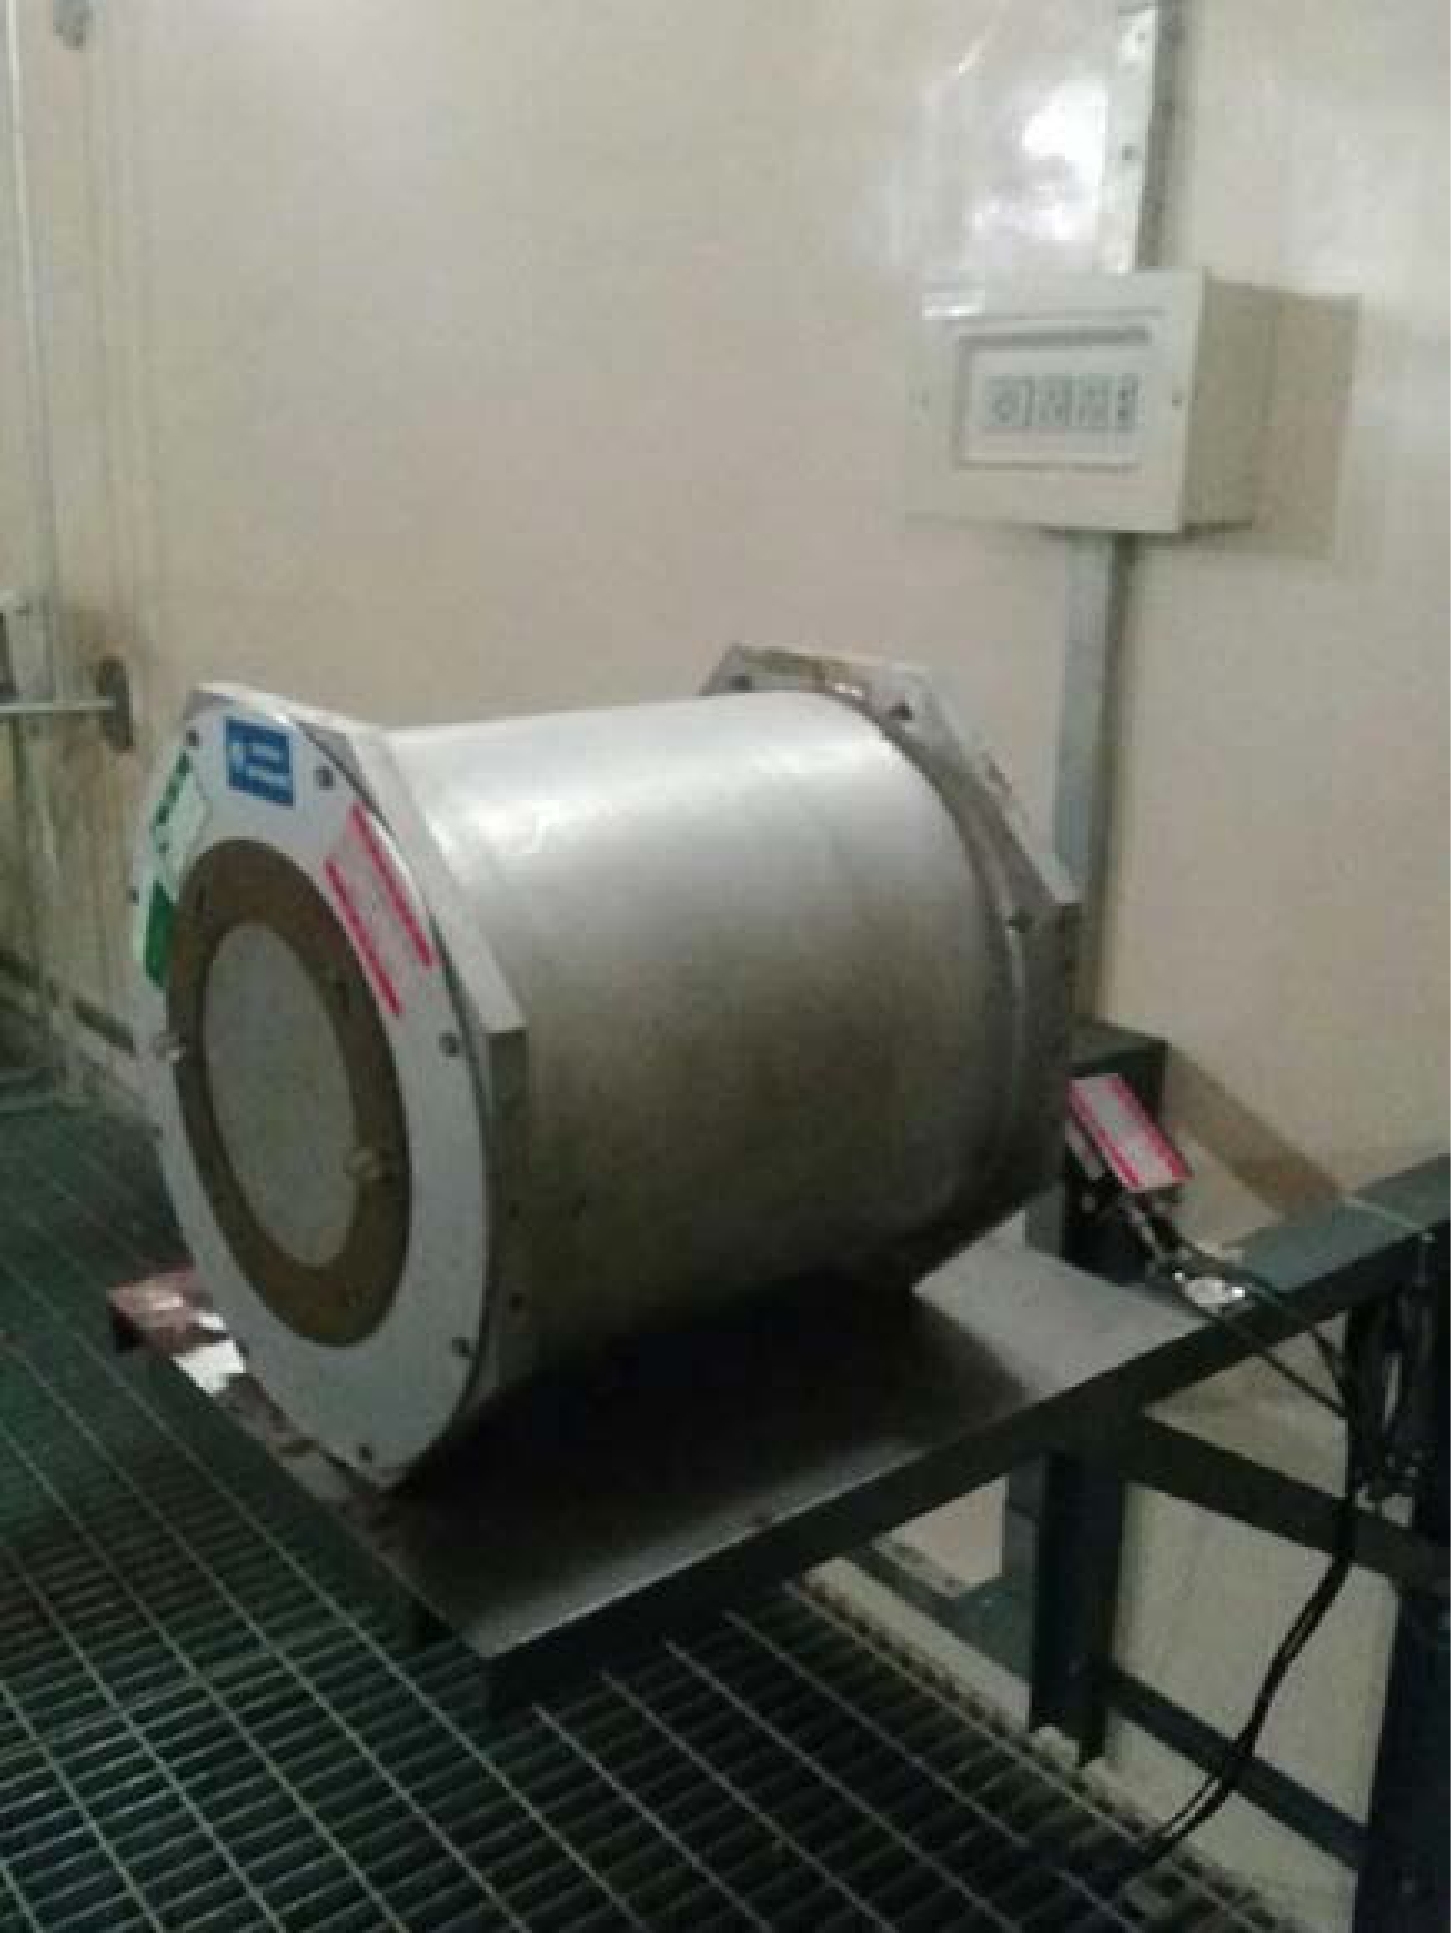
Neutron flux was obtained by monitoring neutrons with the BF3 detector located in the 0 degree direction and at a distance of 4.5 m, as shown in Fig. 3. An electronic block diagram of the neutron flux monitor is shown in Fig. 4. The relative neutron flux data were acquired on-line using the 6612 counter. The neutron irradiation time was 112 h for the 169Tm samples. Irradiation history could be divided into any number of separate parts, each with a relative neutron flux given by the counts. The total neutron flux measured by the 93Nb(n, 2n)92mNb monitor reaction was apportioned into each irradiation step.
-
The samples were procured from the Beijing General Research Institute for Nonferrous Metals. The niobium purity was 99.999%. Table 1 lists the purity, isotopic composition, thickness, and diameter of each sample.
Sample Purity
(%)Isotopic
composition (%)Thickness
/mmDiameter
/mmNiobium 99.999 93Nb 100 0.5 20 Thulium 99.99 169Tm 100 0.5 20 Table 1. Sample characteristics.
-
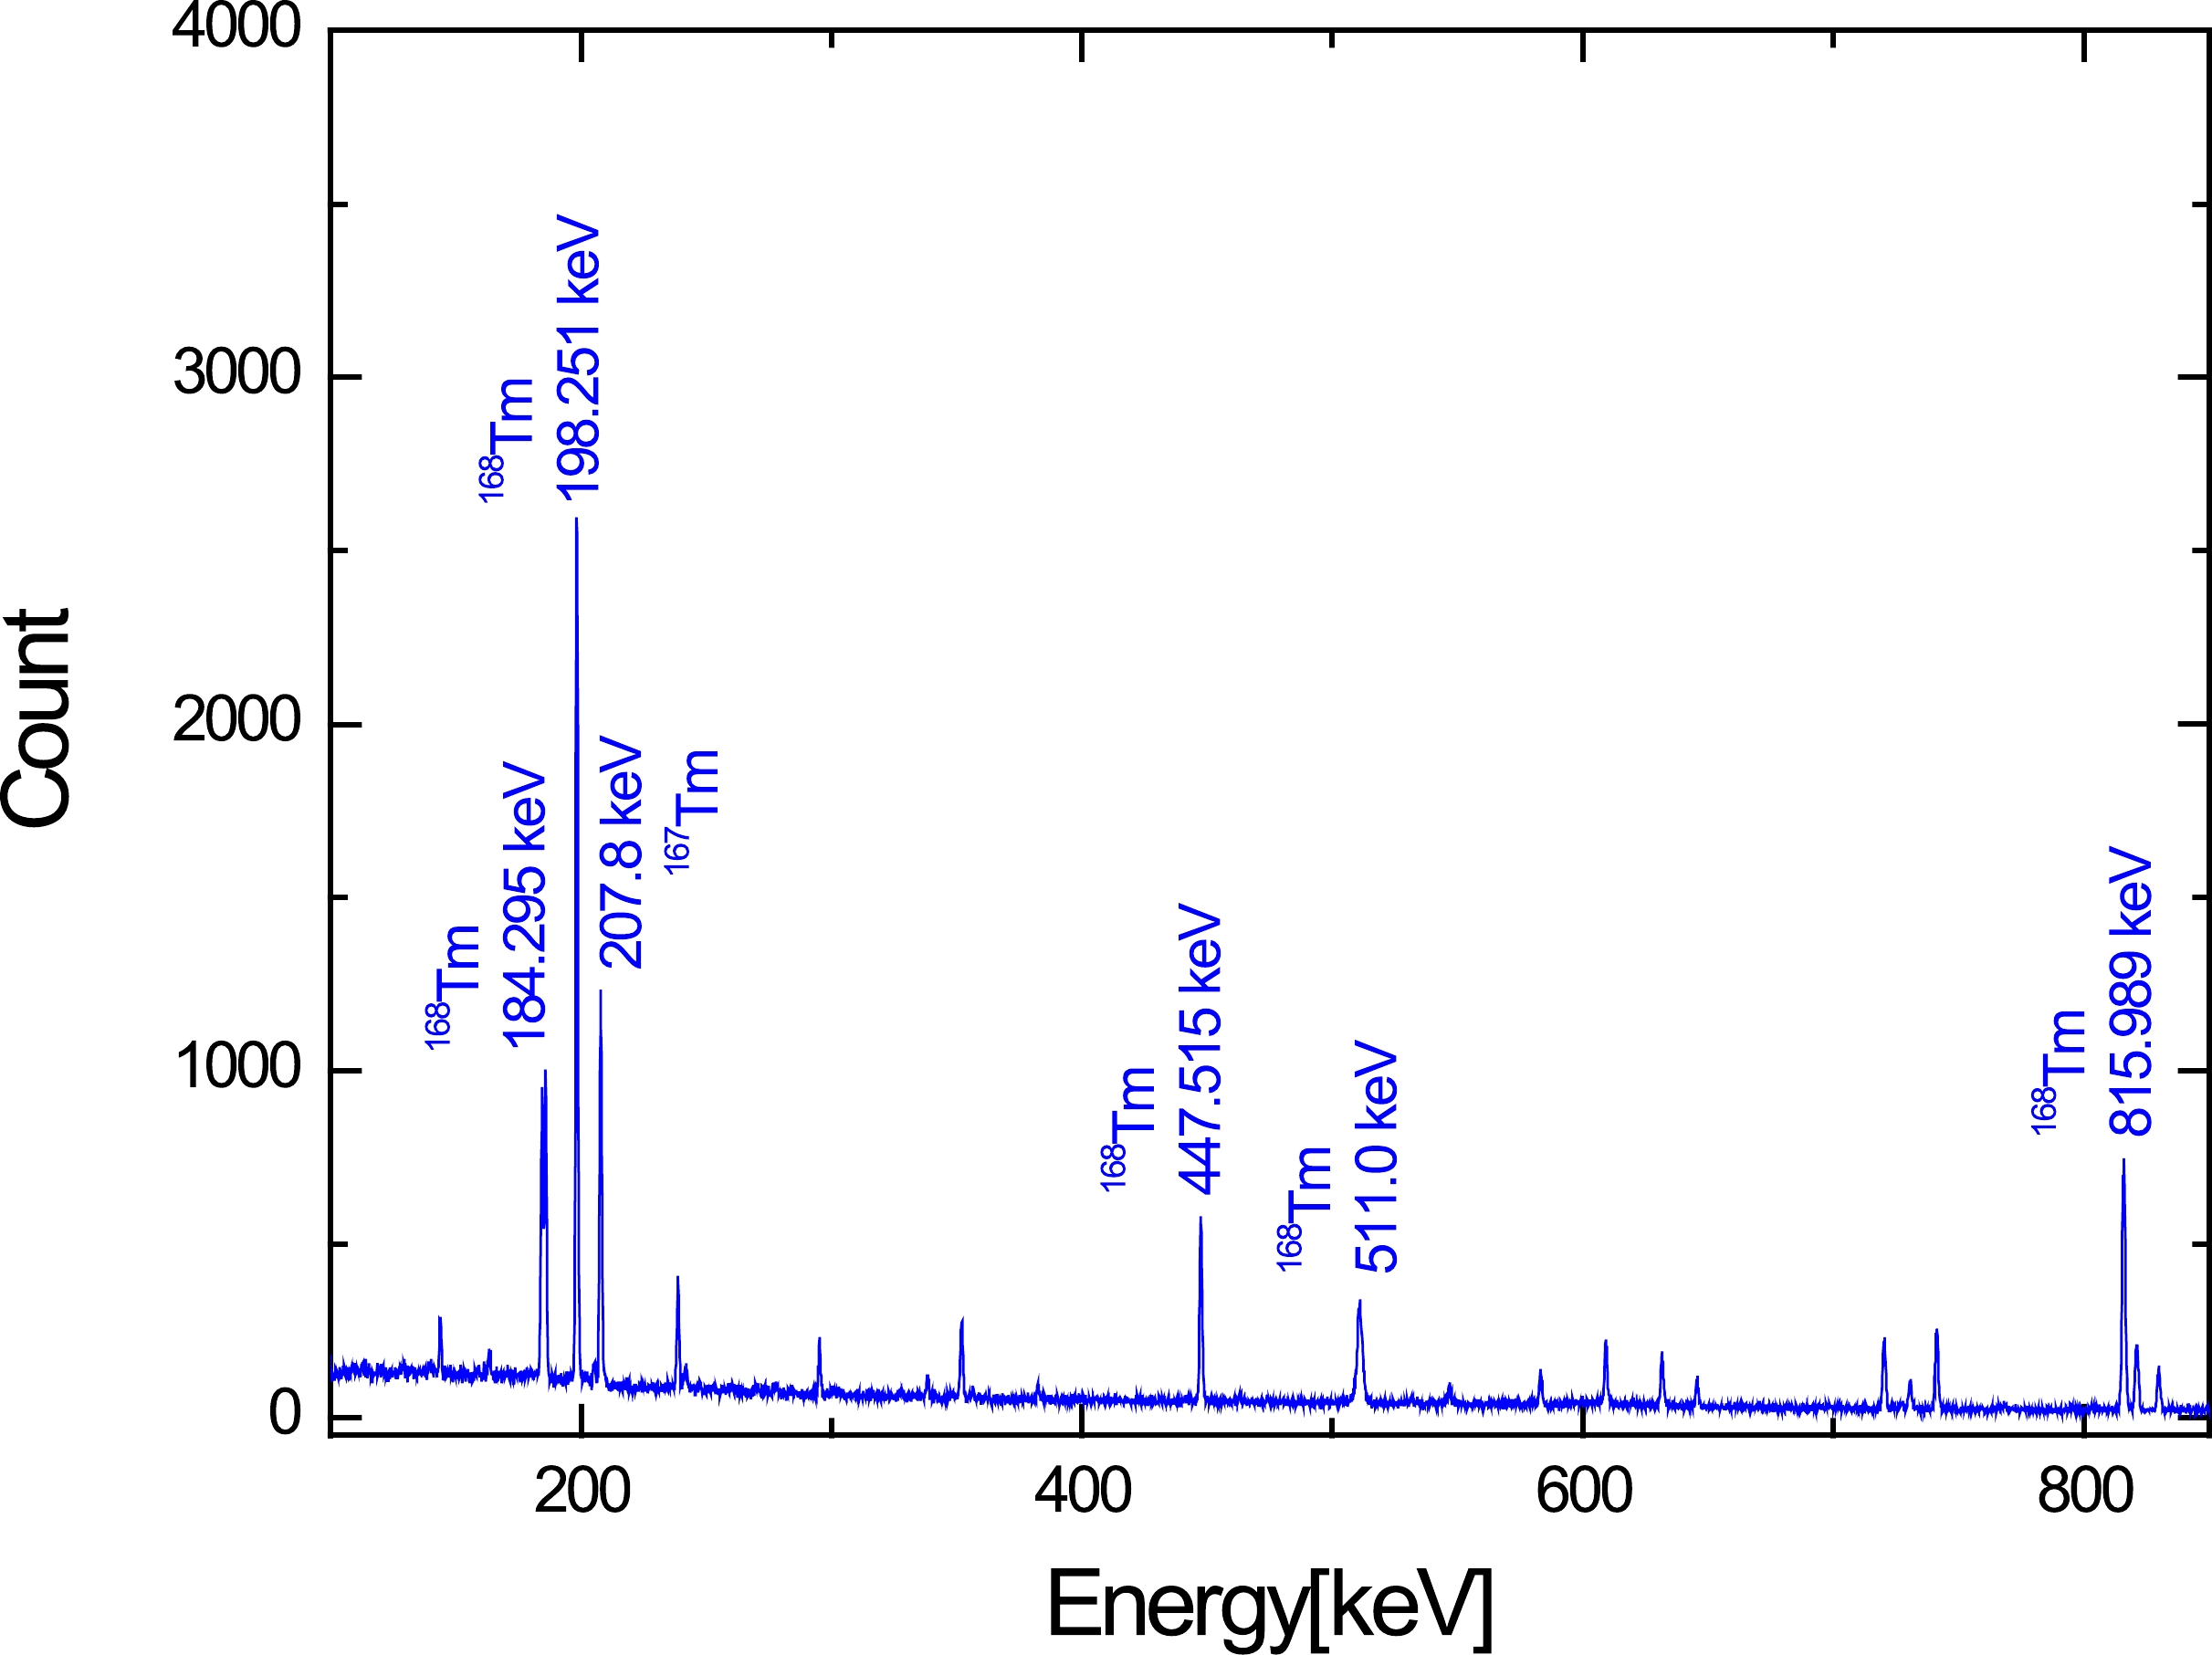
After irradiation, a high resolution Ge detector (type: ORTEC GEM60P) with high efficiency (relative efficiency of 60%) was used to measure the radioactivity of the samples. The details of the radioactivity constants are given in Table 2 and taken from the NuDat database [20]. The efficiency calibration of Ge was performed carefully with a set of standard γ ray surface sources with a diameter of 18 mm, including 152Eu, 166mHo, 241Am, 137Cs, 133Ba, and 60Co, at a distance of 8.2 cm. The thulium sample γ ray is shown in Fig. 5. Corrections were made for self-absorption in the samples.
Nucleus Half-life/d Eγ/keV Iγ (%) 92mNb 10.15 934.44 99.15 168Tm 93.1 198.251 54.49 Table 2. Details of the radioactivity constants used in the analysis of experimental data.
-
The measured cross section is given by
$\begin{aligned}[b] {\sigma _X} =& \frac{{{\lambda _X} \cdot {N_X} \cdot {A_X}}}{{{\lambda _{Nb}} \cdot {N_{Nb}} \cdot {A_{Nb}}}} \cdot \frac{{{W_{Nb}} \cdot {P_{Nb}}}}{{{W_X} \cdot {P_X}}} \cdot \frac{{{\eta _{Nb}} \cdot {f_{sNb}} \cdot {f_{Nb}} \cdot {\varepsilon _{Nb}}}}{{{\eta _X} \cdot {f_{sX}} \cdot {f_X} \cdot {\varepsilon _X}}} \\&\cdot {F_\phi } \cdot \frac{{1 - {{\rm e}^{ - {\lambda _{Nb}} \cdot {t_m}_{Nb}}}}}{{1 - {{\rm e}^{ - {\lambda _X} \cdot {t_m}_X}}}} \cdot {\sigma _{Nb}} , \end{aligned} $

(1) where the subscripts X and Nb denote thulium and niobium, respectively, σ is the cross section, λ is the decay constant of the activity, N is the γ-ray peak counts, A is the atomic weight of the target nucleus, W is the weight of the sample, P is the purity of the sample, η is the abundance of the target nucleus, fs is the γ-ray self-absorption correction factor, f is the branching ratio of the γ-ray, ε is the Ge detector γ-ray efficiency,
$F_{\Phi} $ is the correction factor for the neutron flux fluctuation during irradiation, and tm is the duration of γ-ray counting. The standard cross sections of the 93Nb(n, 2n)92mNb reaction were cited from Ref. [18].It is assumed that induced radioactivities distribute uniformly in a sample. Because the distance between the sample and the detector was approximately 8.2 cm and the thickness of the sample was at most 0.5 mm, the one-dimensional treatment was reasonably accepted. The γ-ray self-absorption correction factor, fs, is given by
$ f_{s}=\frac{1-e^{-\mu}}{\mu t}, $

(2) where t is the sample thickness (mm), and μ is the absorption coefficient (mm–1).
$ F_{\Phi} $ is given by$ F_{\phi}=\frac{\sum_{i=1}^{l} N_{\phi i}-\left(1-{\rm e}^{-\lambda_{Nb} T_{i}}\right) \cdot {\rm e}^{-\lambda_{Nb} t_{i}}}{\sum_{\dot{i}=1}^{l} N_{\phi i}-\left(1-{\rm e}^{-\lambda_{X} T_{i}}\right)-{\rm e}^{-\lambda_{X} t}}, $

(3) where
$N_{\Phi i} $ is the relative neutron number within the ith irradiation time-interval, Ti is the time of the ith time-interval, ti is the cooling time of the ith irradiation, and l is the total number of time bins.The main uncertainty sources were due to the γ-ray detector efficiency, counting statistics, and standard cross section. The efficiency uncertainty of the γ-ray detector was assigned as 2.0%. The statistical uncertainty of γ-rays, depending mainly on activity levels and γ-ray emission probabilities, was approximately 1.0%–1.2%. The uncertainty of the standard reaction cross section, 93Nb(n, 2n)92mNb, was approximately 1.0%–1.6% for the entire energy range from 12.0 to 20.0 MeV. The γ-ray self-absorption correction factor was calculated using the MCNP5 program, and its uncertainty was approximately 0.5%. The component uncertainties in the cross sections are listed in Table 3. This study obtained high-quality data with the minimum uncertainty compared with previous measurements [3−13]. The main reasons behind such a higher precision include: (1) Better efficiency calibration of Ge was performed using a set of standard γ ray surface sources with a diameter of 18 mm, similar to the samples, so that the efficiency uncertainty of the γ-ray detector was 2.0%. (2) A long neutron-irradiation time of up to 112 h and precise irradiation history with a 10 s time interval were used. (3) New data on the radioactivity constants and better standard cross sections of the 93Nb(n, 2n)92mNb reaction in 2010 were adopted.
Items Estimated error
(%)Standard reaction cross section of 93Nb(n, 2n)92mNb 1.0-1.6 Detector efficiency for Nb γ-ray 2 Detector efficiency for Tm γ-ray 2 Statistics of γ-ray counts for γ-ray 1.0-1.2 γ-ray self-absorption correction factor 0.5 Correction factor for the neutron flux fluctuation 1.0 Total 3.4-3.6 Table 3. Uncertainties in the cross section.
-
The unified Hauser-Feshbach and exciton model [19] was employed to calculate the (n, 2n) cross section, which entirely originates from the pre-equilibrium and equilibrium reaction processes. In the model, the parity and angular momentum conservations are obeyed intrinsically in the description of both the equilibrium and pre-equilibrium decay processes. The theoretical model code UNF [19] was used for the calculations. The Koning-Delaroche global nucleon optical potential [21] was applied to calculate the total and nonelastic cross sections, inverse cross sections, and transmission coefficients of the compound-nucleus emission processes. The Pauli exclusion effect and Fermi motion of nucleons were considered in the exciton state densities [22]. The continuum excited states of the compound and residual nuclei are described by the Gilbert-Comeron level density formula [23].
-
The experimental results for the 169Tm(n, 2n)168Tm cross section are given in Table 4. Figure 6 shows the present experimental results along with existing measurements, present calculated result, and evaluated data from ENDF/B-VIII.0, JENDL-4.0, and JEFF-3.3.
Incident Energy/MeV 169Tm (n, 2n)168Tm σ/mb 12.0 1773(62) 13.0 1900(67) 14.0 1937(69) 15.0 1994(71) 16.0 2012(70) 17.0 1834(62) 18.0 1445(48) 19.0 1171(40) 19.8 937(33) Table 4. Measured cross sections.
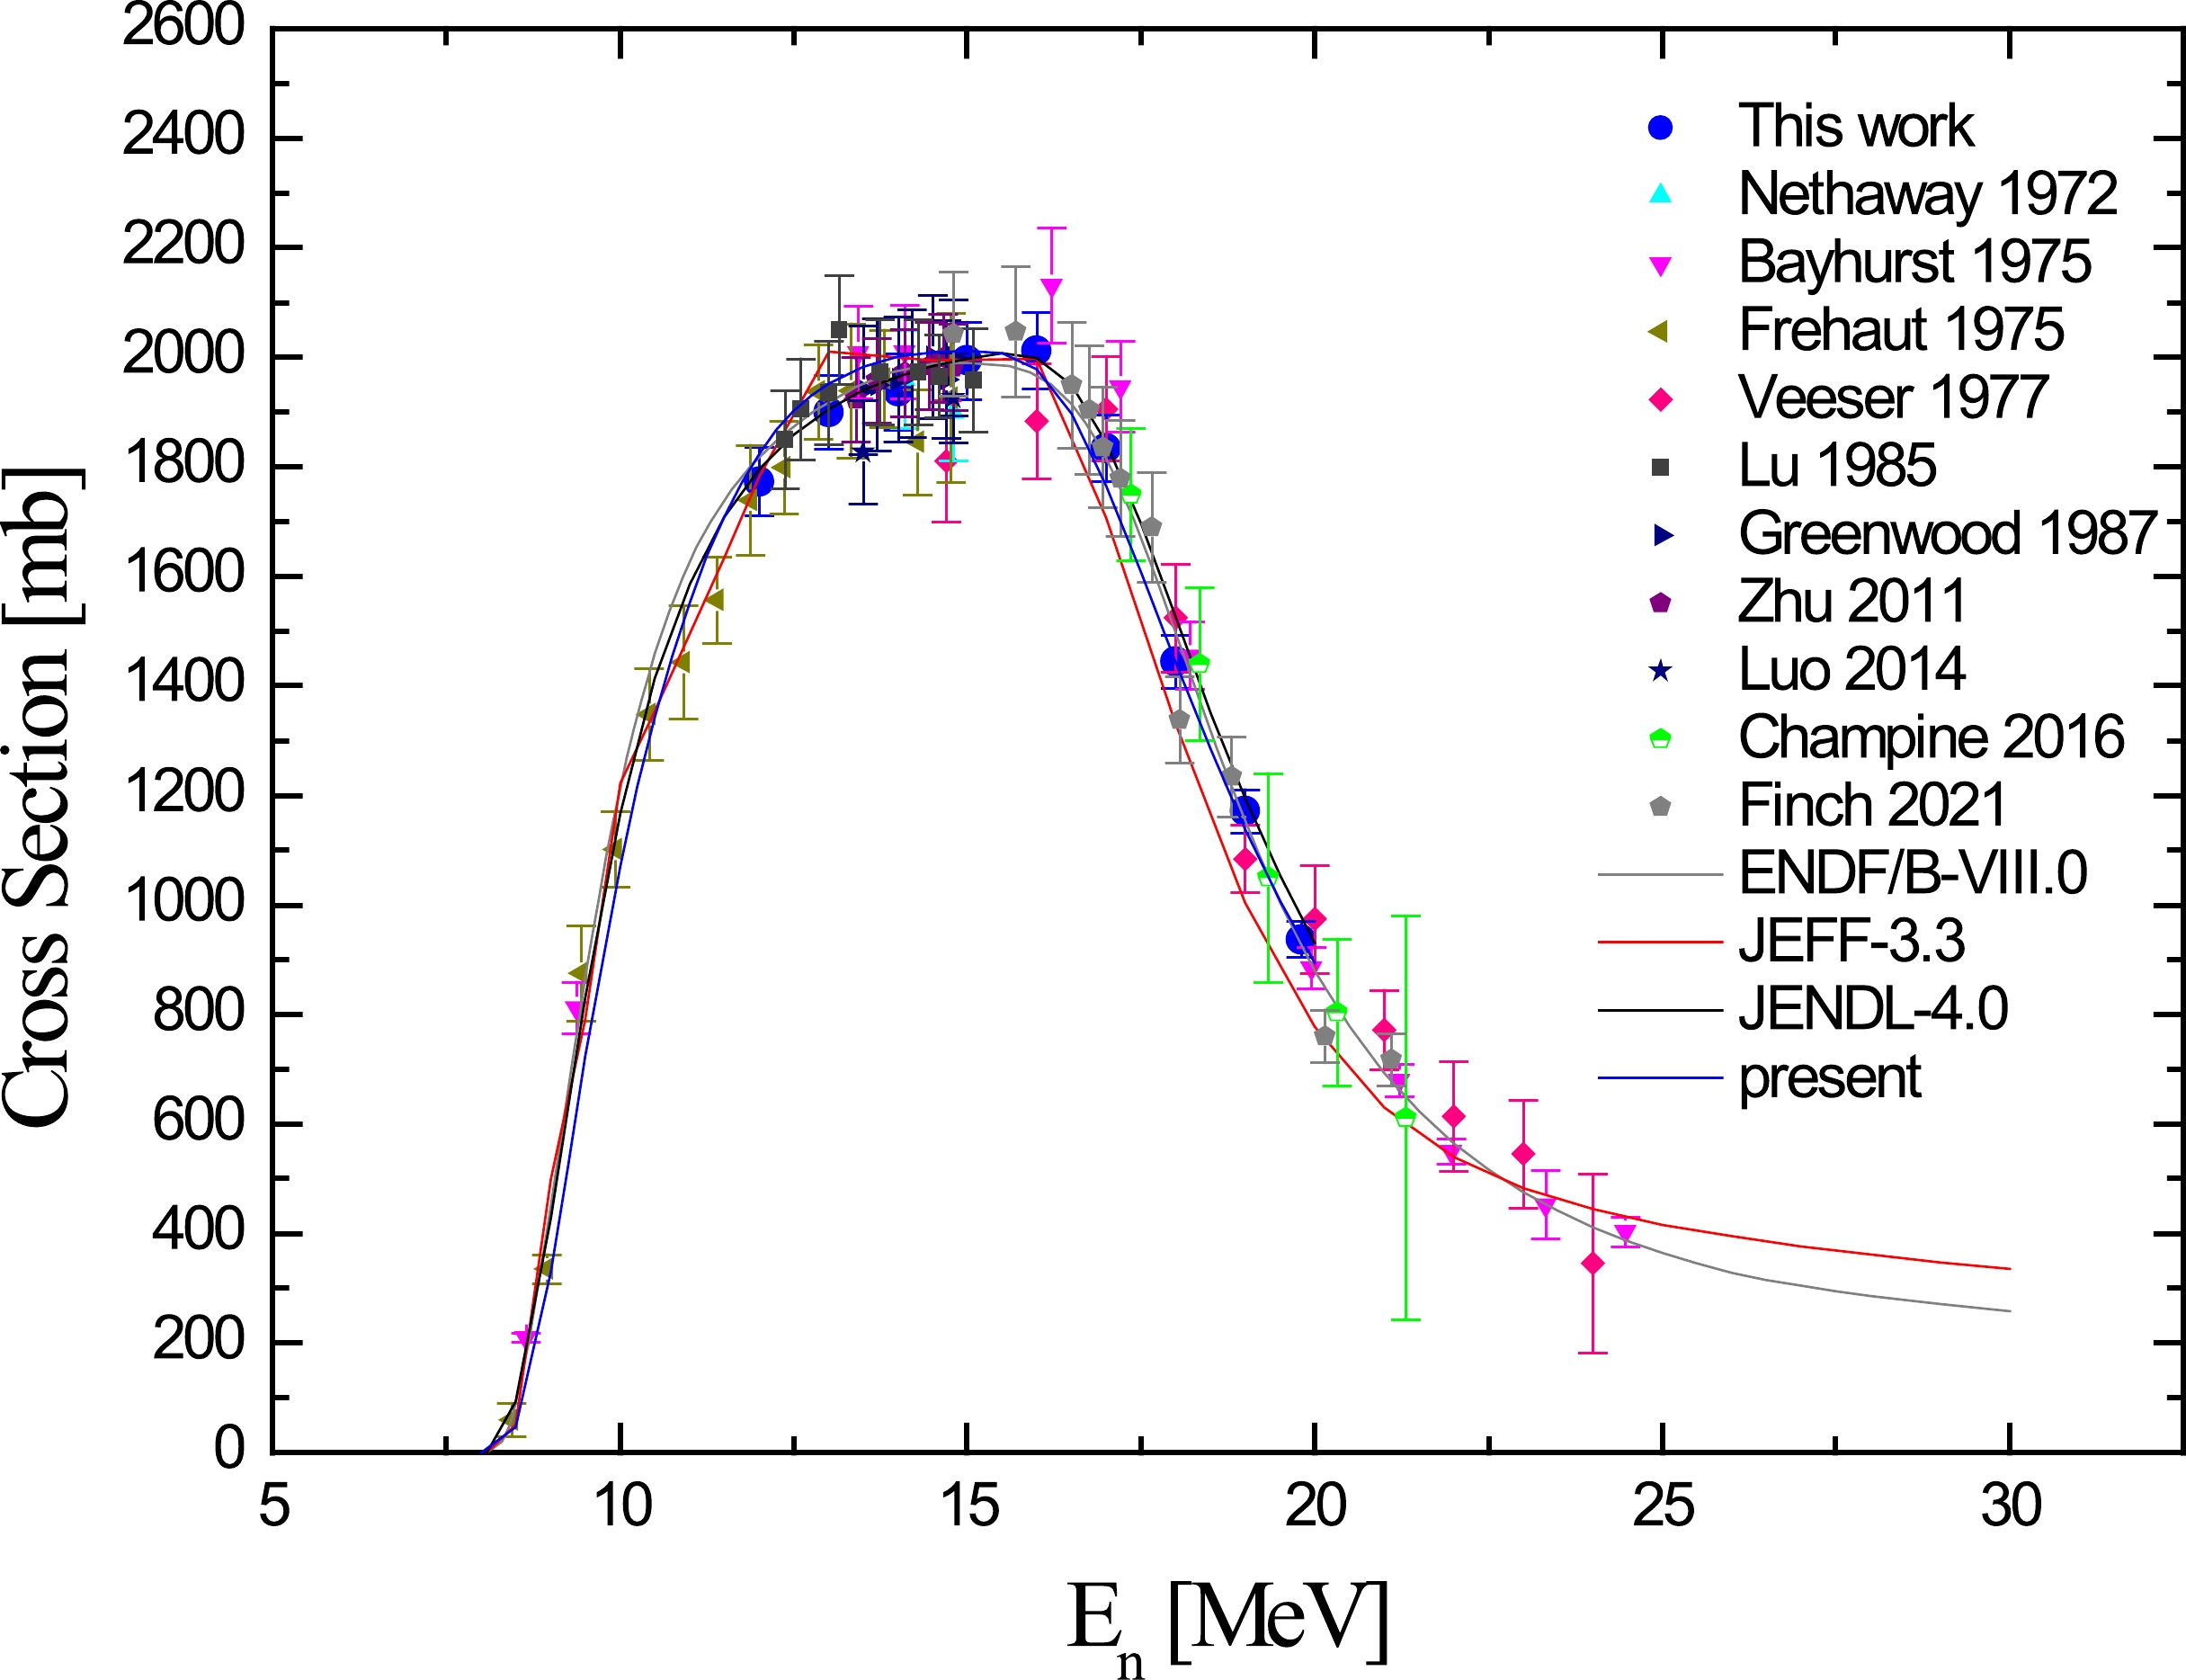
Figure 6. (color online) Present experimental results (blue circles) of the 169Tm(n, 2n)168Tm cross section compared with previous experimental results (symbols), present calculated result (blue line), and evaluated data from ENDF/B-VIII.0 (gray line), JEFF-3.3 (red line), and JENDL-4.0 (black line).
The experimental data given by Nethaway [3], Greenwood et al. [9], Zhu et al. [10], and Champine et al. [12] were in good agreement with the present results, as shown in Fig. 6. The present data gave a peak around 16 MeV. The experimental data from Bayhurst et al. [4] were approximately 6% higher than the present ones between 16 and 17 MeV and were in agreement with the present data from 19 to 20 MeV. The experimental data from Frehaut et al. [5] were approximately 5% lower than the present ones between 14 and 15 MeV and were in good agreement with the present results from 12 to 13 MeV. The experimental data measured by Veeser et al. [6] were approximately 6%−9% lower than the present ones between 15 and 16 MeV and were in agreement with the present results from 17 to 20 MeV within the uncertainty. The experimental data from Lu et al. [8] were approximately 6% higher than the present ones at 13 MeV and were in good agreement with the present results from 14 to 18 MeV. The experimental data from Luo [11] were approximately 5% lower than the present ones between 13 and 15 MeV, and the experimental data from Finch et al. [13] were approximately 7% lower than the present ones near 18 MeV and 20 MeV.
Good agreements were observed between the ENDF/B-VIII.0, JENDL-4.0, and present experimental data from 12 to 20 MeV. The evaluated data from JEFF-3.3 were larger than the present data by 6% at 13 MeV and lower than the present data by 7%−17% at energies of 17−20 MeV. The present calculated result was in good agreement with the present experimental data and was consistent with the evaluated data from ENDF/B-VIII.0 and JENDL-4.0.
-
Cross sections of the 169Tm(n, 2n)168Tm reaction were measured at incident energies of 12 to 19.8 MeV using the activation technique relative to the 93Nb(n, 2n)92mNb reaction. Model calculations were then performed with the UNF code.
The present experimental data had the lowest uncertainty compared with those of previous measurements. The new data were consistent with some previous experimental data and were in good agreement with the ENDF/B-VIII.0 and JENDL-4.0 data in the measured energy region of this study. The present calculated result was in good agreement with the present experimental data and was consistent with the evaluated data from ENDF/B-VIII.0 and JENDL-4.0. The present experimental data are given in a wide energy region of 12.0−19.8 MeV with low uncertainty, which simultaneously includes the rising part, peak, and falling part of the reaction cross section; therefore, they are useful for future improvement of nuclear data evaluation.
-
We owe thanks to the accelerator staff at the 5SDH-2 1.7MV Tandem accelerator.
Measurement of 169Tm(n, 2n)168Tm reaction cross sections from 12 to 19.8 MeV
- Received Date: 2023-07-27
- Available Online: 2023-11-15
Abstract: The cross sections of the 169Tm(n, 2n)168Tm reaction have been measured at incident energies of 12 to 19.8 MeV using the activation technique, relative to the 93Nb(n, 2n)92mNb reaction. Thulium (Tm) samples were irradiated on the surface of a two-ring orientation assembly with neutrons produced from the 3H(d, n)4He reaction at the 5SDH-2 1.7-MV Tandem accelerator in China. Theoretical model calculations were performed. The present data were then compared with previous experimental data and available evaluated data. This study provides more precise nuclear data for improvement of future evaluations.


 Abstract
 HTML
HTML Reference
 Related
 PDF
PDF





 DownLoad: