


 Abstract
 HTML
HTML Reference
 Related
 PDF
PDF


-
Since the discovery of nuclear fission and the release of substantial energy during this process, extensive efforts have been dedicated to investigating the characteristics and energy distribution of nuclear fission. Among these, fission product yields stand out as a prominent feature of the fission process, exhibiting strong dependence on the fissile material, excitation energy, and angular momentum of the compound system. However, a consistent and systematic study of the energy dependence of fission product yields is challenging. Reference data on fission product yields of major actinides are indispensable for nuclear research and various industrial applications. In particular, these data are crucial for evaluating fission energy, burnup rate, and neutron flux, as well as for ensuring safe applications. Notably, fission product yields are utilized to gauge the extent of fission in uranium and plutonium samples irradiated by neutrons. The nuclear science community is particularly interested in these fission product yields owing to their significant role in determining the fission burnup, specifically in relation with fast reactor technology. In laboratory experiments for measuring fission products, 99Mo serves as a reference nuclide, with other fission product data being determined through measurement of their ratios with respect to this nuclide. In this study, we thoroughly investigated the fission product data of 99Mo measured at certain laboratories for both thermal neutron and fission spectra, along with other important fission product data such as 95Zr, 140Ba, 144Ce, and 147Nd, obtained through ratio measurements with 99Mo fission product data.
In light of the significance of fission yield data for reactor design and understanding of fission phenomena, a great deal of studies published before the 1990s has been summarized in some compilations [1−4]. These nuclear data compilations serve as valuable references for comprehending fission phenomena and designing reactors, holding substantial importance for the advancement of the nuclear field. In 2010 and 2011, the Nuclear Data Sheet published detailed papers in which measurement results from American national laboratories and other laboratories were reported, offering a wealth of fission product yield data for the nuclear community [5−8]. Los Alamos National Laboratory (LANL), Lawrence Livermore National Laboratory (LLNL), and the Triangle Universities Nuclear Laboratory (TUNL) collaborated on measuring fission product yields of 235U, 238U, and 239Pu induced by monoenergetic neutrons at 0.58, 1.37, 2.37, 3.6, 4.5, 5.5, 8.9, and 14.8 MeV, while also investigating the energy dependence of fission product yields [9]. Nonetheless, it is important to stress that fission product yields measured in different laboratories may exhibit variations.
Fission is a large-scale and complex collective movement composed of hundreds of nuclei. The study of its underlying mechanism is notably challenging. When the compound nucleus breaks, the collective energy may be transferred to nuclear excitation or movement of fragments. The average total kinetic energy (
$\rm\overline {TKE} $ ) represents the sum of kinetic energy of a pair of fission fragments and serves as crucial nuclear data for determining the energy output in nuclear technology applications. The TKE of fission fragments carries away most of the collective energy in the compound nucleus, approximately 170 MeV for uranium isotopes [10]; this depends on the magnitude of the Coulomb force between new fragments at the time of fracture.In the process of neutron-induced fission, understanding the variation of TKE with increasing neutron energy can enhance our comprehension of these intricate phenomena. According to the Bohr's compound-nucleus model [11], the decay characteristics of compound nucleus in the process of nuclear fission are solely related to its physical properties. Therefore, the average total kinetic energy release of fission fragments naturally correlates with the incident neutron energy in the process of neutron-induced fission. In [12], for the first time, the total prompt energy release for the fission of 235U, 238U, and 239Pu was studied as a function of the kinetic energy of neutron-induced fission. The dependence of the average total kinetic energy of fission fragments on the incident neutron energy serves as a significant parameter for simulating neutron-induced fission, particularly in relation with the redistribution of energy released in fission among different separation systems [13].
In this study, we focused on the neutron-induced fission yields of 235U and analyzed the differences in fission product yields measured in different laboratories. Additionally, we introduced the excitation function of the total kinetic energy of fission fragments recommended by Madland et al. to investigate the kinetic energy distribution of fission fragments.
-
The multi-mode random neck rupture model proposed by Brosa et al. [14] enabled substantial progress in the study of post-fission phenomena, giving rise to promising new theoretical avenues that were the subject of a workshop held at the University of York in October 2019. Related literature [15] summarized findings and recommendations from this workshop. Generally speaking, the three most important fission modes for actinides are ultra-long deformation (SL), standard I (SI), and standard II (SII). Each fission mode corresponds to different fission paths and pre-rupture shapes on the potential energy surface; these different paths experience distinct fission barriers. The height of these barriers determines the fission probability of nuclear deformation along each channel. Among them, the SL mode corresponds to symmetrical fission, showing a symmetrical yield distribution, and the fragments have low total kinetic energy and strong deformation at the breakpoint. The SI and SII modes correspond to asymmetric fission, showing asymmetric mass distribution, and the fragments have higher total kinetic energy, being that of the SI mode higher than that of the SII mode. The SI mode is considered to be composed of a spherical heavy fragment near the double magic nucleus 132Sn and a moderately deformed light fragment. The SII model consists of a moderately deformed heavy fragment and a moderately deformed light fragment. The SL mode is related to the macroscopic liquid-drop model, whereas the SI and SII modes are related to the shell effect of heavy fragments.
According to the characteristics of mass distribution of primary fission fragments of actinides induced by neutrons, a Potential-driving Model is used to calculate the mass distribution function of fission fragments before neutron emission. According to the dinuclear system (DNS) theoretical model [16, 17], the fission driving potential of the compound-nucleus at the fracture point can be expressed as
$ D = Q + {B_0}. $

(1) Here,
${B_0}$ represents the Coulomb barrier height in the interaction potential of two fission fragments [18] and$Q$ is the reaction energy.The fission driving potential of the compound-nucleus at the breakpoint can also be expressed as the sum of the nucleon-nucleon symmetric and asymmetric fission potentials. This sum is expressed as
$ \begin{aligned}[b] D =\;& {U_{\rm sym}}({A_f}) + {U_{\rm asym}}({A_f}) = D({A_{\rm sym}}) \cdot \exp \left[ - \frac{{{{({A_f} - {A_{\rm sym}})}^2}}}{{2\sigma _{\rm sym}^2}}\right] \\ &+ \sum {_i} {\eta _i} \cdot D({A_{\rm asym,i}}) \cdot \exp \left[ - \frac{{{{({A_f} - {A_{{\rm asym},i}})}^2}}}{{2\sigma _{\rm asym,i}^2}}\right] . \end{aligned} $

(2) Here,
${U_{\rm sym}}({A_f})$ and${U_{\rm asym}}({A_f})$ represent symmetric and asymmetric fission potentials, respectively; the variable$ {A_f} $ represents the mass number of primary fission fragments;$D({A_{\rm sym}})$ and$D({A_{{\rm asym},i}})$ represent the fission driving potential corresponding to the primary fission fragments with mass numbers${A_{\rm sym}}$ and${A_{{\rm asym},i}}$ respectively; and$ i $ represents different asymmetric fission modes.The distribution of driving potential determines the mass distribution of fission fragments. According to the characteristics of the mass distribution of fission fragments, this distribution before neutron emission can be expressed as
$\begin{aligned}[b] F({A_f}) =\;& C \times \left[ \frac{{{Y_{\rm sym}}{U_{\rm sym}}({A_f})}}{{T({A_{\rm CN}})}} + \frac{{{Y_{\rm asym1}}{U_{\rm asym1}}({A_f})}}{{T({A_{\rm CN}})}} \right.\\&\left.+ \frac{{{Y_{\rm asym2}}{U_{\rm asym2}}({A_f})}}{{T({A_{\rm CN}})}} \right],\end{aligned} $

(3) where
$ C $ represents a normalized constant;${A_{\rm CN}}$ is the mass number of the compound-nucleus;$T({A_{\rm CN}})$ represents the temperature of the compound-nucleus, which corresponds to the excitation energy of the compound-nucleus; and${Y_{\rm sym}}$ and${Y}_{\rm asym\text{1},\text{2}}$ represent the contributions of symmetric and asymmetric fissions.The asymmetric fission potential of the SI and SII modes is expressed as
$ \begin{aligned}[b]{U_{\rm asym2}}({A_f}) =\;& D({A_{\rm asym2}}) \left(\exp \left[ { - \frac{{{{({A_f} - {A_{\rm asym2}})}^2}}}{{2\sigma _{\rm asym2}^2}}} \right] \right.\\&\left.+ \exp \left[ { - \frac{{{{({A_f} - ({A_{\rm CN}} - {A_{\rm asym2}}))}^2}}}{{2\sigma _{\rm asym2}^2}}} \right]\right), \end{aligned}$

(4) $\begin{aligned}[b] {U_{\rm asym{\text{1}}}}({A_f}) =\;& D({A_{\rm asym{\text{1}}}}) \times \left(\exp \left[ { - \frac{{{{({A_f} - {A_{\rm asym{\text{1}}}})}^2}}}{{2\sigma _{\rm asym{\text{1}}}^2}}} \right] \right.\\&\left.+ \exp \left[ { - \frac{{{{({A_f} - ({A_{\rm CN}} - {A_{\rm asym{\text{1}}}}))}^2}}}{{2\sigma _{\rm asym{\text{1}}}^2}}} \right]\right).\end{aligned} $

(5) Here,
${A_{\rm asym1}}$ ,${A_{\rm asym{\text{2}}}}$ , and$({A_{\rm CN}} - {A_{\rm asym1}})$ ,$({A_{\rm CN}} - {A_{\rm asym2}})$ represent the number of fragments corresponding to the asymmetric fission peaks of the SI and SII modes;${A_{\rm asym{\text{1}}}}{\text{ = 135 + }}\sum {\dfrac{{\sigma (n,xnf)}}{{\sigma (n,fission)}}} \cdot \dfrac{x}{2}$ , including not only fission fragments with$ A{\text{ = 132}} $ but also the mass of prompt and evaporated neutrons that have not been emitted. There is an evident dent in the driving potential near${A_{\rm asym{\text{2}}}} \approx 140$ , which indicates that the compound-nucleus corresponding to this mass fragment is stable, and the probability of generating this fission fragment is greater. According to the systematic model,${\sigma _{\rm asym{\text{1}}}}$ ,${\sigma _{\rm asym2}}$ can be expressed as$ {\sigma _{\rm asym{\text{1}}}}{\text{ = 3}}{\text{.089 + 0}}{\text{.06252}} \times {E_n}, $

(6) $ {\sigma _{\rm asym{\text{2}}}} = 0.432Z + 0.065A - 47.6 - 1.95 \times \exp ( - 0.1386{E_n}). $

(7) The symmetric fission potential of the SL mode is expressed as
$ {U_{\rm sym}}({A_f}) = D({A_{\rm sym}}) \times \exp \left[ { - \frac{{{{({A_f} - {A_{\rm sym}})}^2}}}{{2\sigma _{\rm sym}^2}}} \right], $

(8) where
${A_{\rm sym}}{\text{ = }}\dfrac{{{A_{\rm CN}}}}{2}$ is the mass number of fission fragment corresponding to the nucleon-nucleon symmetric fission peak position. According to both the systematic and evaporation neutron models, the expression of${\sigma _{\rm sym}}$ is constructed as$ {\sigma _{\rm sym}}{\text{ = }} \left\{ \begin{gathered} \exp (0.006{E_n} + 2.35) \\ \exp [0.006{E_n} + 2.35 - 0.25 \times (xn - 3)] \\ \end{gathered} \right.\begin{array}{*{20}{c}} {xn = 0,1,2,3} \\ {xn \geqslant 4} \end{array}. $

(9) ${Y_{\rm sym}}$ ,${Y_{\rm asym{\text{1}}}}$ , and${Y_{\rm asym{\text{2}}}}$ represent the maximum probability of each fission mode at the breakpoint, which is defined by the probability of overcoming the corresponding fission barrier:$ {Y_i} = \frac{{{{\rm e}^{(\frac{{E_i^ * }}{{{T_h}}} - \frac{{E_i^ * }}{{0.4}})}}}}{{1 + {{\rm e}^{( - \frac{{E_i^ * }}{{{T_h} \cdot {T_l}/({T_h} - {T_l})}})}}}}. $

(10) Here,
$ E_i^ * $ is the energy of the compound-nucleus relative to the barrier, which is equal to the initial excitation energy${E}_{\rm CN}^{\ast }({E}_{\rm CN}^{\ast }={E}_{n}+Q)$ of the compound-nucleus minus the height$ {B_{fi}} $ of the outer barrier [19]; En is the neutron kinetic energy; and Q is the reaction energy, which is approximately the binding energy of the last neutron of the compound-nucleus; thus, we have that$ E_i^ * = E_{\rm CN}^ * - {B_{fi}}. $

(11) $ {T_l} $ is the temperature parameter related to the tunnel effect; its value is 0.31. The temperature parameter$ {T_h} $ is related to the mass number${A_{\rm CN}}$ of the compound-nucleus and shell correction$ \delta {U_i} $ . When the energy is lower than the external barrier, the tunnel effect should be considered [20]. Thus, we have that$ {T_h}{\text{ = }}\frac{{{A^{ - 2/3}}}}{{0.057 + 0.00193 \cdot \delta {U_i}}} .$

(12) With the increase of neutron energy, the excitation energy of the compound-nucleus increases, and some neutrons may evaporate first before fission occurs. The reaction channels are expressed as (n,f), (n,nf), (n,2nf), (n,3nf), and (n,4nf). To calculate the fission probability, the excitation energy can be expressed as
$ {E^ * }(n,xnf) = {E^ * }(n,f) - x \cdot ({B_n} + \overline \varepsilon ), $

(13) $ \overline \varepsilon {\text{ = }}\frac{{\text{3}}}{{{\text{2}}T}} = \frac{3}{2}\sqrt {{E^ * }/a}, $

(14) $ {Y_i} = {W_j}{Y_{(n,xnf)}}. $

(15) Here,
$a$ represents the energy level density parameter and$ {\text{ - }}{B_n} $ represents the separation energy of a neutron emitted by the compound-nucleus before the breakpoint. According to statistical mechanics,$ \overline \varepsilon $ can be expressed as a function of the temperature, indicating the average kinetic energy of a neutron emitted by a compound-nucleus [21].$ {W_j} $ is the weight of each fission channel.In addition, the influence of evaporated neutrons on the number of fragments corresponding to the peak position should be considered. According to different (n, xnf) reactions, the peak positions of nucleon-nucleon symmetric and asymmetric fissions are changed accordingly,
$ {A_{\rm sym}} = {A_{\rm sym}} - \frac{{\overline V }}{2}, $

(16) $ {A_{\rm asym1}} = {A_{\rm asym1}} - \frac{{\overline V }}{2}, $

(17) $ ({A_{\rm CN}} - {A_{\rm asym2}}) = ({A_{\rm CN}} - {A_{\rm asym2}}) - \frac{{\overline V }}{2}, $

(18) $ {A_{\rm asym{\text{2}}}} = {A_{\rm asym{\text{2}}}} - \frac{{\overline V }}{2}, $

(19) $ ({A_{\rm CN}} - {A_{\rm asym1}}) = ({A_{\rm CN}} - {A_{\rm asym1}}) - \frac{{\overline V }}{2}, $

(20) $ \overline V $ represents the average number of evaporated neutrons. For the case of binary fission deformation, the total yield of fission fragments is 200%, and$ C $ is expressed as$ C = \frac{{200{\text{%}} }}{{\displaystyle\int_0^A {\left[ {{Y_{\rm sym}}{U_{sym}}\left( {{A_f}} \right) + {Y_{\rm asym1}}{U_{\rm asym1}}\left( {{A_f}} \right) + {Y_{\rm asym2}}{U_{\rm asym2}}\left( {{A_f}} \right)} \right] \cdot {\rm d}{A_f}} }} . $ 
(21) The GEF model [19] considers a large number of physical laws and empirical formulas related to fission, and the parameters introduced in the model are obtained by fitting a large number of experimental data in nuclear and energy regions. Thus, the fission probability of induced or spontaneous fission, distribution of various fragments, yield of instantaneous neutrons and γ, etc. can be calculated for almost all fission systems with charge numbers ranging from Z = 80 to Z = 112 when the excitation energy is below 100 MeV. Most of the results calculated in this manner are in good agreement with experimental data [22−27].
Geant4 [28−30] is a Monte Carlo program based on C++ language that contains a large number of physical processes. One of them is the mass distribution of primary fission fragments in fission reaction, which can be described by the equation
$ F({A_{{\text{pre}}}}) = {F_{\rm sym}}({A_{{\text{pre}}}}) + \omega \cdot {F_{\rm asym}}({A_{{\text{pre}}}}), $

(22) where
$ {A_{{\text{pre}}}} $ is the mass number of primary fission fragments, and the subscript pre denotes primary fission fragments;${F_{\rm sym}}({A_{{\text{pre}}}})$ and${F_{\rm asym}}({A_{{\text{pre}}}})$ are symmetric and asymmetric fission mass distributions, respectively. The parameter$ \omega $ is a weight that reflects the relative contribution of asymmetric and symmetric fission distributions. See [31] for specific expressions of physical quantities in the Geant4 program.Based on the Potential-driving Model, we calculated the independent yield of the neutron-induced 235U(n, f) reaction, including the charge and mass distributions, as well as the cumulative yield of some important fission products. To assess the variance between the data calculated by the Potential-driving Model, G4ParaFission Model, and evaluation data, we calculated the
${\chi ^2}$ values as$ {\chi ^2} = \frac{1}{N}\sum\nolimits_i {\frac{{{{(Y - {Y_i})}^2}}}{{{\sigma _i}}}}, $

(23) where
$Y,{Y_i}$ are calculated and experimental values, respectively;${\sigma _i}$ is the uncertainty; and N is the number of data. -
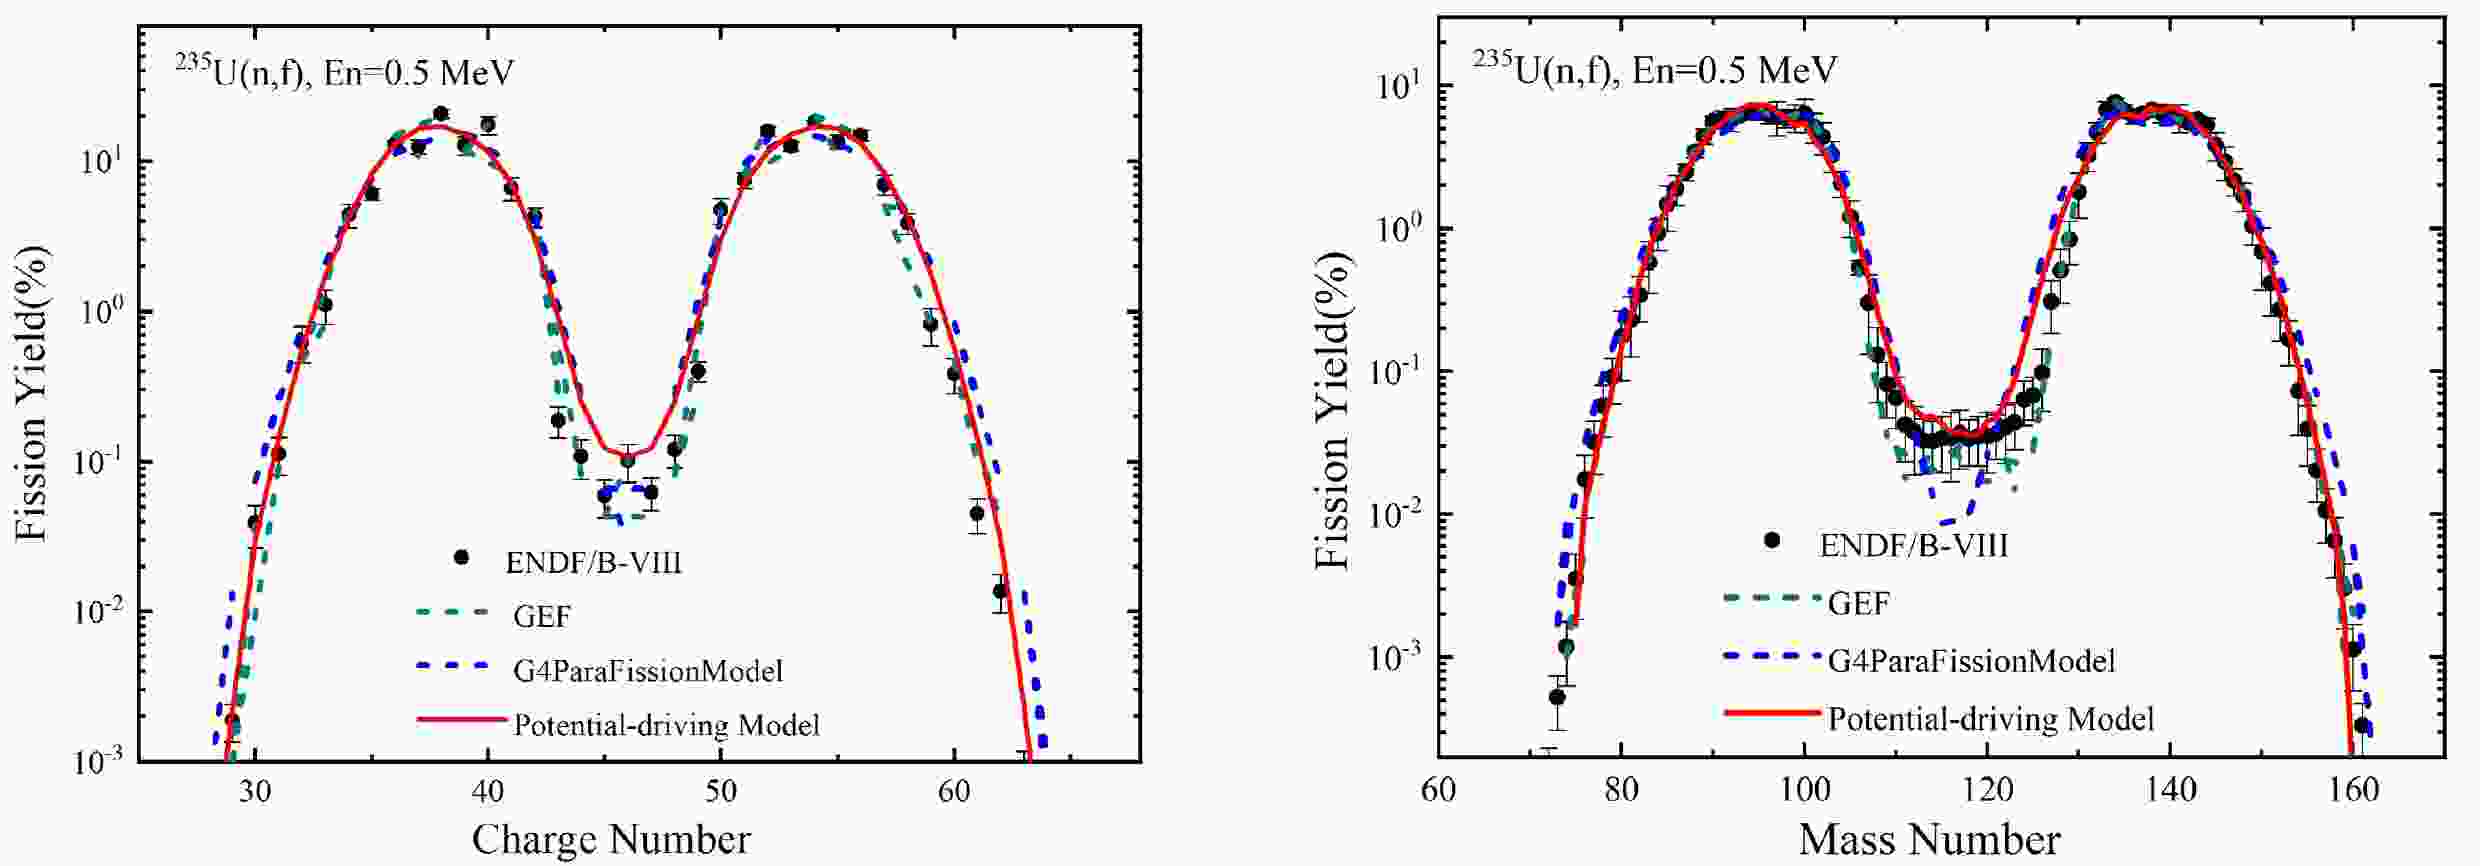
The charge and mass distributions of the independent yield for the 235U(n, f) reaction induced by 0.5 and 14 MeV neutrons are shown in Figs. 1 and 2, respectively. With an increase in incident neutron energy from 0.5 MeV to 14 MeV, there is a noticeable increase in yield at the valley and a decrease at the peak, as depicted in Figs. 1−2. This trend can be attributed to the diminishing shell effect with increasing incident neutron energy, resulting in a shift from asymmetric to symmetric fission. As shown in Figs. 1−2, the mass distribution calculated by the G4ParaFission Model notably deviates from the evaluation data at the valley. To provide a more intuitive comparison of the deviation between the three models and the evaluation data of ENDF/B-VIII.0, the
${\chi ^2}$ values between the three models and the evaluation data of ENDF/B-VIII.0 were calculated; they are shown in Fig. 3. The${\chi ^2}$ values between the independent yield data calculated by the Potential-driving Model and ENDF/B-VIII.0 evaluation data are smaller than those from the G4ParaFission Model. For the 0.5 MeV neutron-induced 235U(n, f) reaction, the${\chi ^2}$ values of the Potential-driving Model are larger than those of the GEF model. However, for the 14 MeV neutron-induced 235U(n, f) reaction, the${\chi ^2}$ values of the Potential-driving Model are smaller than those of the GEF model. Therefore, the Potential-driving Model demonstrates improved accuracy in calculating the independent yield of neutron-induced 235U(n, f) reactions when compared to the G4ParaFission Model.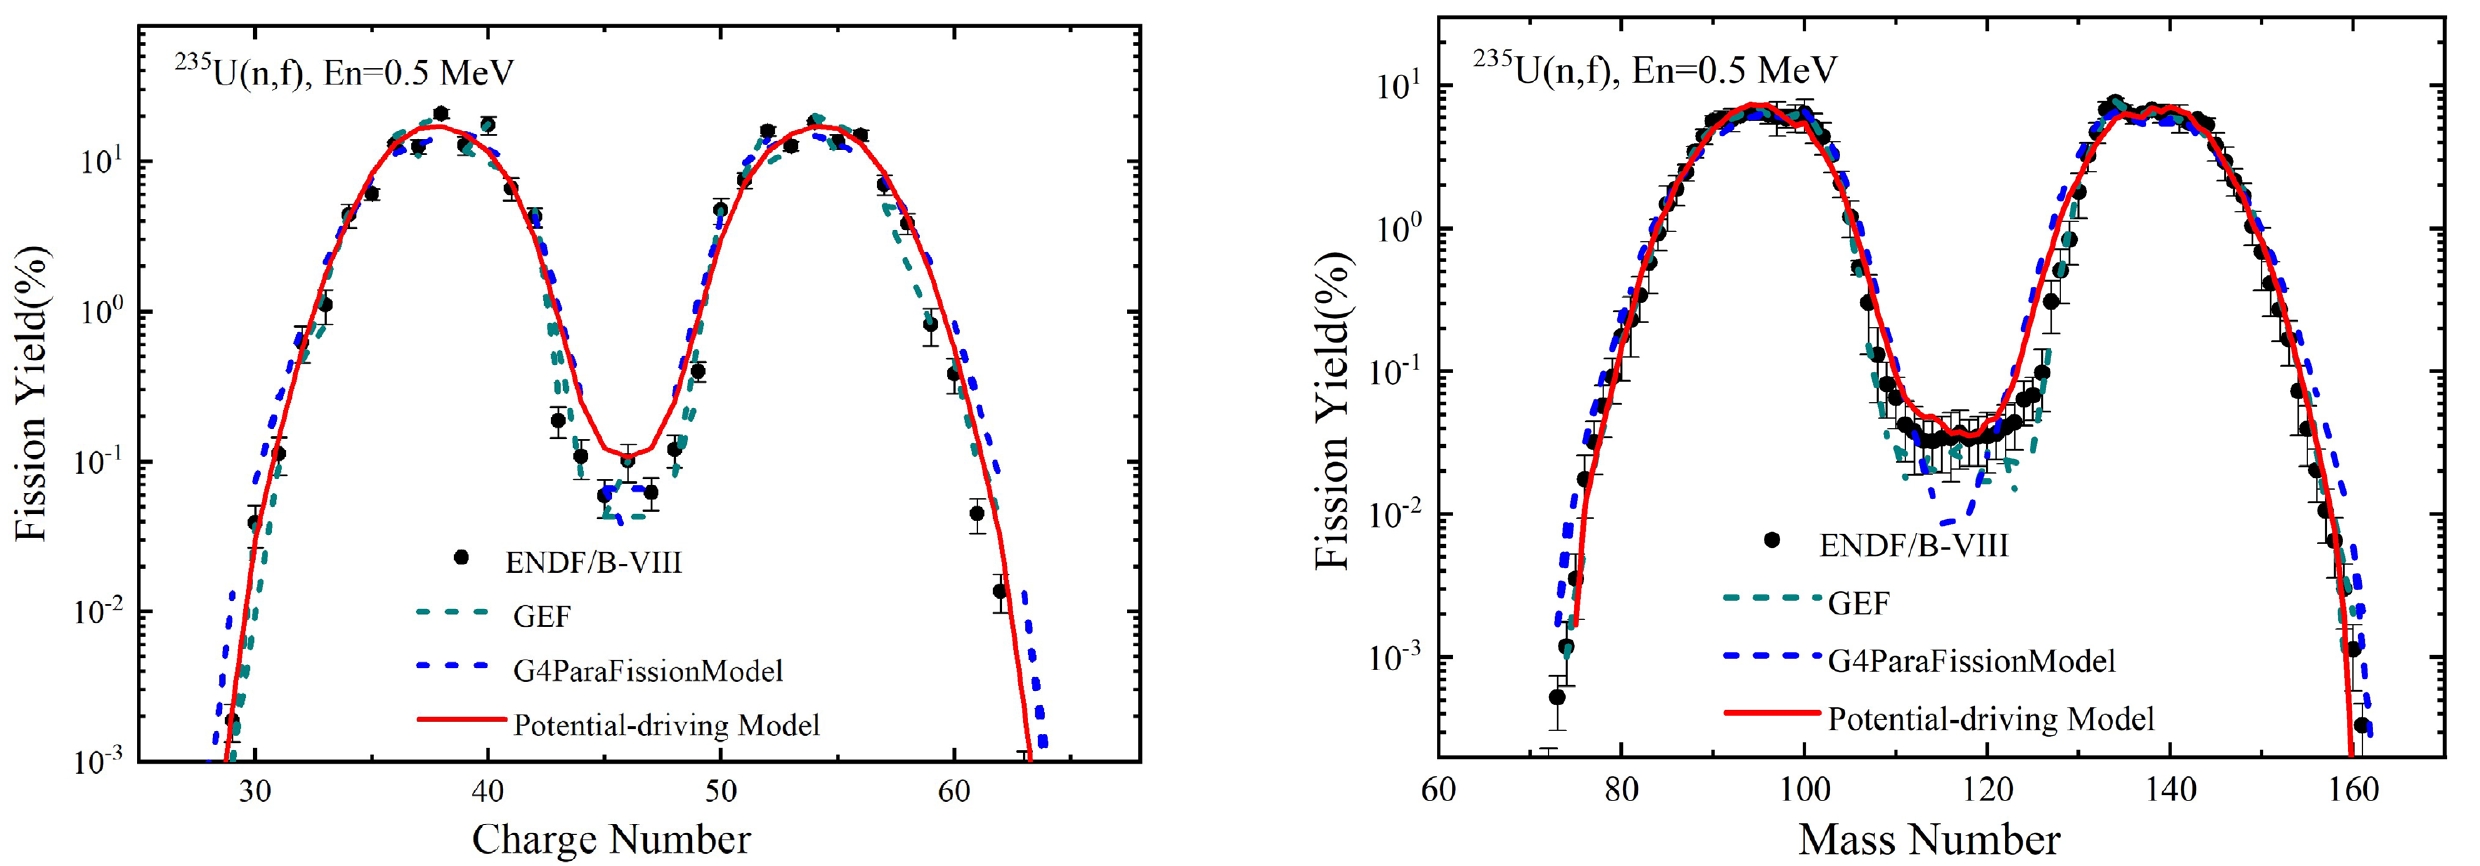
Figure 1. (color online) Charge and mass distributions of independent yield for the 235U(n, f) reaction induced by 0.5 MeV fast neutrons.
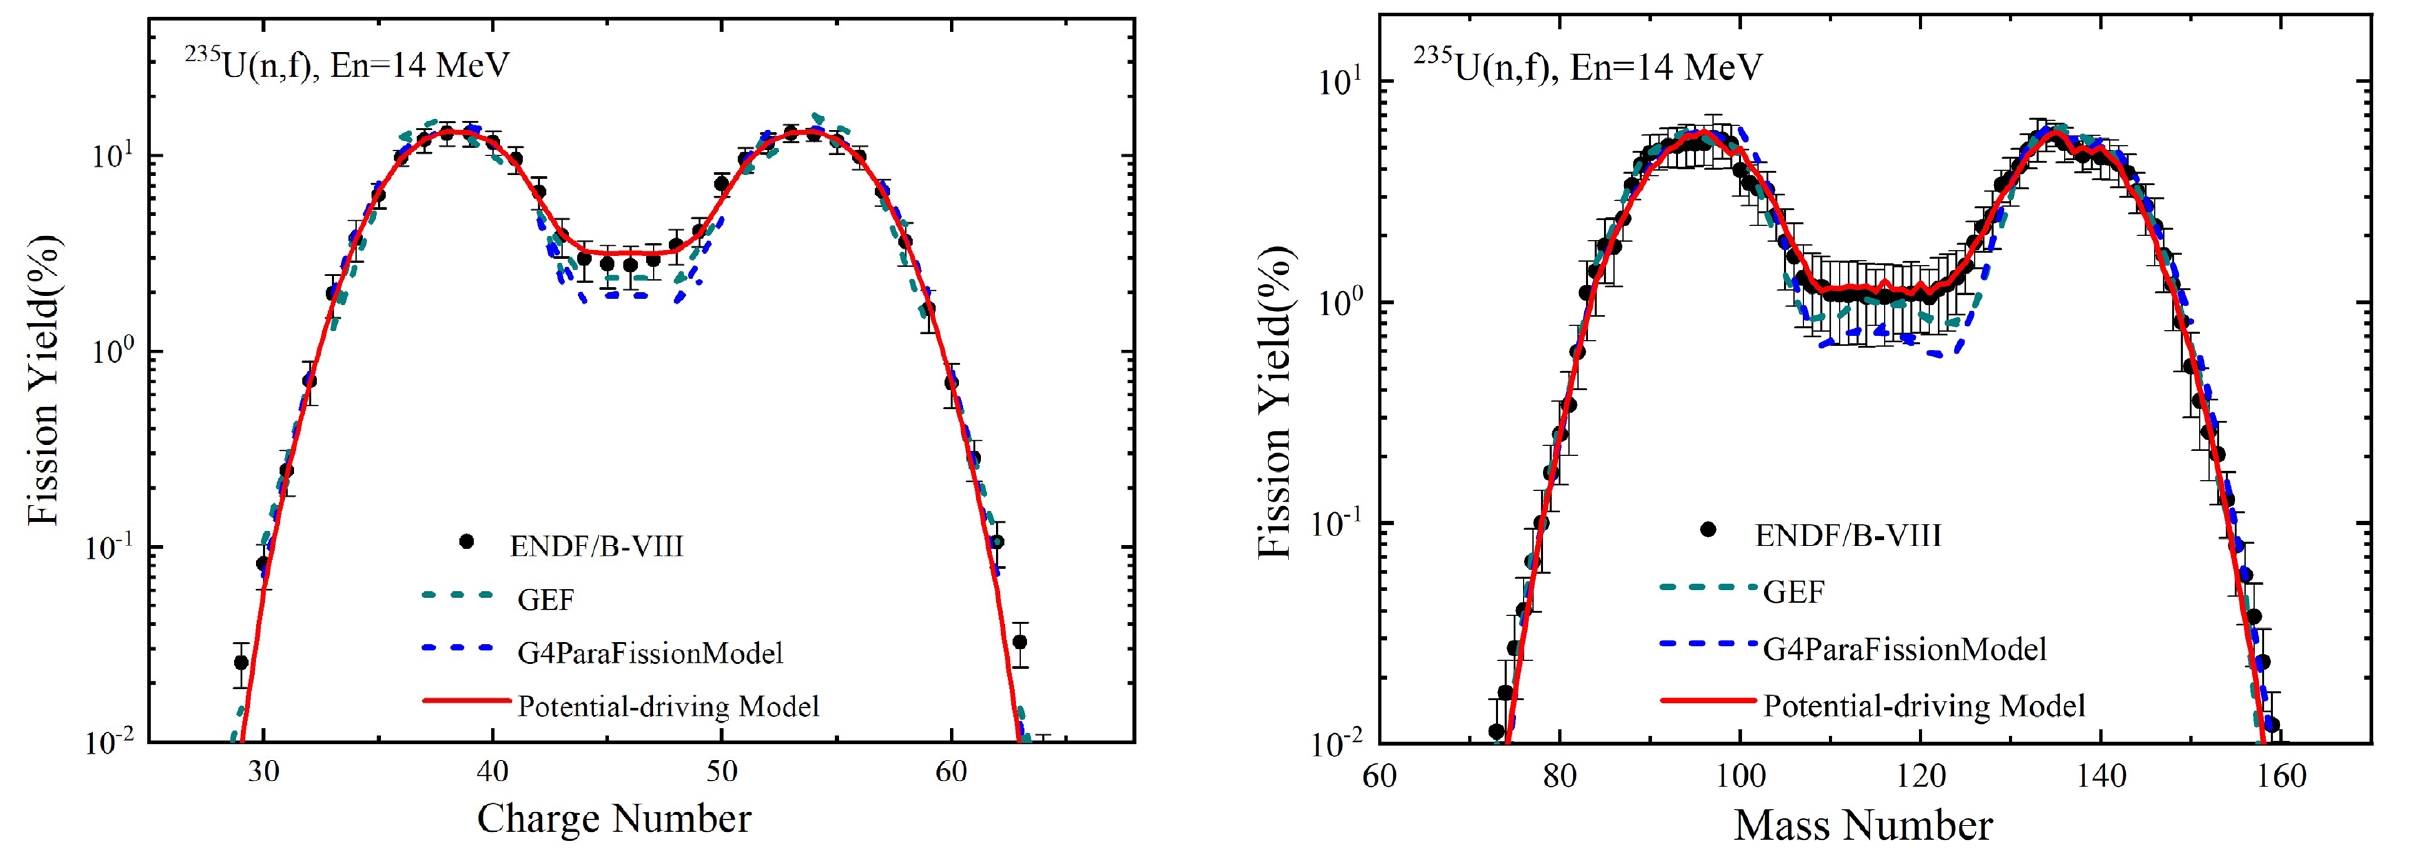
Figure 2. (color online) Charge and mass distributions of independent yield for the 235U(n, f) reaction induced by 14 MeV fast neutrons.
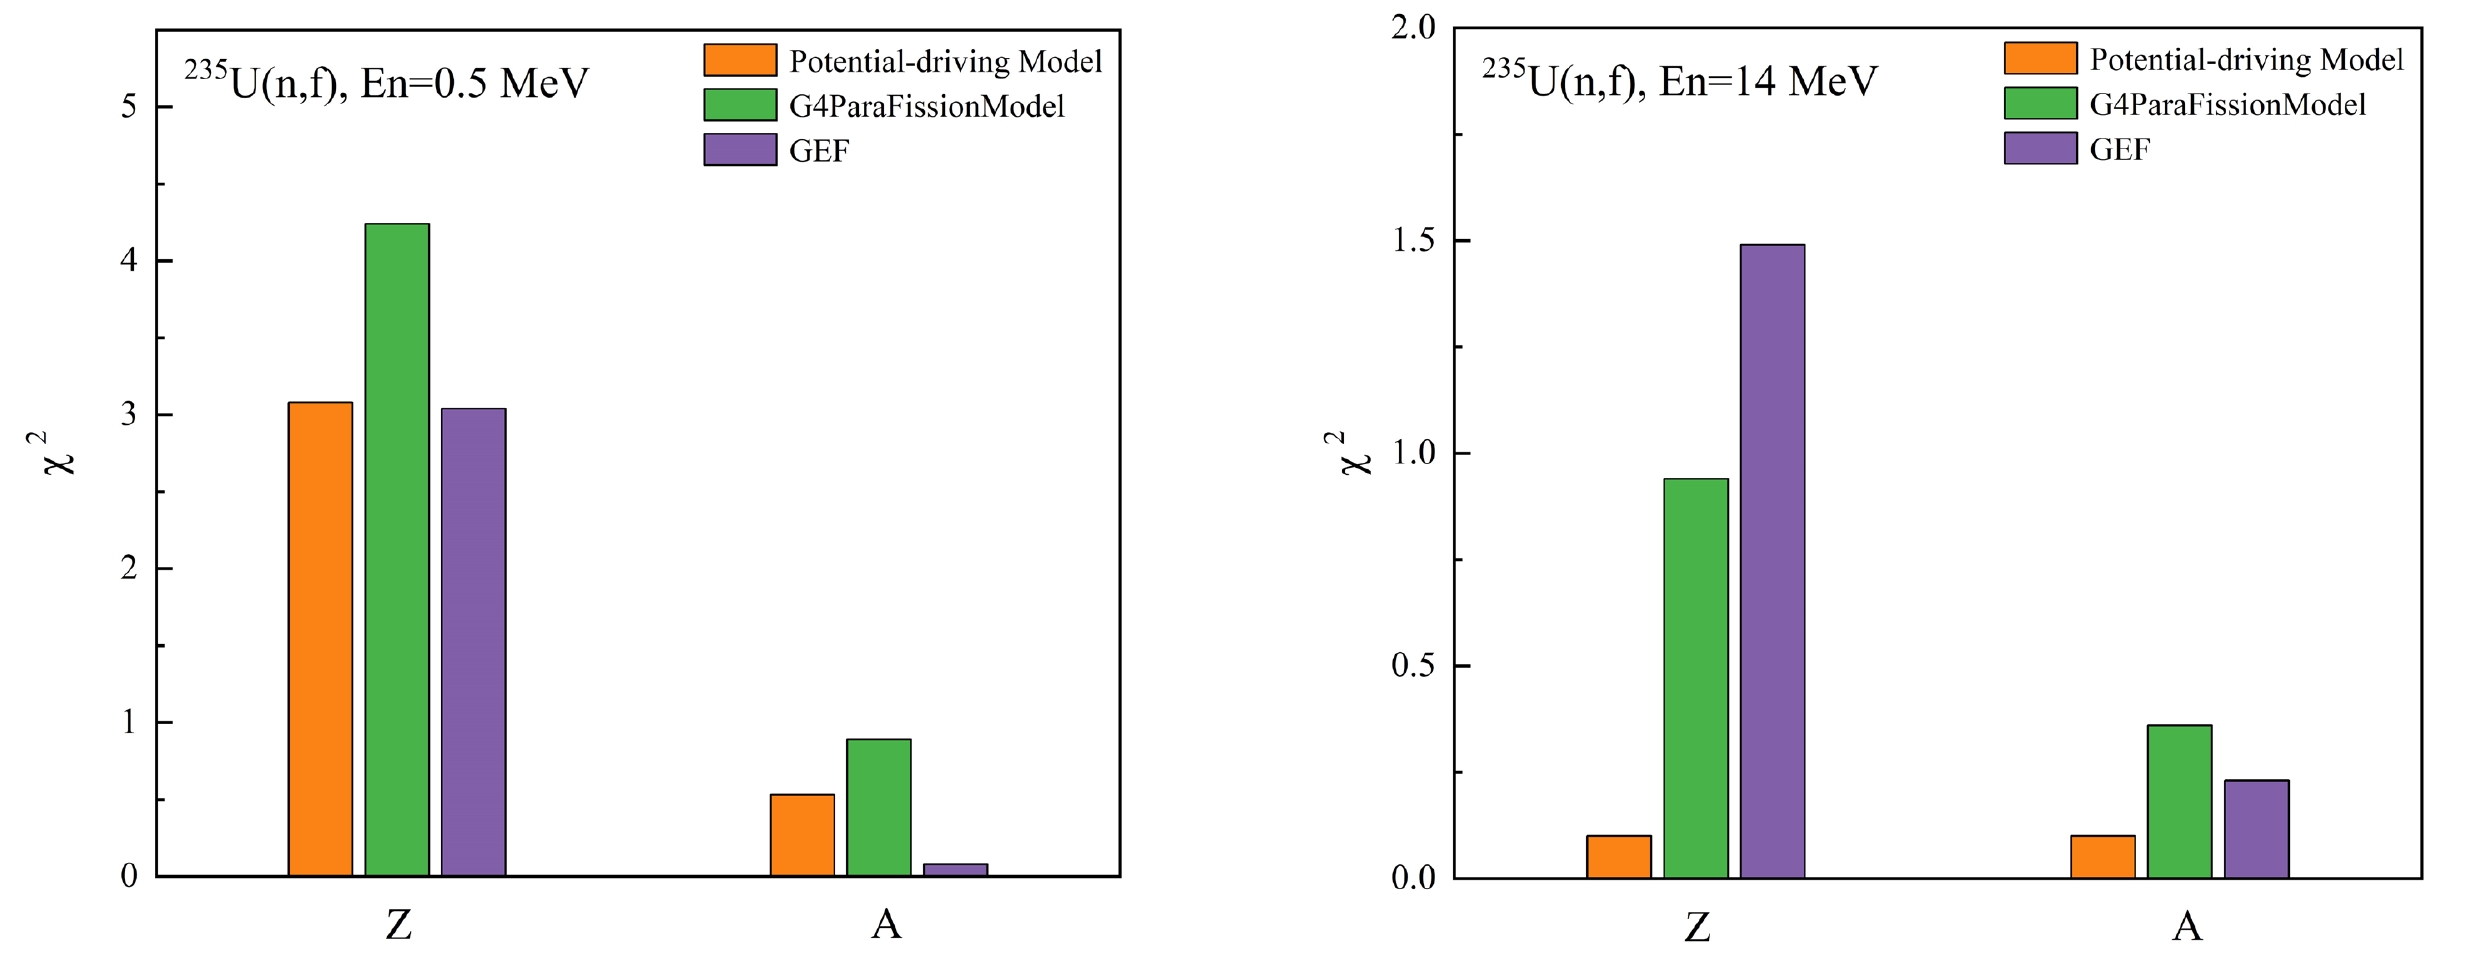
Figure 3. (color online) Comparison of
${\chi ^2}$ values calculated from the charge and mass distributions of independent yield for 235U(n, f) induced by 0.5 and 14 MeV neutrons.Figure 4 shows the independent yields of some important fission products: 87,88Kr, 97Zr, 100Mo, 106Ru, 134,135,138Xe, 137Cs, 140Ba, 140La, 143,144Ce, and 147,148Nd. As depicted in Fig. 4, a notable disparity exists between the evaluation data of ENDF/B-VIII and the data from GEFY6.2, with the calculated results falling between both of them. Note that, aside from 138Xe, the independent yields of other fission yields consistently exhibit positive energy dependence.
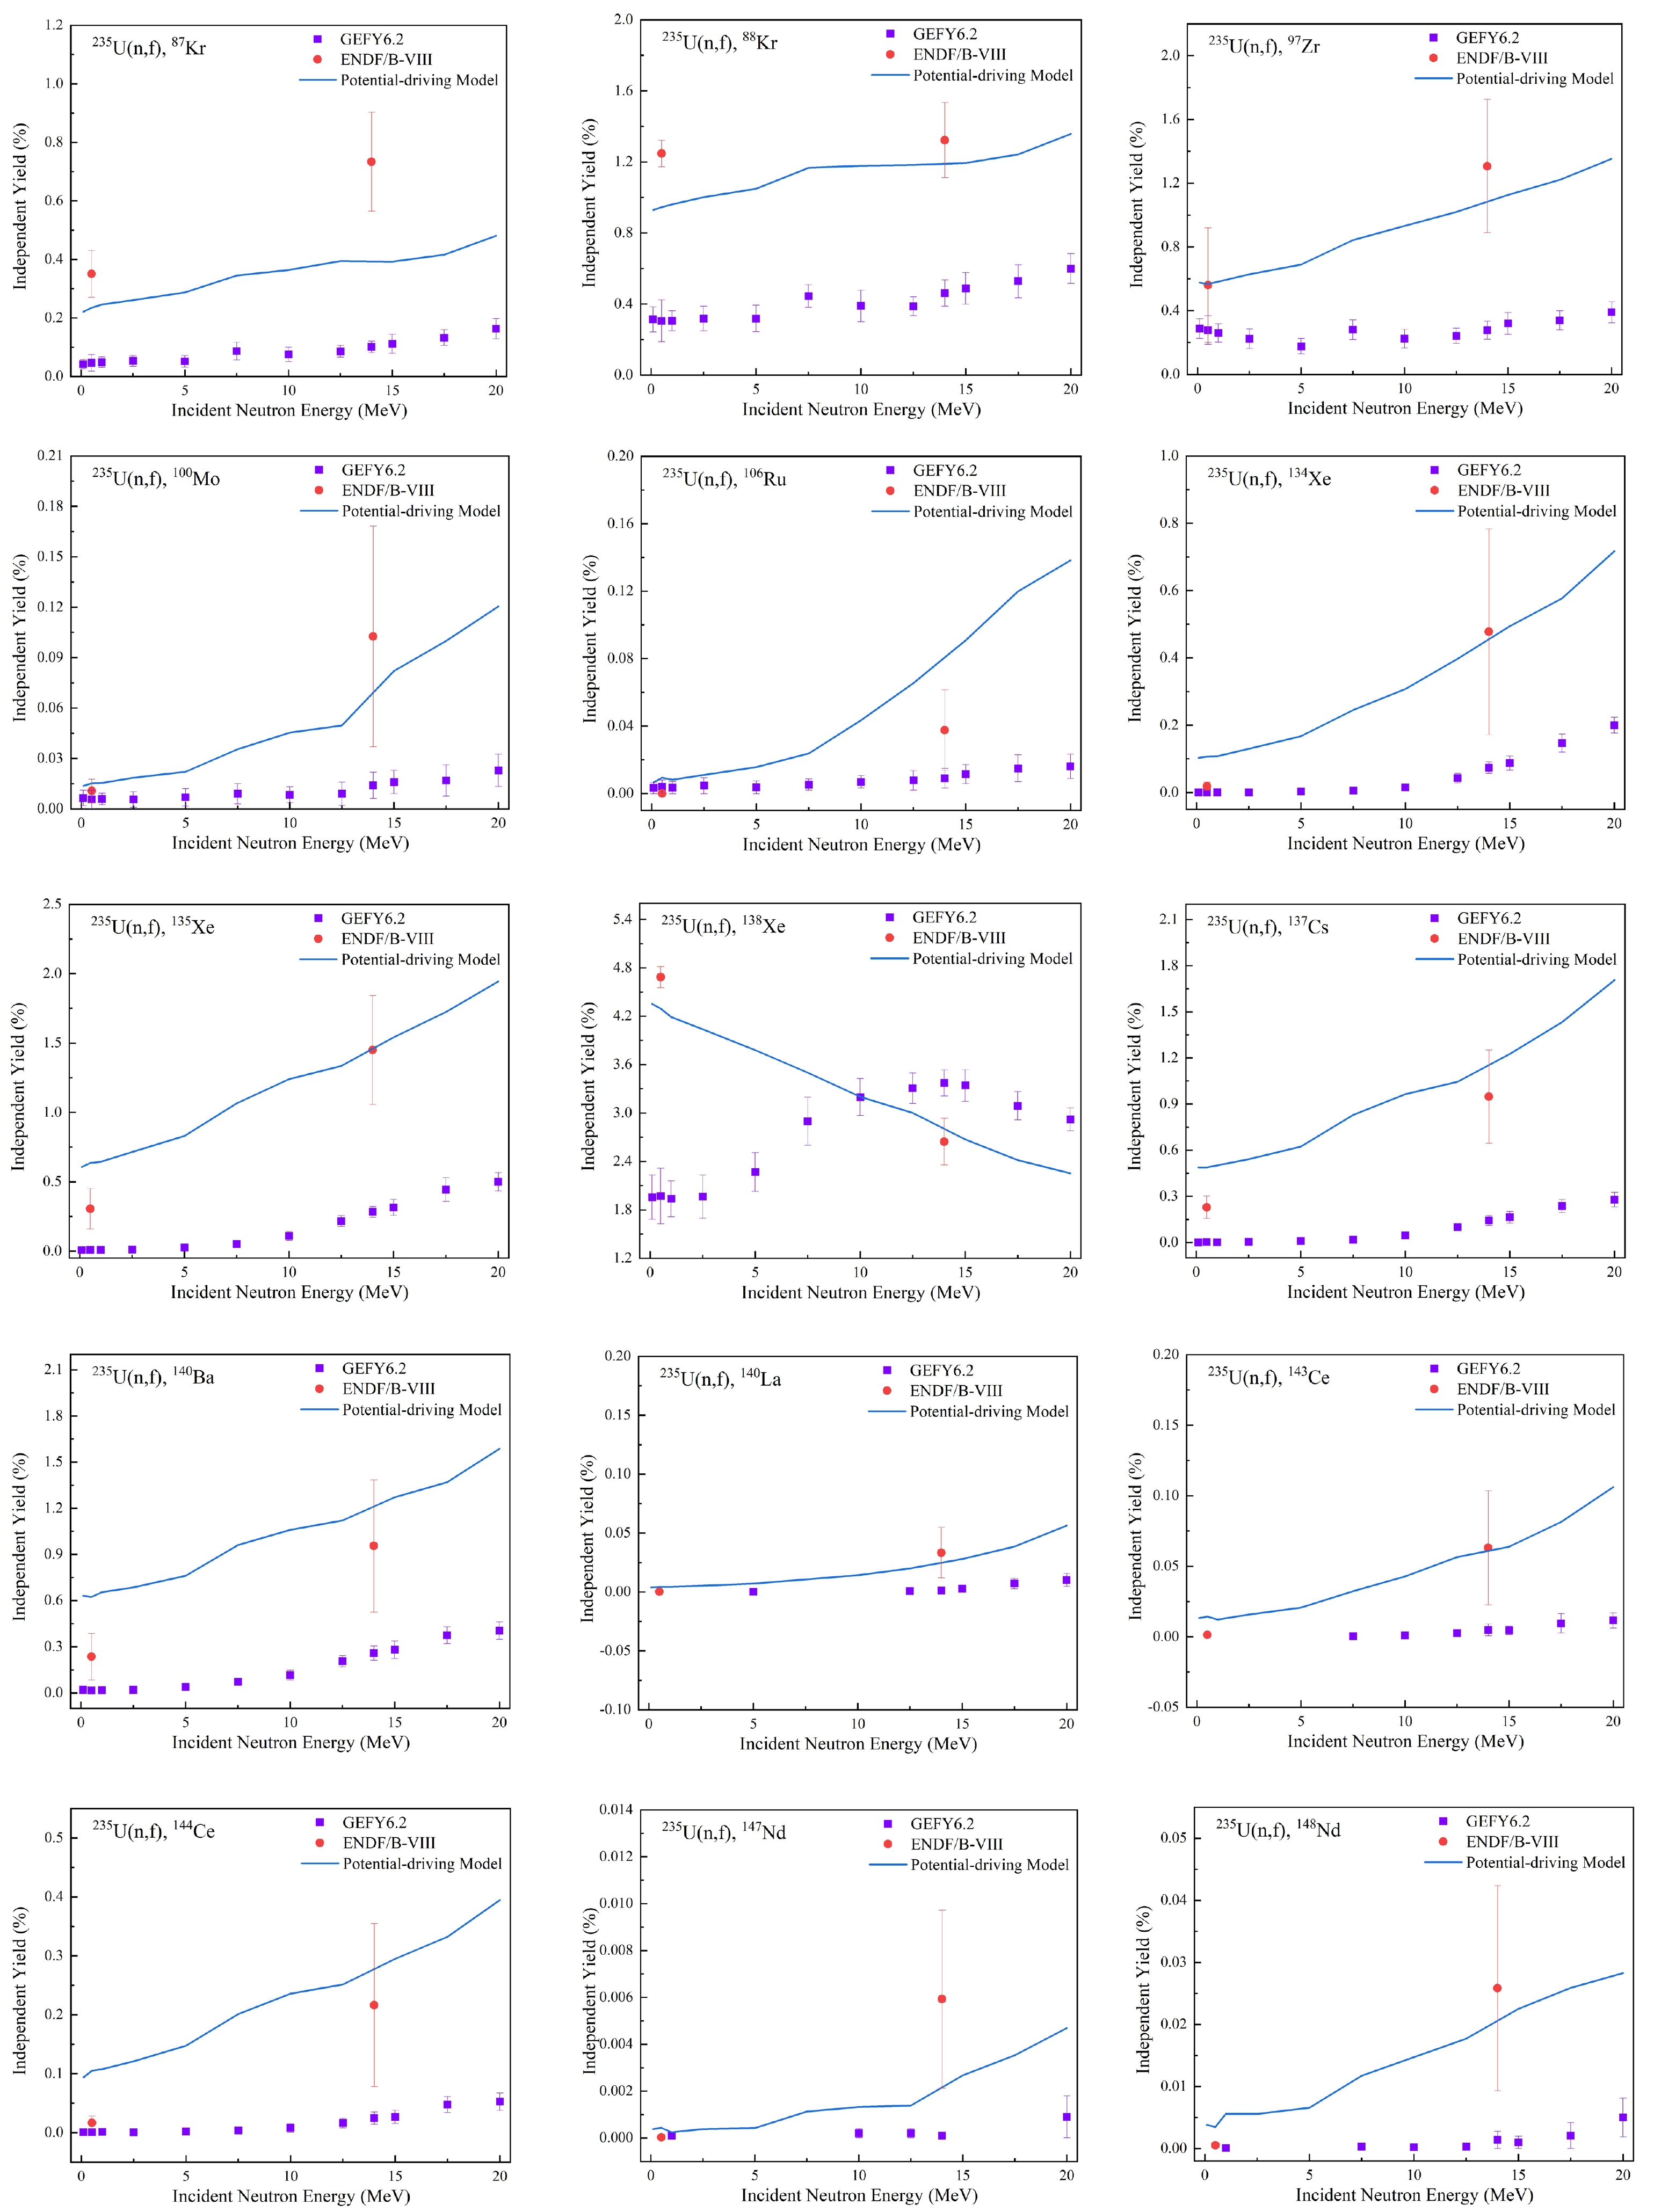
Figure 4. (color online) Distributions of independent fission yields for 87,88Kr, 97Zr, 100Mo, 106Ru,134,135,138Xe, 137Cs,140Ba,140La, 143,144Ce, and 147,148Nd from 235U.
-
We calculated the cumulative yield of five fission products, in particular those which are of great international concern, and compared it with some existing experimental data of fission product yields. By comparison, we investigated the relationship between fission product yield and incident neutron energy.
Figure 5 shows a comparison of the calculated fission yield data of 95Zr with data published by Gooden [9], Chapman [32], Glende [33], and Laurec [8], as well as with data calculated using the G4ParaFission Model. Within the 0−1 MeV range, the calculated values are in good agreement with Glende's experimental data, which demonstrates a fitted energy dependence of – 0.19 per MeV. However, the data from Laurec for 95Zr suggests a flat energy dependence at low energy. In the 2−6.3 MeV range, the calculated values are slightly smaller than the experimental data reported by Glende, with an average relative deviation of approximately 5.5%. Similarly, within the 6.0−9.1 MeV range, Chapman's datasets do not show significant energy dependence, and the calculated values display a relative deviation of approximately 5.26% with respect to Chapman's experimental data. At 14.8 MeV, the calculated values align closely with Gooden's experimental data, showing a relative deviation of 1.7%. The
${\chi ^2}$ value between the calculated fission product yields for 95Zr and the data derived from the G4ParaFission Model is 0.445, while that in comparison with the literature data is 2.279, as listed in Table 1.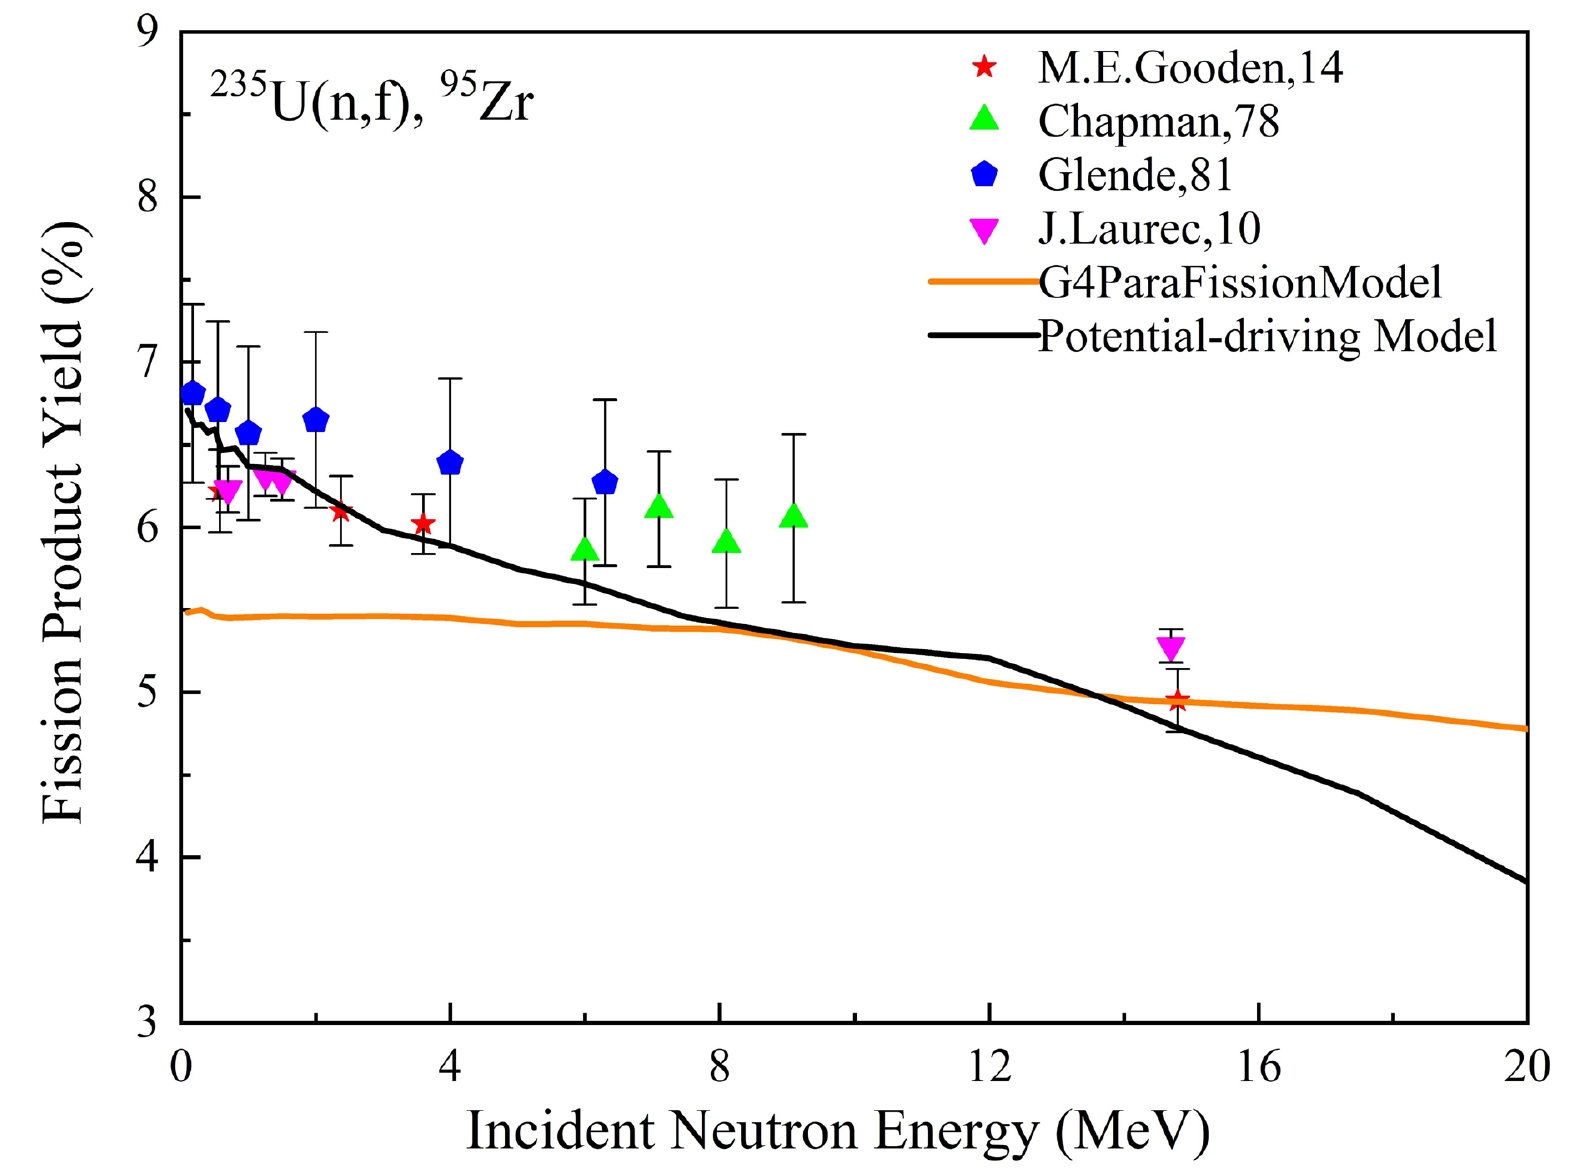
Figure 5. (color online) Calculated data compared with existing literature data for 95Zr from the fission of 235U.
Fission Model χ2 values 95Zr 99Mo 140Ba 144Ce 147Nd Potential-driving Model 0.445 1.263 1.951 0.655 0.242 G4ParaFission Model 2.279 13.31 4.837 38.711 14.593 Table 1.
${\chi ^2}$ values for neutrons induced from 235U.Figure 6 shows a comparison of the calculated fission yield data of 99Mo with data published by Gooden [9], Chapman [32], Glende [33], and Laurec [8], as well as with data calculated using the G4ParaFission Model. The data from Gooden, Glende, and Chapman, and the calculated data for 99Mo suggest a flat energy dependence extending to an incident neutron energy of at least 9 MeV. However, the data reported by Gooden, Glende, and Chapman are larger than the calculated data, except for the data reported by Glende at 0.55 and 2 MeV. At 14. 8 MeV, the calculated value is consistent with the experimental data reported by Gooden, with a relative deviation of 0.65%. The
${\chi ^2}$ values between the calculated fission product yields and the data calculated using the G4ParaFission Model for 99Mo are 1.263, while those in comparison with the literature data are 13.31, as listed in Table 1.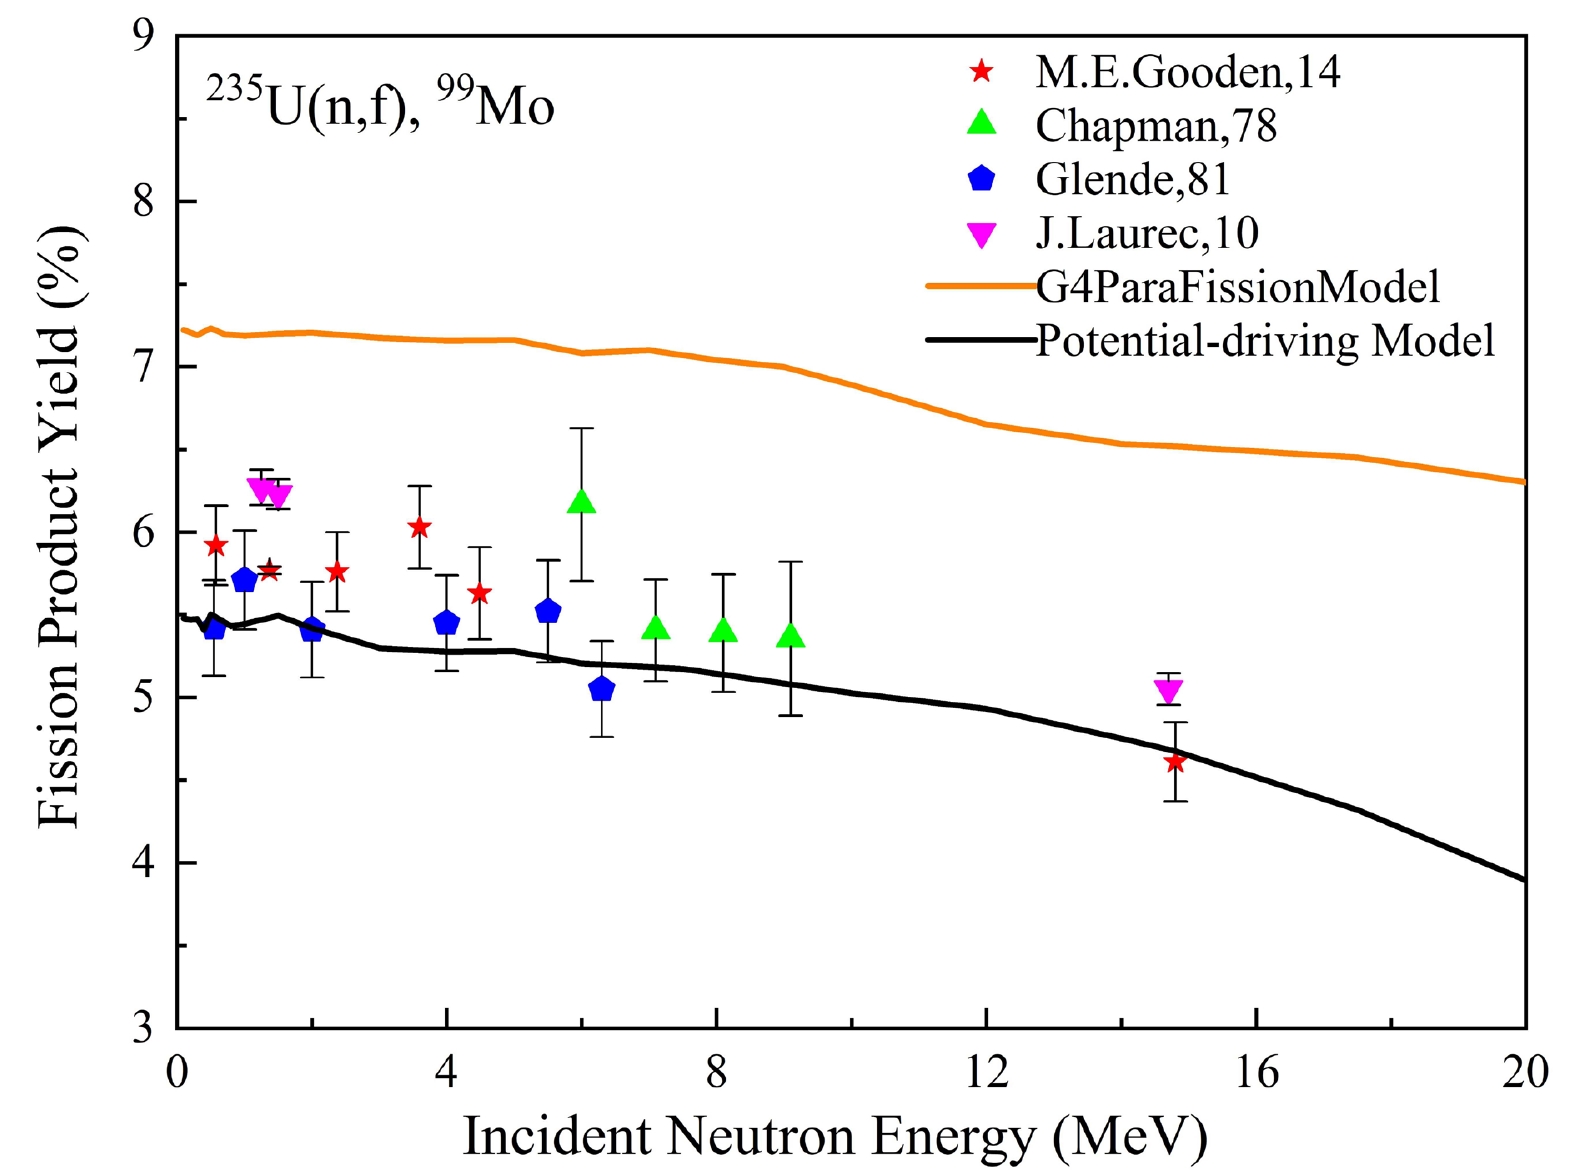
Figure 6. (color online) Calculated data compared with existing literature data for 99Mo from the fission of 235U.
Figure 7 shows a comparison of the calculated fission yield data of 140Ba with the data published by Gooden [9], Chapman [32], Glende [33], Laurec [8], as well as with the data calculated using the G4ParaFission Model. Between 0.5 and 20 MeV, the calculated values of 140Ba exhibit a negative energy dependence of – 0.17 per MeV. Notably, the calculated values surpass the experimental data reported by Gooden, Chapman, and Glende. However, all demonstrate negative energy dependence with similar rates of change. At lower energies, the calculated results exceed the experimental data reported by Laurec, with an average relative deviation of approximately 6.08%. Conversely, at 14.8 MeV, the calculated values are consistent with the experimental data reported by Laurec, with a relative deviation of approximately 0.075%. The
${\chi ^2}$ values between the calculated fission product yields and the data calculated using the G4ParaFission Model for 140Ba and the literature data are 1.951 and 4.837, respectively, as listed in Table 1.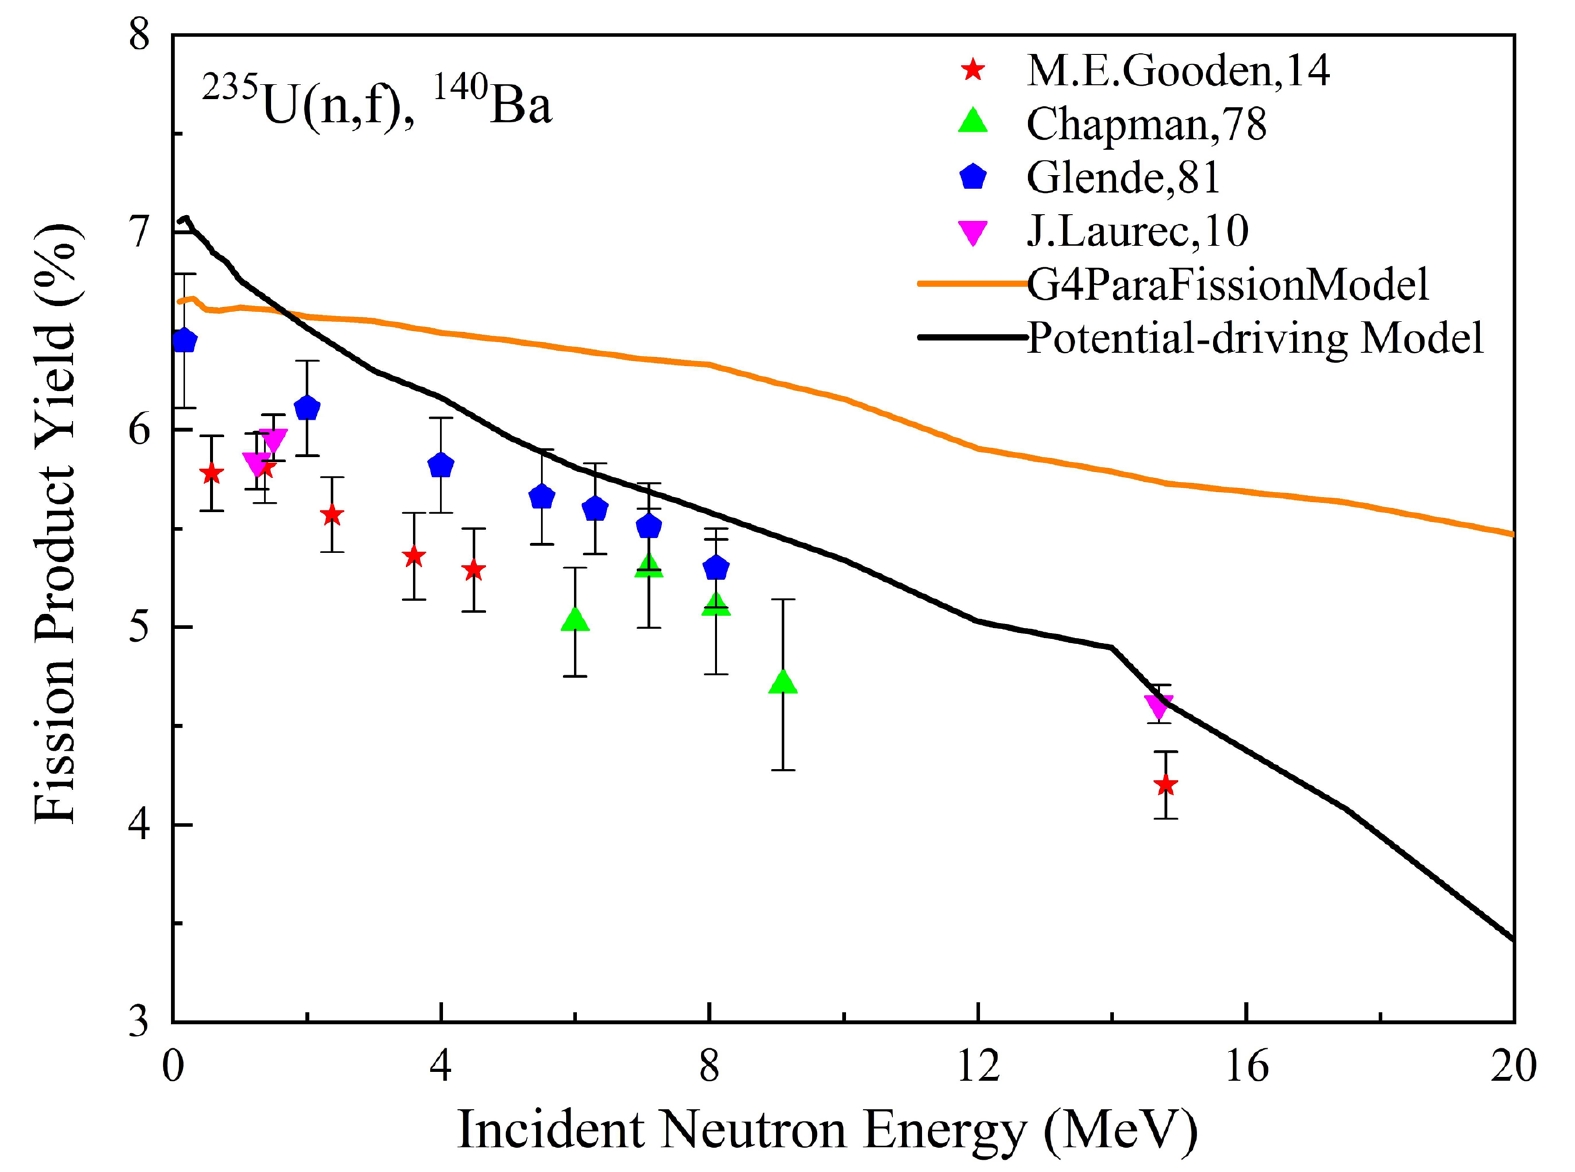
Figure 7. (color online) Calculated data compared with existing literature data for 140Ba from the fission of 235U.
Figure 8 shows a comparison of the calculated fission yield values of 144Ce with data published by Maeck, Lisman, Gabeskiriya, Sinclair [34−37], Chapman [32], and Laurec [8], as well as with data calculated using the G4ParaFission Model. Within the range from 0.4 to 1.5 MeV, the calculated fission data are in good agreement with the experimental data reported by Maeck, Lisman, Gabeskiriya, and Sinclair, with an average relative deviation of approximately 1.19%. However, at 6.0 MeV, Chapman's experimental data are consistently lower than all energy points, which is unreasonable and will not be considered. Furthermore, the calculated fission values surpass the experimental ones published by Chapman and Laurec, with average relative deviations of approximately 5.0% and 3.5%, respectively. Between 0.1 and 20 MeV, the calculated values of 144Ce demonstrate a fitted energy dependence of – 0.137 per MeV. The
${\chi ^2}$ values between the calculated fission product yields and the data calculated using the G4ParaFission Model for 144Ce and the literature data are 0.655 and 38.711, respectively, as detailed in Table 1.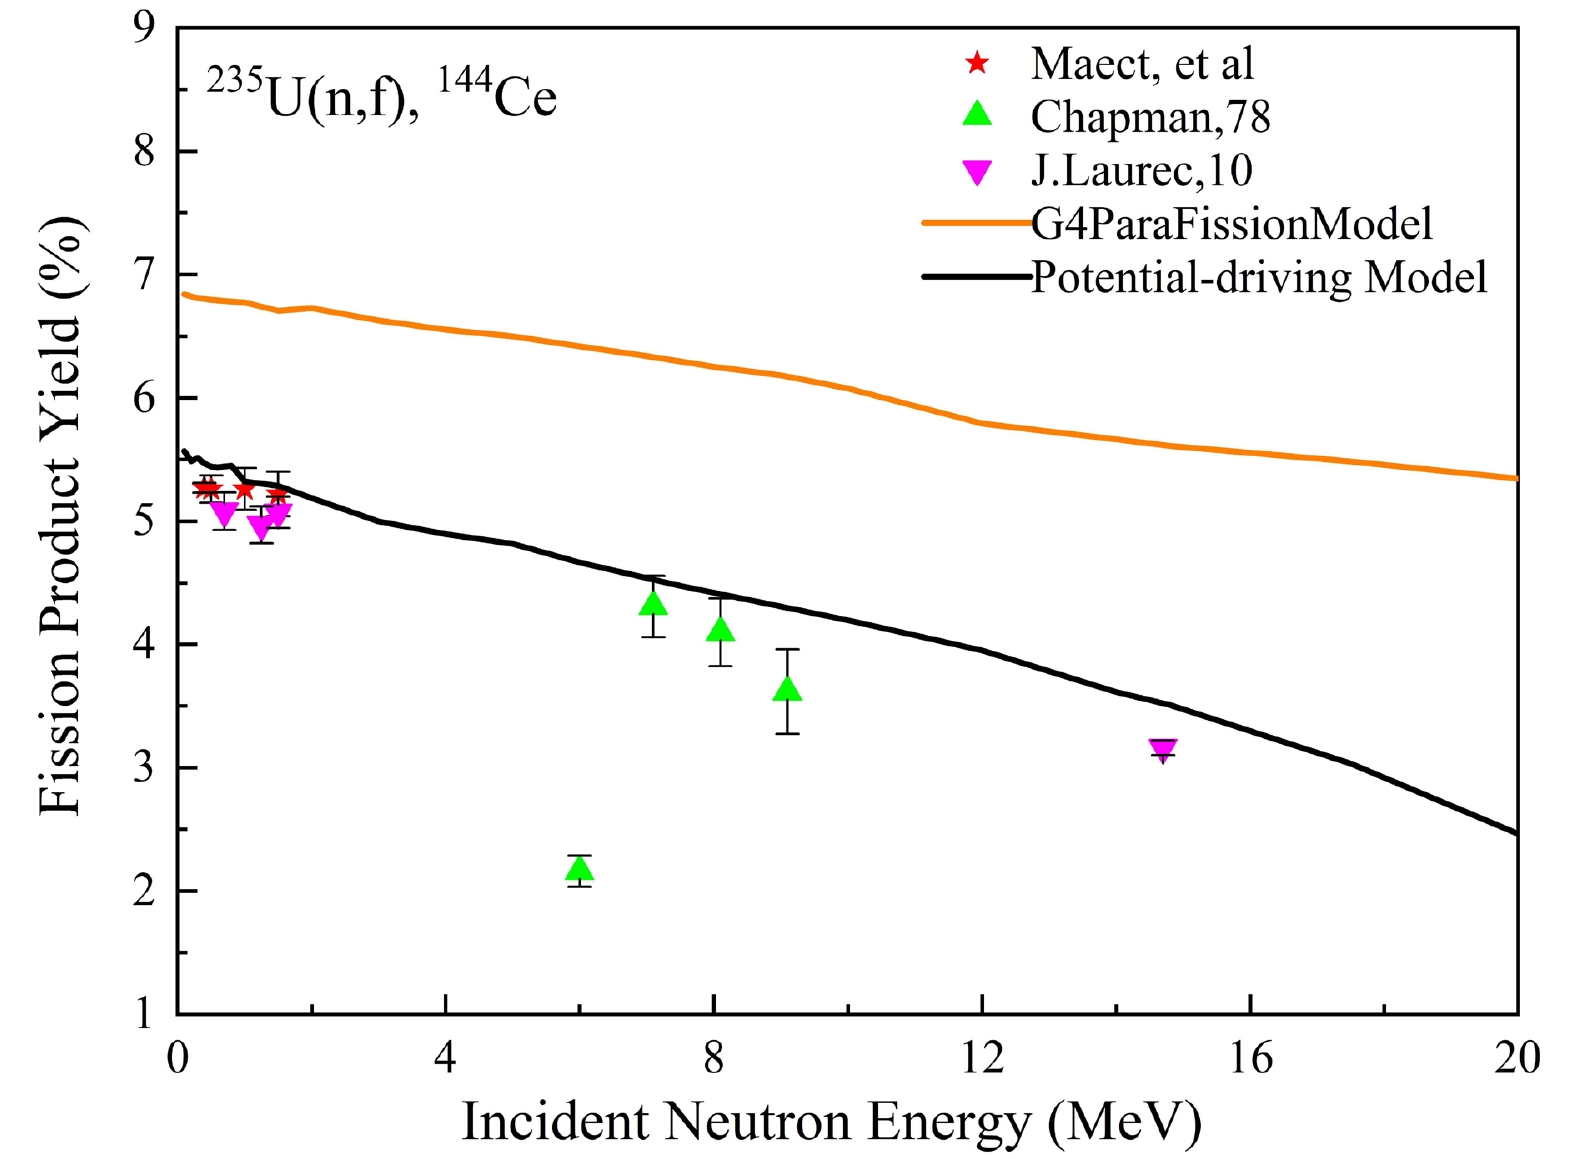
Figure 8. (color online) Calculated data compared with existing literature data for 144Ce from the fission of 235U.
Figure 9 shows a comparison of the calculated fission yields of 147Nd with data published by Gooden [9], Chapman [32], and Laurec [8], as well as with the data calculated using the G4ParaFission Model. Within the range from 0.58—2.37 MeV, the calculated data are in good agreement with Gooden's experimental data, showing an average relative deviation of approximately 0.66%. The data reported by Gooden, Laurec, and the calculated data for 147Nd indicate a flat energy dependence at low (extending to at least 5 MeV) incident neutron energy. All the calculated values of fission yield fall within the error range of Chapman's experimental data, with an average relative deviation of approximately 2.38%. The
${\chi ^2}$ values between the calculated fission product yields and the data calculated using the G4ParaFission Model for 147Nd and the literature data are 0.242 and 14.593, respectively, as listed in Table 1.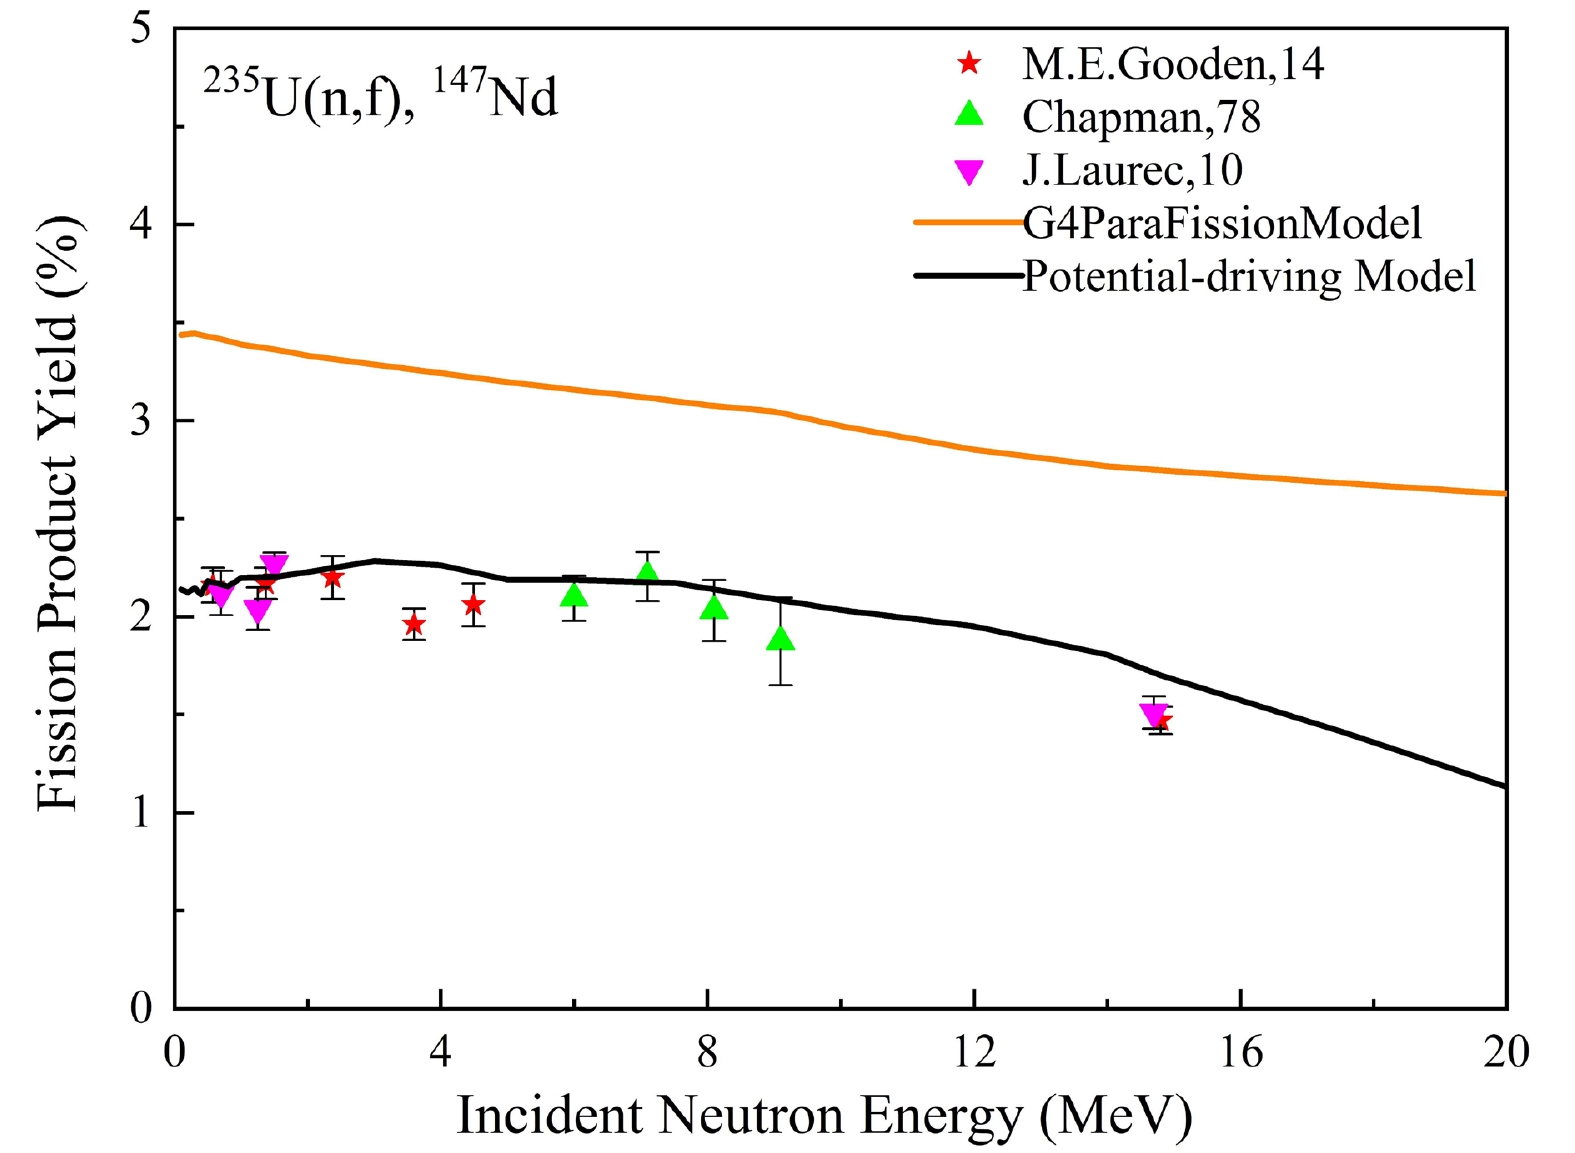
Figure 9. (color online) Calculated data compared with existing literature data for 147Nd from the fission of 235U.
-
When the average total kinetic energy of fission fragments before neutron emission (
$\rm \overline {TK{E_{\rm pre}}}$ ) is calculated using the Geant4 physical model, it is assumed that this parameter is exclusively associated to fission nuclear characteristics. However, the influence of the incident neutron energy on the average total kinetic energy of fission fragments is not taken into account. To address this, we incorporate Madland's framework describing the relationship between incident neutron energy and$\rm\overline {TK{E_{\rm pre}}}$ [12] to optimize the kinetic energy parameters of fission fragments in the Geant4 physical model. -
Figure 10 illustrates the calculated results of TKEpost distribution of 235U(n, f) reactions induced by 2.36, 5.08, 10.2, and 20 MeV neutrons. The point data were extracted from R. Yanez [38]. The red line represents the results from the Potential-driving Model whereas the blue line represents the results from the G4ParaFission Model. The calculated results for both models are consistent with the general distribution trend of experimental data. As depicted in Fig. 10, the distribution approximates a Gaussian shape, with its peak position gradually shifting to the left as the incident neutron energy increases.
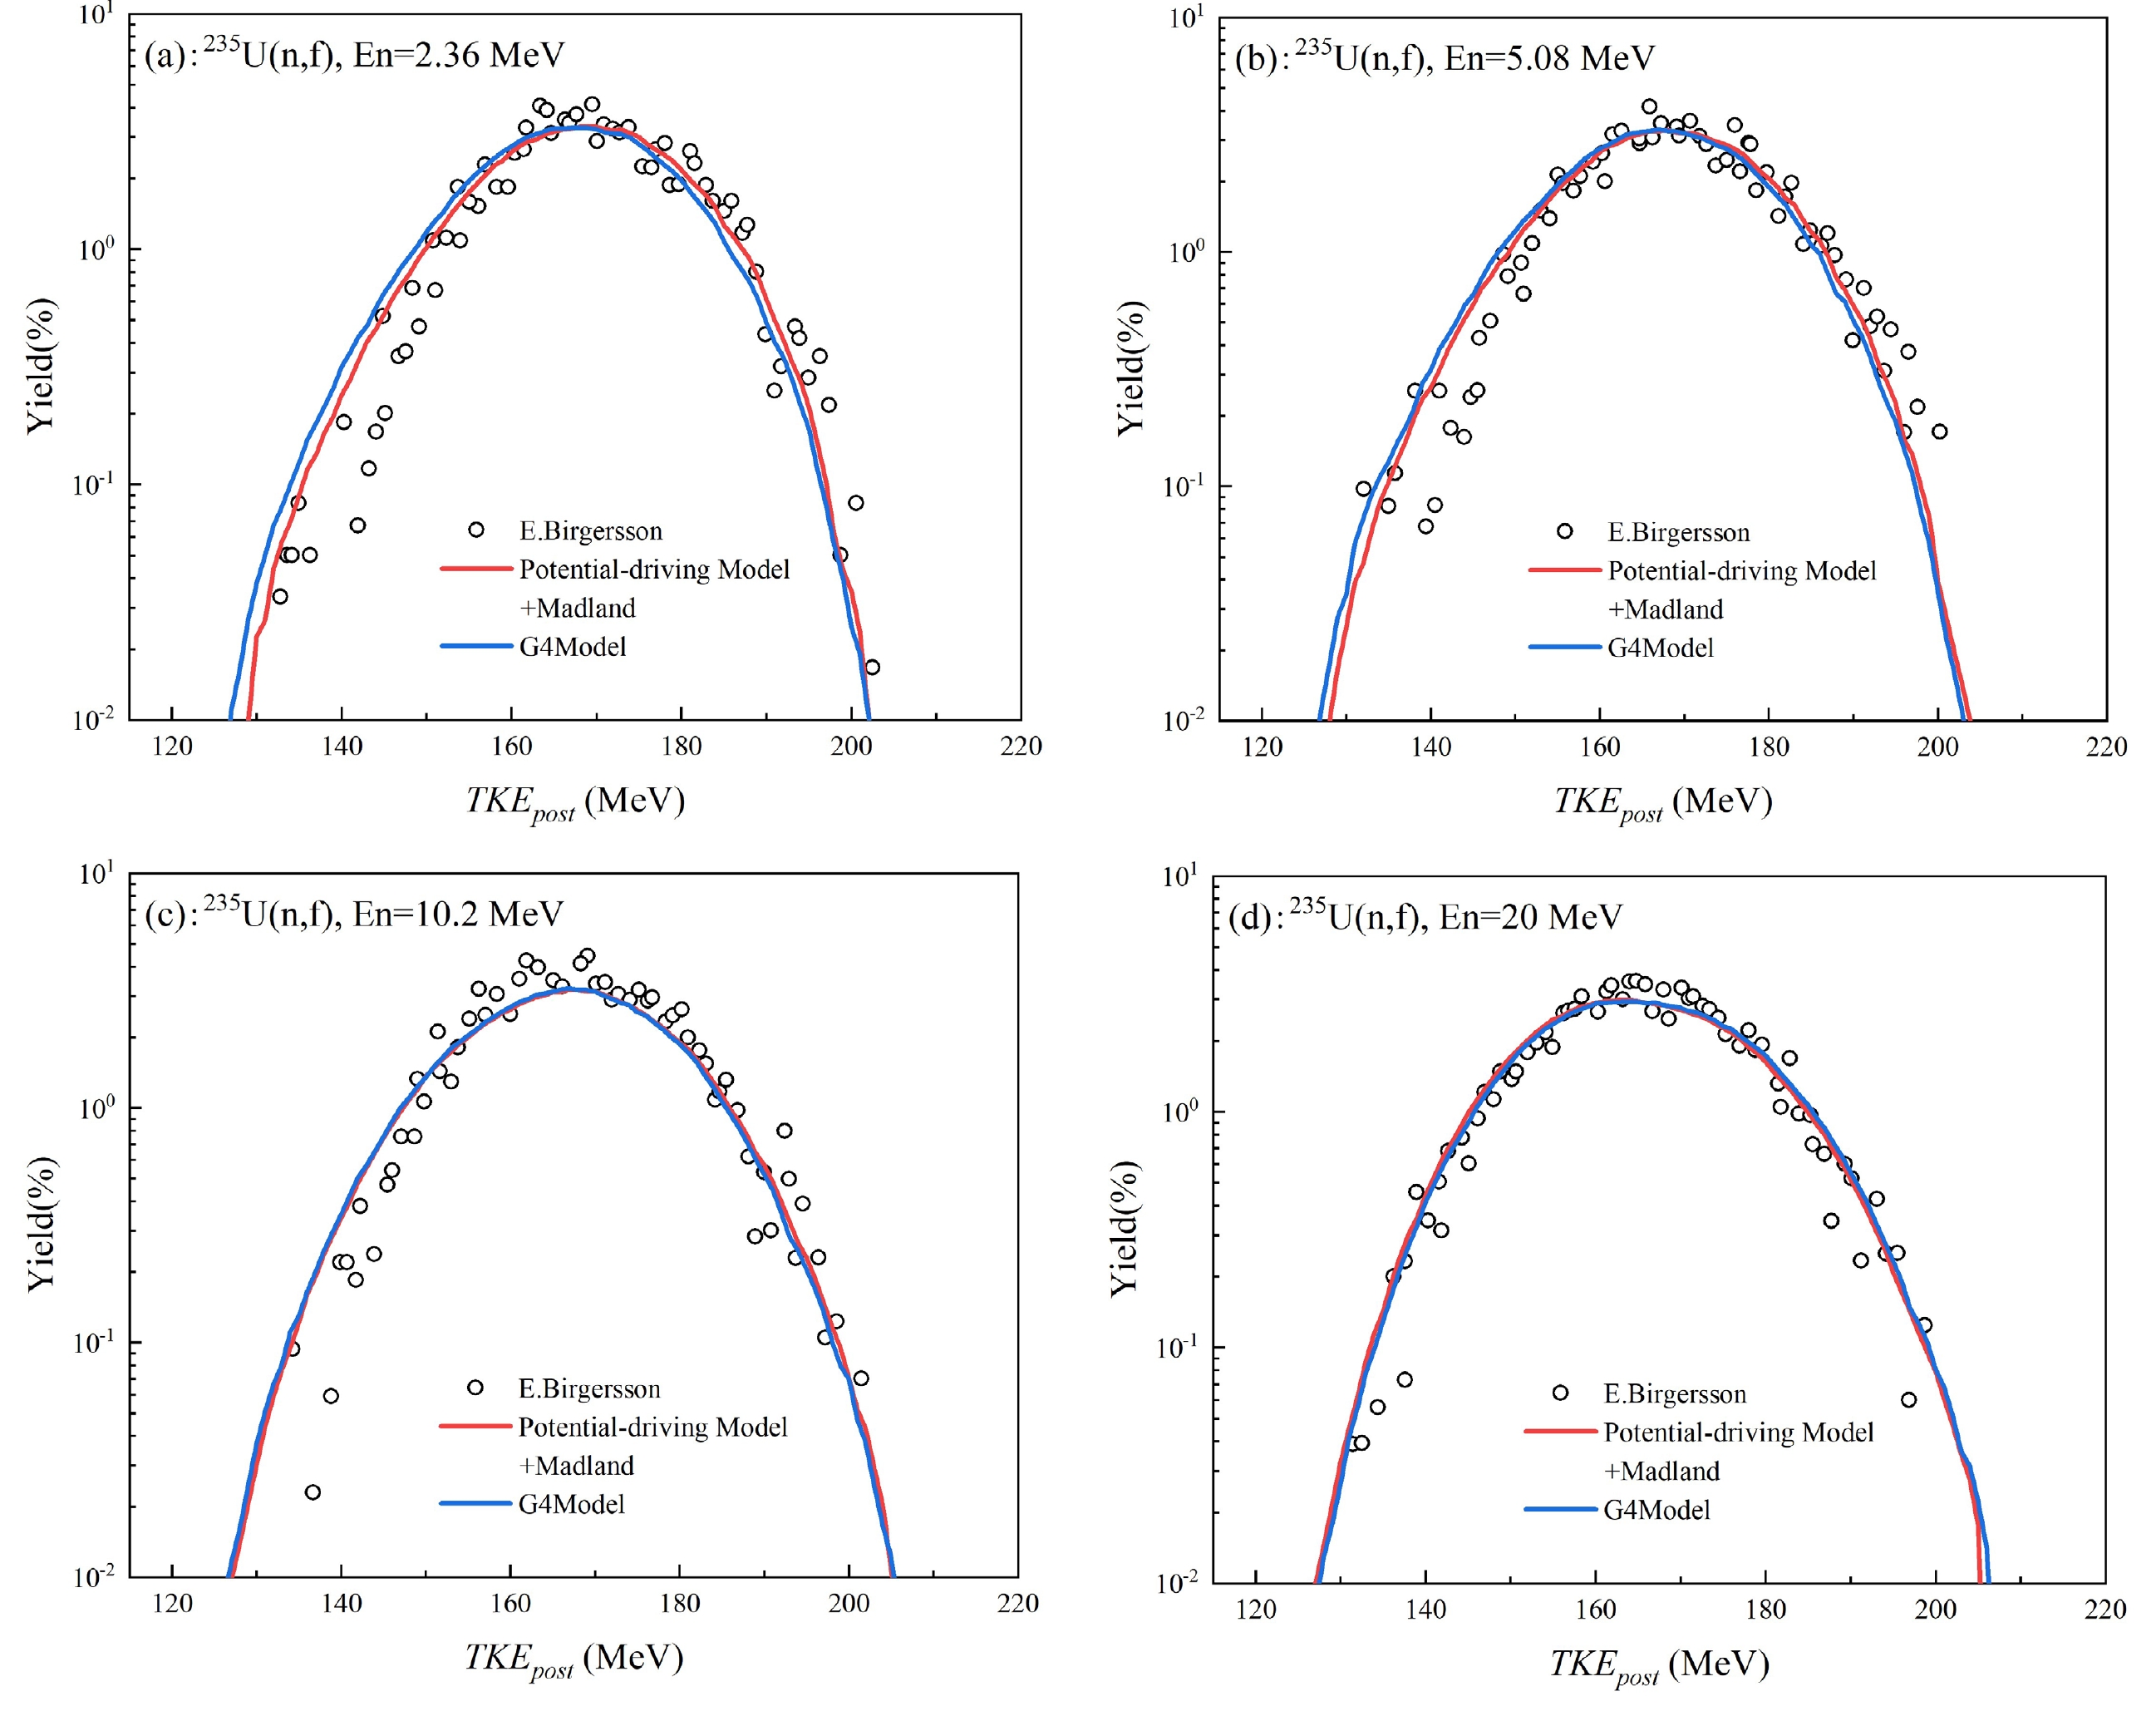
Figure 10. (color online) Comparison between the calculated results (lines) of total kinetic energy of fission fragments from the fission of 235U after neutron emission and the experimental data (points) extracted from R. Yanez [38], (a) En=2.36 MeV;(b) En=5.08 MeV;(c) En=10.2 MeV;(d) En=20 MeV.
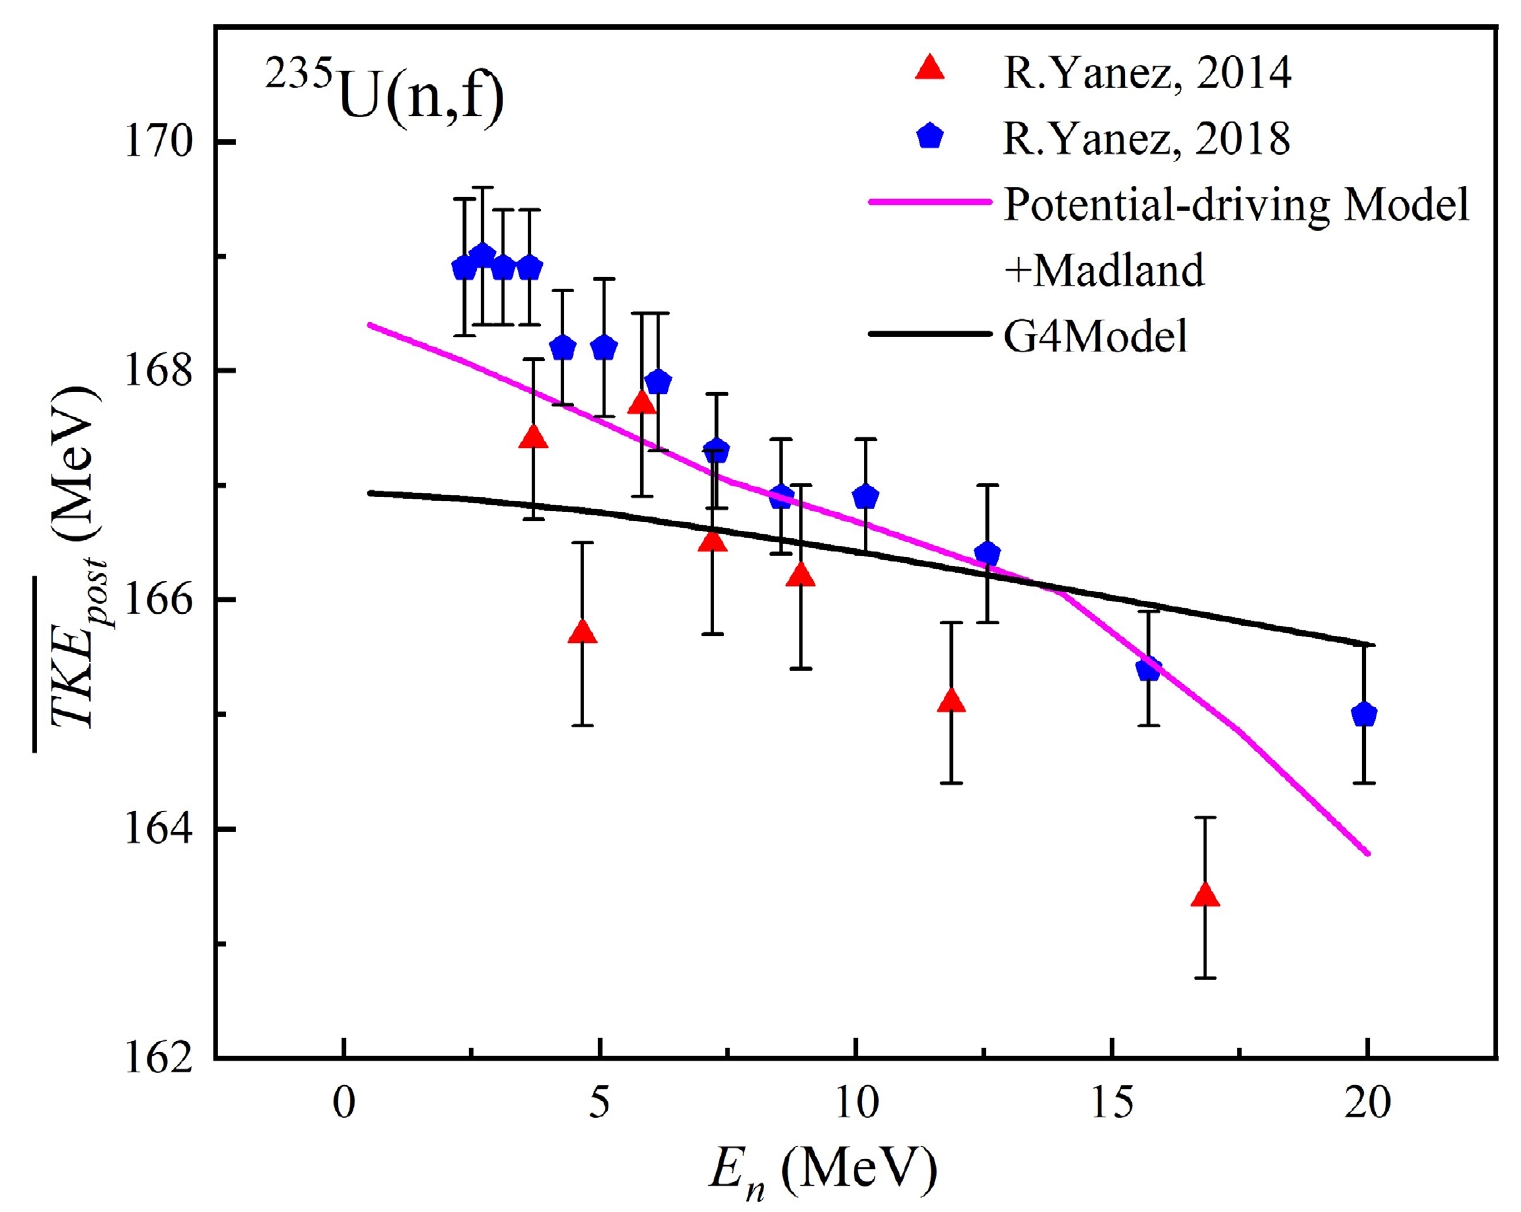
The variation of average total kinetic energy after neutron emission (
$\rm\overline {TK{E_{\rm post}}}$ ) of 235U with respect to the incident neutron energy is shown in Fig. 11. According to the experimental data [38−39] in Fig. 11, it can be concluded that$\rm\overline {TK{E_{\rm post}}}$ decreases as the incident neutron energy ranges from 0 to 20 MeV. This decline can be attributed to two primary physical factors. First, with the increase of incident neutron energy, the shell effect decreases owing to the increase of the excitation energy of the compound nucleus, causing a transition from asymmetric to symmetric fission mode. Therefore, the contribution of the symmetric fission mode increases and the contribution of the asymmetric fission mode decreases. However, part of the excitation energy of the compound nucleus is carried away by evaporation neutrons and gammas, and the deformed nucleus usually exhibits low Coulomb repulsion owing to its long neck in the symmetric fission mode resulting in a lower$\rm\overline {TK{E_{\rm post}}}$ . Second, the increase of the excitation energy of the fission nucleus affects the change in nuclear temperature, leading to the elongation of the neck of the deformed nucleus and decrease of Coulomb potential [40], thereby contributing to the decrease in average total kinetic energy. With the increase of En, the$\rm\overline {TK{E_{\rm post}}}$ calculation results from the G4ParaFissionMode decrease slowly, which markedly differs from the experimental data. This discrepancy arises from the failure of the G4ParaFission Model when it comes to accounting for the relationship between the incident neutron energy and the total kinetic energy of fission fragments, thus hindering an accurate determination of the$\rm\overline {TK{E_{\rm post}}}$ distribution characteristics and physical principles. Comparatively, the introduction of Madland's description of the relationship between the incident neutron energy and$\rm\overline {TK{E_{\rm post}}}$ within the Potential-driving Model leads to notable enhancements in the calculated$\rm\overline {TK{E_{\rm post}}}$ distribution results, as depicted in Fig. 11. This modification better captures the distribution characteristics and physical principles of$\rm\overline {TK{E_{\rm post}}}$ for 235U compared to those from the G4ParaFission Model. -
Figure 12 shows, for the n + 235U fission system, the A-TKEpost two-dimensional spectrum of fission fragments after neutron emission under different En conditions. As shown in Fig. 12, the valley yield of mass distribution after neutron emission gradually increases with rising En. This phenomenon arises from the diminishing shell effect and transition from asymmetric to symmetric fission mode. Simultaneously, the contribution of the symmetric fission mode increases, leading to the elongation and narrowing of the neck shape prior to fission nucleus rupture, hence resulting in a reduced Coulomb potential and subsequently lower total kinetic energy. The aforementioned results show that with the increase of En, the yield of the symmetric fission region (110 < A < 125) and low-energy segment (140 < TKEpost < 165) gradually increases in the A-TKEpost two-dimensional spectrum.
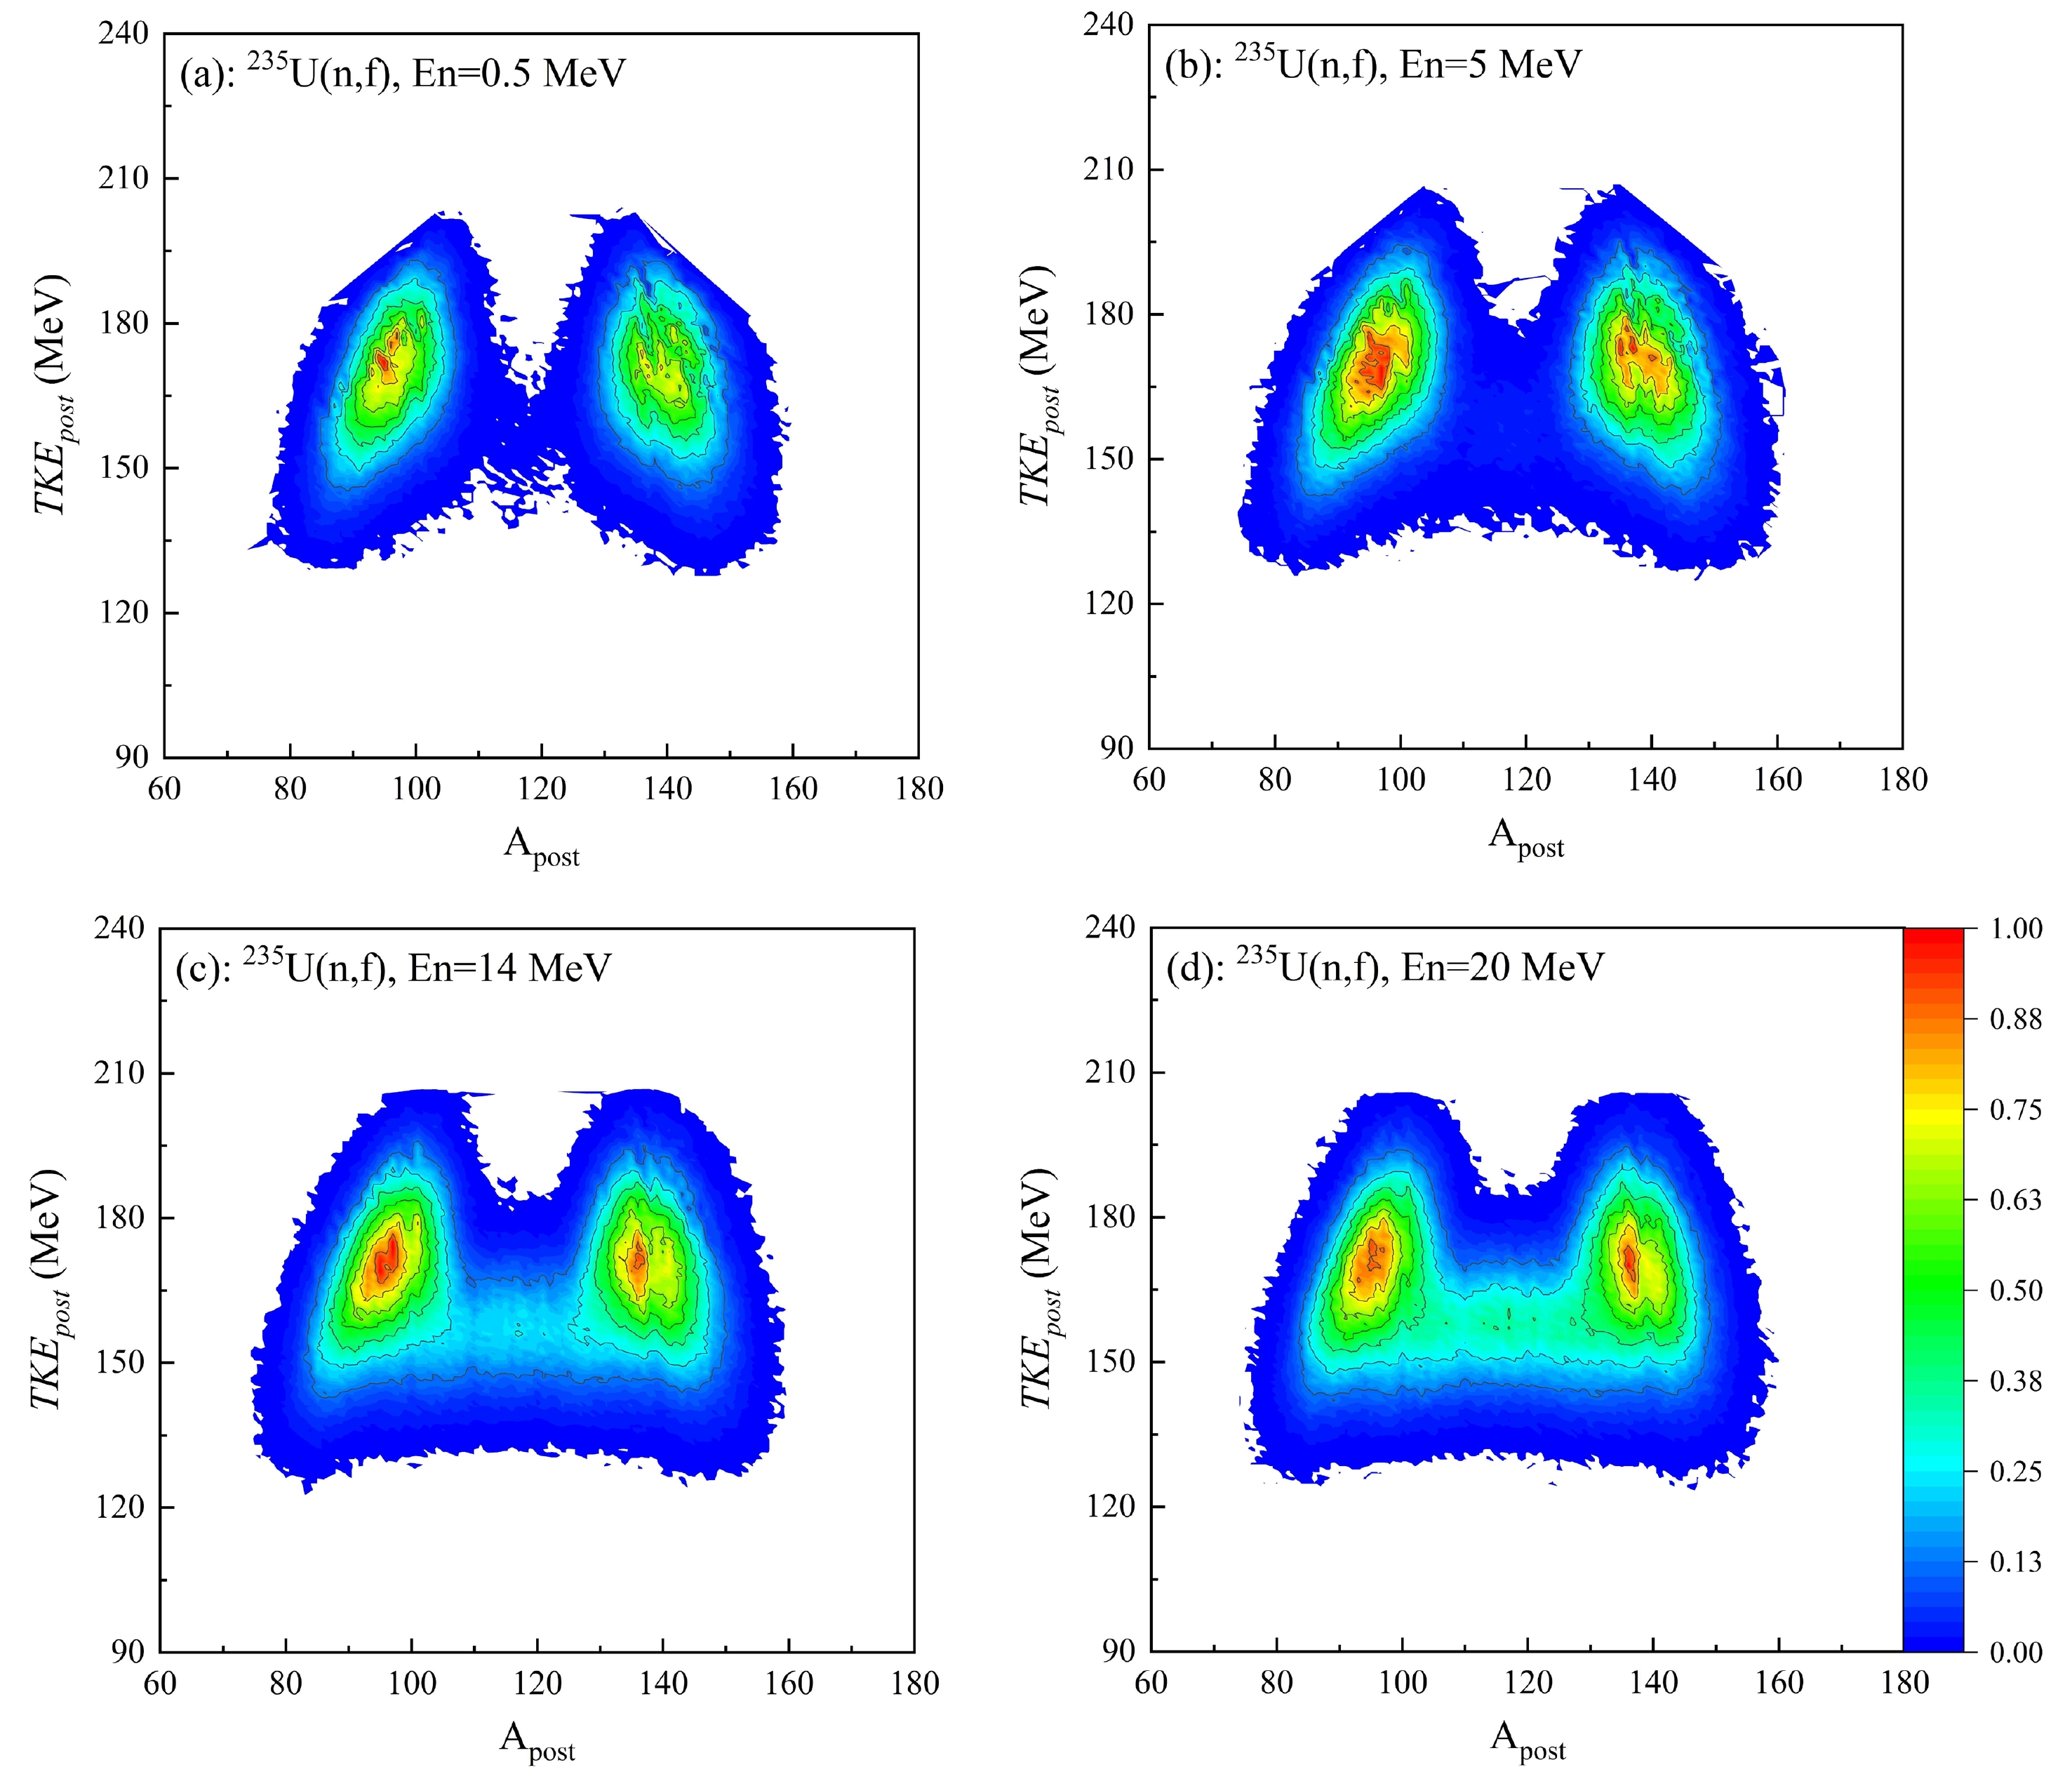
Figure 12. (color online) Calculation results of A-TKEpost two-dimensional distribution of fission fragments after neutron emission in the n+235U fission system for (a) En=0.5 MeV;(b) En=5 MeV;(c) En=14 MeV;and (d) En=20 MeV.
In addition, Fig. 12 shows that the regions of light and heavy fission fragments in the A-TKEpost two-dimensional spectrum are not completely symmetrical. Primary fission fragments emit instantaneous neutrons to form primary fission products, while light and heavy primary fission fragments have different excitation energy and mass numbers. The number of instantaneous neutrons emitted by them is not the same; by contrast, it presents a sawtooth distribution. This leads to a distribution of primary fission products after neutron emission which is not completely symmetrical.
-
The Potential-driving and GEF models exhibit specific strengths in calculating the independent yields of neutron-induced 235U(n, f) reactions. Notably, the results obtained from the Potential-driving Model surpass those derived from the G4ParaFission Model. Furthermore, our investigation addressed the energy dependence of independent yields for key products. Our findings indicate that the independent fission yield to the left of the new peak in charge mass distribution exhibits a positive dependence on energy, whereas the independent fission yield to the right side demonstrates a negative energy dependence. We calculated the cumulative yield of 95Zr, 99Mo, 140Ba, 144Ce, and 147Nd resulting from the fission of 235U to examine the energy dependence of their cumulative yield. According to the calculation results of the Potential-driving Model, the cumulative fission yields for 95Zr, 99Mo, 140Ba, and 144Ce exhibit negative energy dependence within the 0.1—20 MeV range. At low energy, the cumulative fission yield of 147Nd has a positive energy dependence. Given the limitations of the G4ParaFission Model in calculating the average total kinetic energy, we incorporated Madland's description of the relationship between incident neutron energy and
$\rm\overline {TK{E_{\rm pre}}}$ to investigate the physical characteristics of the average total kinetic energy after neutron emission. Compared with experimental data, we found that this approach accurately captures the distribution characteristics and underlying physical principles of the average total kinetic energy after neutron emission across diverse fission systems. Furthermore, it holds broad applicability.
Calculation of the energy dependence of fission fragments yields and kinetic energy distributions for neutron-induced 235U fission
- Received Date: 2024-02-28
- Available Online: 2024-08-15
Abstract: Fission fragments yields and average total kinetic energy are fundamental nuclear data for nuclear energy applications and the study of nuclear devices. Certain fission products, such as 95Zr, 99Mo, 140Ba, 144Ce, and 147Nd, serve as burnup monitors, assessing the number of fissions induced by neutrons on 235U. However, current experimental data for these fission products worldwide are inconsistent, introducing significant uncertainty into related scientific research. In this study, we employed the Potential-driving Model to calculate the independent yields of 235U and evaluate its advantages in such calculations. Additionally, we investigated the energy dependence of independent yields to select important products. Furthermore, we calculated the cumulative yields of 95Zr, 99Mo, 140Ba, 144Ce, and 147Nd, and compared them with existing literature data to explore the energy dependence of fission products for 235U. Given the lack of fission product yield data above 14.8 MeV, we extended our calculated incident neutron energy to 20 MeV, aiming to support future scientific research. The Geant4 physical model does not consider the influence of incident neutron energy on the average total kinetic energy of fission fragments; thus, we introduced the excitation function of the total kinetic energy of fission fragments recommended by Madland et al., which effectively describes the experimental data of the average total kinetic energy of fragments formed in 235U fission. In this paper, we comprehensively discuss the energy dependence of fission product yields and average total kinetic energy.


 DownLoad: