


 Abstract
 HTML
HTML Reference
 Related
 PDF
PDF


-
Neutron total cross sections are the most basic neutron cross section data and are important in nuclear physics theory, nuclear technology, and nuclear energy application [1]. Be metal is widely used in nuclear systems as a neutron moderator, neutron reflector, and neutron proliferating cladding material owing to its low atomic number and small thermal neutron absorption cross section [2]. As the development of fusion energy has become an inevitable trend, because Be is indispensable in the development of fusion reactors, including tokamak and star simulators, a higher accuracy of neutron total cross section data of 9Be is demanded with the new requirements [2, 3].
The 9Be (n, tot) cross section has previously been measured using time-of-flight (TOF) and transmission methods at some white neutron sources. Rapp et al. [2] measured the 9Be (n, tot) cross section in the neutron energy region of 0.4−20 MeV for Be at a photoneutron source with a relative uncertainty of 0.2%−5%. Danon et al. [3] measured the 9Be (n, tot) cross section in the neutron energy region of 24−940 keV for Be at the Gaerttner Laboratory at Rensselaer Polytechnic Institute with an accuracy of 1%. However, the results of Danon et al. with only 20 energy points are still biased from the evaluation results and other experimental results. Finlay et al. [4] measured the 9Be (n, tot) cross section in the neutron energy region of 5.29—500 MeV at the Weapons Neutron Research facility at Los Alamos National Laboratory with a normalization uncertainty of about 0.5%. Sugimoto et al. [5] measured the 9Be (n, tot) cross section in the neutron energy region of 1−10.84 MeV for Be at a 9Be (d, n) source at the 8 MeV Argonne Tandem Dynamitron Accelerator with a total uncertainty of 1%−5%. Scintillation detectors were used in these experiments and were sensitive to gamma rays. No experiment has yet measured the 9Be (n, tot) cross section in the energy range of 1 eV to 100 MeV. A review of the evaluated 9Be (n, tot) cross section reveals significant differences. Therefore, 9Be (n, tot) cross sections should be measured with high precision for a wide range at new white neutron sources.
The China Spallation Neutron Source (CSNS) [6], which was built in early 2018, generates neutrons by colliding 1.6 GeV protons with a thick tungsten target at a repetition rate of 25 Hz. Back-streaming neutrons filtered by cadmium sheets through the incoming proton channel at the spallation target station have been exploited as a white neutron beam facility (the so-called Back-n white neutron source) for nuclear data measurements. The Back-n white neutron source is one of the best white neutron sources in the world because its neutron beam is very intense at approximately
$2 \times {10}^{7}\text{n}/{\rm cm}^{2}/\rm s$ at 55 m from the target. Additionally, its excellent energy spectrum spans from 0.3 eV to 200 MeV with an excellent time resolution related to the TOF measurements.In this study, new measurements of the 9Be (n, tot) cross section were performed at the CSNS-Back-n white neutron source in double bunch mode using the Neutron Total Cross Sectional Spectrometer (NTOX). The NTOX is based on a multi-cell fast fission ionization chamber (FIC) with high-purity 235U and 238U. Because the fission cross sections of 235U and 238U are standard and the FIC is insensitive to gamma rays, measurements of neutrons in a wide energy range were achieved.
-
Neutron transmission is experimentally measured using the TOF method to calculate the neutron total cross section [2]. The transmission for each energy bin, which is the ratio of the neutron counts normalized by the proton counts for the sample-in and open beam, is determined using Eq. (1):
$ {T}_{\left(Ei\right)}=\frac{\left({C}_{I\left(Ei\right)}-{B}_{I\left(Ei\right)}\right)/{P}_{I}}{\left({C}_{O\left(Ei\right)}-{B}_{O\left(Ei\right)}\right)/{P}_{O}} , $

(1) where
$ {T}_{\left(Ei\right)} $ is the transmission in the neutron energy$ Ei $ ;$ {C}_{I\left(Ei\right)} $ and$ {C}_{O\left(Ei\right)} $ are the neutron counts for the sample-in and sample-out measurements at$ {E}_{i} $ , respectively, which can be obtained by analyzing the signal waveforms from the FIC;$ {B}_{I\left(Ei\right)} $ and$ {B}_{O\left(Ei\right)} $ are the background counts for the sample-in and sample-out measurements, respectively, which can be analyzed using the signal waveforms and background experiment as described in Section IV.D;$ {P}_{I} $ and$ {P}_{O} $ are proton counts given by the accelerator monitor for the sample-in and sample-out measurement, respectively.Using the transmission data, we can obtain the total cross section using Eq. (2):
$ {\sigma }_{\left(Ei\right)}=-\frac{1}{nl}\mathrm{ln}{T}_{\left(Ei\right)} , $

(2) where
$ {\sigma }_{\left(Ei\right)} $ is the experimental neutron total cross section;$ nl $ is the number of atoms per unit area of the sample as described in Sec. III.B. -
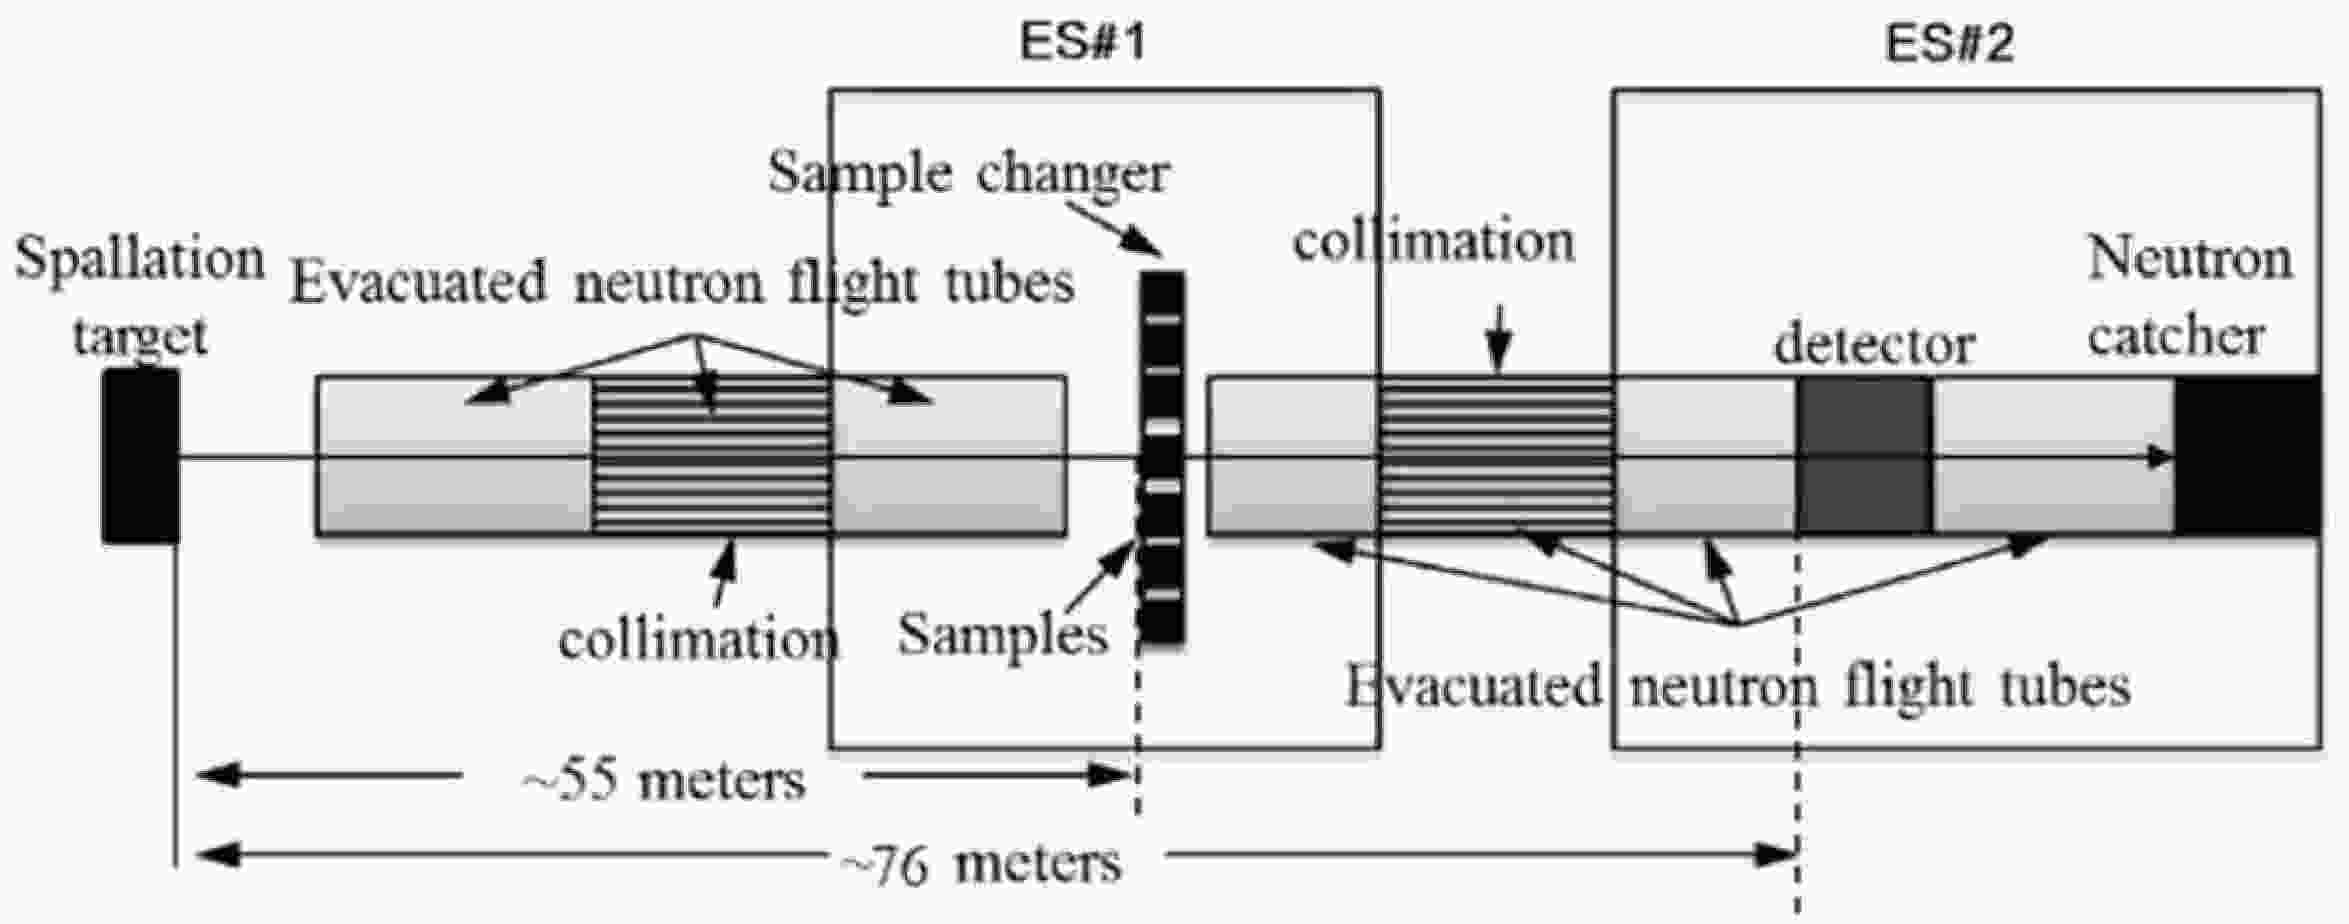
This experiment was performed at Back-n beam line of the CSNS. The experimental setup is shown in Fig.1 [6]. A Be sample was fixed on the sample changer and placed at ES#1 about 55 m from the spallation target, and the FIC detector was placed at ES#2 about 76 m from the spallation target. The distance of approximately 20 m between the sample and the detector ensured that almost all the scattered neutrons from the sample would be cleaned to avoid a background signal at the detector. These constituted the geometrical arrangement of the NTOX. The neutron source, sample, detector, and data collection are described in Sections III.A, B, and C, respectively.
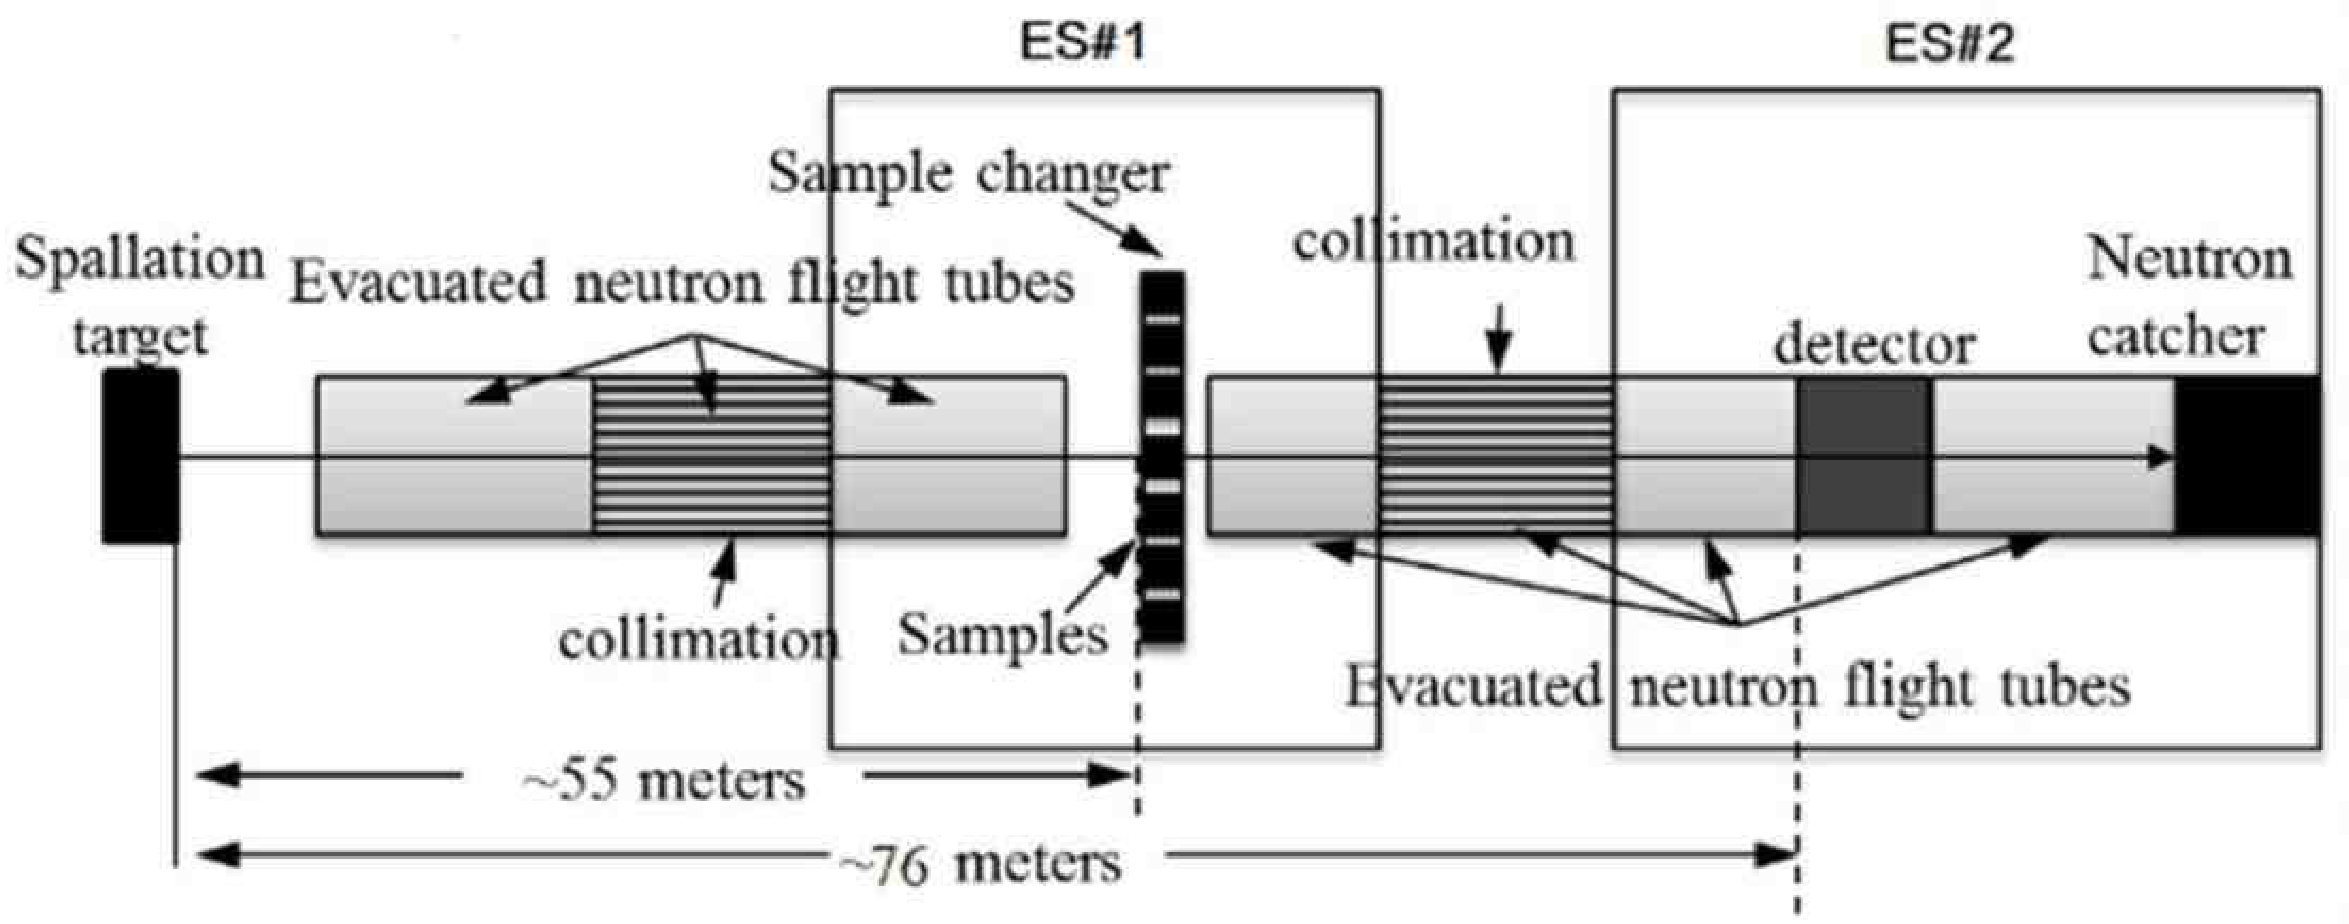
Figure 1. Experimental setup showing the flight path, samples, and detector locations.
-
This measurement was performed in the normal double-bunch mode with a pulse repetition rate of 25 Hz. Each proton pulse had two bunches with a time interval of 410 ns and a discrepancy of less than 1% in intensity between them [7]. The beam power was about 100 kW. The corresponding proton bunches were accumulated in the Rapid Cycling Synchrotron (RCS), and each Gauss-type bunch had a pulse width of about 60 ns (FWHM). The diameters of neutron beam spots at ES1 and ES2 were 60 and 30 mm, respectively.
-
A condition to satisfy in the transmission experiment was that the neutrons detected by the detector should all pass through the sample without colliding with it. Therefore, we selected Be samples with a diameter of 70 mm.
To reduce the statistical error and the influence of in-scattering (the incident neutron collides with the sample nucleus but scatters from near angle zero and is detected by the FIC), the neutron transmission through the sample should be between 0.5−0.7 [8]. To select the appropriate thickness of the sample, we obtained the transmission curves of neutron with Back-n white spectral distribution passing through the Be samples with three thicknesses using an MCNP5 simulation from 1 eV to 20 MeV (Fig. 2). According to the transmission curves, we selected the Be samples with thicknesses of about 10, 20, and 30 mm to perform the neutron total cross section experiments.
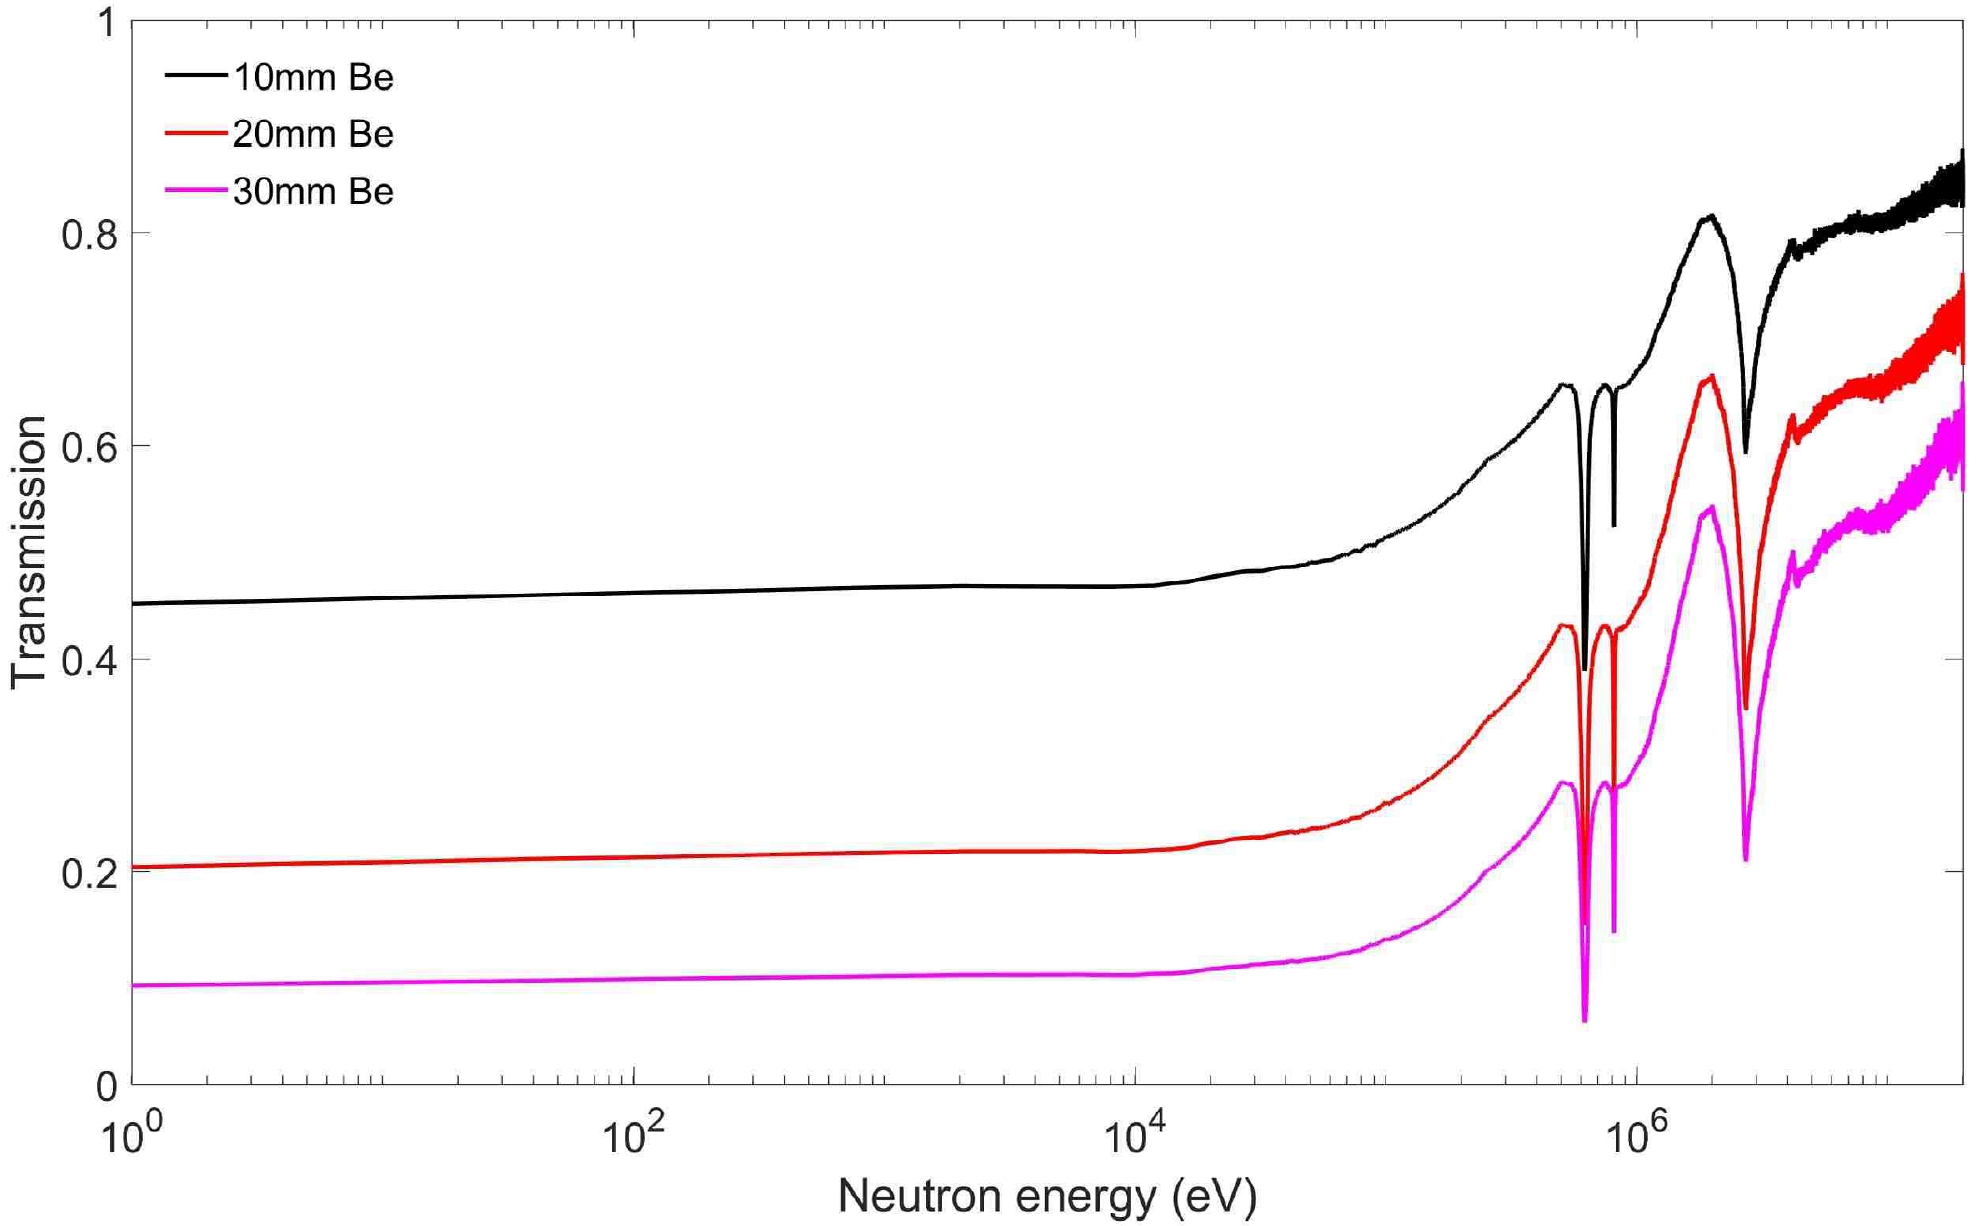
Figure 2. (color online) Simulated transmission curves using MCNP5 simulation from 1 eV to 20 MeV with Back-n white spectra distribution passing through three Be samples with different thicknesses.
The diameters, thicknesses, and masses of the samples were measured using a vernier caliper, spiral micrometer, and electronic scales, respectively, several times. The synthetic uncertainty was obtained by calculating the uncertainties of types A (caused by the finite number of measurements) and B (caused by the measuring instrument itself).
Atomic surface density is measured indirectly, and its synthetic uncertainty is generated through direct measurement, which can be expressed as Eq. (3):
$ {\rho }_{S}=nl=\frac{4Nm}{\pi M{D}^{2}}, $

(3) where
$ N $ is Avogadro's number,$ D $ is the diameter,$ M $ is the mass number, and$ m $ is the mass.The purity of the three Be samples used was 99.9%. The physical parameters and uncertainties of the samples are shown in Table 1. The densities calculated from the measured data were within 1/1000 of the standard density of Be, which is 1.848 g/cm3.
Sample Diameter/mm Thickness/mm Mass/g Atomic density/(atoms/barns) Combined uncertainty (%) Calculated density/(g/cm3) Be-1 70.00±0.02 9.99±0.004 71.1472±0.001 0.12366±0.00007 0.06 1.849 Be-2 70.00±0.02 20.00±0.004 142.1155±0.001 0.24701±0.00014 0.06 1.847 Be-3 70.00±0.02 29.99±0.004 213.2921±0.001 0.37072±0.00021 0.06 1.848 Table 1. Physical parameters and combined uncertainties of the samples.
-
The FIC [9], based on the fission reaction of 235U and 238U with neutrons, was placed at ES#2 of the CSNS-Back-n to measure the fission count-neutron energy spectra of the sample-in and sample-out states. The schematic structure of the FIC and the physical picture placed on the beamline are shown in Fig. 3.
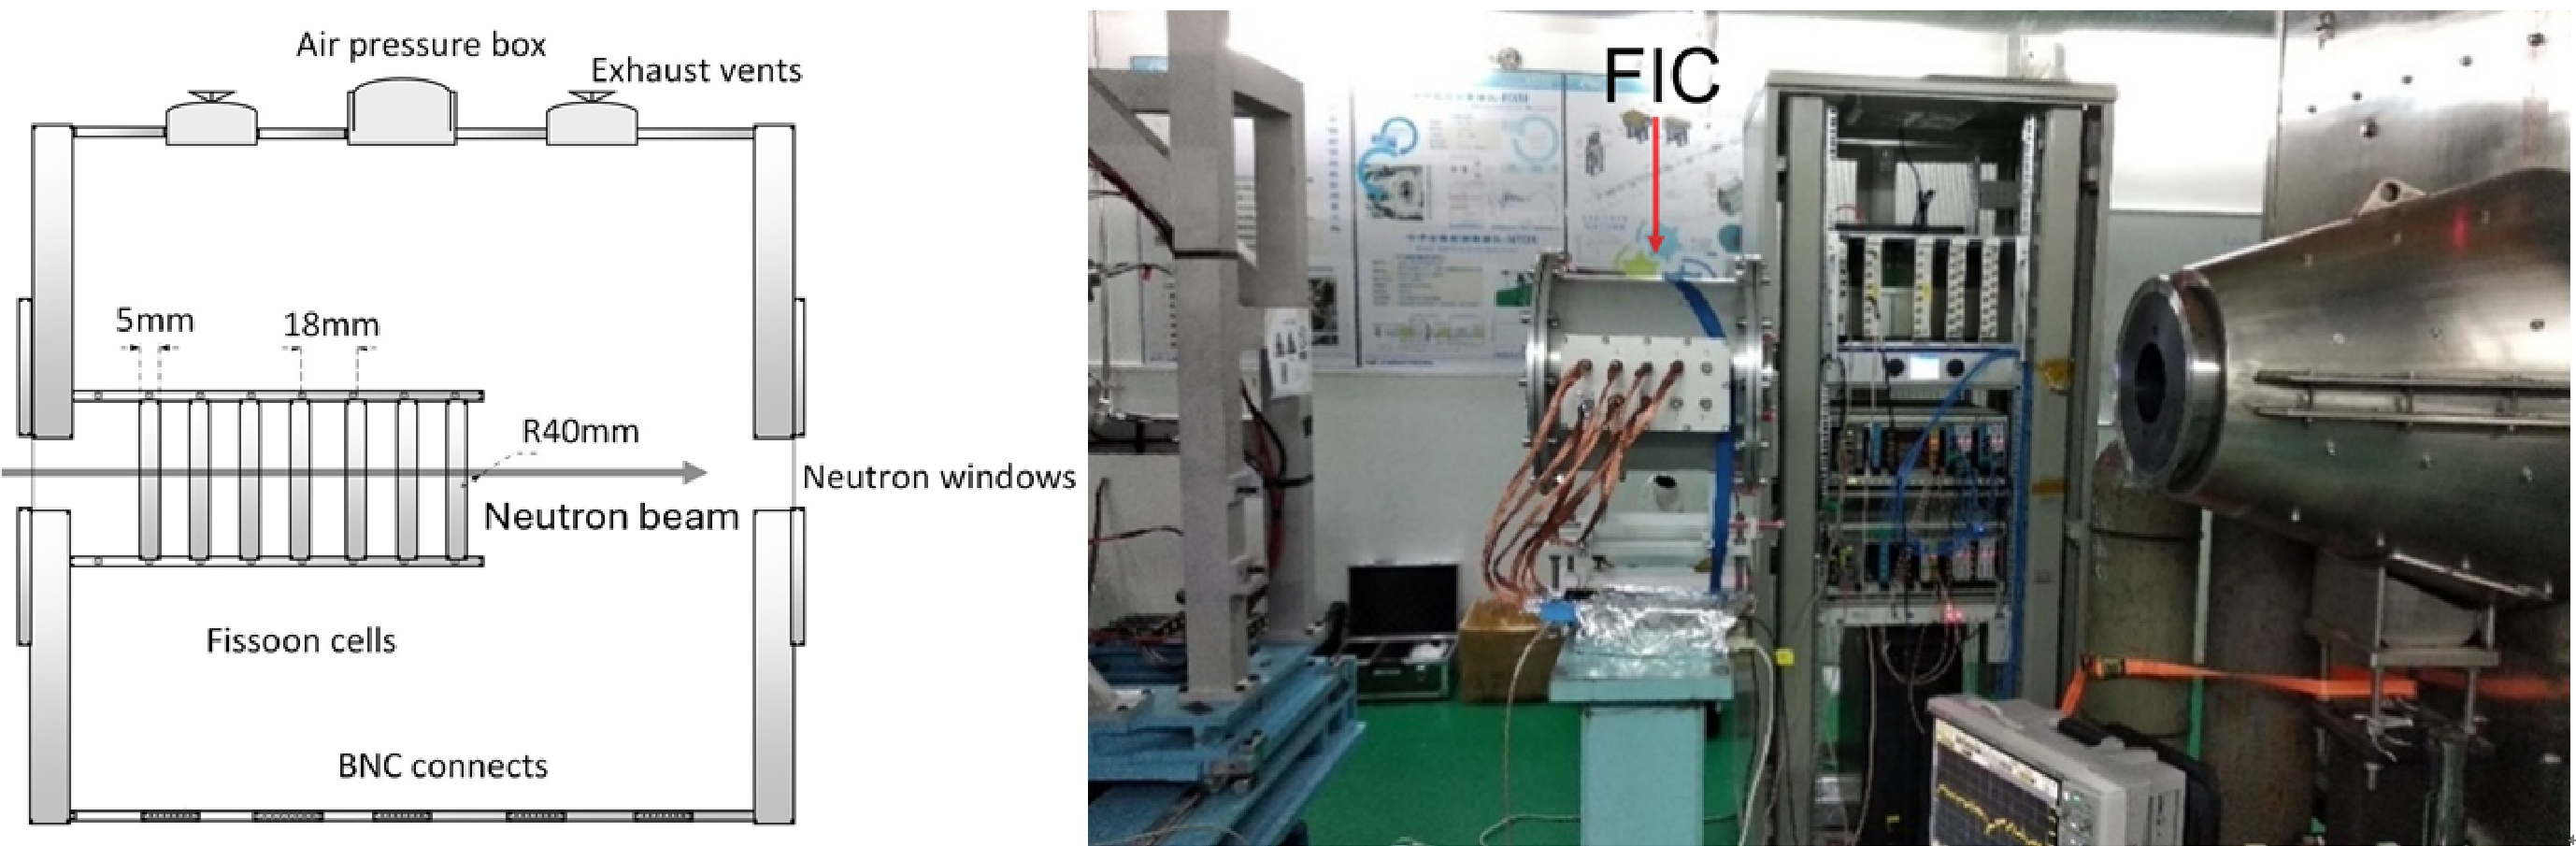
Figure 3. (color online) Schematic structure (Left) and physical picture (Right) in the experiment of the FIC.
The interior of the FIC is primarily composed of seven fission chamber units (Th-1, Th-2, and Th-3 were not used this experiment and are used in fission experiments.), and each unit is composed of a cathode, anode, working gas, and structural material. The distance between the two electrodes is 5 mm. The diameter of the electrode plate is 80 mm, and the middle of the cathode is coated with a 50 mm diameter fission material. The main parameters of the layer on the cathode plates are shown in Table 2.
Coating type Mass/mg Uncertainty (%) Plate type Plate thickness
/mm235U-1 5.173 1.0 stainless 0.02 235U-2 6.319 0.9 Al 0.09 Th-1 3.477 1.2 Al 0.09 Th-2 3.207 1.3 Al 0.09 Th-3 3.372 1.3 Al 0.09 238U-1 4.991 1.1 stainless 0.02 238U-2 4.987 1.1 stainless 0.02 Table 2. Main parameters of the layer on the cathode plates.
After the FIC was evacuated, it was flushed with a mixture gas of 90% Ar and 10% CF4 to a pressure of 800 mbar, and a high voltage (+200 V) between electrodes was designed to provide electrons with a sufficient drift velocity of about 6 × 10⁴ m/s [9].
The FIC signal was connected to an MSI-8 preamplifier (large amplification, fast response, low noise) that satisfied the timing requirements of the TOF method through the BNC connects, and then, the output was sent to a data acquisition system (DAQ) via a T signal. The DAQ included a signal conditioning module (SCM), field digitizing module (FDM), trigger and clock module (TCM), and data center for storing waveform data. The block diagram of the signal transmission and DAQ system is described in detail in an article by our partner members [9].
-
This experiment was performed with sample-out and 10, 20, and 30 mm Be sample-in states in the CSNS-Back-n beam, and the background was measured without the neutron beam. The corresponding experimental times were about 11, 35, 40, 56, and 35 h. The experimental data of 235U and 238U cells were analyzed through the ROOT software package developed by CERN based on C++ [10].
-
The signal waveforms of the 235U and 238U FIC through the T output port of the MSI-8 preamplifier obtained by the DAQ are shown in Fig. 4. Two γ-flashes with an interval of 410 ns reaching the FIC at the speed of light were immediately detected by interacting with the working gas, and subsequent arriving neutrons were recorded by interacting with the fission material to produce high-energy fission fragments. The γ-flash and fission signals could be distinguished by the amplitude of ADC channel and time; therefore, we could determine the neutron energy using the TOF method.
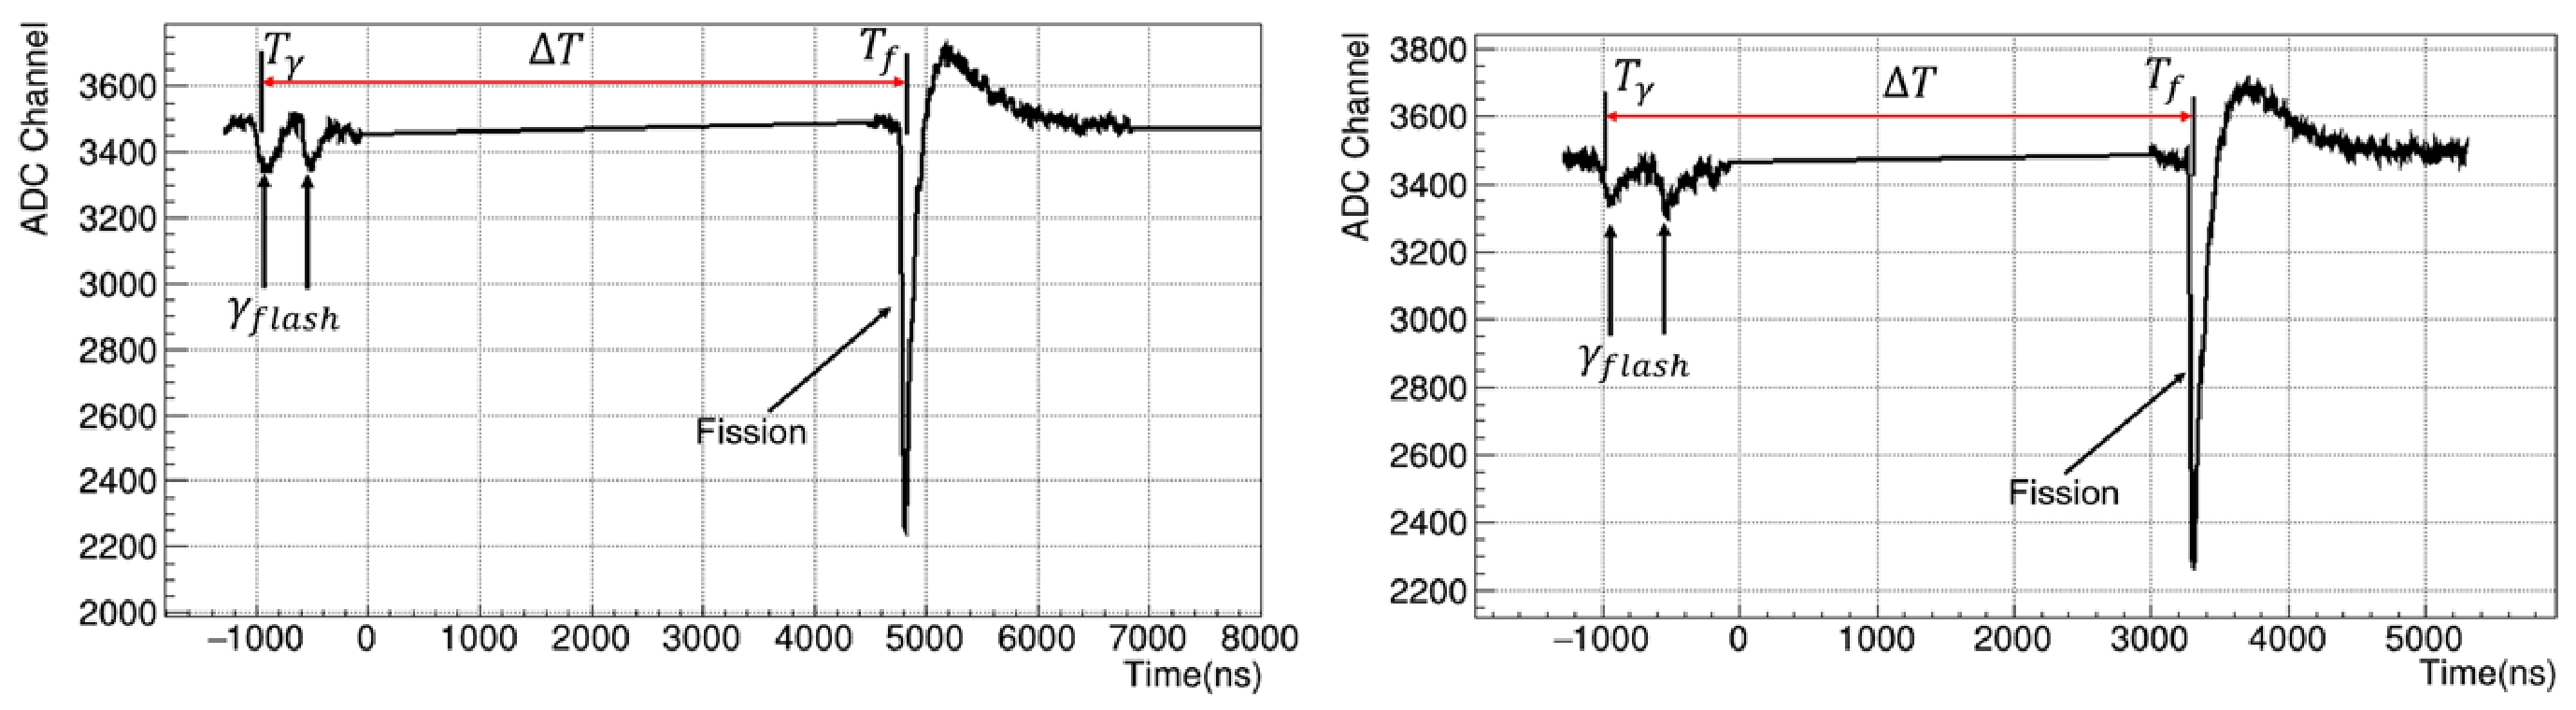
Figure 4. (color online) Signal waveforms obtained using the DAQ. Left: Signal waveform of the 235U FIC. Right: Signal waveform of the 238U FIC.
-
Waveform smoothing and constant fraction timing methods can be used to detect fission. We estimate that the time at which the neutron reaches the fission chamber is when it is detected, and the time at which the neutron is generated is when the γ-flash is detected minus the time it takes to fly this distance (L) at the speed of light (C).
Thus, the flight time (
$ Tof $ ) of the neutrons satisfies Eq. (4):$ Tof={T}_{f}-\left({T}_{\gamma }-\frac{L}{C}\right). $

(4) Considering relativistic effects, the energy of the neutron can be expressed as Eq. (5):
$ {E}_{n}={m}_{n}{c}^{2}\left(\frac{1}{\sqrt{1-{\beta }_{n}^{2}}}-1\right), $

(5) where
$ {m}_{n} $ is the rest mass of the neutron, and$ {\beta }_{n} $ is the relativistic factor and satisfies Eq. (6):$ {\beta }_{n}=\frac{{V}_{n}}{c}=\frac{L}{c\times Tof}. $

(6) Therefore, the time interval (
$ \Delta T $ ) between$ {T}_{f} $ and$ {T}_{\gamma } $ , the flight distance ($ L $ ), and the neutron energy ($ {E}_{n} $ ) satisfy Eq. (7):$ {T}_{f}-{T}_{\gamma }=\frac{L}{c}\cdot \left[\left({\sqrt{1-{\left(\dfrac{1}{\dfrac{{E}_{n}}{{m}_{n}\cdot {c}^{2}}+1}\right)}^{2}}}\right)^{-1}-1\right]. $

(7) The fission signal counts measured using 235U is positively correlated with the evaluated fission cross section data. Therefore, the fission cross section-energy distribution can be converted into the fission cross section distribution to
$ {T}_{f}-{T}_{\gamma } $ using Eq. (7) at the corresponding geometric distance of 76 m and then compared with the experimental measured$ {T}_{f}-{T}_{\gamma } $ distribution. By constantly changing the value of the geometric distance until the peak of the measured$ {T}_{f}-{T}_{\gamma } $ distribution and the$ {T}_{f}-{T}_{\gamma } $ distribution converted from the evaluated cross section coincide exactly in the 1−20 eV energy region, as shown in Fig. 5, we obtained the true flight distances of the 235U-1 and 235U-2 fission units as 77.570 and 77.588 m, respectively.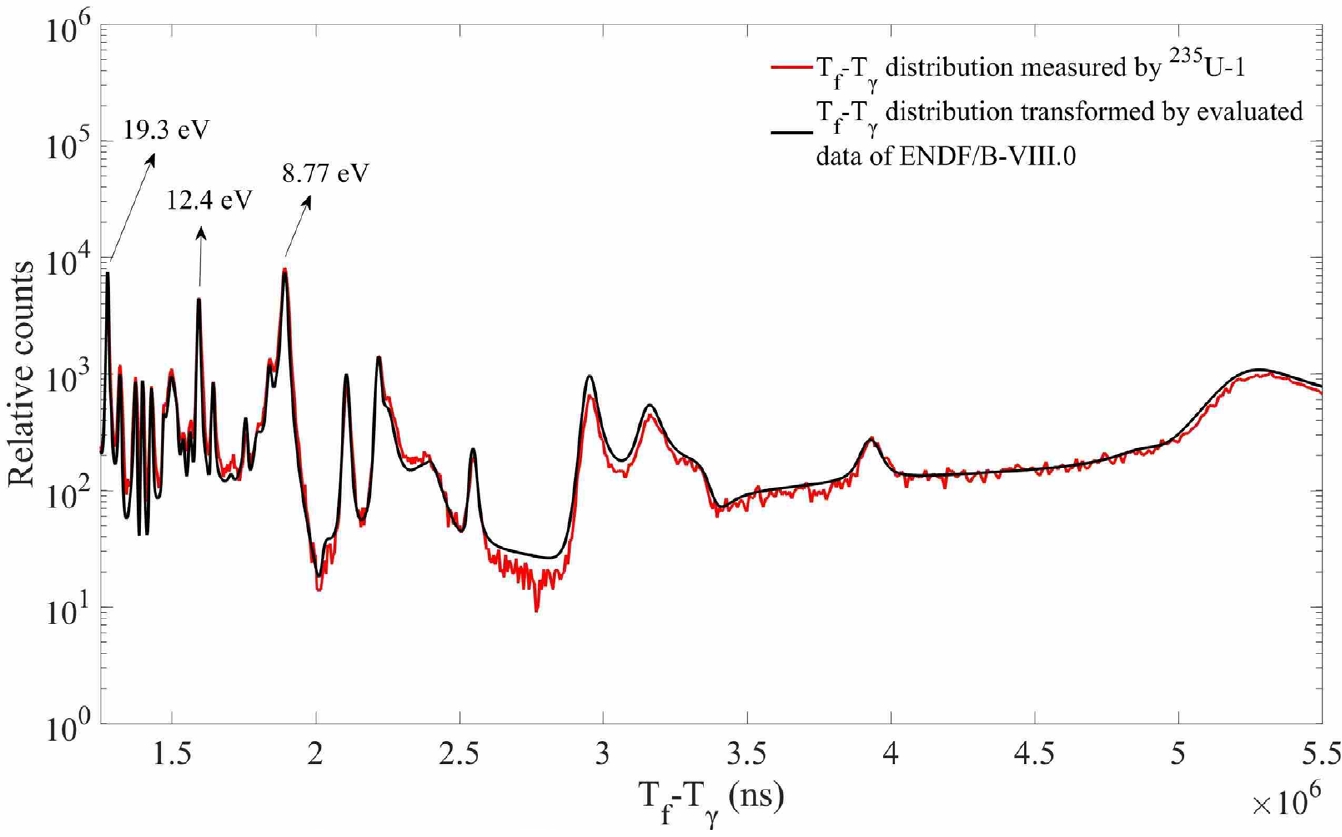
Figure 5. (color online)
$ {T}_{f}-{T}_{\gamma } $ distribution measured using 235U-1 and transformed by evaluated data of ENDF/B-Ⅷ.0 in the energy range of 1−20 eV.With the same method, the flight path distance of the other 235U cell was obtained. The flight path distance of the two 238U cells were determined based on the geometric distance between cells, as shown in Table 3.
Fission cell L/m 235U-1 77.570 235U-2 77.588 238U-1 77.660 238U-2 77.678 Table 3. Flight path distance of the 235U and 238U fission cells.
-
Because the magnification times of each channel of the MSI-8 preamplifier in this experiment was different, we analyzed the amplitude distribution of each channel to determine the threshold of the fission signal. The amplitude distributions of 235U-1, 235U-2, 238U-1, and 238U-2 are shown in Fig. 6.
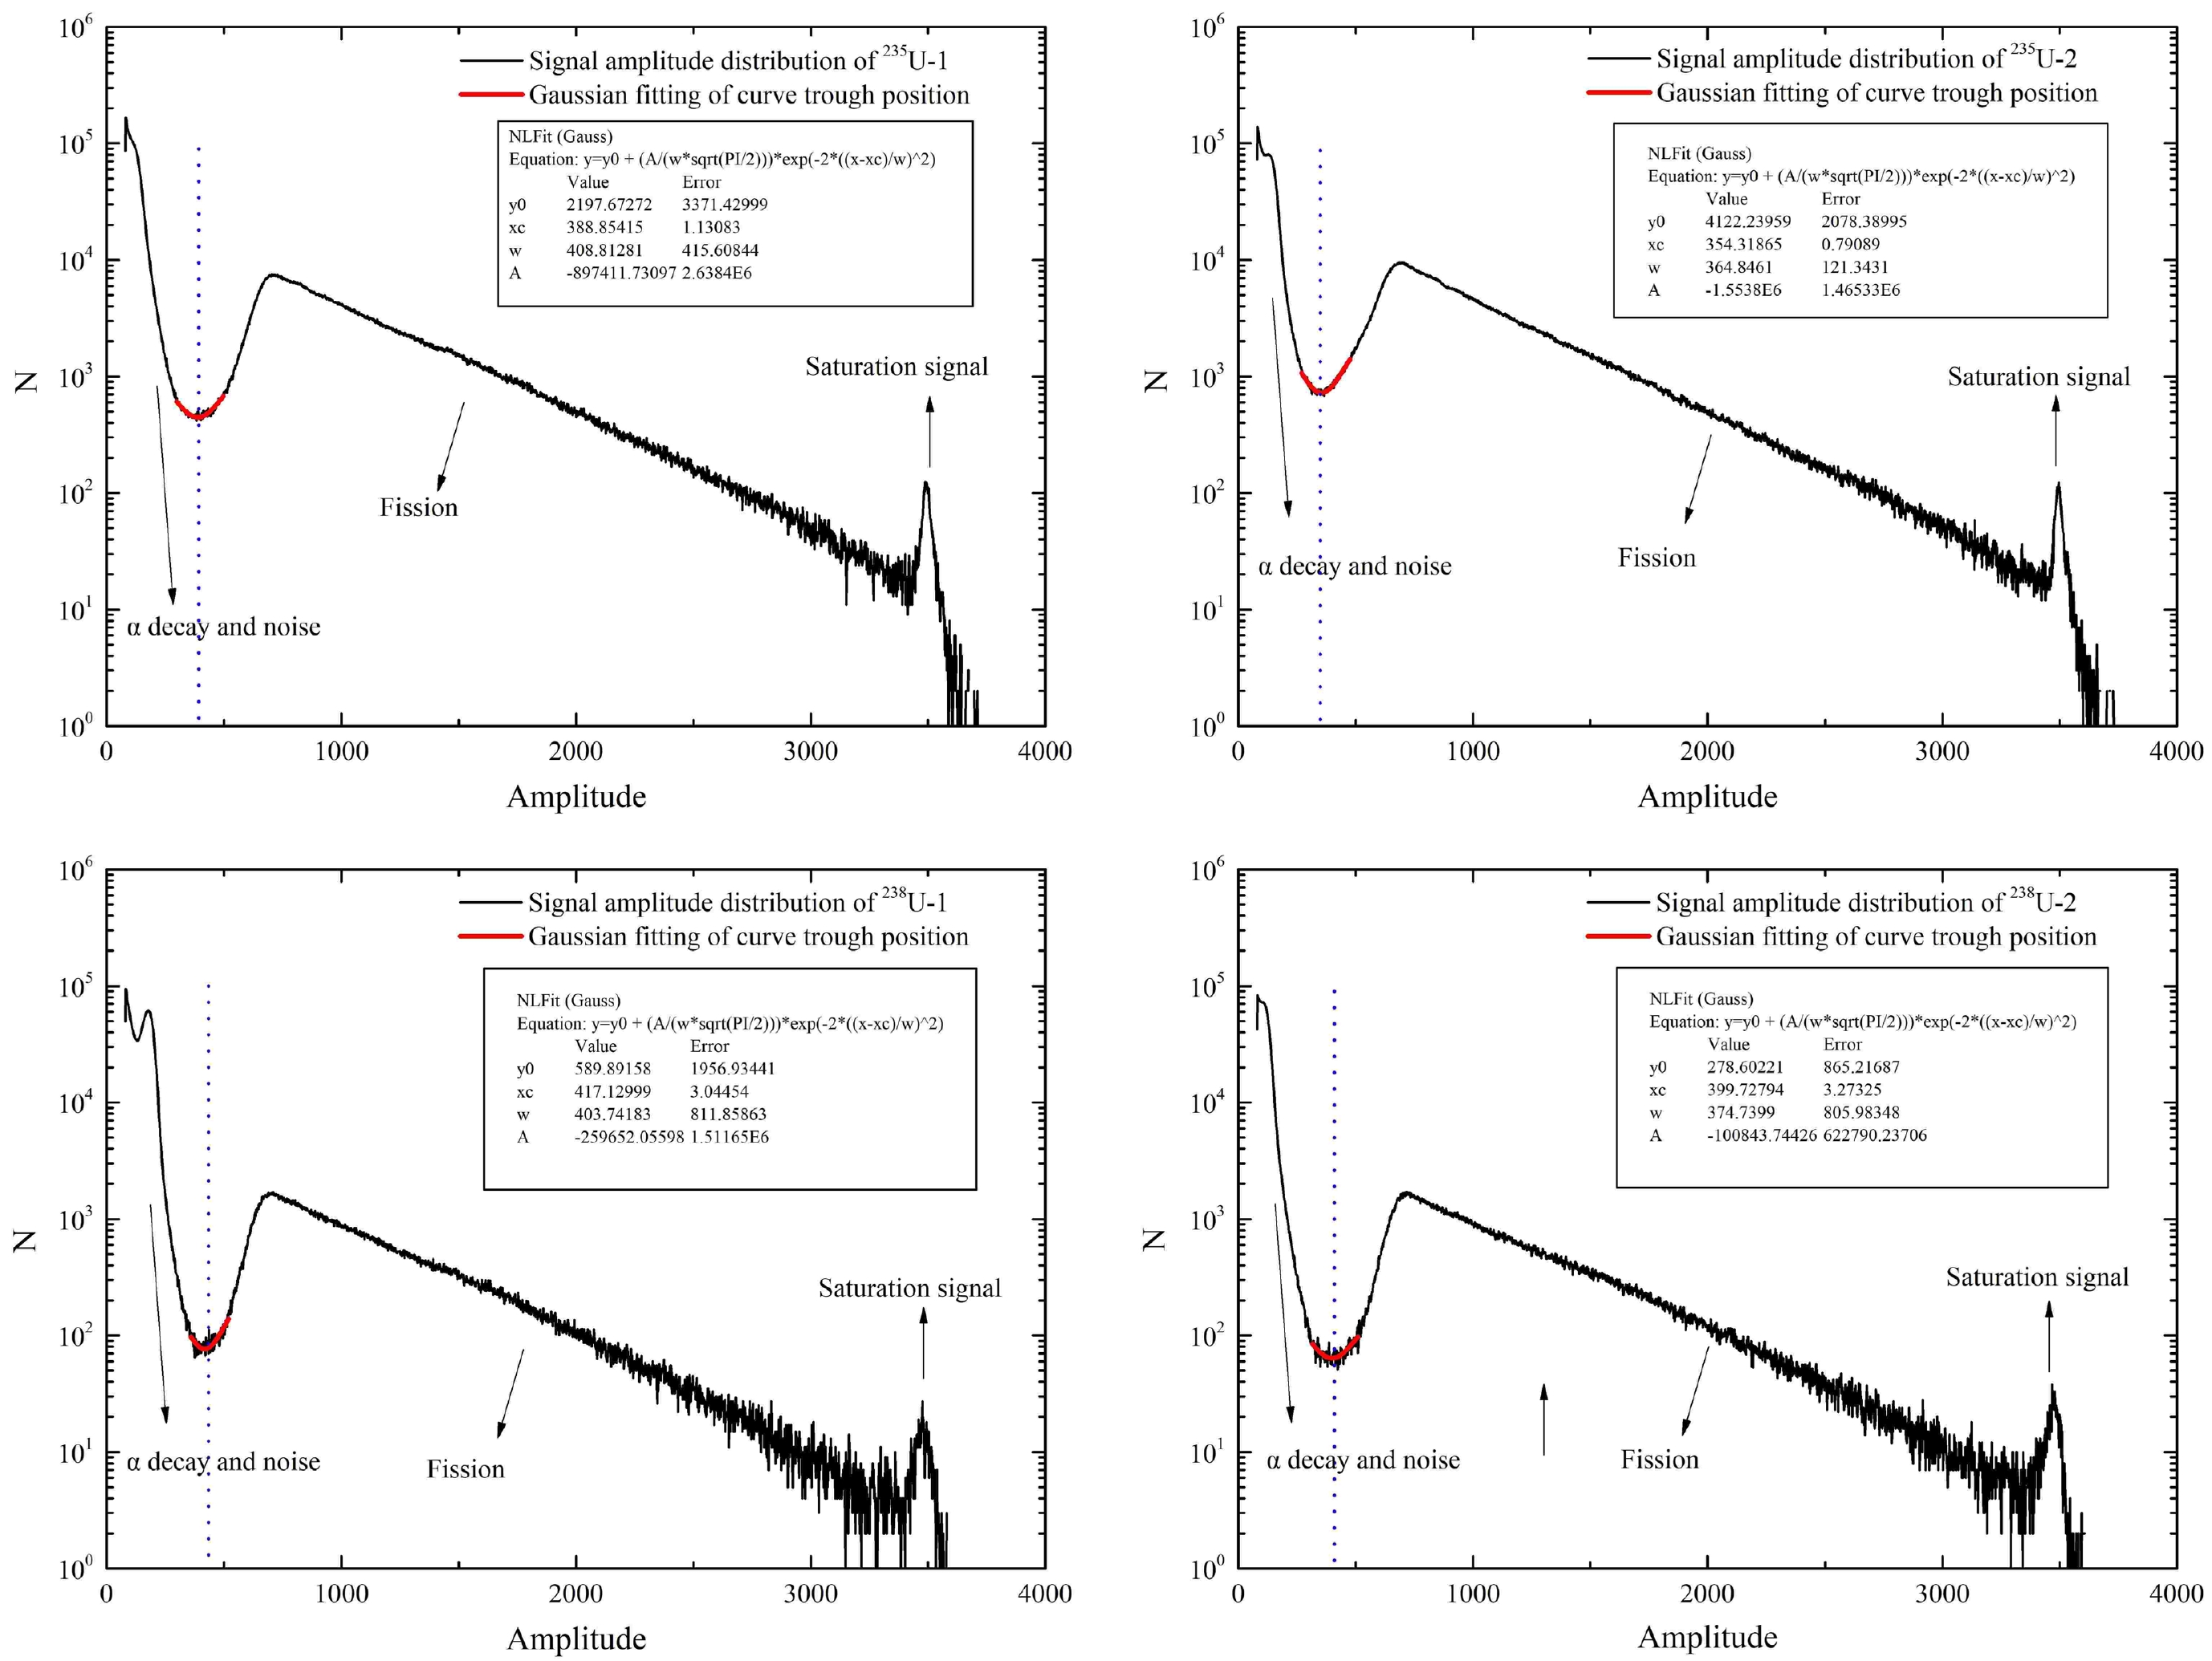
Figure 6. (color online) Amplitude distributions of 235U-1, 235U-2, 238U-1, and 238U-2. The dashed blue line represents the threshold selected at the center of the valley. The distribution below the threshold is primarily alpha signal and noise. The distribution above the threshold is primarily the fission signal induced by a neutron.
A valley area was observed in the distribution of the amplitude. The part of the small signal amplitude was primarily α and noise signals, and the part of the large signal amplitude was primarily caused by the fission fragments generated by neutron-induced fission reactions. The Gaussian curve was fitted with the middle of the valley area to set the threshold of the fission signal. The selected threshold of each channel is shown in Table 4. Because the magnification of the preamplifier was too large, the saturation signal appeared.
Fission cell 235U-1 235U-2 238U-1 238U-2 Fission threshold (channel) 389 354 417 400 Table 4. Fission thresholds of 235U-1, 235U-2, 238U-1, and 238U-2.
-
The backgrounds of the neutron total cross section experiment can be considered as time-dependent and time-independent [11]. The time-dependent background is primarily the scattered neutrons generated by the neutron beam interacting with the shielding or structural materials and samples. Members of our cooperative group [11,12] previously verified that this background has a negligible effect on the measurement of the total cross section through absorption plate experiments and with Monte Carlo simulations. The time-independent background primarily includes the environmental neutron and spontaneous decay backgrounds caused by the fission material in the chamber. The environmental background was measured by the team members [12] using the Bonner sphere spectrometer, and the results showed that the environmental neutron background satisfied the standard of nuclear data measurement. The background caused by the fission chamber was deducted by setting the fission signal threshold. In addition, the cross section of the 235U and 238U detector cells for γ rays is much smaller than that for neutrons. Therefore, the γ background has no effect.
-
As mentioned in Section III.A, this measurement was performed in the normal double-bunch mode with a time interval of 410 ns. The distribution of a low-energy neutron (<10 keV) need not to be unfolded because the TOF value is sufficiently large [13]. The neutron with the energy from 10 keV to 120 MeV detected at ES#2 would have a relative uncertainty of about 0.7% to 73% caused by the 410 ns interval and must be unfolded. In the data analysis, a time threshold was set to exclude neutrons above 120 MeV, because the small neutron flux, γ-flash interference, and flight time of less than 500 ns increase the neutron count error. A program package DemoUnfoldingv3.4 based on the Bayesian unfolding method was developed and tested in our Back-n group. The Bayesian unfolding iterative algorithm [14] can be expressed as Eq. (8):
$ {C}_{i}^{(k+1)}={E}_{i}\frac{{C}_{i}^{\left(k\right)}}{{C}_{i-\Delta }^{\left(k\right)}+{C}_{i}^{\left(k\right)}}+{E}_{i+\Delta }\frac{{C}_{i}^{\left(k\right)}}{{C}_{i}^{\left(k\right)}+{C}_{i+\Delta }^{\left(k\right)}}. $

(8) where
$ {E}_{i} $ is the count of the$ {i}_{th} $ TOF bin in the double-bunch mode,$ {C}_{i} $ is the$ {i}_{th} $ bin count in the single-bunch mode, the superscript$ k $ indicates the$ {k}_{th} $ iteration, and$ \Delta $ is the number of bins corresponding to an offset of 410 ns ($ \Delta $ = 410 ns/w, where w is the bin width in unit of ns). The criterion of stopping the iteration was determined by the likelihood maximization value and the Chi-square value, and$ k $ was set to 4 in this study. Figure 7 shows the function curves of the Chi-Square and Likelihood value of the representative 235U-2 with the number of iterations.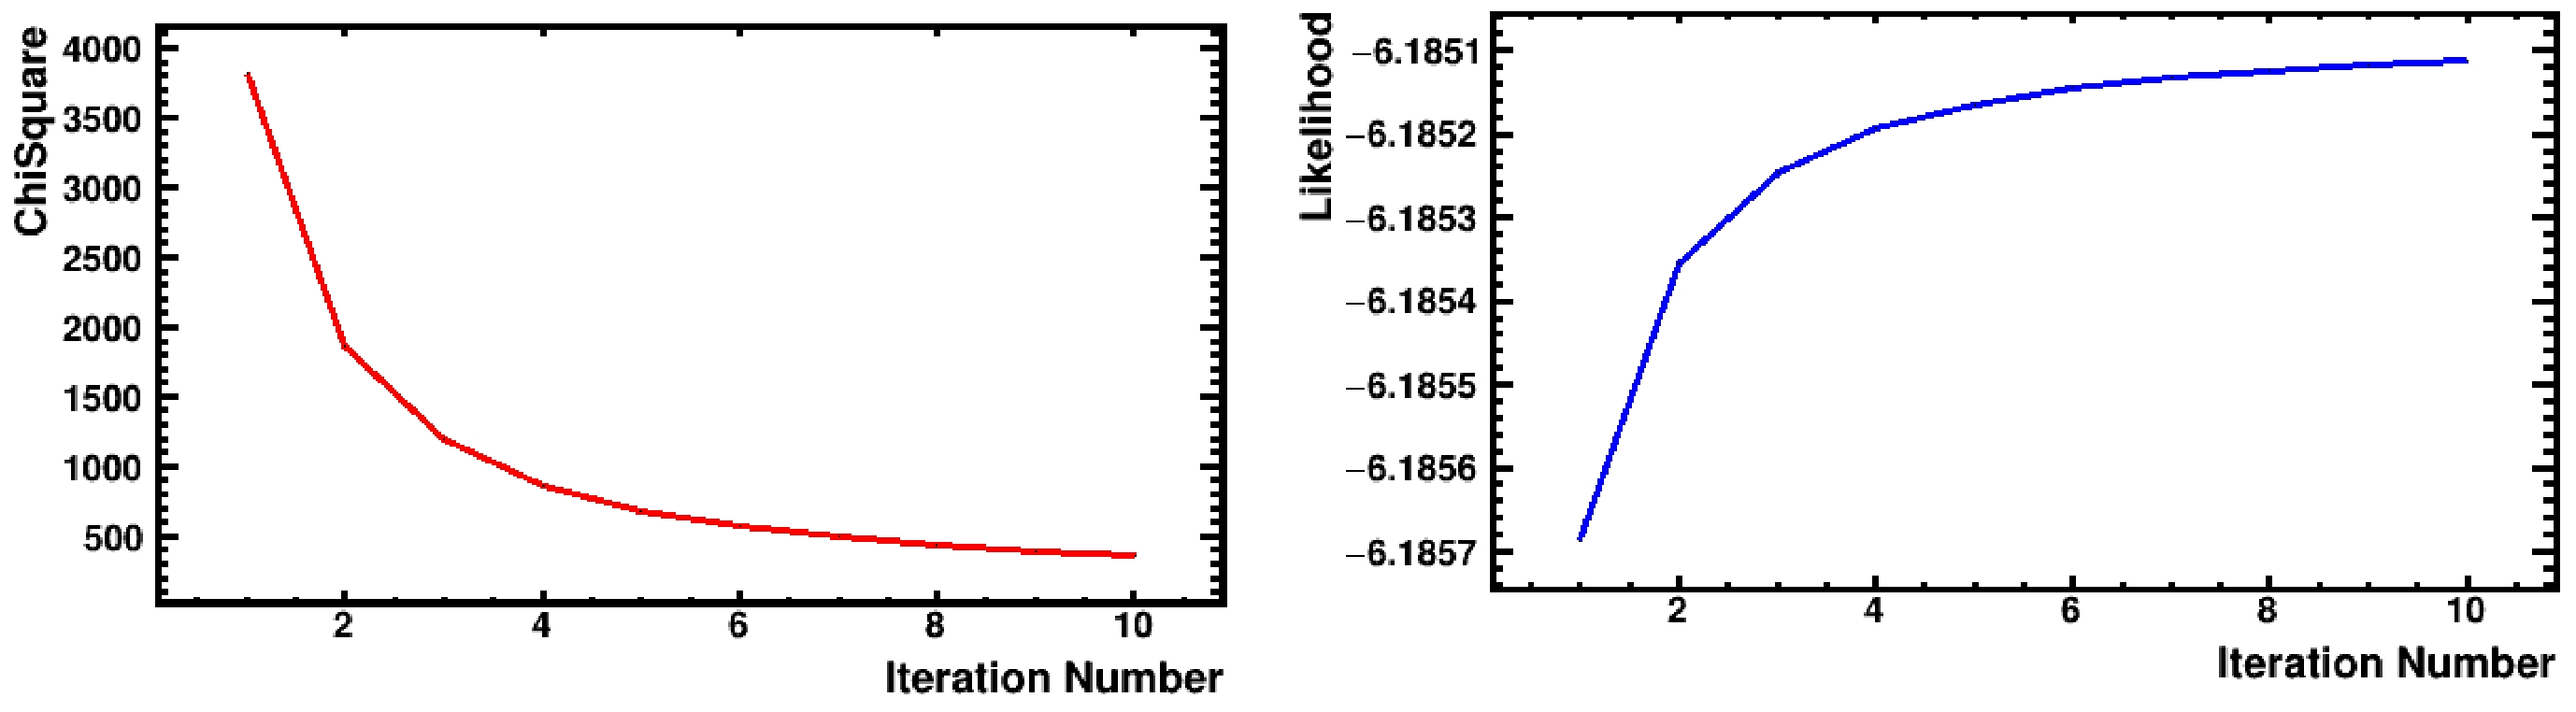
Figure 7. (color online) Function curves of the Chi-Square and Likelihood value of the representative 235U-2 with the number of iterations.
After the unfolding iterations [13], the covariances of the bin count in the unfolded distribution can be evaluated using Eq. (9). In Fig. 8, the two images on the left are the double bunch and unfolded TOF spectra, and those on the right are the distributions of unfolding errors according to Eq. (9).
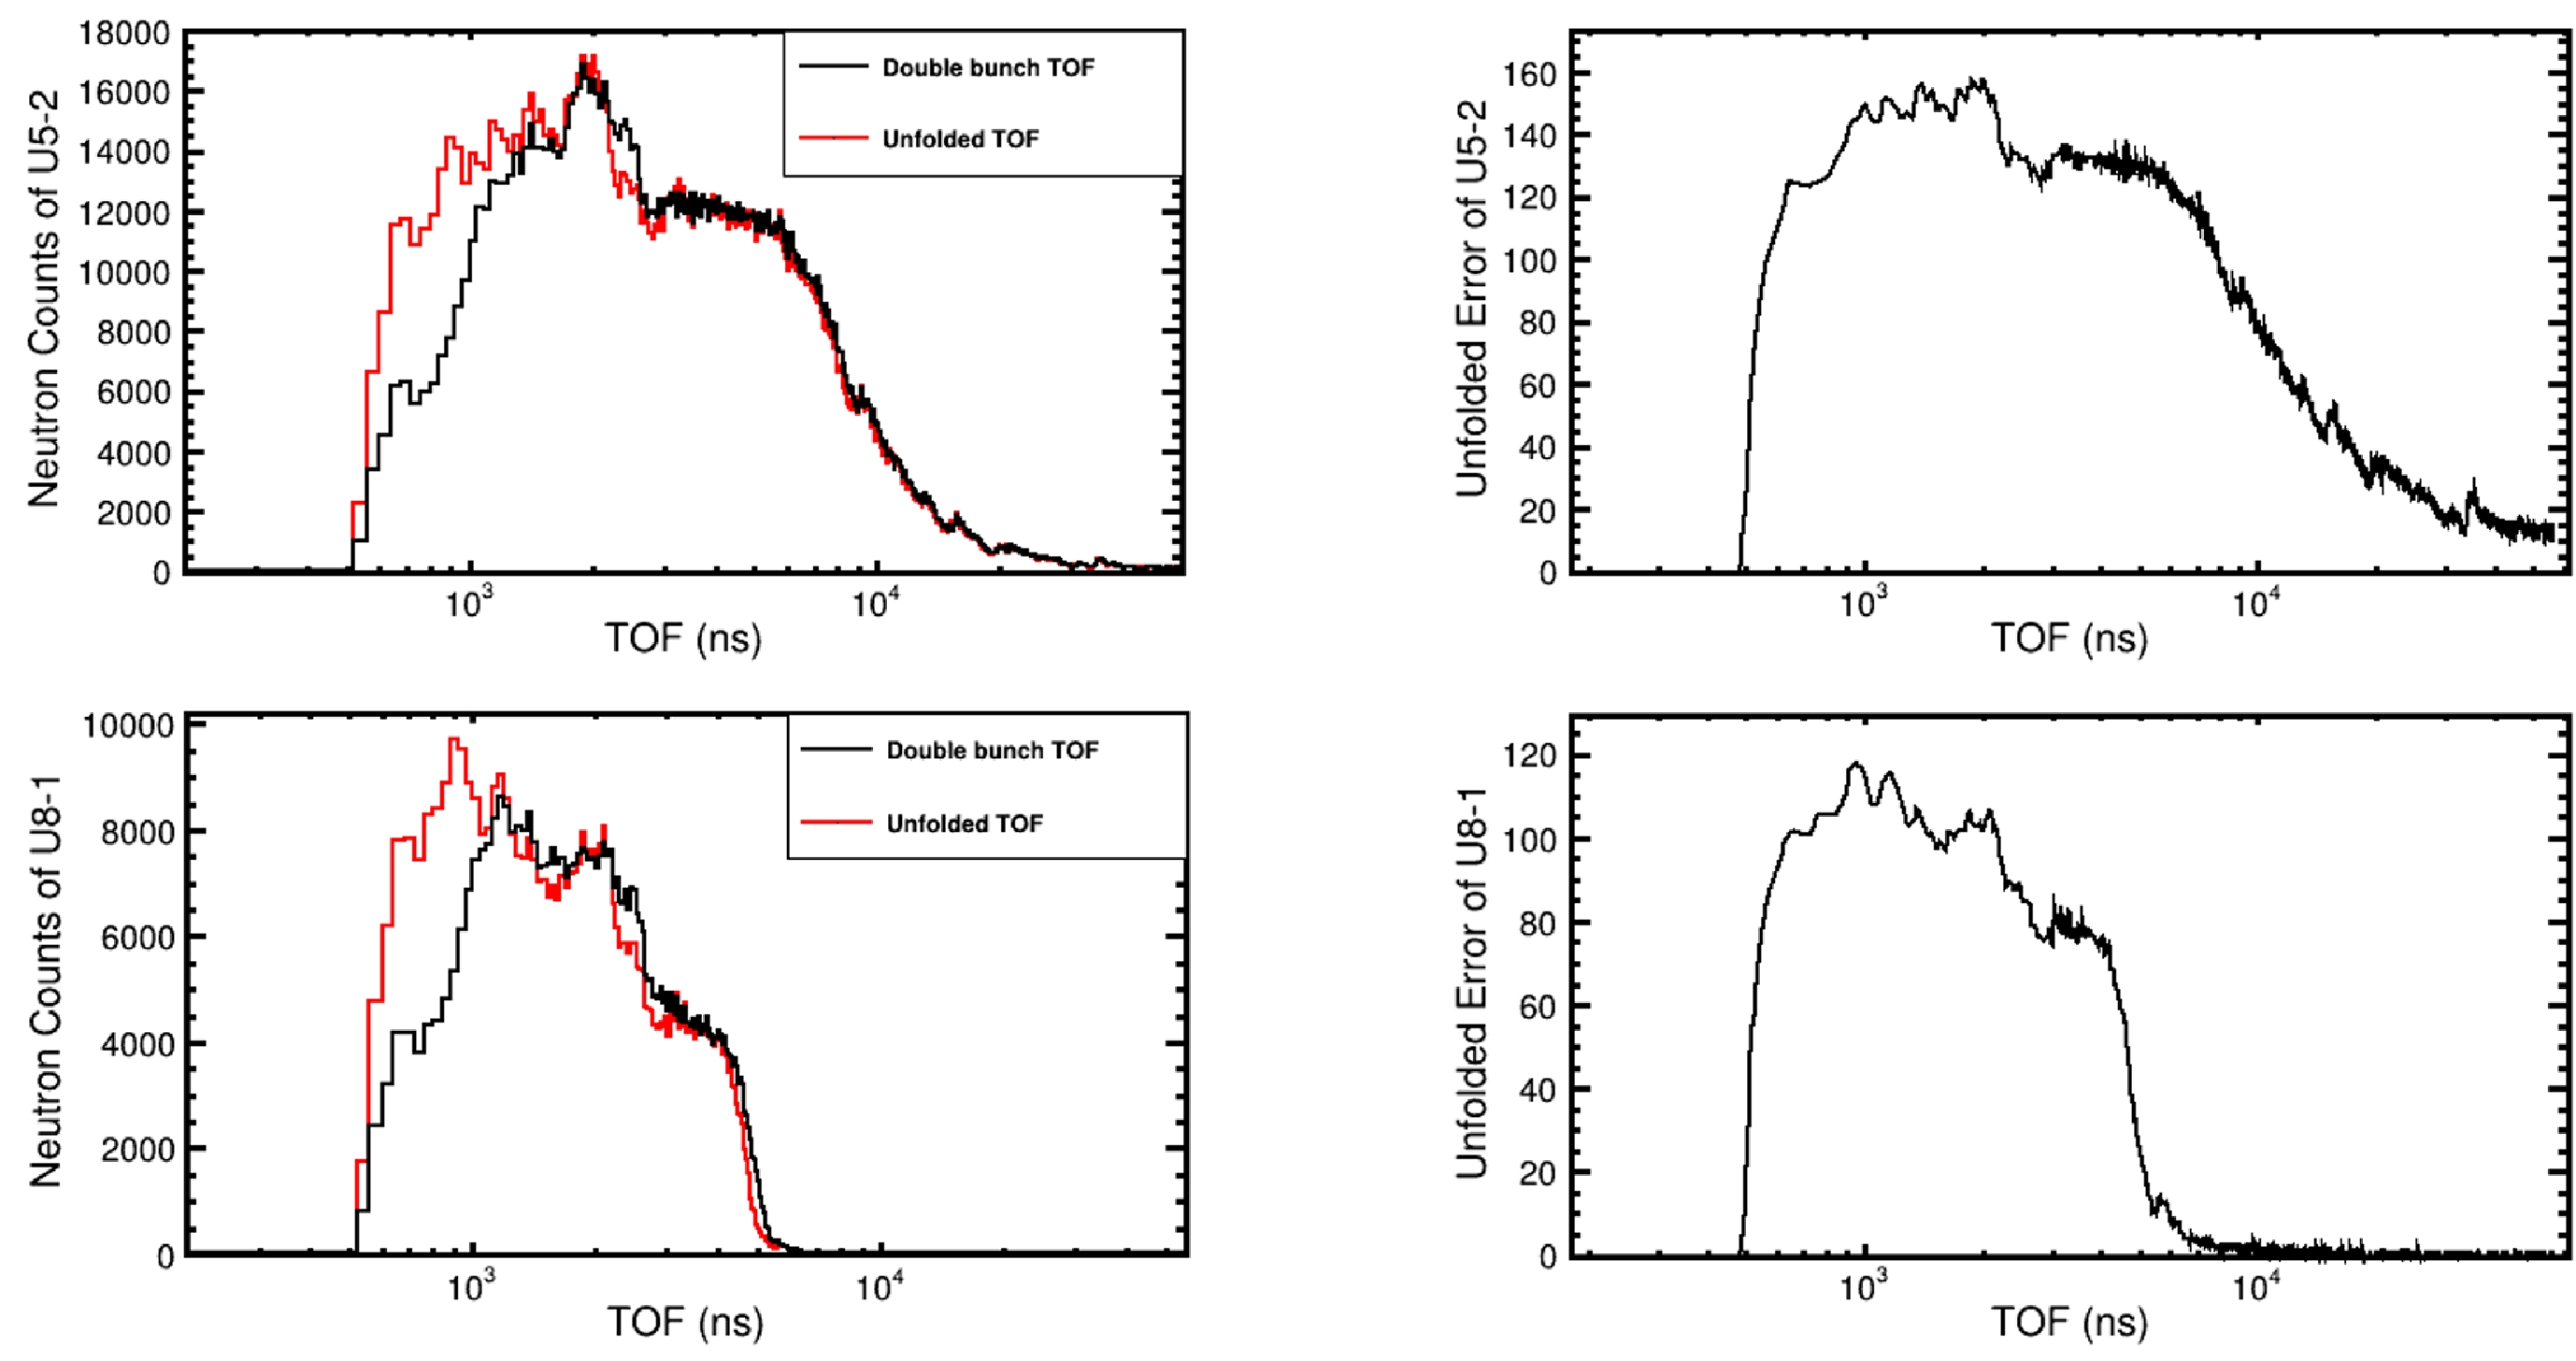
Figure 8. (color online) (Left) Comparisons of the double bunch and unfolded TOFs obtained using 235U-2 and 238U-1; (Right) distributions of the unfolded errors of 235U-2 and 238U-1.
$ Cov\left[{C}_{i}^{\left(k\right)},{C}_{j}^{\left(k\right)}\right]=\sum _{m,n}\frac{\partial {C}_{i}^{\left(k\right)}}{\partial {E}_{m}}\frac{\partial {C}_{j}^{\left(k\right)}}{\partial {E}_{n}}Cov\left[{E}_{m},{E}_{n}\right] . $

(9) By comparing the double bunch and unfolded TOF spectra of 235U-2 in Fig. 8, we can observe that the secondary opportunity fission peaks [15] at a TOF value of approximately 1800 ns in the unfolded TOF spectra are separated. The unfolded error includes both unfolding error and statistical error, which is used in Section V.D to calculate the relative error of transmission and total cross section. Using the same unfolding method, we unfolded the results of all measurement states.
-
The unfolded TOF distribution can be converted to the neutron energy spectrum using Eqs. (5) and (6). The proton bunches are accumulated in the RCS. The number of protons per bunch is used to normalize the neutron counts and recorded using a proton monitor. The bin width of each TOF bin is 40 ns in double bunch unfolding. To improve the neutron counts in the low energy region, when converting the TOF spectra to the energy spectra, we combined the TOF bins as shown in Table 5. The TOF relative errors in the low energy region caused by combining of the TOF bins increased owing to the low neutron count in the low energy region. In the future, we will continue to optimize the method of combining bins. The normalized neutron spectra of 235U-1, 235U-2, 238U-1, and 238U-2 are shown in Fig. 9.
TOF (ns) region Bin width/ns TOF relative errors Energy/eV Energy points number 520−3120 120 3.8%−23.0% 3.3E6−1.2E8 22 3120−3640 40 1.1%−1.3% 2.4E6−3.2E6 12 3640−6120 120 2.0%−3.3% 8.5E5−2.3E6 21 6120−6320 40 0.6%−0.7% 7.9E5−8.3E5 5 6320−6920 120 1.7%−1.9% 6.7E5−7.7E5 5 6920−7320 40 0.5%−0.6% 5.9E5−6.5E5 9 7320−10000 120 1.2%−1.6% 3.1E5−5.8E5 23 1E4−1.3E4 200 1.5%−2.0% 1.9E5−3.1E5 15 1.3E4−1.7E4 400 2.4%−3.0% 1.1E5−1.8E5 10 1.7E4−2.4E4 800 3.3%−4.7% 5.6E4−1.0E5 9 2.4E4−2.9E4 1600 5.0%−6.7% 4.0E4−5.0E4 3 2.9E4−5.5E4 4000 7.3%−13.8% 1.1E4−3.3E4 7 5E4−1E5 1E4 10.0%−20.0% 3.5E3−1.0E4 5 1E5−4.75E5 2.5E4 5.3%−25% 1.5E2−2.5E3 15 4.75E5−1E6 5E4 4.9%−10.5% 31.5−1.3E2 11 1E6−2E6 2.5E5 12.3%−24.4% 8.7−23.8 4 2E6−1E7 8E5 8.0%−39.5% 0.34−5.3 10 Table 5. Method of combining bins.
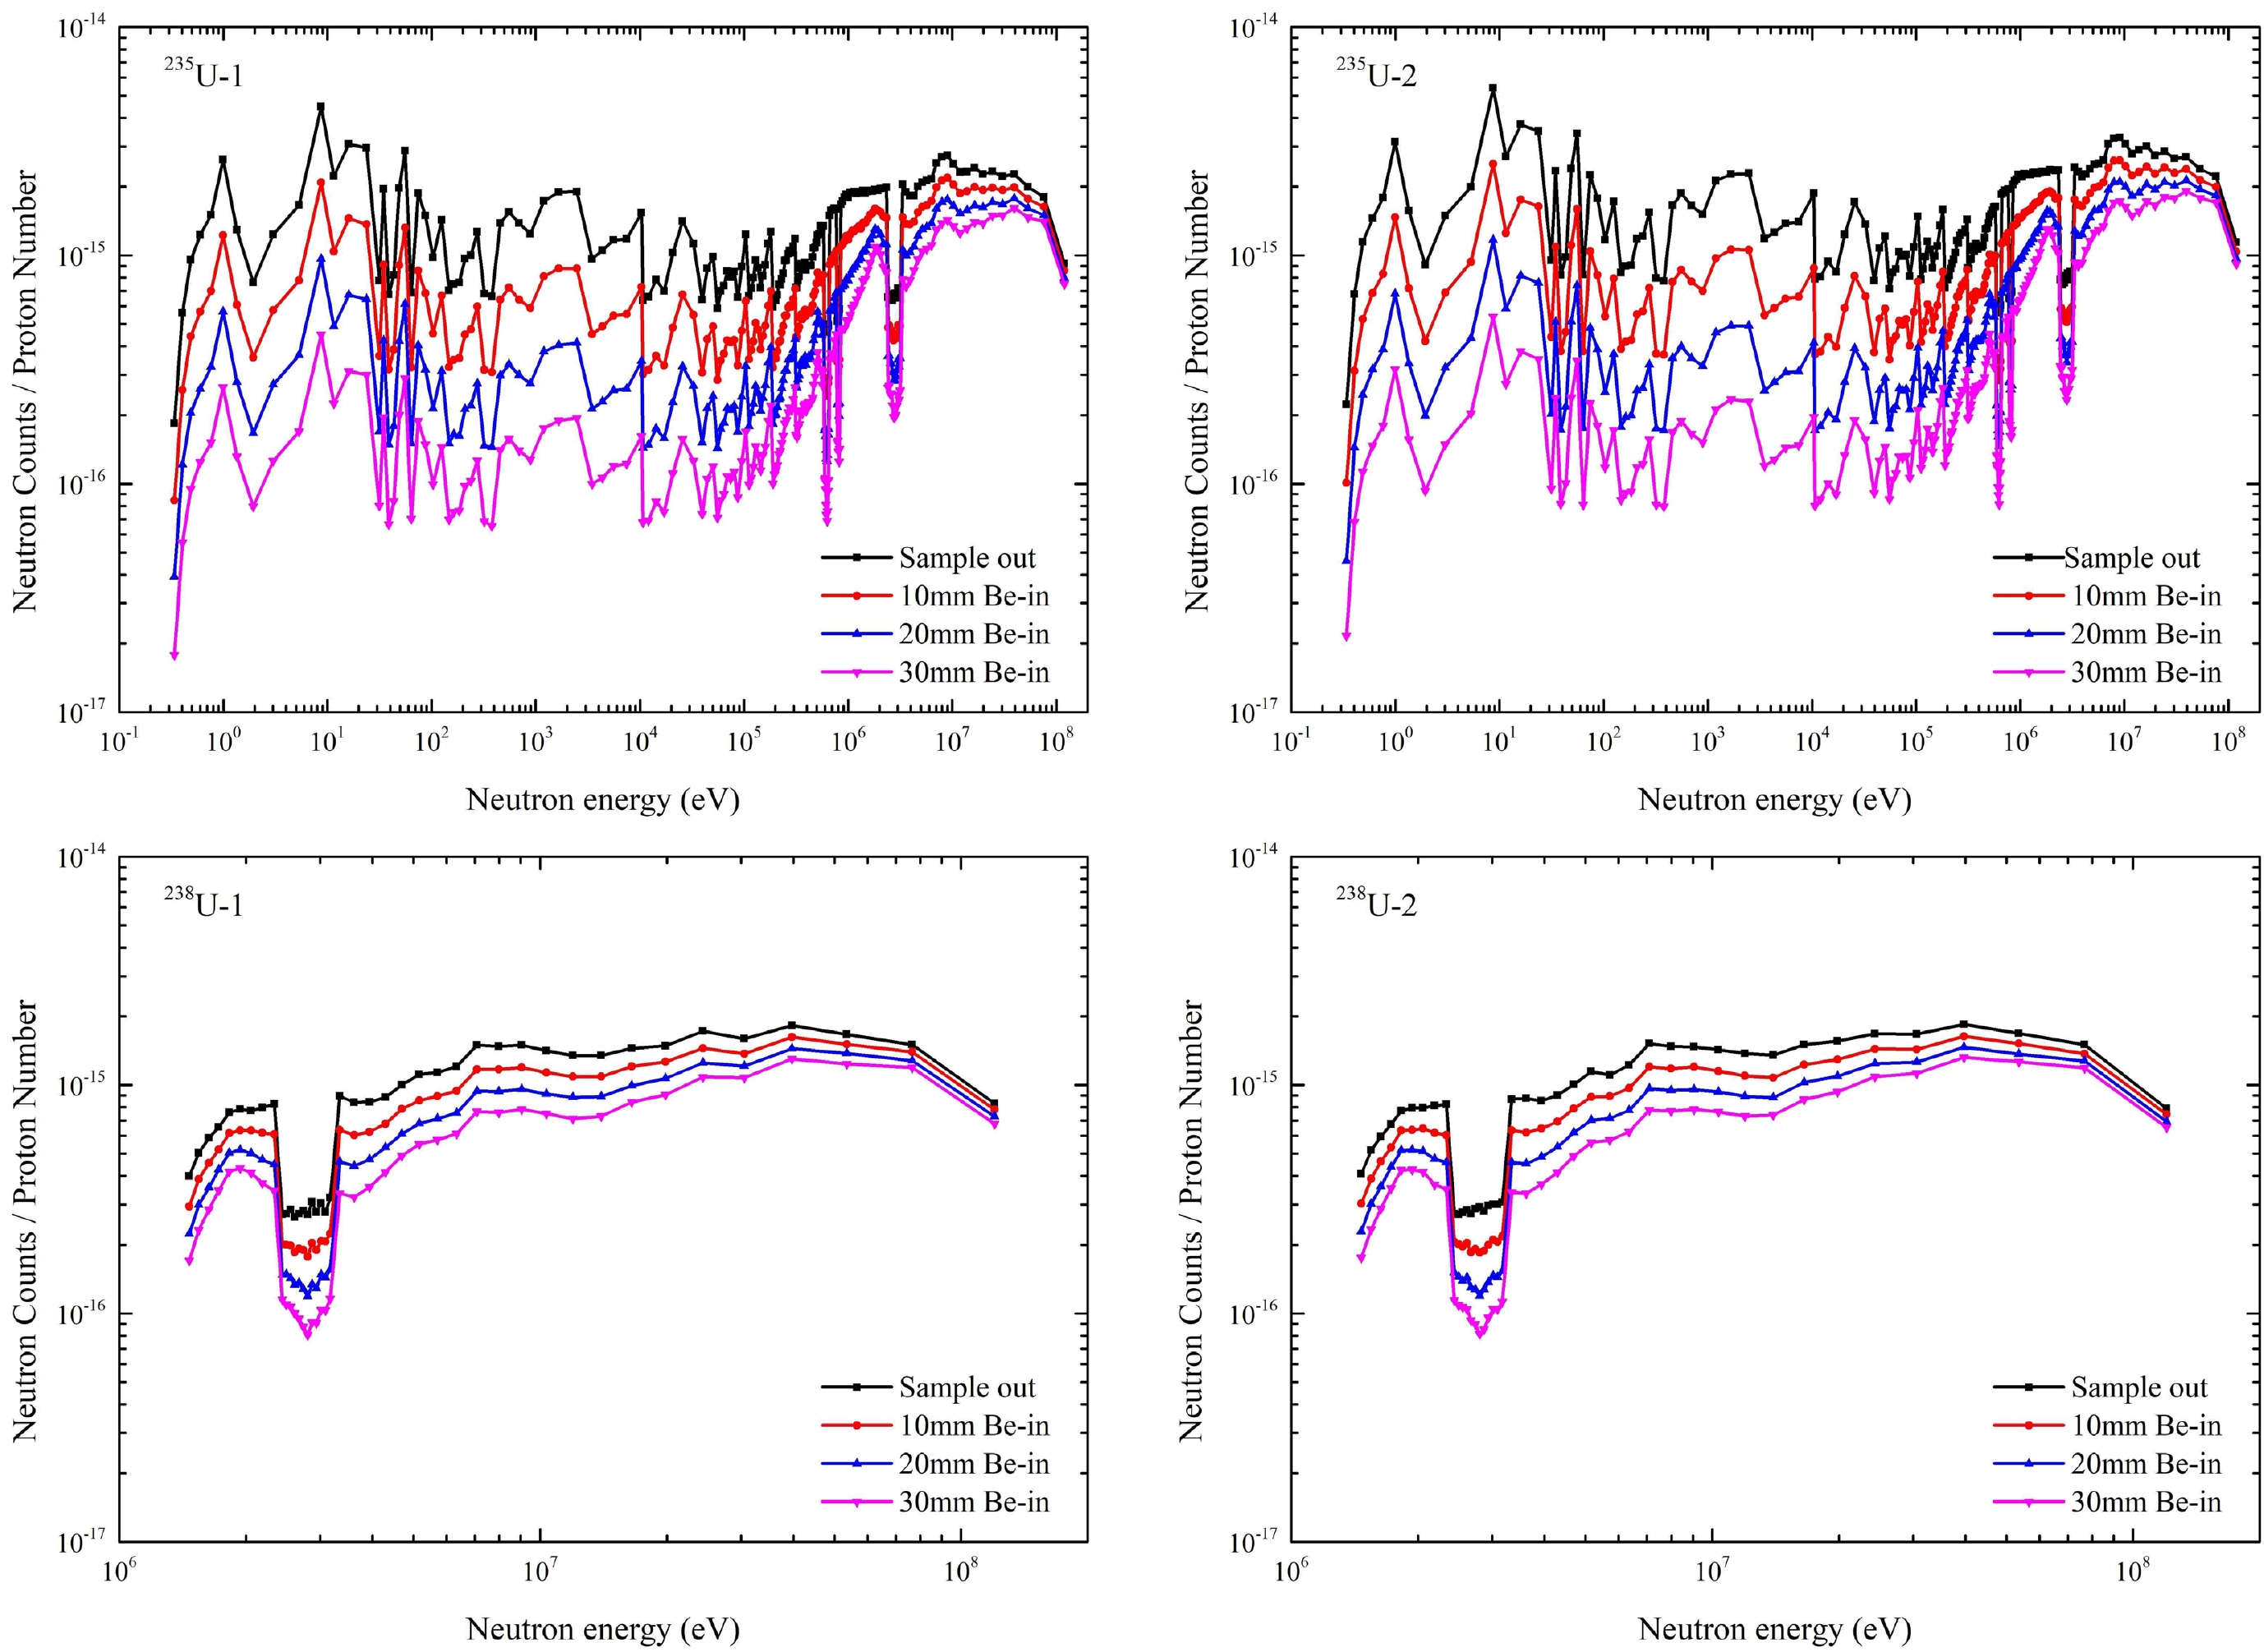
Figure 9. (color online) Normalized neutron spectrums of 235U-1, 235U-2, 238U-1, and 238U-2. The black curves represent the energy spectrum in the sample-out state. The red curves represent the energy spectrum in the 10 mm Be-in state. The blue curves represent the energy spectrum in the 20 mm Be-in state. The pink curves represent the energy spectrum in the 30 mm Be-in state.
-
We primarily analyzed the relative errors of the neutron energy spectrum. The transmission and neutron total cross section results were obtained and our experimental results were compared with the partial experimental results of the EXFOR [16] and the evaluated cross section data of JEFF-3.3 and ENDF/B-VIII.0. Finally, the relative errors of the transmission and the total cross section were obtained.
-
The relative energy errors of Back-n facility can be obtained using Eq. (10):
$ \frac{\Delta E}{E}=\frac{1}{\sqrt{1-{{\beta }_{n}}^{2}}}\times \left(\frac{1}{\sqrt{1-{{\beta }_{n}}^{2}}}+1\right)\times \sqrt{{\left(\frac{\Delta T}{T}\right)}^{2}+{\left(\frac{\Delta L}{L}\right)}^{2}} , $

(10) where
$ \dfrac{\Delta E}{E} $ is the relative energy resolution,$ {\beta }_{n} $ is the relativistic factor and can be calculated by Eq. (6), and$ \Delta T $ and$ \Delta L $ are the total time error and the error of effective flight path, respectively.$ \Delta T $ is about 60.3 ns, which is primarily composed of a proton beam pulse half-width of 60 ns and a time resolution of the detection system of 5.7 ns.$ \Delta L $ is caused by the moderation in the spallation target and the surrounding coolant, which can be determined using FLUKA simulation [17,18]. According to Eq. (10), the relative energy errors of FIC detector at 77.6 m under 100 kW beam power at some representative energy points are summarized in Table 6. We can observe that below 1 MeV, the energy errors were less than 2.2%. Above 100 MeV, the errors increased to 23%.$ {E}_{n} $ /eV

$ \Delta T $ /ns

$ \Delta L $ /cm

$ \Delta E/E $ 

$ 1 $ 

60.3 12.2 $ 3.1\times {10}^{-3} $ 

$ 10 $ 

60.3 13.6 $ 3.5\times {10}^{-3} $ 

$ {10}^{2} $ 

60.3 24.0 $ 6.2\times {10}^{-3} $ 

$ {10}^{3} $ 

60.3 20.2 $ 5.3\times {10}^{-3} $ 

$ {10}^{4} $ 

60.3 18.0 $ 5.1\times {10}^{-3} $ 

$ {10}^{5} $ 

60.3 15.4 $ 7.9\times {10}^{-3} $ 

$ {10}^{6} $ 

60.3 8.8 $ 2.2\times {10}^{-2} $ 

$ {10}^{7} $ 

60.3 10.0 $ 7.0\times {10}^{-2} $ 

$ {10}^{8} $ 

60.3 18.4 $ 2.3\times {10}^{-1} $ 

Table 6. Relative energy errors of FIC detector at 77.6 m under 100 kW beam power at some representative energy points.
The relative errors of the neutron counts are shown in Fig. 10. In the energy region below 10 keV, the relative errors of neutron counts of 235U-1 and 235U-2 only include statistical errors. In the energy region above 10 keV, the relative errors of neutron counts of 235U-1 and 235U-2 include statistical and unfolded errors. The relative errors of neutron counts of 238U-1 and 238U-2 also include statistical and unfolded errors. From Fig. 10, we can see that the relative error of neutron counts is between 0.3% and 2.7%.
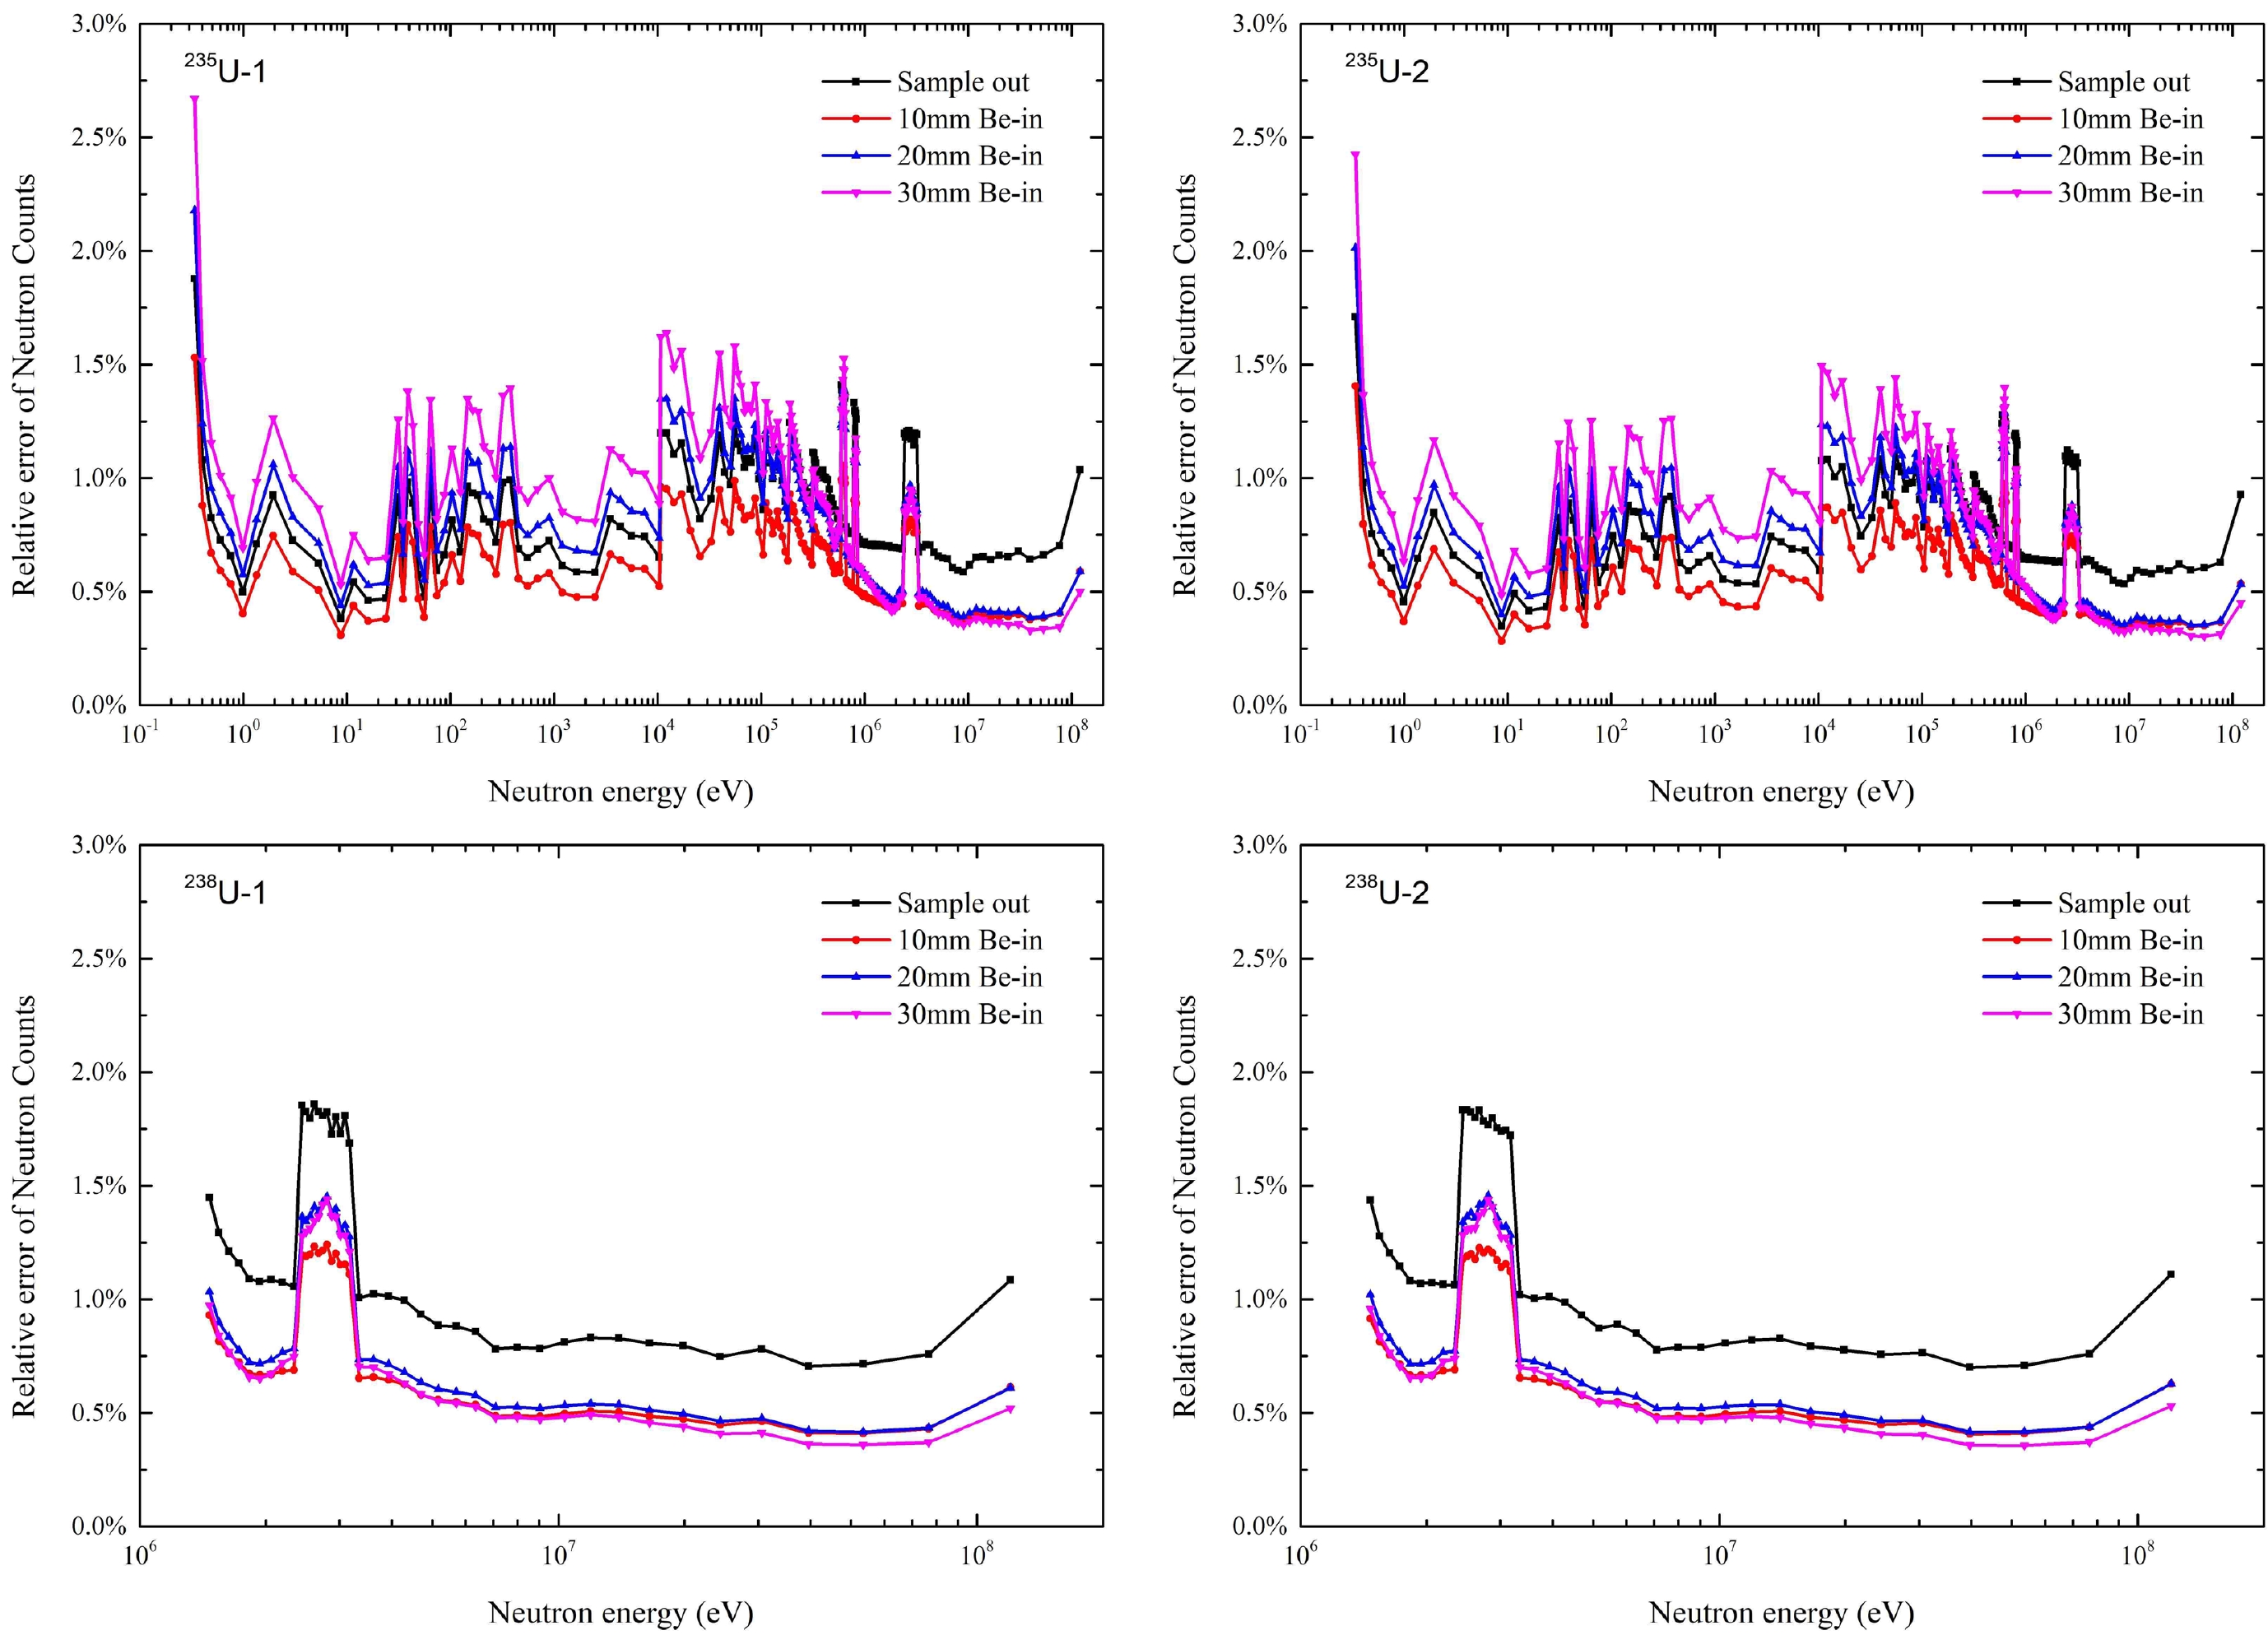
Figure 10. (color online) Relative errors of neutron counts of 235U-1, 235U-2, 238U-1, and 238U-2.
The neutron count ratio with the same type of fission cells and the uranium mass ratio for 235U and 238U cells are shown in Fig.11. The ratio of the neutron counts of the 235U-1 and 235U-2 cells was very close to the mass ratio of the fission layer, with a deviation of less than 4%. The ratio of neutron counts of the 238U-1 and 238U-2 cells was also very close to the mass ratio of the fission layer, with a deviation of less than 3%. The four fission chambers were also tested to record neutrons. Therefore, in the subsequent data analysis, we stacked the neutron counts of two pieces of 235U and 238U separately to increase the statistical count and reduce statistical errors.
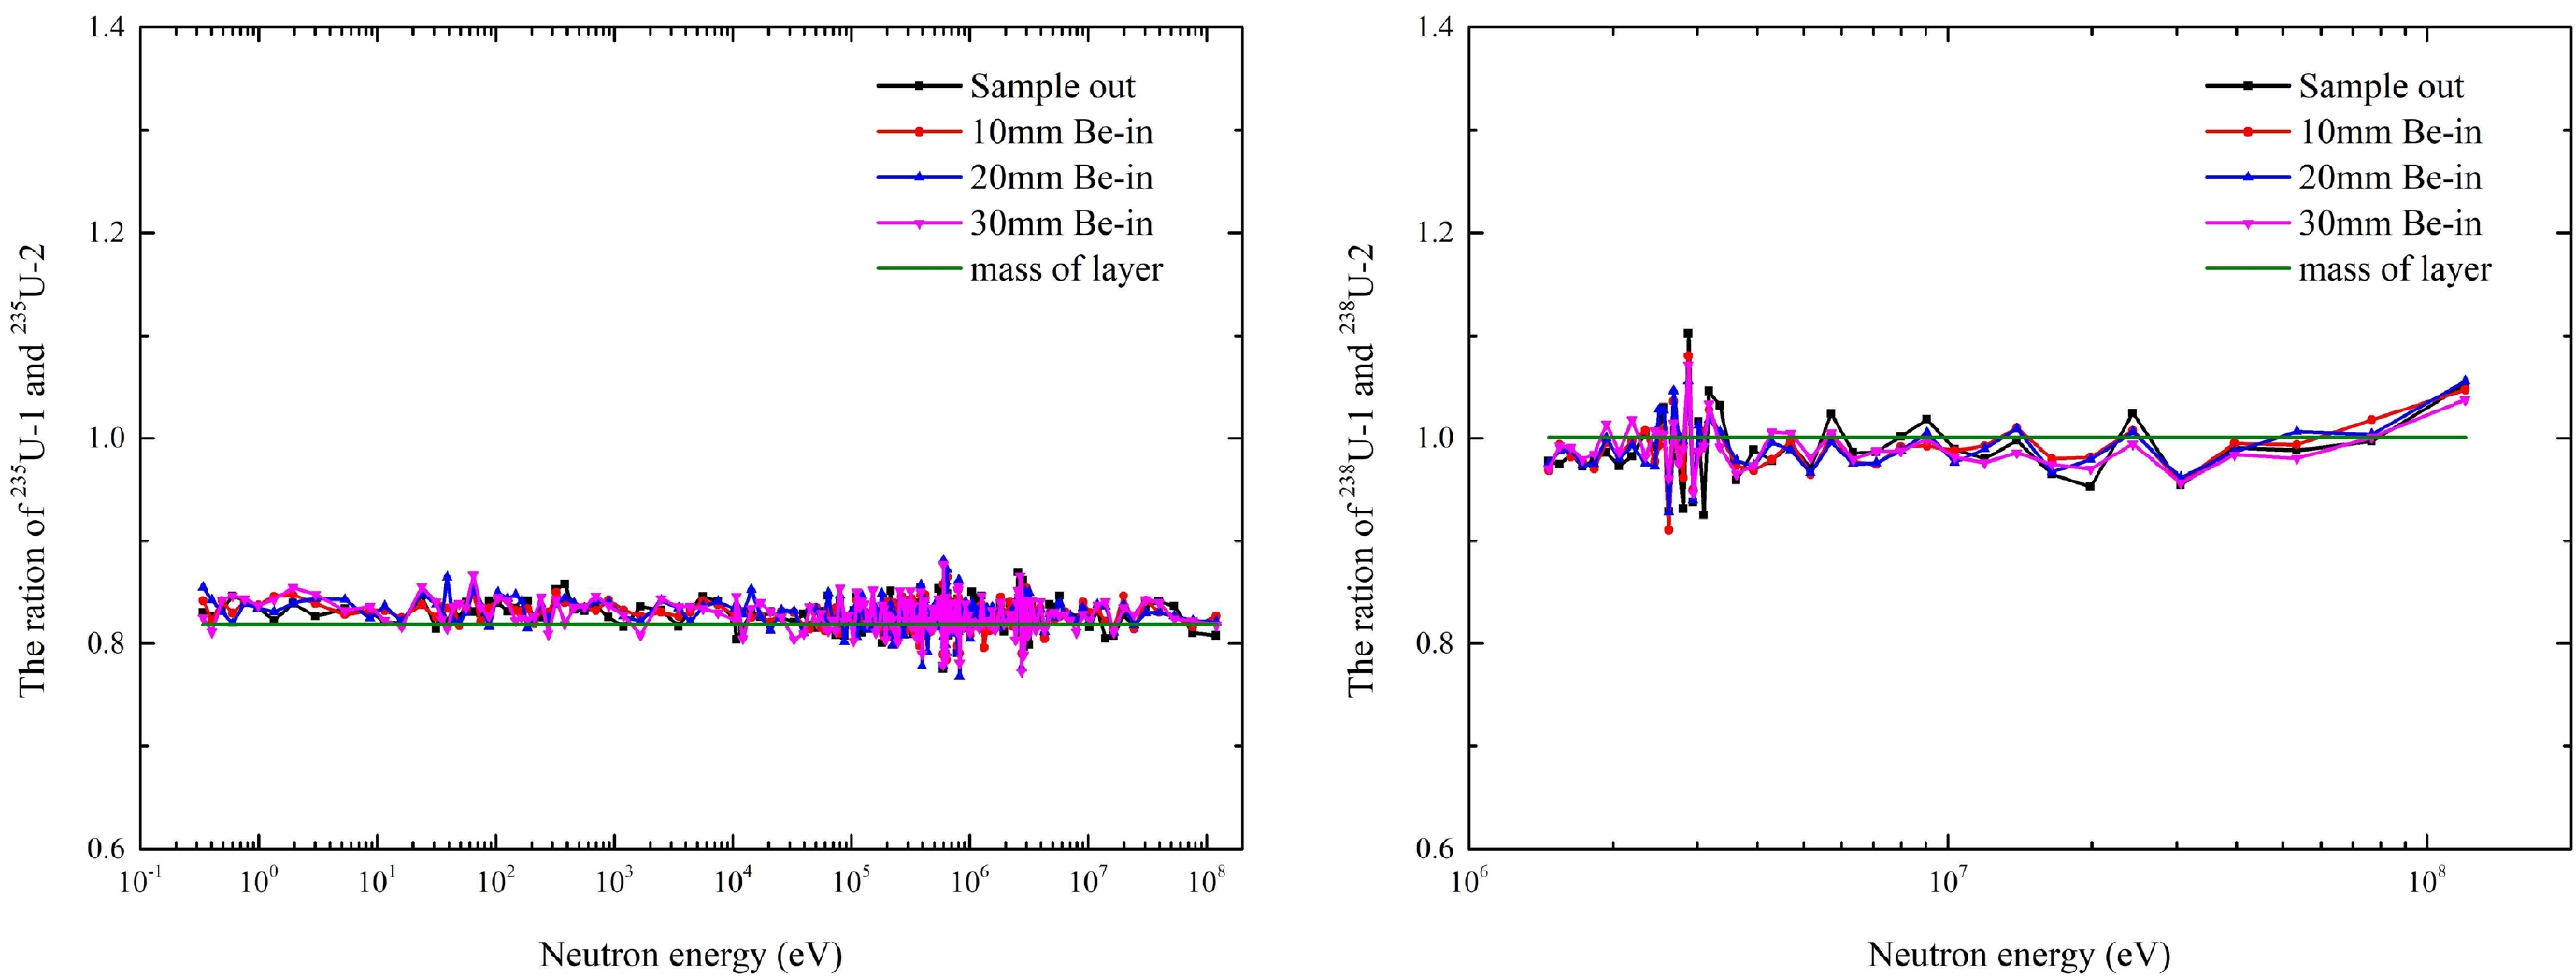
Figure 11. (color online) Neutron count ratio with the same type of fission cells and the uranium mass ratio for 235U and 238U cells.
-
The transmission can be derived using Eq. (1). The transmission of the three Be samples with different thicknesses obtained by respectively adding the 235U and 238U detector cells are shown in Fig. 12.
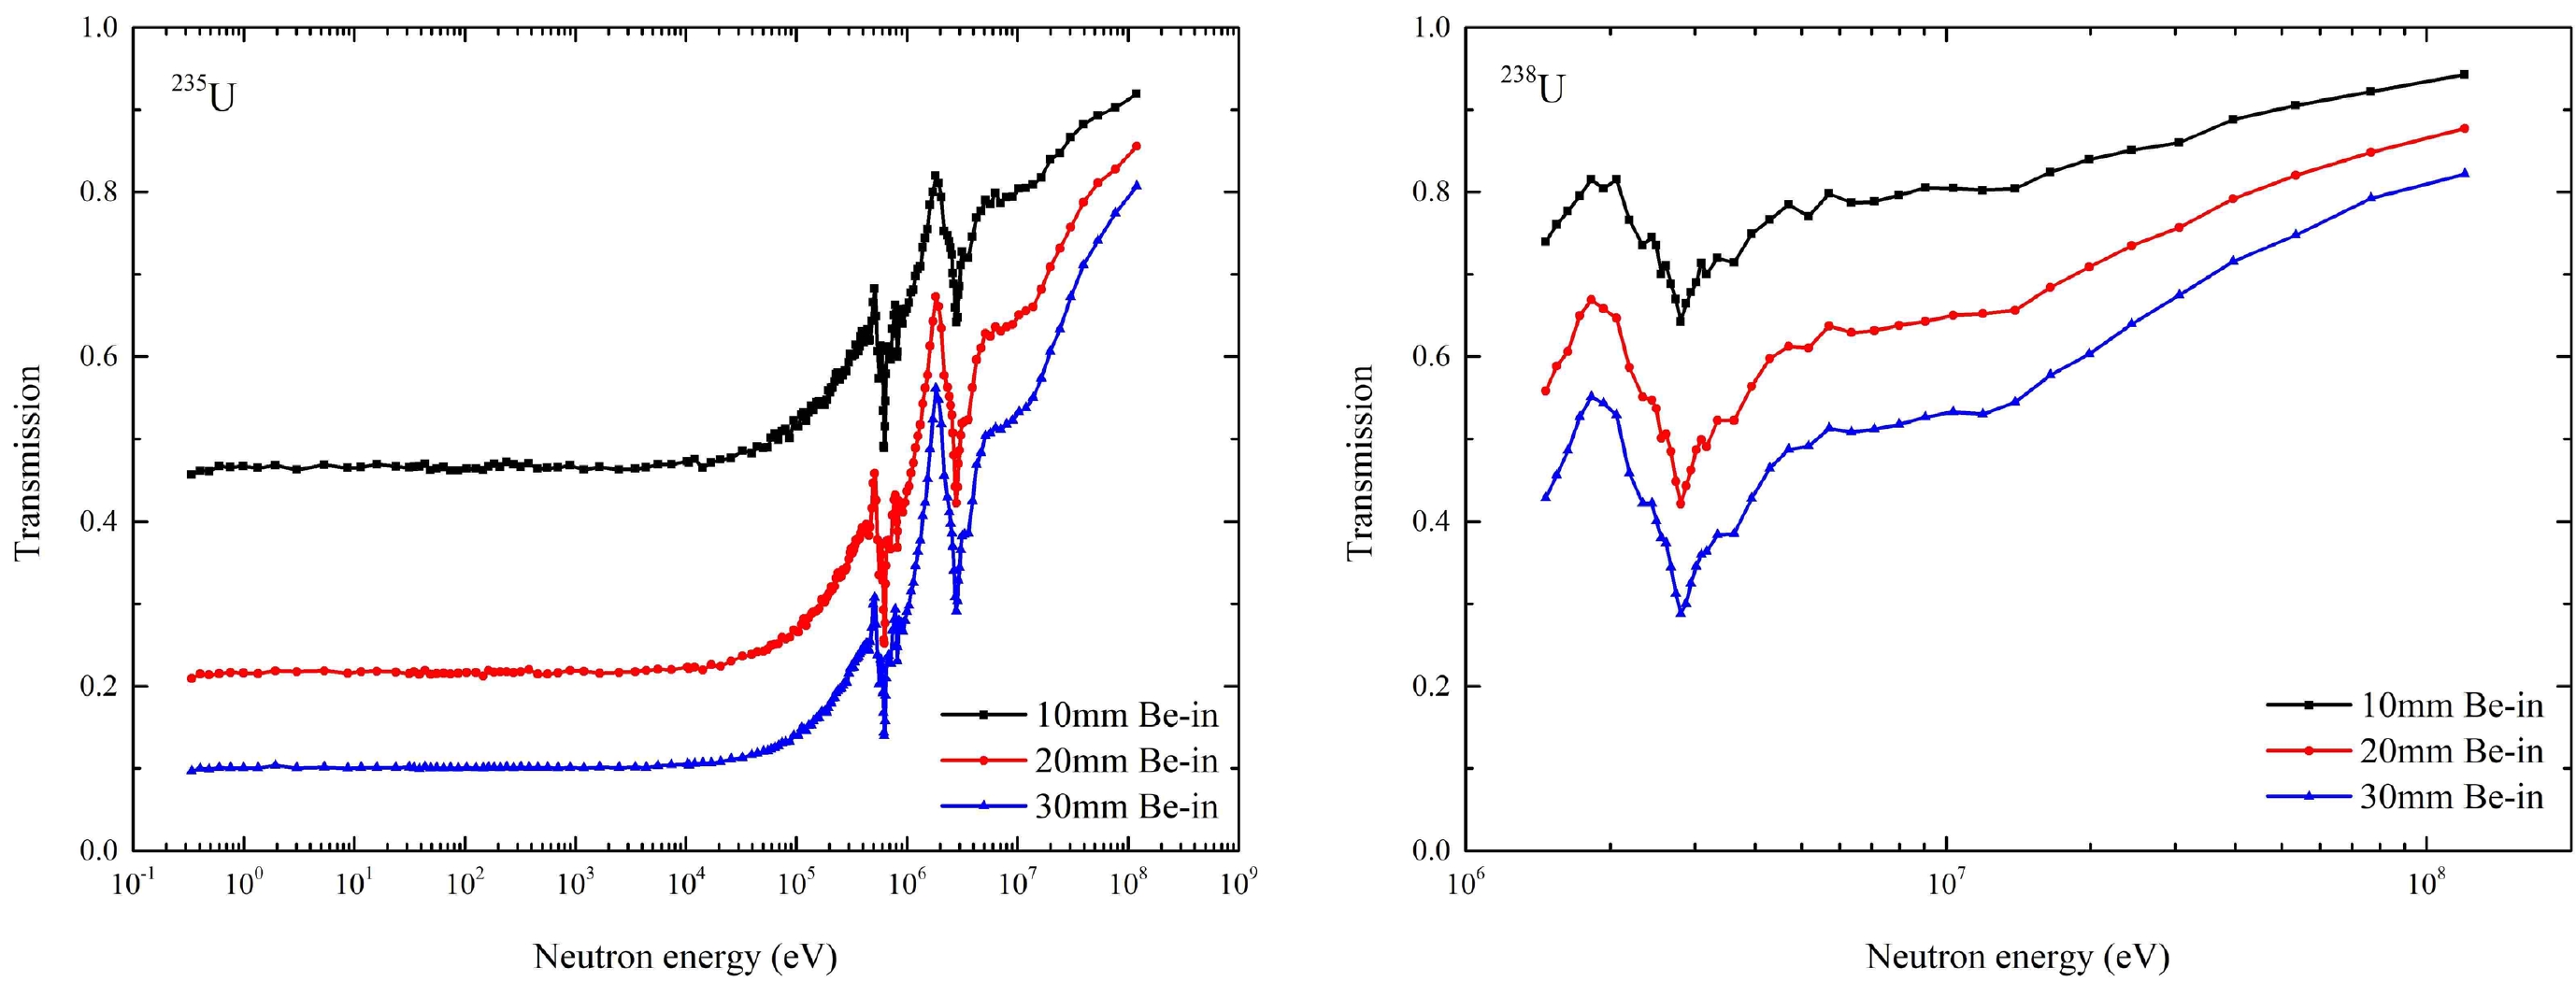
Figure 12. (color online) Transmission of the three Be samples obtained using the 235U and 238U detector cells, respectively.
Using the transmission data, the total cross section results were obtained using Eq. (2) and shown as Fig. 13. The measurement results of the total cross section of 9Be for 235U and 238U for three Be samples with different thicknesses agreed closely. The relative deviation of the total cross section results of the three 235U and 238U samples in the energy range of 0.3 eV to 0.1 MeV was within 2%. The relative deviation of the total cross section results was approximately 4% for energies above 0.1 MeV. In the resonance energy region, the Gaussian fitting resonance energies of our experiment were about 0.63, 0.82, and 2.8 MeV, respectively. When conditions are available, the R-matrix method will be used to analyze the resonance parameters.
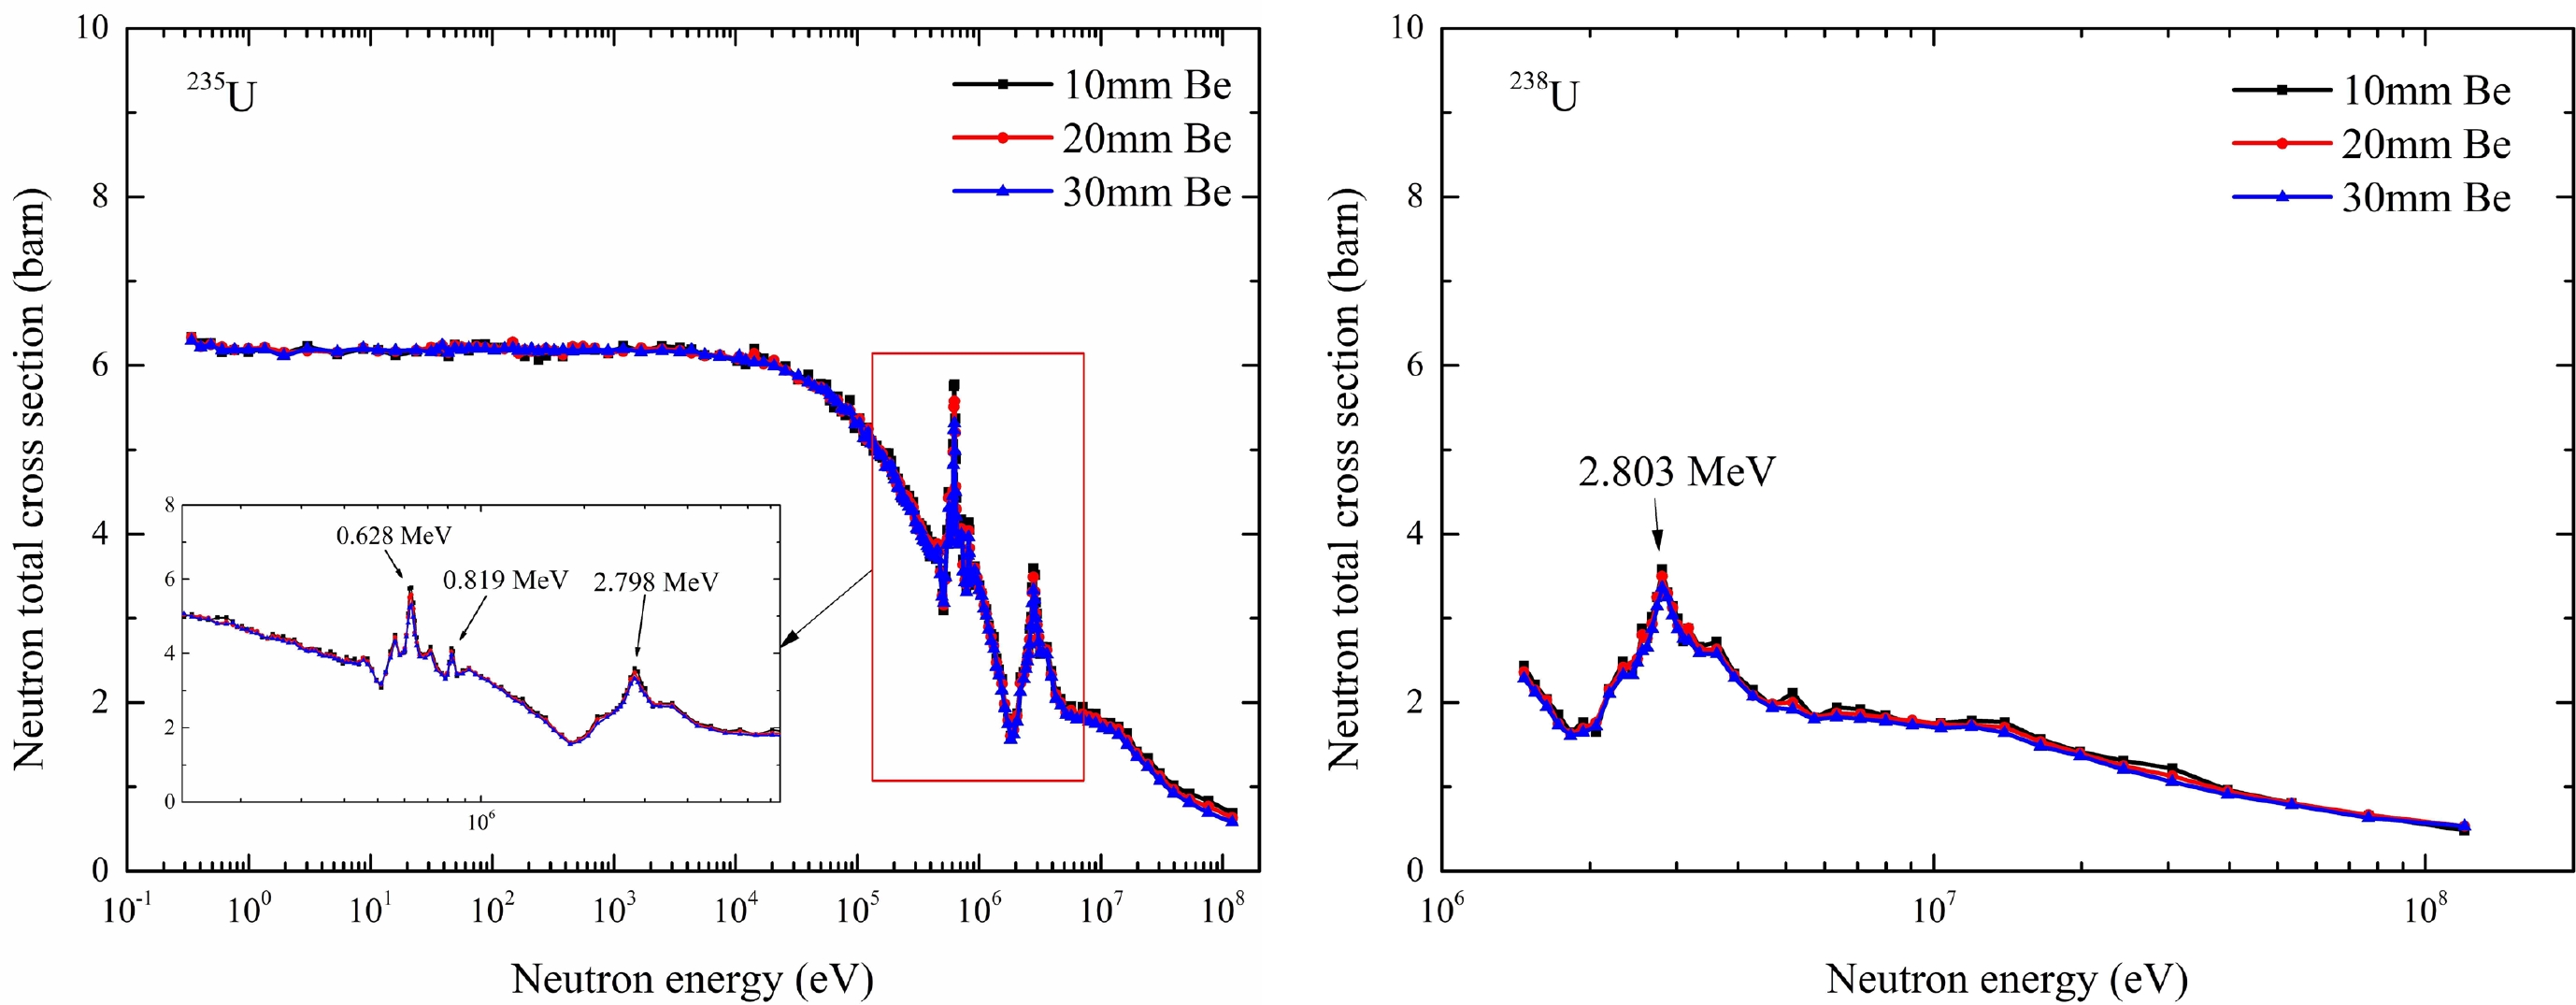
Figure 13. (color online) Total cross section results of 235U and 238U for three Be samples with different thicknesses.
Our experimental results were compared with the partial experimental results [2−5, 19, 20] of EXFOR [16] and the evaluated data of ENDF/B-VIII.0 and JEFF-3.3, as shown in Fig. 14. In the energy region below 10 keV, the experimental results of our three samples agreed with each other within a 2% relative deviation, and our total results were in better agreement with the ENDF/B-VIII.0 evaluated data in most energy regions compared with other experimental total cross section data. The deviation between our results of the three Be samples and the evaluated results of ENDF/B-VIII.0 was within 2.5% and within 15% for 0.01−20 MeV. In the 20−120 MeV energy range, no evaluation data are available for comparison. The total cross-section measured by Finlay [4] in 1993 differed from our results by 1% to 41%.
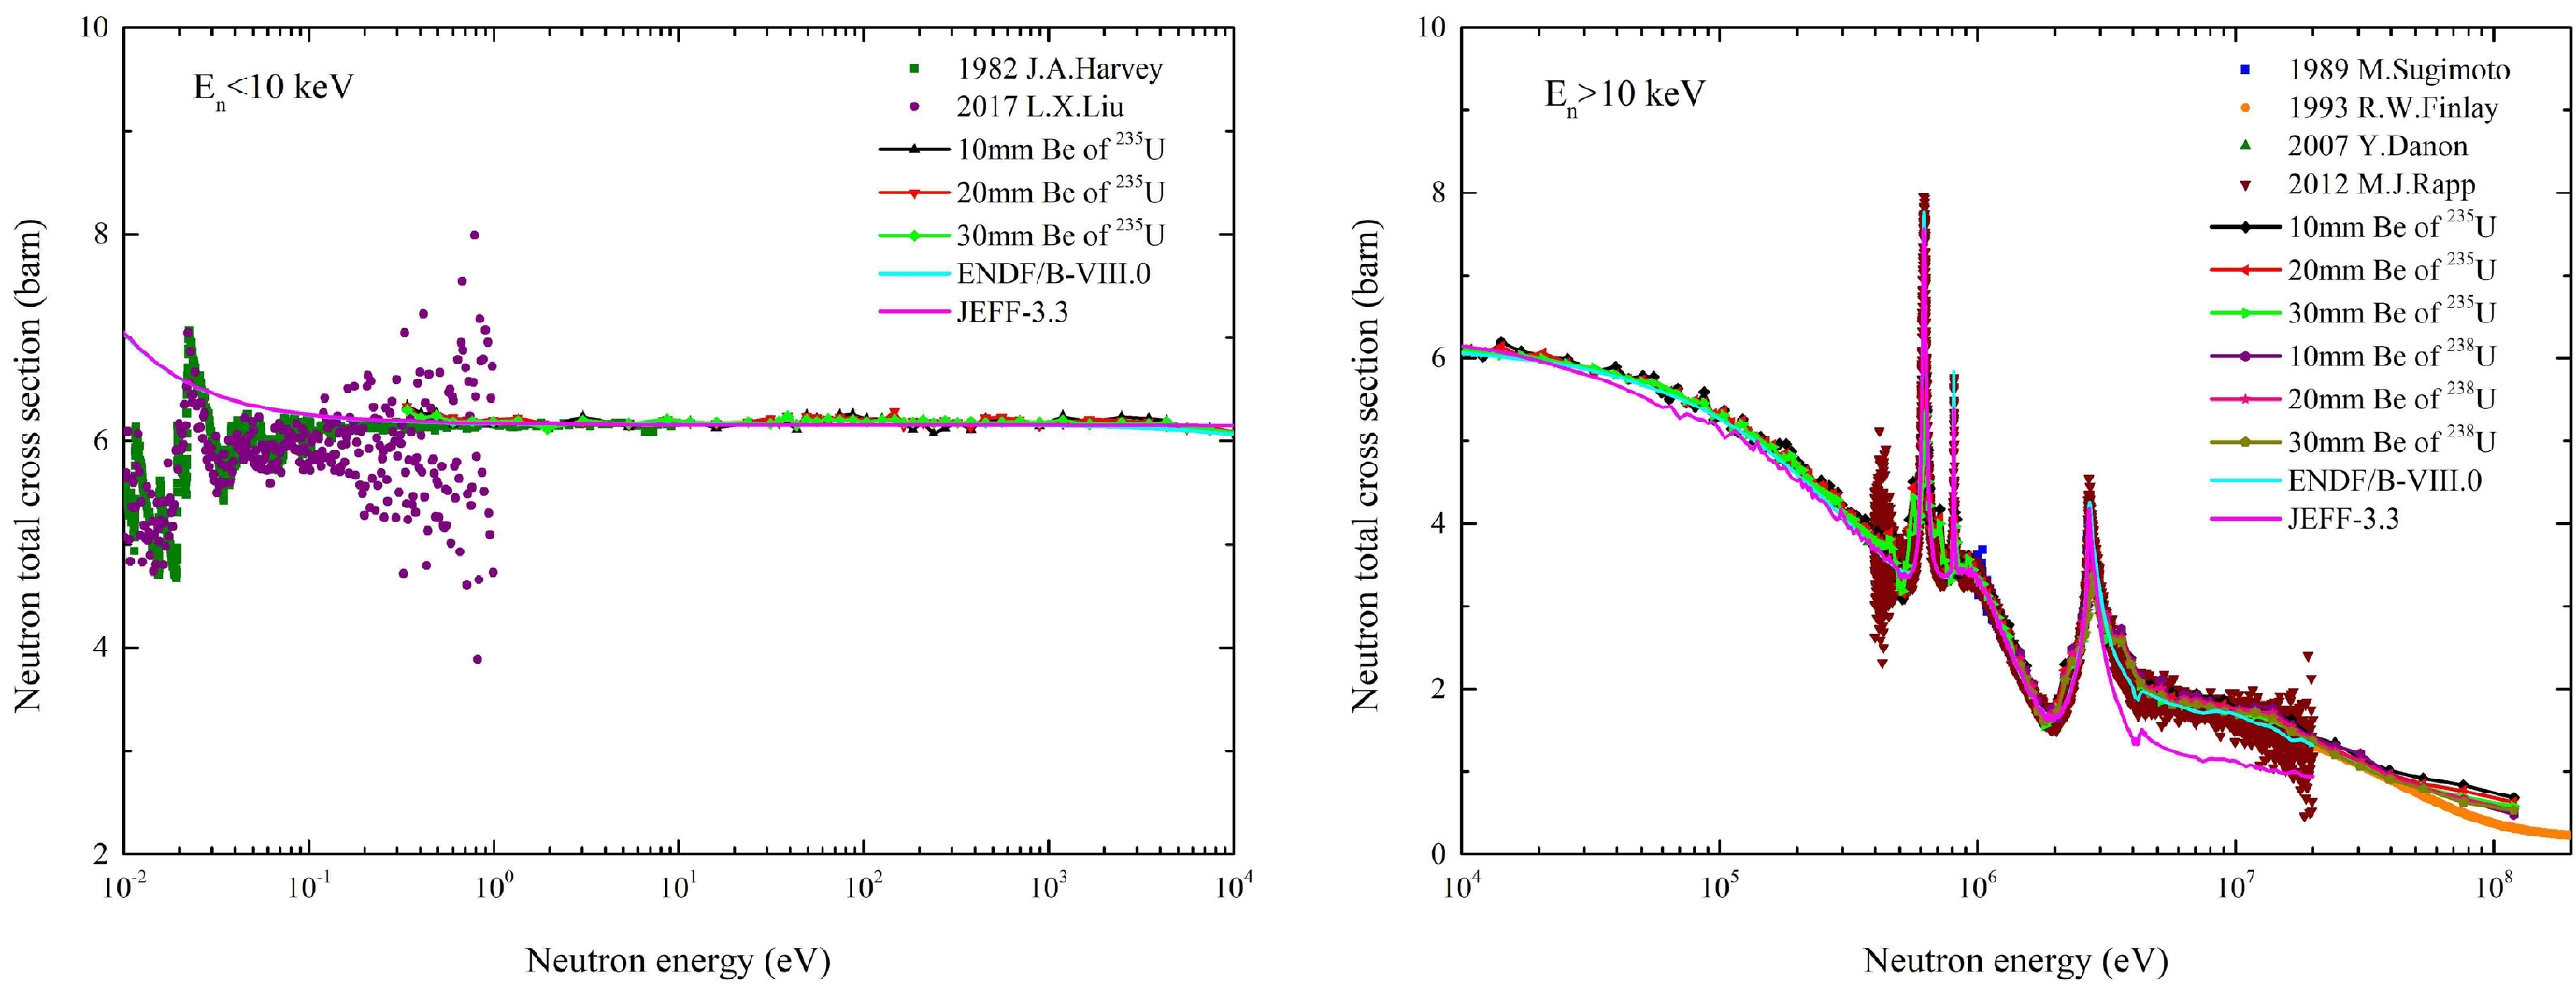
Figure 14. (color online) Comparison of our experimental results and the partial results of the experimental library EXFOR and the cross-section of the evaluation library IAEA.
-
The total cross section relative uncertainty is primarily affected by the measurement uncertainty of the samples and the transmission relative uncertainty according to Eq. (2). The transmission relative uncertainty can be expressed by Eq. (11). The relative uncertainty of neutron counts includes statistical and unfolded errors. The statistical uncertainties used in Eq. (11) were obtained from the
$ 1\sigma $ counting statistics of the data collected in the individual energy bins. The relative uncertainty of transmission was between 0.3% to 2% and is shown as Fig. 15.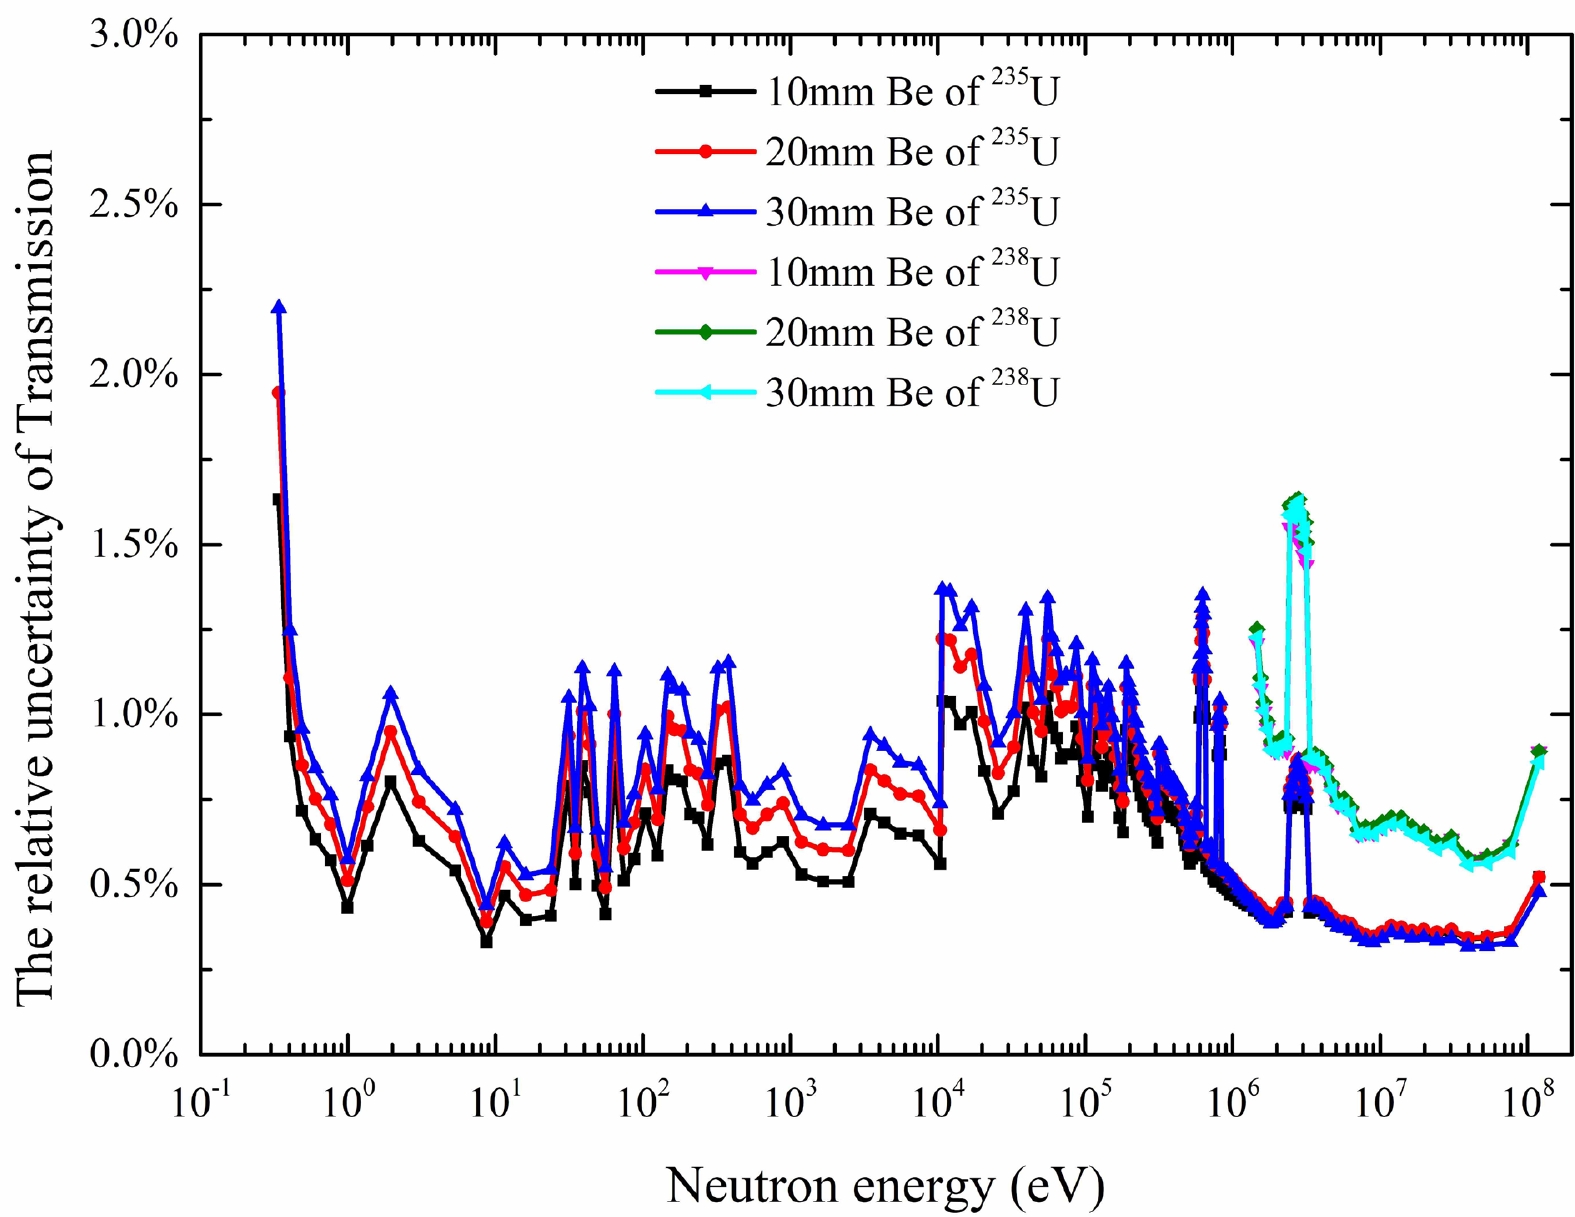
Figure 15. (color online) Relative uncertainty of transmission of 235U and 238U for three Be samples of different thicknesses.
$ \frac{\Delta {T}_{({E}_{i)}}}{{T}_{({E}_{i)}}}=\sqrt{{\left(\frac{\Delta {C}_{I\left({E}_{i}\right)}}{{C}_{I\left({E}_{i}\right)}}\right)}^{2}+{\left(\frac{\Delta {C}_{O\left({E}_{i}\right)}}{{C}_{O\left({E}_{i}\right)}}\right)}^{2}}. $

(11) The uncertainty of the atomic surface density (
$ nl $ ) is very small compared with the transmission uncertainty and was therefore neglected. The relative uncertainties of the total cross section$ {\sigma }_{tot} $ [8] for each energy bin were calculated using Eq. (12) and are shown in Fig .16.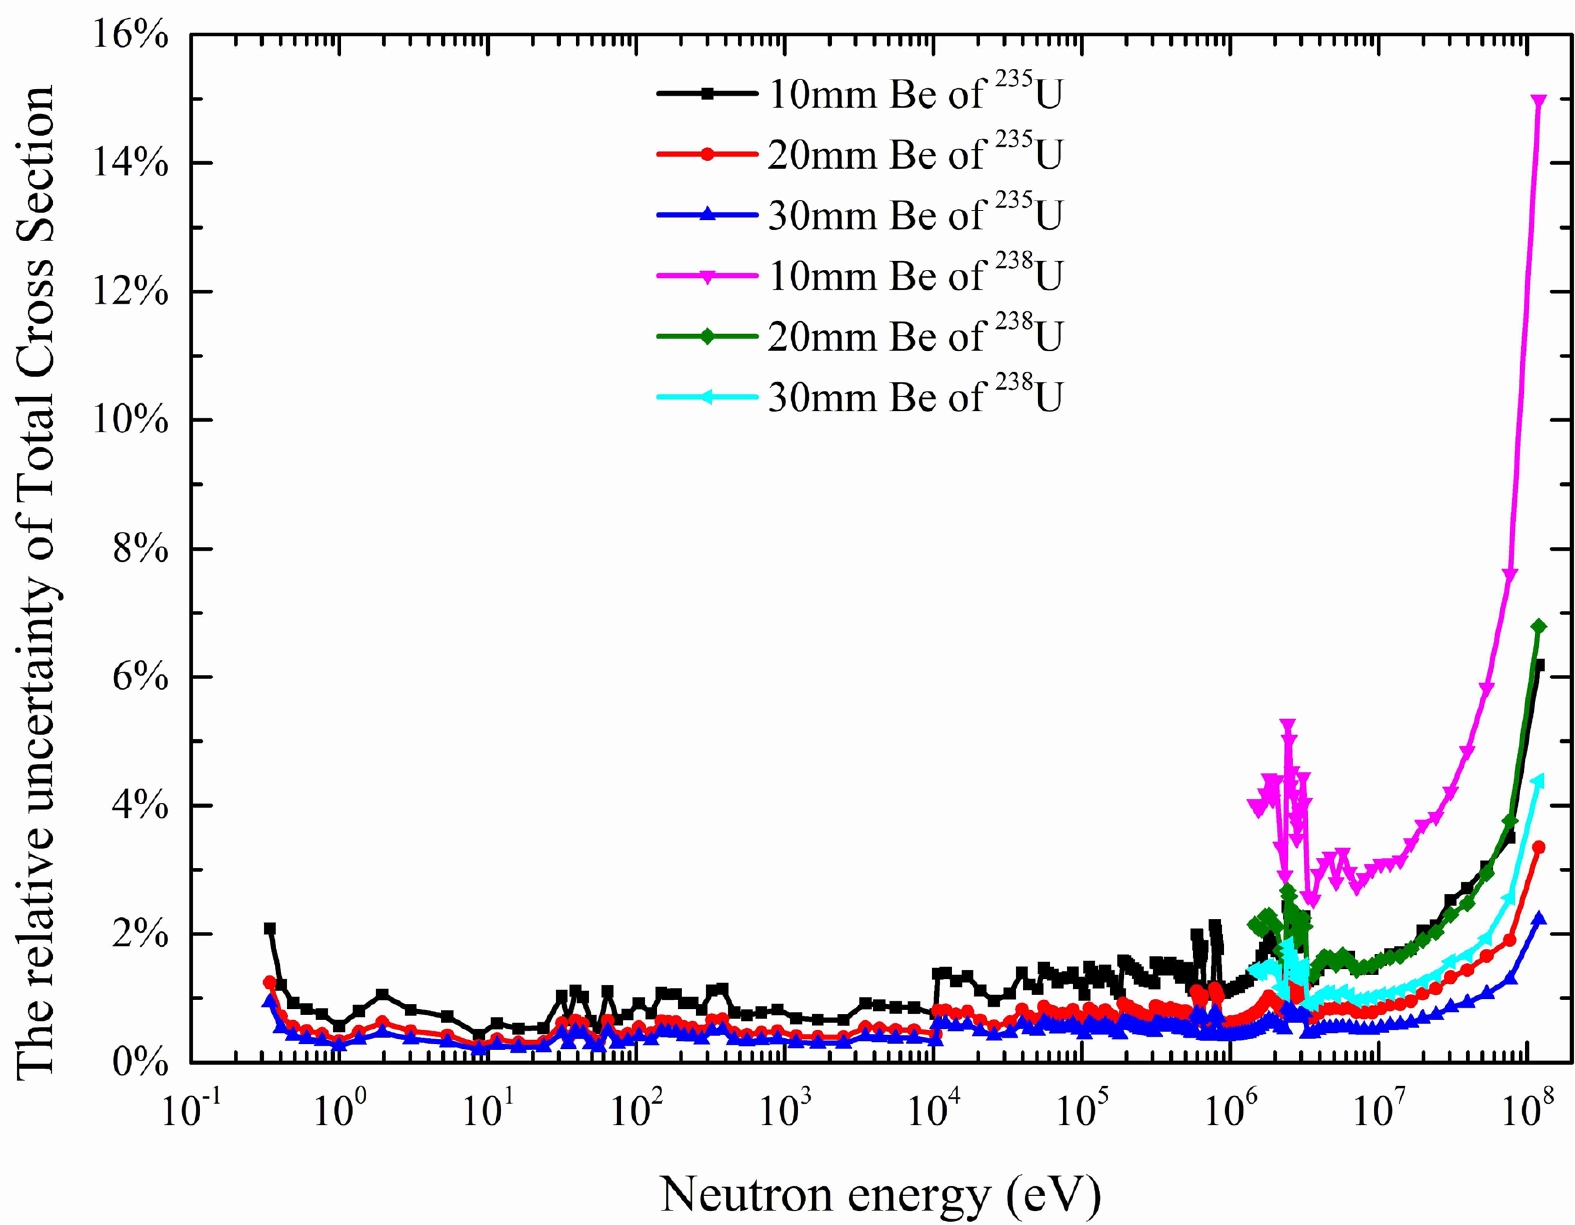
Figure 16. (color online) Relative uncertainties of the total cross sections of our experimental results.
$ \frac{\Delta {\sigma }_{{\rm tot}\left({E}_{i}\right)}}{{\sigma }_{{\rm tot}\left({E}_{i}\right)}}=\frac{\Delta {T}_{\left({E}_{i}\right)}}{nl{\sigma }_{{\rm tot}\left({E}_{i}\right)}{T}_{\left({E}_{i}\right)}}. $

(12) The results showed that the relative uncertainty of cross section for samples of three Be samples obtained by 235U were below 2.2% in the energy region of 0.3 eV to 1 MeV. The relative uncertainty of cross section for the 30 mm Be sample obtained using 235U was the smallest and was less than 2% in the energy region of 0.3 eV to 120 MeV, which was because 235U has a larger neutron count than 238U. The 30 mm Be sample had a larger surface density than the others. To reduce the error and test the unfolded method, we will perform a Be neutron total cross section experiment in the single bunch mode in the future.
-
The neutron total cross section of 9Be at the CSNS Back-n was measured using a the multi-layer fission detector based on 235U and 238U. The ROOT program was used to analyze the waveform and obtain the total cross section in the energy region of 0.3 eV−120 MeV. In the energy range of 0.3 eV to 10 keV, the deviation between our results of three thicknesses Be samples and the evaluation results of ENDF/B-VIII.0 is within 2.5%, which is within 15% from 0.01−20 MeV. In the 20−120 MeV energy range, the total cross section measured by R.W. Finlay in 1993 differs from our results by 1% to 41%. In the resonance energy region, the measured resonance energies of our experiment were 0.63, 0.82, and 2.8 MeV, respectively. The relative total cross section uncertainty of 30 mm Be of 235U was the smallest and less than 5% in the energy region of 0.3 eV−120 MeV. The total cross section uncertainties of three 9Be samples of 235U were below 2.2% in the energy region below 1 MeV. Our total cross section results and relative uncertainty can be used as a reference for nuclear data evaluation. When the conditions are satisfied, we will perform measurement experiments in the single bunch mode and analyze the resonance parameters using the R-matrix method.
Measurement of the neutron total cross section of 9Be at the Back-n white neutron source of CSNS
- Received Date: 2024-03-12
- Available Online: 2024-08-15
Abstract: The neutron total cross section data of 9Be are essential in the nuclear structure model research of light nuclei and nuclear power installations. The neutron total cross section of 9Be in the 0.3 eV−120 MeV energy region has been measured using time-of-flight and transmission methods with the Neutron Total Cross Sectional Spectrometer (NTOX) based on the multi-cell fast fission chamber at the China Spallation Neutron Source (CSNS)-Back-n white neutron source (Back-n). The fission count-neutron energy distributions of 235U and 238U without samples and with Be samples with three thicknesses were measured in the double-bunch operation mode for a beam power of 100 kW. The Bayesian method was used to eliminate the influence of the double-bunch problem on neutron measurement in the energy region above 10 keV. The neutron total cross section of 9Be results was consistent with ENDF/B-VIII.0 evaluation library data in the 0.3 eV−20 MeV energy region. In the energy ranges of 0.3 eV to 10 keV and 0.01 to 20 MeV, the deviations between our results and the evaluation results of ENDF/B-VIII.0 were within 2.5% and 15%, respectively. In the resonance energy region, the measured resonance energies in our experiment were 0.63, 0.82, and 2.8 MeV, respectively. The results showed that the total cross section uncertainties of three Be samples were within 2.2% in the energy region below 1 MeV. The total cross section uncertainty of 30 mm Be from 235U was the smallest and less than 5% in the energy region of 0.3 eV−120 MeV. The results of this experiment can provide technical support for further data analysis and related nuclear data evaluation.


 DownLoad: