-
Neutron-induced reactions play an important role in understanding the behavior of atomic nuclei, including atomic structure, and determining the fundamental composition of matter. These reactions are important in a wide range of scientific and technological fields, including nuclear engineering, astrophysics, and nuclear medicine [1−3]. In many areas of nuclear physics, good quality data on nuclear reactions associated with a covariance matrix are crucial [4−6]. In this study, we focus on the 58Ni(n, p)58Co reaction cross section and investigate the associated covariance analysis. This allows us to assess the uncertainties in the nuclear data and its implications for various applications. The 58Ni(n, p)58Co reaction is important because of the role of nickel isotopes in stellar nucleosynthesis as well as in the nuclear power reactors, where nickel containing materials are extensively used [7, 8]. Therefore, understanding such nuclear reactions and accurately characterizing their reaction cross section is very important for reactor design and isotope production for medical and industrial applications. In recent years, advances in experimental techniques and theoretical models have led to significant progress in characterizing neutron-induced reactions. However, accurate determination of reaction cross sections remains challenging, as the evaluation of nuclear data is subject to uncertainties arising from various sources. These uncertainties arise from experimental measurements, theoretical models, and statistical data evaluations. The covariance analysis, a tool employed in this study, enables the quantification of uncertainties by examining the correlation between different nuclear data parameters. In this study, we also presented a comprehensive discussion on the uncertainty quantification associated with the theoretically calculated cross section for 58Ni(n, p)58Co reaction using Monte Carlo method. The Monte Carlo Method is one of the effective methods of estimating uncertainties in the theoretically calculated cross sections of nuclear reactions [9, 10]. This method involves systematic exploration of the theoretical parameter space by varying relevant nuclear inputs within their respective uncertainties. The structure of this paper is as follows: In Sec. II, we discuss the experimental details, and in Sec. III, we introduce the theoretical framework and nuclear models used to calculate the 58Ni(n, p)58Co reaction cross section via Monte Carlo method. Furthermore, the details on the selection of nuclear input parameters and their associated uncertainties are presented. In Sec. IV, we present the results of measured reaction cross sections and their uncertainties. Finally, in Sec. V, we presente the conclusions of the study.
-
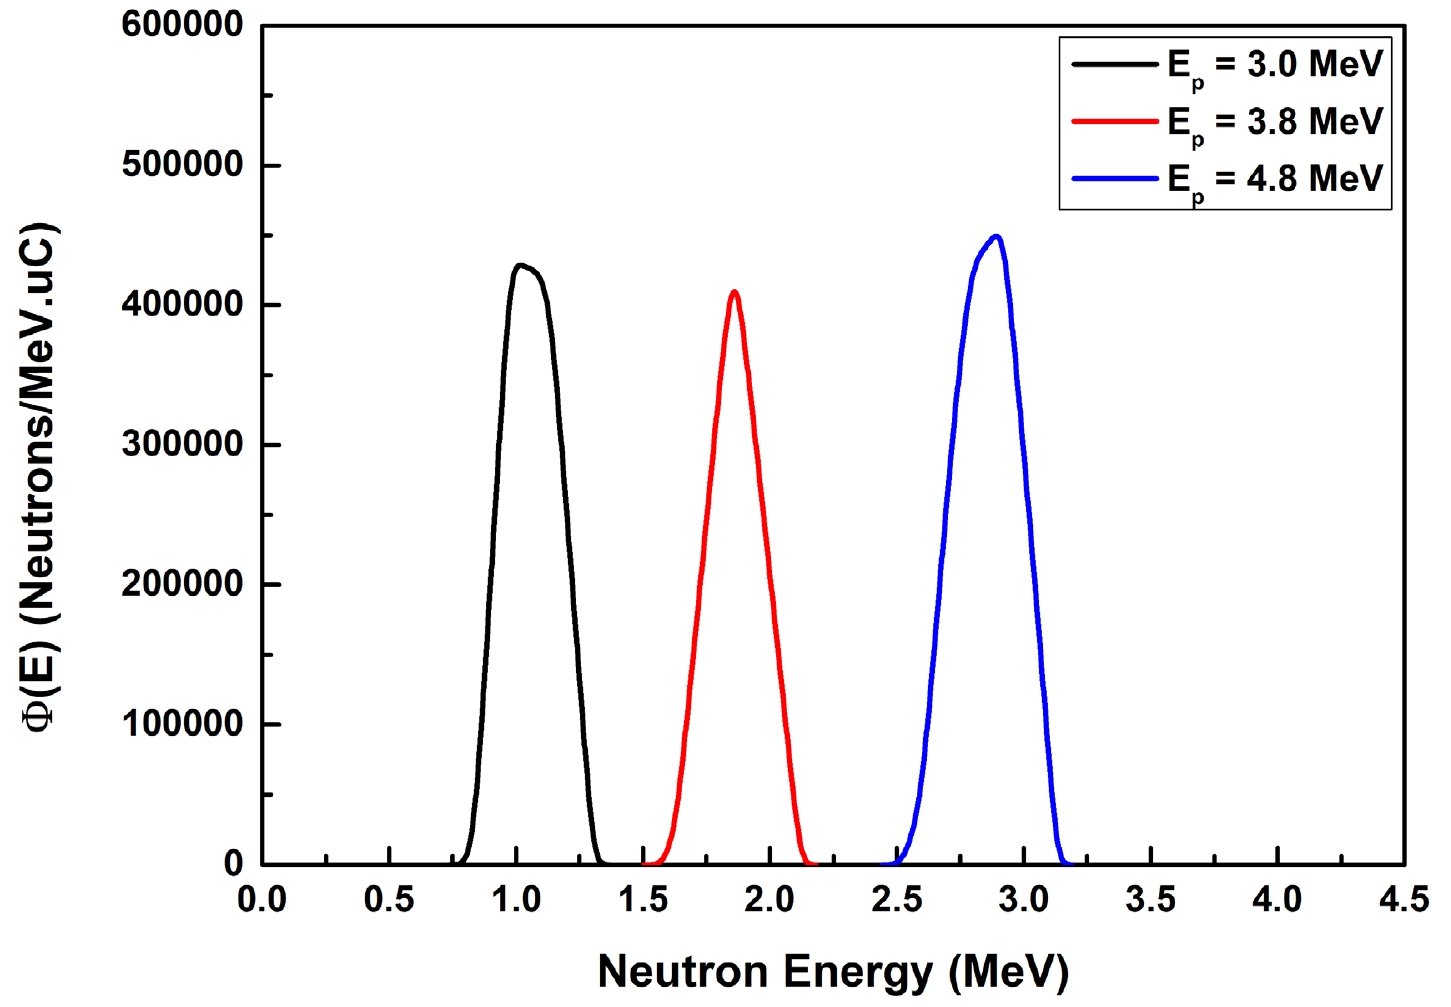
The experiment was conducted at Bhabha Atomic Research Centre (BARC), Mumbai, India using the Folded Tandem Ion Accelerator (FOTIA) facility. In this experiment, neutrons were produced through 7Li(p, n)7Be reaction having Q-value and threshold energy of –1.644 and 1.880 MeV, respectively. The proton beams of 3.0, 3.8 and 4.8 MeV were bombarded on the lithium target to produce different energies of neutrons. Neutron energy spectra, resulting from the 7Li(p, n)7Be reaction, were computed using Energy of Proton Energy of Neutron (the EPEN) code, as provided in reference [11]. The neutron energy spectra, corresponding to three distinct incident proton energies 3.0, 3.8, and 4.8 MeV, are shown in Fig. 1. These neutron energy spectra capture the inherent broadening of the neutron spectra, with full width at half maximum (FWHM) values of 0.32, 0.28, and 0.35 MeV, respectively. Accordingly, the neutron energy and their associated uncertainties are 1.06 ± 0.16, 1.86 ± 0.14, and 2.86 ± 0.18 MeV corresponding to proton energy of 3.0, 3.8, and 4.8 MeV, respectively.

Figure 1. (color online) Neutron flux energy spectra obtained from EPEN at three proton energies corresponding to 3.0, 3.8, and 4.8 MeV.
In this experiment, we prepared three sets of nickel foils, which were irradiated with three different energies of neutrons. Furthermore, we used natural indium foils for neutron beam monitoring. To prevent radioactive cross contamination between the target, monitor, and surrounding foils, Ni and In foils were separately wrapped in aluminum foil. The samples were irradiated by making a stack of Ni-In of size 10 mm × 10 mm with the neutron beam. Table 1 lists the irradiation times, cooling times, counting times, and weights of the samples used in this experiment. An HPGe detector was used to measure the activity generated in the irradiated samples. An 152Eu point source was used to calculate the efficiency of the HPGe detector. The correction for γ-ray true coincidence summing and sample geometry effects were considered in this study. Detailed information with respect to the efficiency calibration of the HPGe detector is provided in our previous articles [12, 13]. The nuclear cross sections for the 58Ni(n, p)58Co reaction were estimated using the well-known activation formula as follows:
Sample ${E}_n$ /MeV

Sample weight/mg Irradiation time/s Cooling time/s Counting time/s Ni 1.06 284.9 87300 360660 12524 1.86 241.5 23400 333300 22260 2.85 243.8 23580 279240 35176 In 1.06 89.6 87300 5140 900 1.86 79.9 23400 245 900 2.85 94.9 23580 460 1800 Table 1. Details about the samples, including their irradiation, cooling, and counting times used in the experiment.
$ \sigma_s = \sigma_m \frac{C_s \lambda_s {I_m} N_m \varepsilon_m F_m(t) N_{\rm low}(s)}{C_m \lambda_m {I_s} N_s \varepsilon_s F_s(t) N_{\rm low}(m)} , $

(1) where,
$ F_m (t) = ({\rm e}^{-\lambda_m t_{cm}}) (1-{\rm e}^{-\lambda_m t_{im}}) (1-{\rm e}^{-\lambda_m t_{am}}) , $

(2) $ F_s (t) = ({\rm e}^{-\lambda_s t_{cs}}) (1-{\rm e}^{-\lambda_s t_{is}}) (1-{\rm e}^{-\lambda_s t_{as}}) . $

(3) In Eq. (1),
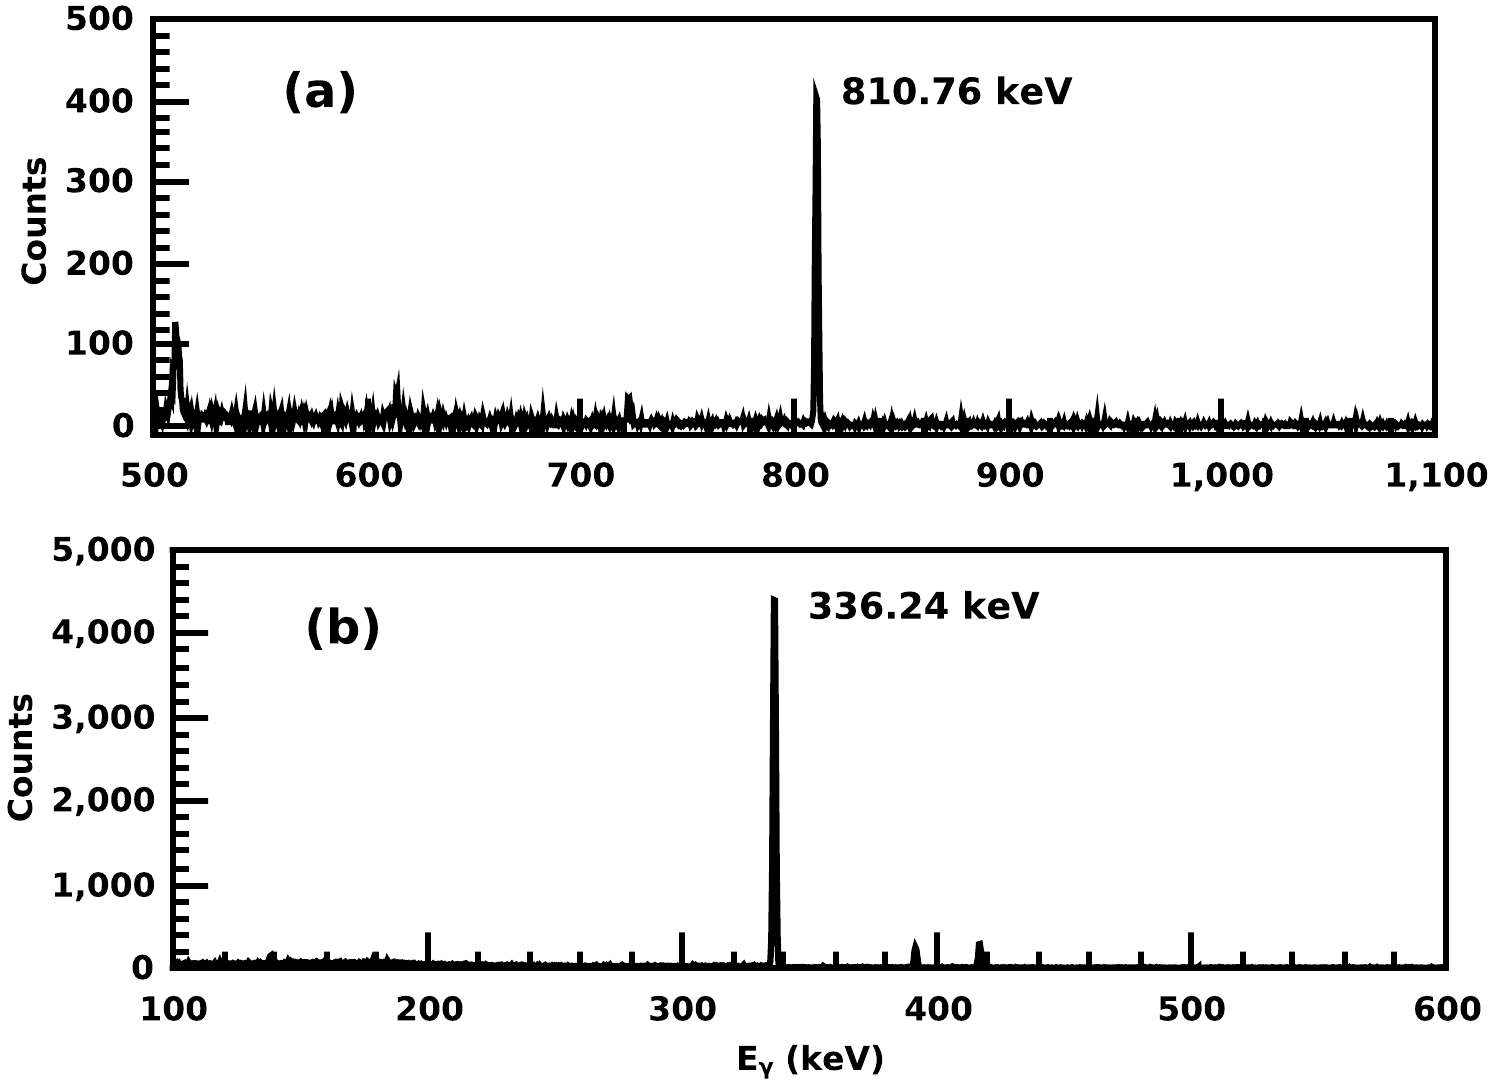
$ \sigma_m $ and$ \sigma_s $ are the nuclear reaction cross sections of the monitor and sample,$ C_m $ and$ C_s $ are the peak area counts for the monitor and sample foils,$ \lambda_m $ and$ \lambda_s $ are the decay constants for the sample and monitor nuclear reactions,$ I_m $ and$ I_s $ denote the gamma-ray intensities of the radioisotopes from the monitor and sample foils,$ N_m $ and$ N_s $ denote the particle number densities for the monitor and sample foils, and$ \varepsilon_m $ and$ \varepsilon_s $ denote the detector efficiencies for the γ-rays of the monitor and sample nuclear reaction products. Furthermore,$N_{\rm low}(s, m)$ denotes the low-energy background neutron contribution correction factor for target and monitor reactions. In Eqs. (2) and (3), the cooling time, irradiation time, and counting time for the monitor and sample foils are denoted by$ (t_c)_{m,s} $ ,$ (t_i)_{m,s} $ , and$ (t_a)_{m,s} $ respectively. The γ-ray spectrum for the irradiated target and monitor foil at an incident neutron energy of 2.85 MeV is shown in Fig. 2. Table 2 lists the decay data for the target and monitor nuclear reaction products [14].
Figure 2. γ-ray spectrum (a) for the irradiated target and (b) for monitoring foil at 2.85 MeV neutron energy.
Nuclear reaction Nuclide Half life $E\gamma$ /keV

$I\gamma$ (%)

58Ni(n, p) 58Co 70.86 d 810.76 99.45 115In(n, n') $^{115m}{\rm{In}}$ 

4.49 h 336.24 45.9 Table 2. The decay data for target and monitor nuclear reactions [14].
-
The Monte Carlo method was utilized in the present study to assess the uncertainties in the theoretically calculated cross section for the 58Ni(n, p)58Co reaction. We specifically focus on the systematic variation of two key nuclear inputs: first the optical model potential and second the level density parameter. These inputs play a crucial role in the theoretical models to describe the nuclear reaction mechanism and energy-dependent cross-sections. Furthermore, the level density is an important component in the calculation of the nuclear reaction cross-section. It characterizes the density of the nuclear energy levels as a function of excitation energy, which affects the population of excited states in compound nuclei and consequently the reaction cross-section. Theoretical calculations of nuclear reaction cross-sections are linked to uncertainties. There are different sources of uncertainties, such as uncertainty in the model parameters, uncertainties resulting from model flaws, algorithmic errors, etc. [15, 16]. Therefore, it is crucial to quantitatively understand these sources of uncertainty and how they affect the model's final outcomes. In our study, a widely used Woods-Saxon phenomenological optical model potential parameters were employed. To account for the uncertainties associated with the optical model and level density parameters, we adopt the Monte Carlo method [15, 17]. The main objective of the Monte Carlo method is to understand how certain nuclear input uncertainties affect the final reaction cross-section. By exploring a range of parameter values within their respective uncertainty bounds, we can generate a distribution of cross-sections, providing insight into the variability of the results caused by uncertainties in the theoretical model. In this method, we randomly sampled the input model parameters from their joint probability distribution function. These randomly selected parameter sets were then used to perform simulations of the theoretical model using the TALYS nuclear code [17, 18]. We randomly sampled the optical model parameters and level density parameters 200 times within the range of their uncertainties. In this study, we used the optical model parameters proposed by Koning and Delaroche [19] and the global level density parameters introduced by Koning et al. [20] as our initial parameters. Additionally, to incorporate uncertainties into our analysis, we utilized the initial parameter uncertainties from reference [17]. The optical model parameters and level density parameters and their associated percentage uncertainties used in the theoretical calculation of the cross section for the 58Ni(n, p)58Co reaction are provided in Table 3. Conversely, covariance analysis was used to calculate the uncertainties in the experimentally measured nuclear reaction cross section in the incident neutron energy range of 1 to 3 MeV. There are multiple sources of uncertainties, which contribute to the overall uncertainty in the experimentally measured cross sections. These sources include counts of the gamma-rays in the target and monitor foils, the intensity of gamma-rays, the decay constant of produced radionuclide, efficiency of HPGe detector, and number of particles in the target and monitor foils. The uncertainties of the aforementioned parameters can be correlated with each other. The covariance analysis is the concept in which we can measure the degree of correlation between two random variables. In the context of nuclear physics, the covariance study considers the correlation between various sources of uncertainty that contribute to total uncertainty in the experimentally measured nuclear reaction cross sections. The covariance matrix of the measured cross sections, denoted as
${{I}} _\sigma$ , can be expressed as the product of matrices [21, 22].S.No Optical potential parameter Value Uncertainty(%) 1 ${r}_v$ 

1.192 2 2 ${{a}}_v$ 

0.663 2 3 ${{v}}_1$ 

57.80 2 4 ${{v}}_2$ 

0.0072 3 5 ${{v}}_3$ 

0.000019 3 6 ${{W}}_1$ 

13.4 10 7 ${{W}}_2$ 

78.00 10 8 ${{r}}_d$ 

1.278 3 9 ${{a}}_d$ 

0.536 4 10 ${{d}}_1$ 

15.448 10 11 ${{d}}_2$ 

0.0218 10 12 ${{d}}_3$ 

10.50 10 13 ${{r}}_{so}$ 

1.00 10 14 ${{a}}_{so}$ 

0.58 10 15 ${{v}}_{so1}$ 

6.096 5 16 ${{v}}_{so2}$ 

0.004 10 17 ${{W}}_{so1}$ 

−3.10 20 18 ${{W}}_{so2}$ 

160.0 20 S.No Level density parameter Value Uncertainty(%) 1 $\sigma^2$ 

1.0 30 2 α 0.0722 30 3 β 0.195 30 4 γ 0.410 30 Table 3. Details of optical model as well as level density parameters and their associated percentage uncertainties used in the present study.
$ I_\sigma = F_yC_yF_y^T. $

(4) Specifically,
${{I}} _\sigma $ denotes the covariance matrix of m × m dimensions.${{C}} _y$ denotes a matrix of n × n dimensions and it represents a covariance matrix of the various attributes involved in the activation formula, which are provided in Eq. (1). To compute matrix${{I}} _\sigma$ , we introduce sensitivity matrix${{F}} _y$ :$ F_{yij} = \frac{\partial \sigma_i}{\partial y_j}, \quad i = 1, 2, ...,m;\; j = 1, 2, ..., n. $

(5) In this equation, m denotes the total number of measured cross sections for a particular nuclear reaction, and n denotes the total number of attributes in the activation formula.
To effectively understand the interplay between different attributes, let us consider two specific attributes, denoted as
$ y_j $ and$ y_k $ (where j, k = 1, 2,..., n), which are essential in calculating the cross section. The covariance matrix (${{C}} _y$ ) for these attributes can be obtained using the following relation [23]:$ C_y(y_j, y_k) = Cor(y_j, y_k) \cdot (\Delta y_j \cdot \Delta y_k). $

(6) Specifically, Cor(
$ y_j, y_k $ ) denotes the correlation coefficient between variables$ y_j $ and$ y_k $ , considering values in the range of 0 to 1. A correlation coefficient of 1 indicates that$ y_j $ and$ y_k $ are fully correlated, whereas a value of 0 implies no correlation. Firstly, a set of parameters, along with their corresponding uncertainties presented in Table 4, is defined, which contributes to the uncertainty in the measured reaction cross-section. Utilizing Eq. (6) and Table 4, we constructed a 33 × 33 semi-covariance matrix for these variables. Consequently, we determined a 3 × 33 sensitivity matrix for the measured nuclear reaction cross sections by using Eq. (5) and by incorporating the semi-covariance and sensitivity matrices into Eq. (4). Furthermore, we computed a 3 × 3 covariance matrix for the measured nuclear reaction cross-section across three incident neutron energies.$x_i$ 

$\Delta x_i $ (%)

$\sigma_m$ 

1–4 $C_m$ 

1–3 $C_s$ 

4–8 $\lambda_s$ 

0.09 $\lambda_m$ 

0.09 $I_S$ 

0.59 $I_m$ 

0.59 $N_s$ 

0–1 $N_m$ 

1–2 $\epsilon_s$ 

2.42 $\epsilon_m$ 

2.21 Table 4. Uncertainties in various parameters contributing to the uncertainty in the measured reaction cross sections.
-
This section presented a comparison between the mea-sured experimental cross section data and existing experimental data from the EXFOR [24] for reaction 58Ni(n, p)58Co. The radionuclide 58Co produced from this nuclear reaction has a half-life of 70 days. Furthermore, γ-ray with an energy of 810.76 keV and an intensity (
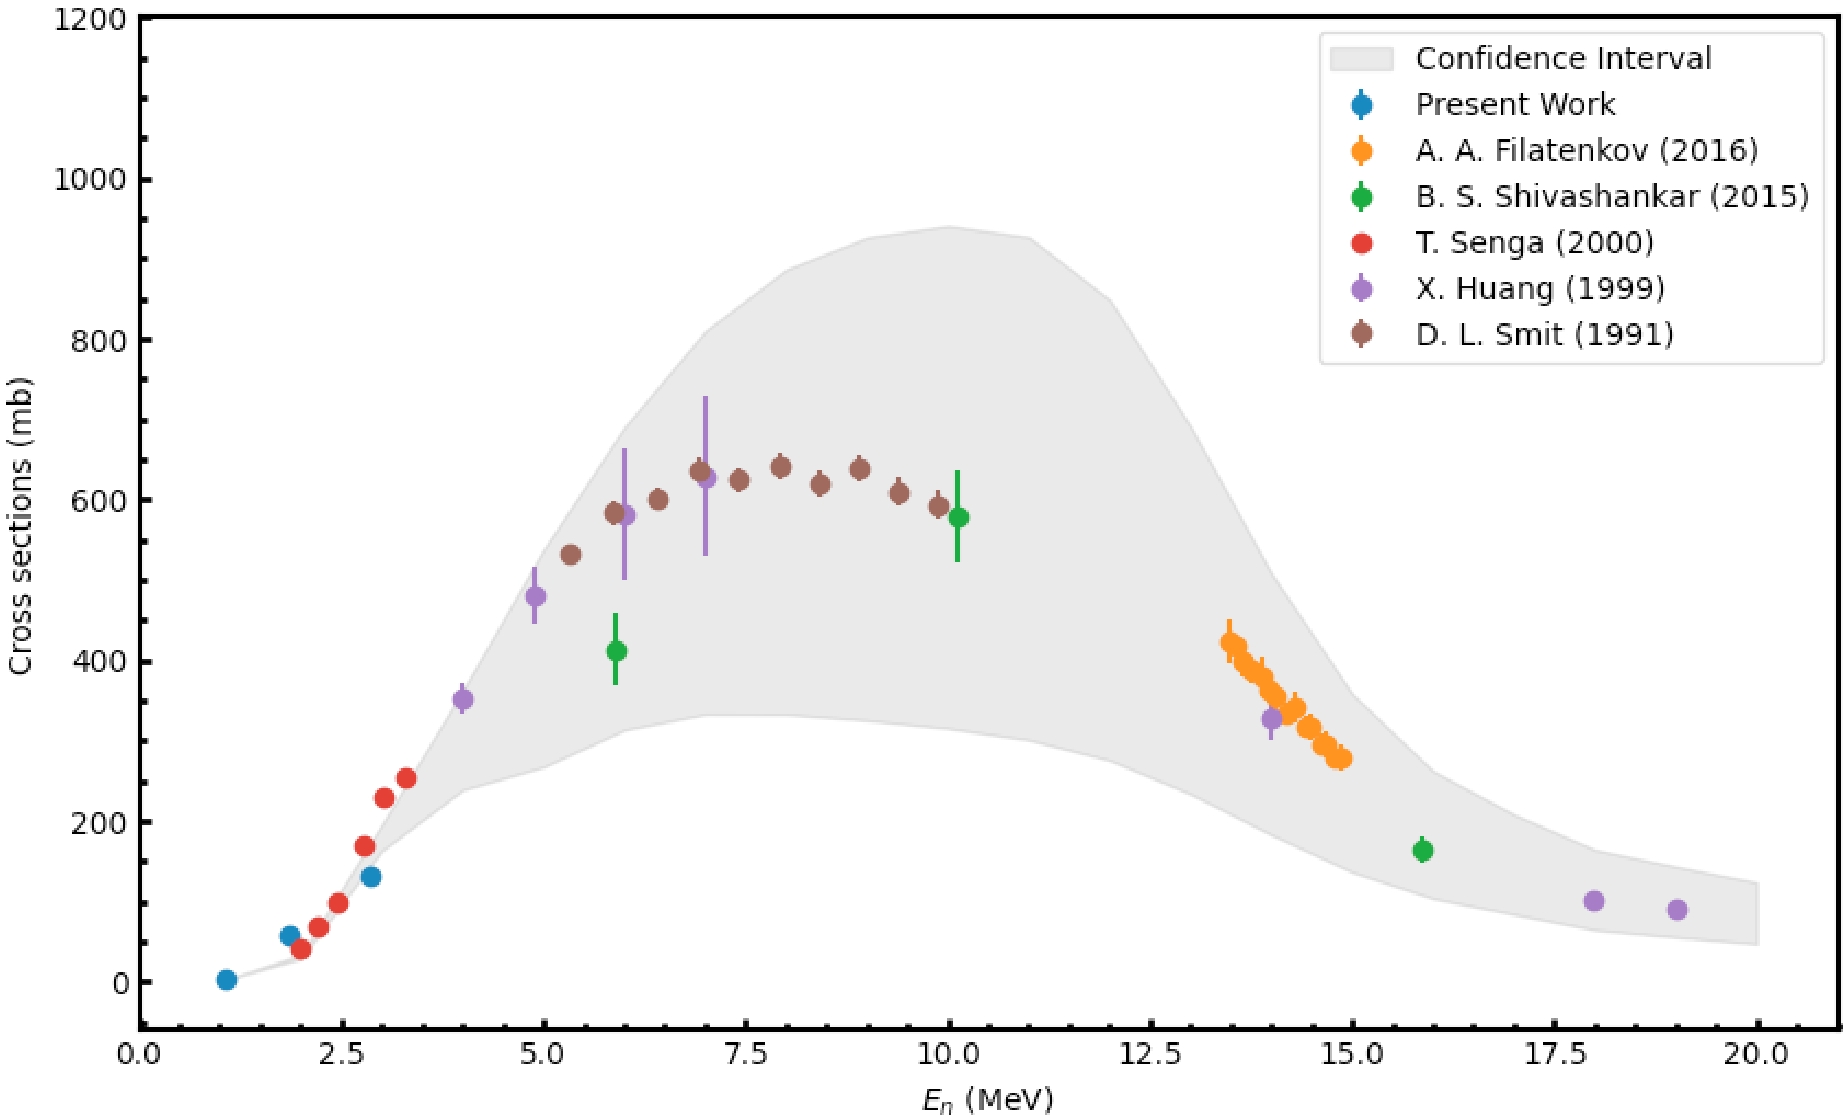
$I\gamma $ ) of 99.45 % was used to calculate the cross sections for the reaction 58Ni(n, p)58Co. Table 5 presents the measured reaction cross sections in the incident neutron energy range of 1 to 3 MeV, their uncertainties, and the covariance matrix for the reaction 58Ni(n, p)58Co. Additionally, we calculate 95% confidence interval for the theoretical cross section uncertainties in the incident neutron energy range of 1 to 20 MeV. The 95% confidence interval provides a high level of certainty regarding where the cross-section value is expected. This range represents a measurement of the precision and accuracy of the theoretical predictions, considering the combined impact of all input parameter uncertainties. Figure 3 shows a comparison among measured experimental results from this study, existing data from EXFOR, and 95% confidence interval of the theoretical prediction for the 58Ni(n, p)58Co reaction. The measured experimental reaction cross section and existing data provided by Senga et al., [25] are in good agreement. Furthermore, it is concluded from Fig. 3 that all the experimental results provided by Senga et al. [25], Filatenkov [26], Shivashankar et al. [27], Huang et al. [28], and Smith et al. [29] are in the 95 % confidence interval of the theoretical prediction for the 58Ni(n, p)58Co reaction.${E}_{n}$ /MeV

Cross section /mb (σ ± $\bigtriangleup\sigma$ )

Covariance matrix 1.06 2.88 ± 0.28 0.076 1.86 58.66± 3.36 0.139 11.260 2.85 131.23 ± 7.35 0.294 6.342 53.976 Table 5. Obtained cross section with covariance matrix and their uncertainty for 58Ni(n, p)58Co reaction at three different neutron energies.
-
In this study, we presented a comprehensive study on the uncertainty quantification of the 58Ni(n, p)58Co reaction cross section. We presented the measured nuclear reaction cross sections in the incident neutron energy range of 1 to 3 MeV with their uncertainties, a covariance matrix, and presented the 95% confidence interval of the theoretical prediction in the energy range of 1 to 20 MeV. In the present study, the impact of uncertainties associated with optical model parameters and level density parameters on the predictions for the 58Ni(n, p)58Co reaction were systematically investigated via Monte Carlo method. The experimental results from this study and available data from the EXFOR are in good agreement. Based on this study, we determined that all experimentally measured cross sections for the 58Ni(n, p)58Co reaction are consistent within the theoretical bands of uncertainties. Given that the 58Ni(n, p)58Co reaction is important in nuclear technology and medical applications, results with uncertainties and a covariance matrix can be used for these different applications. In the field of nuclear technology, the 58Ni(n, p)58Co reaction is critical to the advancement of next-generation nuclear reactors and accelerator-driven systems. As presented in our study, accurate determination of reaction cross sections and associated uncertainties contributes important insights in optimizing the safety and efficiency of nuclear technology. Furthermore, this study holds significant implications for medical applications. Additionally, 58Co, a product of the 58Ni(n, p)58Co reaction, is extensively utilized in cancer treatment through radiotherapy. Accurate knowledge of the reaction cross section and its uncertainties are indispensable for optimizing production processes, ensuring a stable supply of medical isotopes, and maintaining high standards of quality control in facilities dedicated to medical isotope production.
-
We would like to thank the FOTIA facility staff for their excellent operation of the accelerator and support throughout the experiment.
Comprehensive analysis of uncertainty quantification for the 58Ni(n, p)58Co reaction cross section
- Received Date: 2024-02-10
- Available Online: 2024-09-15
Abstract: In this study, we measured the 58Ni(n, p)58Co reaction cross section with neutron energies of 1.06, 1.86, and 2.85 MeV. The cross section was measured using neutron activation techniques and γ-ray spectroscopy, and it was compared with cross section data available in the EXFOR. Furthermore, we calculated the covariance matrix of the measured cross section for the aforementioned nuclear reaction. The uncertainties of the theoretical calculation for 58Ni(n, p)58Co reaction cross section were calculated via Monte Carlo method. In this study, we used uncertainties in the optical model and level density parameters to calculate uncertainties in the theoretical cross sections. The theoretical calculations were performed by using TALYS-1.96. In this study, we aim to analyze the effect of uncertainties of the nuclear model input as well as different experimental variables used to obtain the values of reaction cross section.


 Abstract
 HTML
HTML Reference
 Related
 PDF
PDF


 DownLoad: