-
Significant progress has been made in recent decades in dealing with strongly coupled systems owing to the Anti-de-Sitter (AdS)/conformal field theory (CFT) correspondence [1−3], which provides a concrete relation between the strongly coupled quantum field theories and dynamics of a classical gravitational theory in the bulk of gravitational space-time [4]. This theory relates gravity in a (
$ d+1 $ )-dimensional AdS space-time to a strongly coupled d-dimensional quantum field theory on its boundary. From this perspective, AdS/CFT correspondence is successfully applied in different areas, such as the relation between the strong coupling dynamics of quantum chromodynamics and electro-weak theories, physics of black holes (BHs) and quantum gravity, relativistic hydrodynamics, condensed matter physics, superfluidity, and superconductivity [5−15]. Further, quantum information uses AdS/CFT as a powerful tool and provides an interesting result on multi-body systems, such as holographic entanglement entropy [16], mutual information [17], entanglement of purification [18], and holographic complexity [19, 20].One of the fundamental goals of studying AdS/CFT correspondence is to analyze what class of quantum materials possess their gravity dual. Nevertheless, it is unknown whether such a material exists, especially with its gravitational dual in our universe. However, the characteristics of such a material would enable its analysis via classical or even quantum gravity in tabletop experiments. Hence, investigating the nature of such a material and whether it has a gravitational dual, is necessary. Recently, based on AdS/CFT correspondence, the authors in [21] found sources on the boundary that generate one wave packet drawing a null geodesic inside the bulk. They analyzed the behavior of such a wave packet inside the bulk and built a useful technique for identifying the holographic materials. In [22], the authors proposed a method to create a star orbiting in an asymptotically AdS space-time, and then, they investigated the angular position of the star using the lensed response function in the framework of AdS/CFT correspondence. Therefore, the AdS/CFT correspondence strongly supports a better understanding of various physical topics.
In contrast, we have witnessed the beginning of a new era in BH gravitational physics triggered by the leap in the quantity, quality, and variety of observational data from different probes. A BH is a particular astrophysical object in our universe that possesses a powerful gravitational field, resulting in a significantly curved space-time. A BH is a solution of Einstein's field equations, describing the space-time geometry regions that have undergone gravitational collapse. In this scenario, in 2019, the Event Horizon Telescope (EHT) released the first ultra-high angular resolution image of the super-massive BH M87, driving the interest to further analyze the BH physics [23, 24]. Later, in 2021, EHT measured the polarization of M87, considering the magnetic fields and plasma properties, which provided significant information regarding the launch of energetic jets from its core [25, 26]. As a milestone in the history of BH, these findings are scientifically important because these images reveal structural information about BHs, such as the accretion process of various types of matter, the radiation mechanism, and other relevant astrophysical phenomena. They also provide strong evidence for general relativity (GR).
A prominent feature of this image is that a dark interior is surrounded by a bright ring-shaped accretion disk, in which the central dark region and the bright ring are the so-called shadow and the photon ring of the BH, respectively. The light trajectories emitted from the accretion material are deflected due to the strong gravitational field near the BH, which thus makes it possible to analyze the geometry of the BH under different accretion flows. The image of the BH shadow is projected onto the local sky for a distant observer, as it is gravitationally lensed, which is observed by the strong gravitational field near the BH. Hence, studies on the shadow and gravitational lensing of BHs are feasible methods for investigating the interesting features of the gravitational field [27, 28]. Studying BH shadows and their optical appearance is of paramount importance in the scientific community owing to the different interesting scenarios of matter accretions around the BHs. Gralla et al. [29] analyzed the shadow and photon ring of a Schwarzschild BH and found that the total luminosity of a BH shadow depends on the location and form of the accretion material around the BH. By establishing different accretion flow models, the study of BH shadows has become a subject of significant interest; for instance, see Refs. [30−36].
Although the properties of a BH shadow and its relevant dynamics have been extensively studied, providing concrete information about BH physics, several mysteries are yet to be elucidated using more realistic models. From this perspective, Hashimoto et al. [37, 38] proposed a method to construct the holographic images of the BH in bulk when the scalar wave emitted by the source at the AdS boundary enters the bulk field and propagates in bulk space-time. Particularly, they observed the Einstein ring on the holographic images, and the size of the ring was consistent with that of the BH photon sphere, which is calculated through geometrical optics. Liu et al. [39] investigated the Einstein ring structure for the lensed response of the complex scalar field as a probe wave on the charged AdS BH in the framework of the AdS/CFT correspondence. They observed that such an Einstein ring emerged at high frequencies and could be well captured by the photon sphere, away from the BH horizon, in the geometric optics approximation, and this distinct feature supports the existence of gravity dual. Further, in the framework of the AdS/CFT correspondence, the authors in [40−42] also investigated some distinct features of the Einstein ring in modified theories of gravity. The photon ring of the asymptotically AdS BH, dual to a superconductor, was observed on a two-dimensional sphere [43], where the influence of the charge scalar condensate on the image was investigated; the bulk images depicted the discontinuous change in the size of the photon ring.
Einstein's theory of GR is one of the most successful and well-established gravitational theories in modern physics; however, it has many theoretical and observational shortcomings, such as the current behavior of our universe [44], the rotation curves of galaxies [45], and some tension in cosmological data [46]. In GR, we often encounter the presence of singularities and the lack of a self-consistent theory of quantum gravity. In addition, from the observational point of view, GR does not address the galactic, extra-galactic, and cosmic dynamics without dark matter and dark energy [47−49]. The research community divided the GR into two groups to resolve the problem of exotic matter: either dark matter exists or Einstein's field equations need modifications. Therefore, several modified theories have been developed as a generalization of GR to resolve such problems [50, 51]. In [52], the authors calculated the velocity of galaxies in clusters and found that the gravitational mass is greater than the luminous matter. In this scenario, we require modified theories where the gravitational part is non-minimally coupled with the dynamical vector fields, and hence, the dark matter/energy problem is resolved through understandable dynamical vector fields.
Some promising modified gravitational theories, such as the Gauss-Bonnet theory [53], the
$ f(R) $ theory (in which R is the Ricci scalar) [54] and its extended versions with minimal/non-minimal interactions among various fields including$ f(R,T) $ (where T is the trace of energy-momentum tensor) [55], scalar-tensor theories and their generalized versions [56], and the teleparallel theory of gravity [57], have been proposed. Among these theories, the STVG theory, sometimes referred to as modified gravity (MOG), extends GR by adding extra scalar and vector fields [58]. The main goal is to provide an alternative description of dark matter phenomenology. Indeed, massive vector fields are coupled to matter and exert a repulsive gravitational force on the test particles, which no longer move along the geodesics. Then, the gravitational force is reduced with respect to the Newtonian on small astrophysical scales, such as the galactic and sub-galactic ones. This theory explains cosmic phenomena without introducing dark matter [59]. The weak-field limit of the STVG theory shows a Yukawa correction to the Newtonian potential that is modulated by two parameters: α, which represents the strength of the gravitational force, and$ \hat{\mu} $ , which represents the inverse of the characteristic Yukawa length [45, 60].STVG has been widely tested in different astrophysical scenarios. Recently, the orbital motion of the S2 star around the supermassive BH at the centre of the Milky Way has been used to set an upper limit on the value of the strength parameter
$ \alpha\leq0.410 $ at 99.7% confidence level [61, 62], which agrees with the prediction of the STVG for a gravitational mass source of$ \sim10^{6}M_{\odot} $ . The parameters α and$ \hat{\mu} $ of STVG have also been bounded using galactic kinematics. For instance, the rotation curves extracted from the HI Nearby Galaxy Survey catalog of galaxies were used to constrain$ \alpha = 8.89\pm0.34 $ and$ \hat{\mu} = 0.042\pm 0.004 $ kpc–1, as averaged values of the whole sample [45]. Furthermore, STVG has been satisfactorily tested with N-body simulations to study the global stability of a self-gravitating disc [63]; it has also been used to successfully fit multi-wavelength observations of galaxy clusters and directly detect gravitational waves [60, 64, 65].The Schwarzschild MOG BH is a static, spherically symmetric vacuum solution derived from STVG based on the Einstein-Hilbert action combined with a massive vector field and matter action [58, 66]. Investigating such BHs is necessary and has profound implications for our understanding of the universe, as STVG successfully explains some phenomena in solar system observation, the dynamics of galactic clusters, and the rotation curves of galaxies [45, 67]. In , the authors considered the modified gravity theory MOG and estimated the effective lensing mass
$ M_{L} = (1+\alpha)M_{b} = 5.2\times10^{12}M_{\odot} $ within$ R = 18.3 $ kpc for a baryon mass$ M_{b} = 1.0\times10^{12}M_{\odot} $ , which produced the observed Einstein ring angular radius$ \theta_{E} = 10'' $ within the same radius. Finally, they concluded that the MOG can fit the lensing and Einstein ring in Abell$ 3827 $ without dark matter as well as GR with dark matter. In [65], Moffat investigated the nature of gravitational waves in a generalized MOG theory. They derived the linearized field equations for two compact objects and a generalized Kerr metric describing a spinning BH determined by its mass M and spin parameter$ a = cs/Gm^{2} $ . Moreover, they observed that the LIGO-Virgo collaboration data are fitted with smaller binary BH masses in agreement with the current electromagnetic and observed X-ray binary upper bound for a BH mass,$ M\lesssim M_{\odot} $ . In [68], the author introduced the Hamiltonian formalism for the dynamics of the massive and massless particles in STVG, as well as the post-Newtonian approximation of the equations of motion. The circular motions of the neutral test particles on the equatorial plane of a Schwarzschild-MOG BH were reported in [69], while the dynamics of massive charged particles around this BH with an external magnetic field were detailed in [70]. In addition, the light deflections and lensing effects in this gravitational field were discussed in [71−73].The shadows cast by static and rotating MOG BHs for different values of model parameters are discussed in detail by Moffat [74]. The circular motion of test particles around the Schwarzschild-MOG BH are discussed in [75]. In [76], the authors studied the influence of parameter α on the optical features of Schwarzschild-MOG BHs with different thin accretions in the STVG theory. In addition, they constrained the parameter α with experimental data, reported by the EHT collaboration for M87 and Sagittarius A. The structure growth and cosmic microwave background are discussed in the STVG theory, in which the determined matter power spectrum is in agreement with current galaxy redshift surveys [77]. In [78], the authors investigated the quasinormal modes of generalized ABG (Ayón-Beato-García) BHs in STVG gravity. In the framework of the STVG model, the thermodynamic phase transition of AdS Schwarzschild BH was investigated in [79]. Li et al. [80] studied the thermal fluctuation, deflection angle, and greybody factor of a high-dimensional Schwarzschild BH in STVG. Cai and Miao [81] calculated the high-dimensional static spherically symmetric Schwarzschild BH in STVG (which is a high-dimensional modification of STVG) and studied the quasinormal modes of a massless scalar field and BH shadow. Recently, the shadow of a regular BH and its energy emission rate have been analyzed in STVG theory [82].
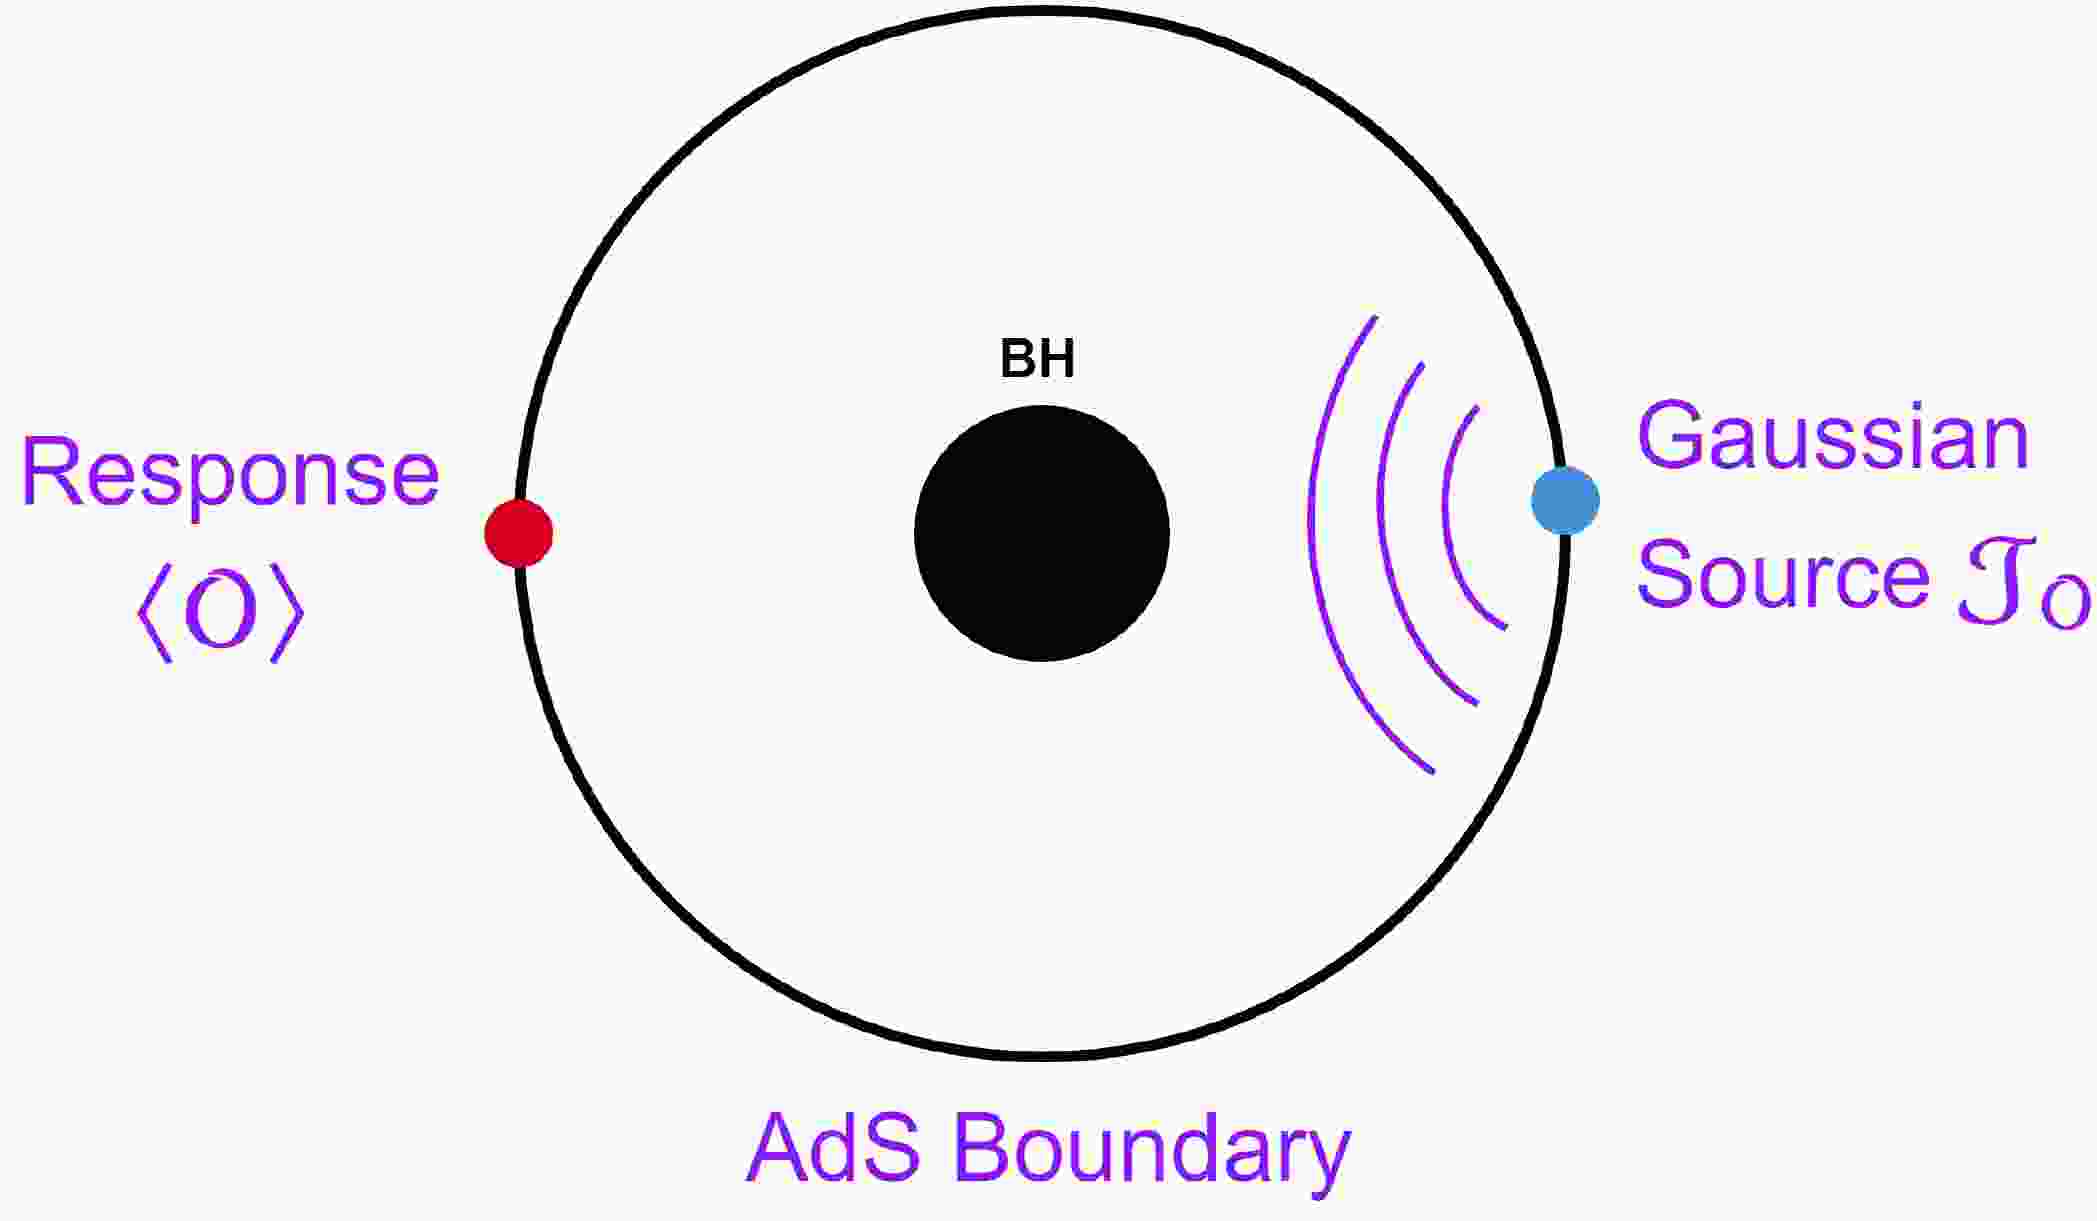
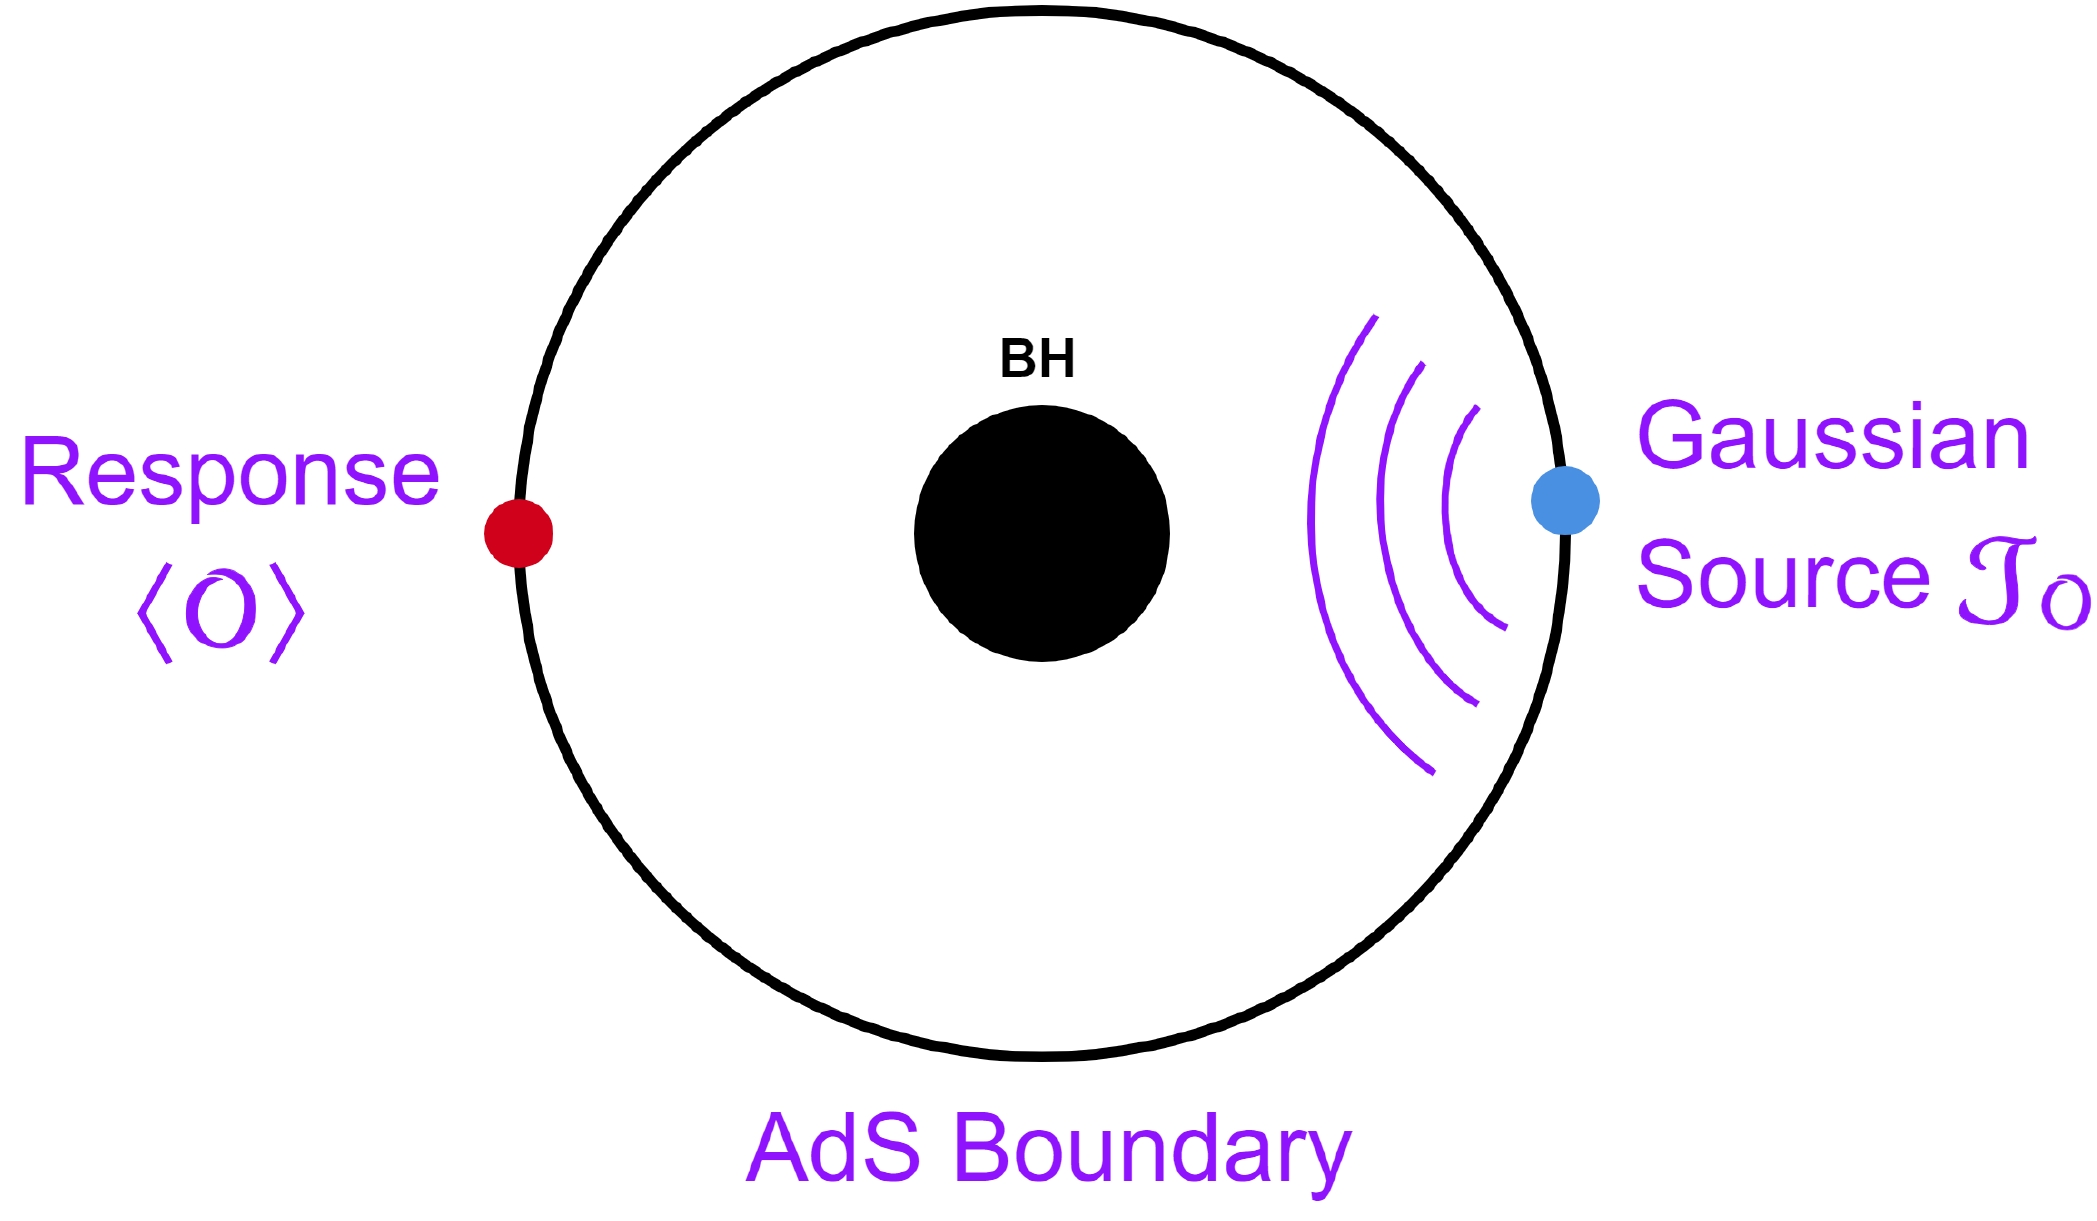
In the context of AdS/CFT correspondence, the present study analyzes the holographic Einstein images of an AdS Schwarzschild STVG BH solutions in bulk from a particular response function on one side of the AdS boundary, in which the response function is produced by the source, which lies far away from the response function on the other side of the AdS boundary. We employ an oscillatory Gaussian wave source
$ {\cal{J}}_{\cal{O}} $ on one side of the AdS boundary, and a bulk scalar wave generated by the source is injected into the bulk from the AdS boundary. The scalar wave propagates inside the BH space-time and reaches the other side of the AdS boundary, and the corresponding response function, such as$ \langle O\rangle $ , is generated, providing information about the bulk structure of the BH space-time [37, 38]. We depict this setup in Fig. 1.Considering a special optical method, we calculate a formula, which converts the extracted response function
$ \langle O\rangle $ to an image of the dual BH, which can be observed on a virtual screen. The ($ 2+1 $ )-dimensional boundary CFT on a 2-sphere$ S^{2} $ is naturally dual to a BH in the AdS4 space-time and a probe massless bulk scalar field in the space-time.The rest of this paper is organized as follows. In Section II, we define the summary of the AdS Schwarzschild STVG BH metric, and the holographic setup for the given response function is defined in Section III. In Section IV, we introduce optical image formation in wave optics and discuss the null geodesics for the AdS Schwarzschild STVG BH based on geometrical optics. We also provide a comparison of the Einstein radius of the photon sphere obtained from the geometric optics with that of the holographic ring image constructed from the response function based on wave optics in the same section. The last section concludes the study and provides a future research outlook.
-
We start from the general action of STVG theory [58], which is given as
$ {\cal{I}} = {\cal{I}}_{Gr}+{\cal{I}}_{\Phi}+{\cal{I}}_{S}+{\cal{I}}_{M}, $

(1) where
$ {\cal{I}}_{Gr} = \frac{1}{16 \pi }\int {\rm d}^4{x\sqrt{-g}}\bigg[\frac{1}{G}\bigg(R+2\Lambda\bigg)\bigg], $

(2) $ {\cal{I}}_{\Phi} = -\int {\rm d}^4{x\sqrt{-g}}\bigg[{\cal{T}}\bigg(\frac{1}{4}B^{\xi\zeta}B_{\xi\zeta}+V(\Phi)\bigg)\bigg], $

(3) $ \begin{aligned}[b] {\cal{I}}_{S} =\;& \int {\rm d}^4{x\sqrt{-g}}\bigg[\frac{1}{G^{3}}\bigg(\frac{1}{2}g^{\xi\zeta}\nabla_{\xi}G\nabla_{\zeta}G-V(G)\bigg)\bigg]\\&+ \int {\rm d}^4{x\sqrt{-g}}\bigg[\frac{1}{G}\bigg(\frac{1}{2}g^{\xi\zeta}\nabla_{\xi}{\cal{T}}\nabla_{\zeta}{\cal{T}}- V({\cal{T}})\bigg)\bigg] \\ &+\int {\rm d}^4{x\sqrt{-g}}\bigg[\frac{1}{\xi^{2} G}\bigg(\frac{1}{2}g^{\xi\zeta}\nabla_{\xi}\xi\nabla_{\zeta}\xi- V(\xi)\bigg)\bigg]. \end{aligned}$

(4) in which
$ {\cal{I}}_{Gr} $ is the gravity part, defined by the Einstein Hilbert action with additional cosmological parameter Λ,$ {\cal{I}}_{\Phi} $ is the modified massive vector field of the action,$ {\cal{I}}_{S} $ represents the scalar part of the action, and$ {\cal{I}}_{M} $ is the matter action. Further, g denotes the determinant of the metric tensor, R is the Ricci scalar,$ V(\Phi) = \dfrac{1}{2}\xi^{2}\Phi^{\xi}\Phi_{\xi} $ is the self-interacting potential,$ \Phi_{\xi} $ refers to the massive vector field with mass parameter ξ,$ B_{\xi\zeta} = \partial_{\xi}\Phi_{\zeta}-\partial_{\zeta}\Phi_{\xi} $ is the anti-symmetric linear part, and$ {\cal{T}} $ is a dimensionless scalar field with potential$ V({\cal{T}}) $ .$ G(x) $ and$ \xi(x) $ are the scalar fields, and$ V(G) $ and$ V(\xi) $ are the corresponding potentials, respectively.$ \nabla_{\xi} $ is the covariant derivative for a metric tensor$ g_{\xi\zeta} $ . Since the influence of the vector field$ \Phi_{\xi} $ with mass ξ becomes prominent at kiloparsec distances from the source, the mass of the vector field is disregarded when solving the field equations for compact objects such as BHs [79, 82].Further, at the slowly varying regime, one can consider Newton's gravity coupling parameter as
$ G = G_{N}(1+\alpha) $ , in which$ G_{N} $ is Newton's gravitational constant and α is a dimensionless parameter, which comes from the alternative participation of the above defined action of the scalar part$ G(x) $ at the slowly varying regime. In addition, GR can be recovered when$ \alpha = 0 $ , which is usually known as the gravitational charge; thus, we can regard the deviation of the STVG theory with respect to GR, as given by parameter α. Recently, the authors in [83] analyzed the influence of the coupling parameter α on the stabilization of orbits of magnetized particles moving around the Schwarzschild BH in the STVG theory. The thermodynamic behavior of the Schwarzschild BH in the framework of the STVG theory is discussed in [84], where the BH heat capacity depicted the sign change at critical mass with the presence of Hawking radiation.BH solutions with a non-vanishing cosmological constant Λ recently garnered significant interest among researchers owing to two interesting features, i.e., they are crucial in the phenomenology of the AdS/CFT correspondence [1−3], which associates the cosmological constant with the rank of the gauge group, and the universe may have a small positive value of Λ, as indicated by the observational data [85]. In fact, many authors have improved our understanding by investigating the interesting features of AdS BHs in the context of different modified theories. In [86], the author obtained that the cosmological parameter increased the efficiency of the Penrose process in the AdS BH for the case of
$ \Lambda = 0 $ .The line element of the AdS Schwarzschild BH in the STVG theory is given as [79]
$ {\rm d}s^{2} = -f(r){\rm d}t^{2}+\frac{{\rm d}r^{2}}{f(r)}+r^{2}{\rm d}\Omega^{2}, $

(5) where
$ f(r) = 1-\frac{2(1+\alpha)M}{r}+\frac{\alpha(1+\alpha)M^{2}}{r^{2}}+\frac{r^{2}}{l^{2}}, $

(6) in which
$ G_{N} = 1 $ , M is the mass of the BH, l represents the radius of the AdS space, which is associated with the cosmological parameter as$ l^{2} = -\dfrac{3}{\Lambda} $ for$ \Lambda<0 $ , and${\rm d}\Omega^{2} = {\rm d}\theta^{2}+\sin^{2}\theta {\rm d}\phi^{2}$ , since negative Λ in the bulk is generally related to the degrees of freedom of the dual CFT on the boundary. For simplicity, hereafter, we set$ l = 1 $ . Next, we analyze the Einstein ring structure of the above metric in the context of AdS/CFT. -
Based on the above metric, we define the holographic mechanism of the AdS Schwarzschild STVG BH in the framework of AdS/CFT correspondence. For this, we set
$ h = 1/r $ and$ f(r) = h^{-2}f(h) $ . From this perspective, we define the metric (5) in a new coordinate as follows:$ {\rm d}s^{2} = \frac{1}{h^{2}}\left[-f(h){\rm d}t^{2}+\frac{{\rm d}h^{2}}{f(h)}+{\rm d}\Omega^{2}\right]. $

(7) Scalar fields are one of the simplest types of matter often considered by physicists. Since
$ 2012 $ , observational evidence has indicated that fundamental scalar fields exist in nature [87, 88]. However scalar fields have been considered in phenomenological models within gravitational physics for decades. Scalar fields may be considered a proxy to realistic matter since canonical scalar fields can be modeled as perfect fluids with some equation of state [89]. The theory that combines quantum mechanics and general relativity is still incomplete. Several results, considering scalar fields, can be found in literature, such as aspects of the quasinormal modes and quantization [90], scattering waves [91], tunneling of scalar particles [92], the BH hair from scalar dark matter [93], and growth of massive scalar hair around a Schwarzschild BH [94]. Inspired by these ground-breaking studies, it is concluded that scalar fields provide valuable information about various physical phenomena in a BH spacetime region. In this regard, several studies have been conducted with massive and massless scalar fields or even with quintessence dark energy frameworks.Recently, based on the AdS/CFT correspondence, the authors in [39, 95, 96] successfully derived the holographic images of BHs in the bulk by utilizing a response function generated from a given wave source, in which they used the method of the wave optics. Similarly, researchers have also discussed the holographic Einstein ring images, considering the dynamics of the massless scalar field (for a detailed review see Refs. [40−42]). By considering the massless scalar field, He et al. [97] employed the AdS/CFT correspondence and investigated the holographic images of the Hayward-AdS BH surrounded by quintessence dark energy. In this scenario, for a massless scalar field, we define the Klein-Gordon equation, which helps determine the dynamics, as [38]
$ \square\Psi = 0. $

(8) To solve the above equation, we define the ongoing Eddington coordinates as [39]
$ v = t+h_{\star} = t-\int\frac{1}{f(h)}{\rm d}h, $

(9) and then, the metric function can be further expressed as
$ {\rm d}s^{2} = \frac{1}{h^{2}}[-f(h){\rm d}v^{2}-2{\rm d}h{\rm d}v+{\rm d}\Omega^{2}]. $

(10) The asymptotic behavior of the scalar field close to the AdS boundary becomes
$\begin{aligned}[b] \Psi(v,h,\theta,\phi) =\;& {\cal{J}}_{\cal{O}}(v,\theta,\phi)+h\partial_{v}{\cal{J}}_{\cal{O}}(v,\theta,\phi)\\&+ \frac{1}{2}h^{2}D^{2}{\cal{J}}_{\cal{O}}(v,\theta,\phi)+\langle O\rangle h^{3}+{\cal{O}}(h^{4}),\end{aligned} $

(11) in which
$ D^{2} $ represents the scalar Laplacian on unit$ {\cal{S}}^{2} $ . From the AdS/CFT point of view,$ {\cal{J}}_{\cal{O}} $ and$ \langle O\rangle $ are interpreted as the external source and the corresponding expected response function in dual CFT, respectively [98]. We consider an axis-symmetric and monochromatic oscillating Gaussian wave packet source, which is located at the south pole of the AdS boundary, i.e.,$ \theta = \pi $ . In this regard, we have$ {\cal{J}}_{\cal{O}}(v,\theta) = {\rm e}^{-{\rm i}\omega v}\exp\bigg[\frac{-(\pi-\theta)^{2}}{2\rho^{2}}\bigg]\frac{1}{2\pi\rho^{2}} = {\rm e}^{-{\rm i}\omega v}\sum\limits_{l = 0}^{\infty} Y_{l0}(\theta)N_{lo}, $

(12) with
$ N_{l0} = (-1)^{l}\bigg(\frac{(l+1/2)}{2\pi}\bigg)^{\frac{1}{2}}\exp\bigg[-\frac{(l+1/2)^{2}\rho^{2}}{2}\bigg], $

(13) in which ρ represents the width of the Gaussian wave source;
$ Y_{l0}(\theta) $ ,$ N_{lo} $ , and l represent the spherical harmonics function, its coefficient, and its magnetic quantum number, respectively. Considering the smallest value of the Gaussian tail, we only consider the case of$\rho \ll \pi$ . In the symmetry of the spacetime fabric, supported by the given source (12), one can further decompose the scalar field$ \Psi(v,h,\theta,\phi) $ as$ \Psi(v,h,\theta,\phi) = {\rm e}^{-{\rm i}\omega v}\sum\limits_{l = 0}^{\infty}\sum\limits_{n = -l}^{l}Y_{l0}H_{l}(h)N_{l0}, $

(14) and the corresponding response function can be written as
$ \langle O\rangle = {\rm e}^{-{\rm i}\omega v}\sum\limits_{l = 0}^{\infty}Y_{l0}\langle O\rangle_{l} N_{lo}(\theta). $

(15) From Eq. (14), we obtain
$ H_{l} $ , which satisfies the equation of motion$\begin{aligned}[b]& h^{2}f(h)H''_{l}+[h^{2}f'(h)-2hf(h)+2 {\rm i}\omega h^{2}]H'_{l}\\&\quad+[-2{\rm i} \omega h-l(l+1)h^{2}]H_{l} = 0,\end{aligned} $

(16) and its asymptotic behavior close to the AdS boundary can be written as
$ \lim\limits_{h \to 0}H_{l} = 1- {\rm i}\omega h+\frac{h^{2}}{2}(-l(1+l))+\langle O\rangle_{l}h^{3}+{\cal{O}}(h^{4}). $

(17) Clearly, Eq. (16) has two boundary conditions for function
$ H_{l} $ , i.e., the horizon boundary condition for which$ f(h) $ in Eq. (16) vanishes, and the AdS boundary condition where$ H_{l}(0) = 1 $ . Our main task is to solve Eq. (16) according to these boundary conditions and obtain the function$ H_{l} $ using the pseudo-spectral method [37, 38]. In this case, we can extract$ \langle O\rangle_{l} $ based on Eq. (17). Using the extracted$ \langle O\rangle_{l} $ and Eq. (15), one can obtain the value of the total response function as depicted in the profiles of the total response function in Figs. 2 to 4. In these profiles, the physical interference pattern arises from the scalar wave propagates in the bulk field and is diffracted by the BH.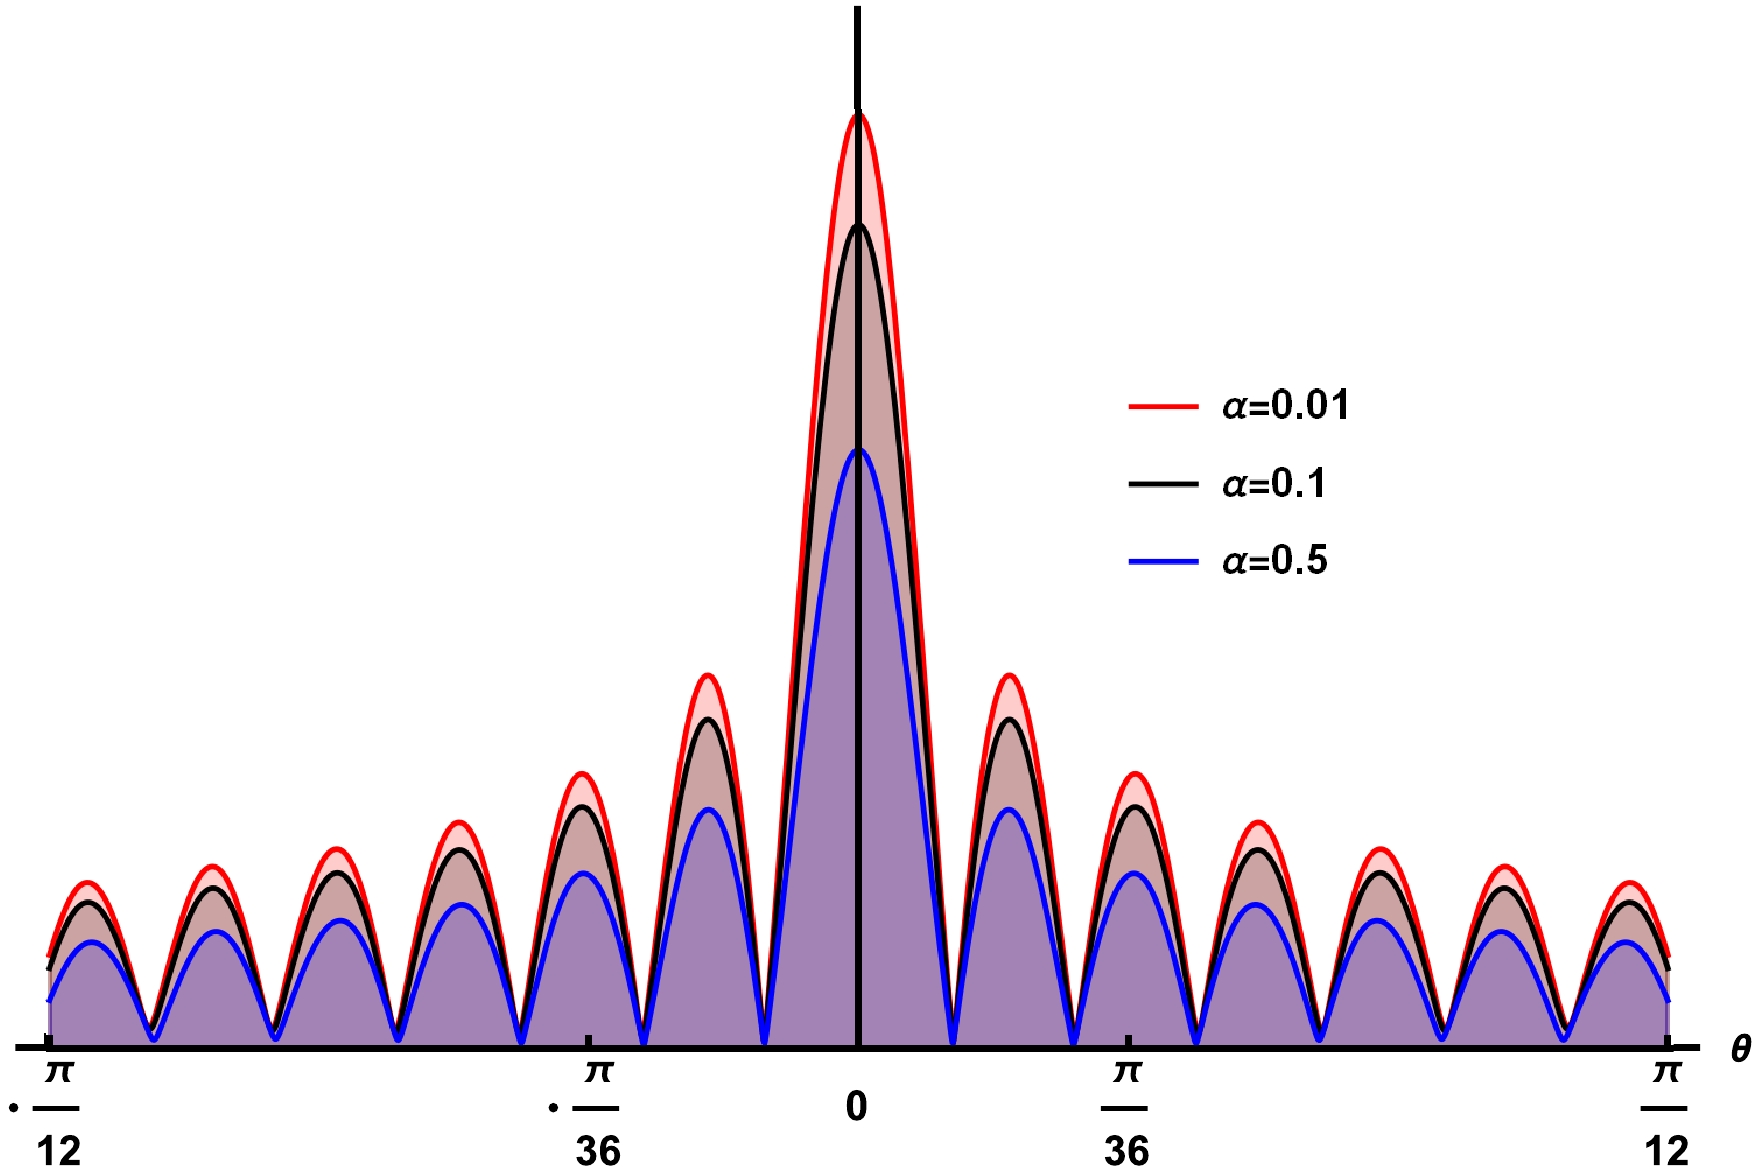
Figure 2. (color online) Amplitude of
$|\langle O\rangle|$ for different values of α, with$h_{e}=1$ and$\omega=80$ .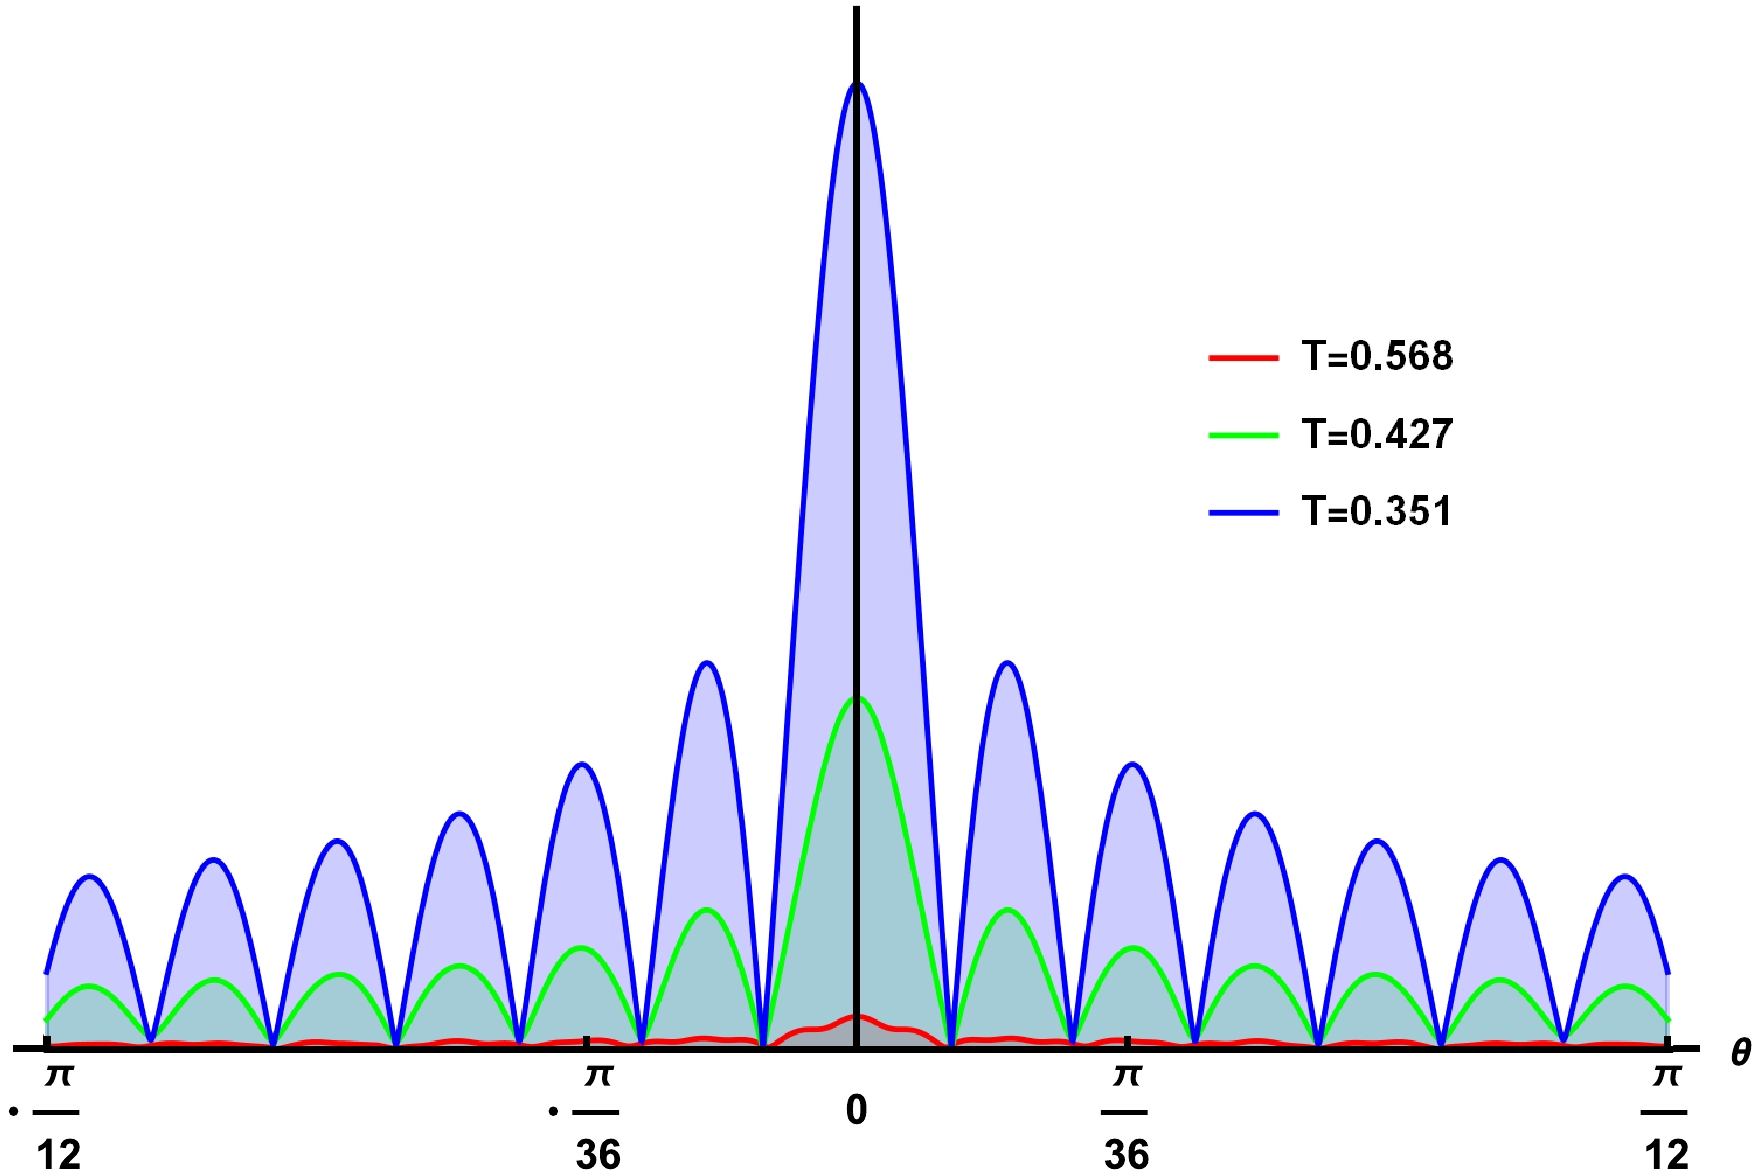
Figure 4. (color online) Amplitude of
$|\langle O\rangle|$ for different values of T, with$\alpha=0.1$ and$\omega=80$ . From top to bottom, the values of T correspond to$h_{e}=0.4,\ 0.6$ , and$0.8$ , respectively.From Fig. 2, the amplitude of the response function shows the maximum values of the propagating wave for
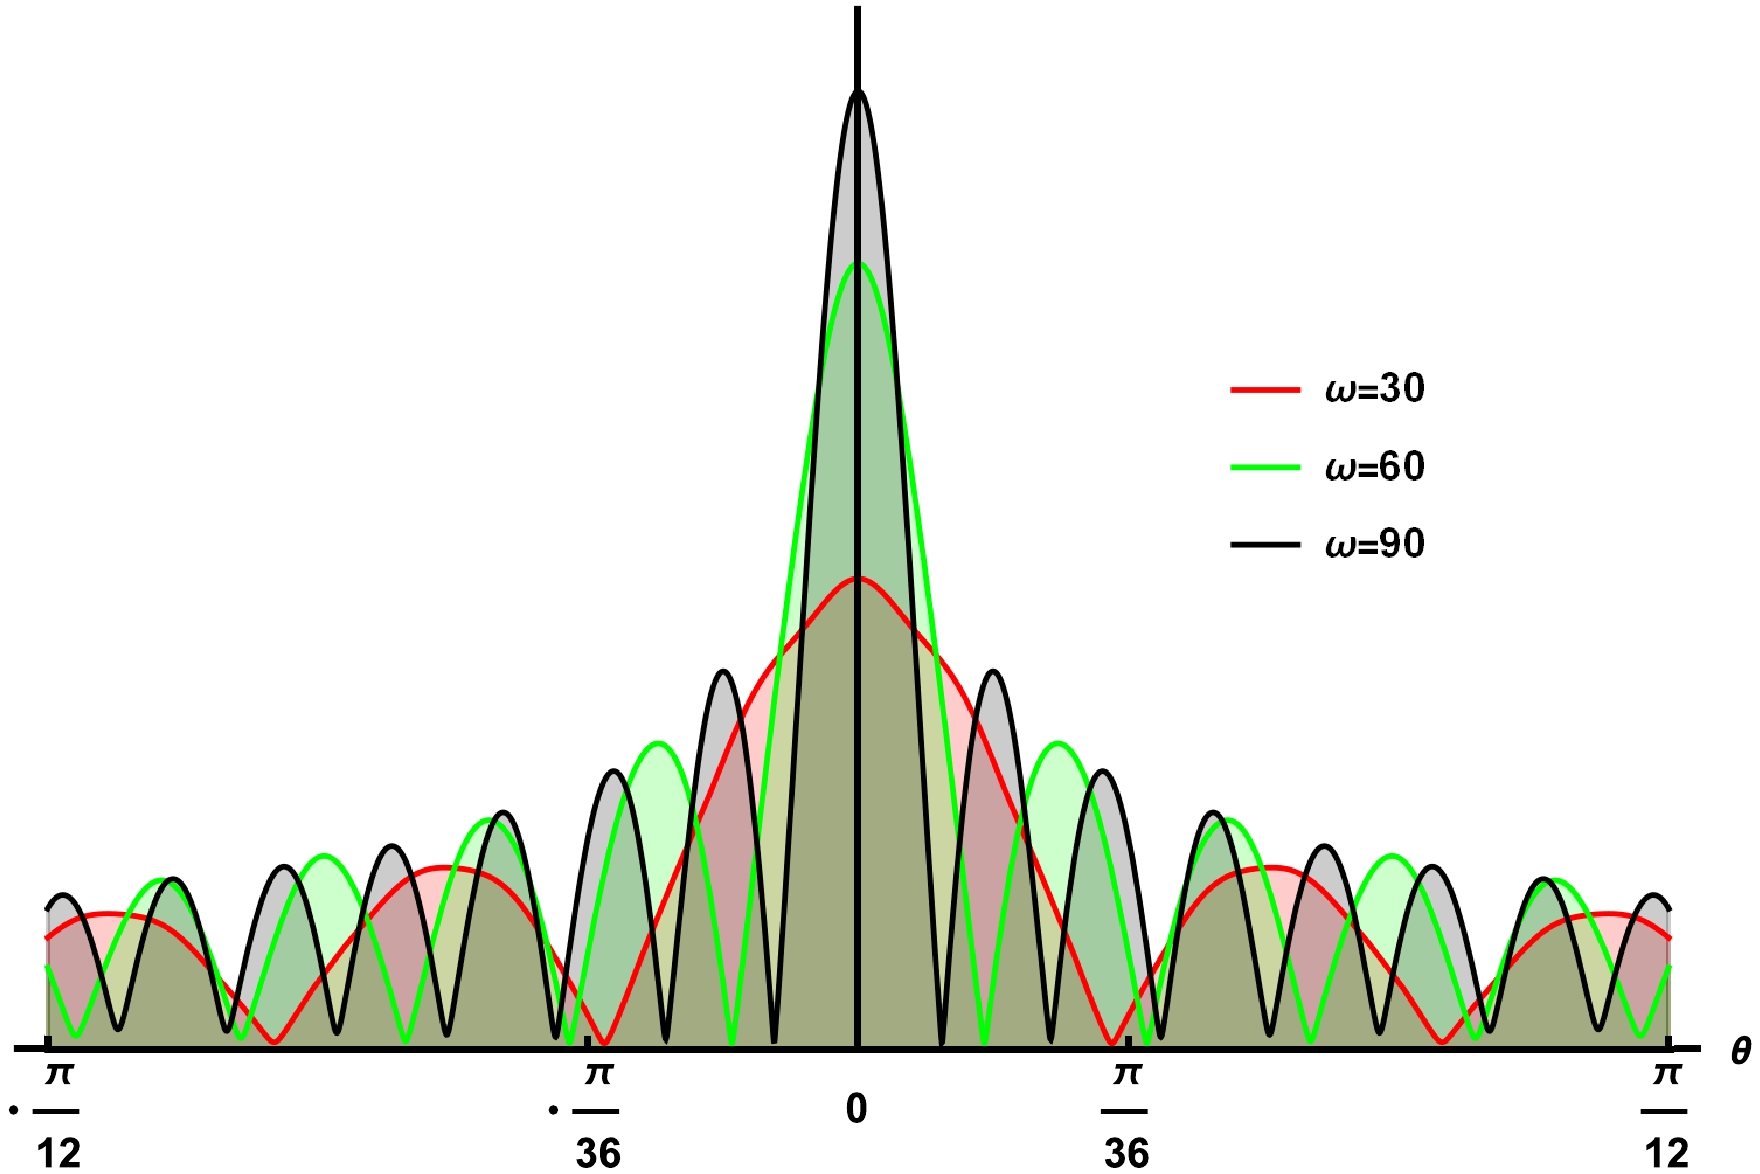
$ \alpha = 0.01 $ and then decreases as the value of α increases. Hence, the coupling parameter of the STVG theory significantly changes the behavior of the propagating waves in the bulk. We plotted Fig. 3 for different values of ω, which is interpreted as the period of the oscillations of scalar waves produced by the Gaussian source. Particularly, the period of the scalar wave is maximum when$ \omega = 30 $ , and it gradually decreases as we increase the values of ω. Further, Fig. 4 shows the amplitude of the response function for different values of the Hawking temperature T, which is associated with the event horizon for a fixed α. For instance, when$ T = 0.351 $ , corresponding to$ h_{e} = 0.8 $ , the amplitude of the total response function reaches the peak position. When$ T = 0.568 $ , which corresponds to$ h_{e} = 0.4 $ , the profile of the amplitude does not significantly oscillate and shows a narrow ramp in the middle, which is difficult to observe compared with the previous one. Hence, the different values of the event horizon significantly change the behavior of the scalar waves in the bulk field, implying that the BH temperature is a crucial factor affecting the variation of propagating waves. From the above discussion, we concluded that the optical appearance of the total response function entirely depends on the Gaussian source and the space-time geometry of the considering framework. In the next section, we further consider a special optical system that can be converted to such a response function in the observed images to better reflect the space-time geometry. -
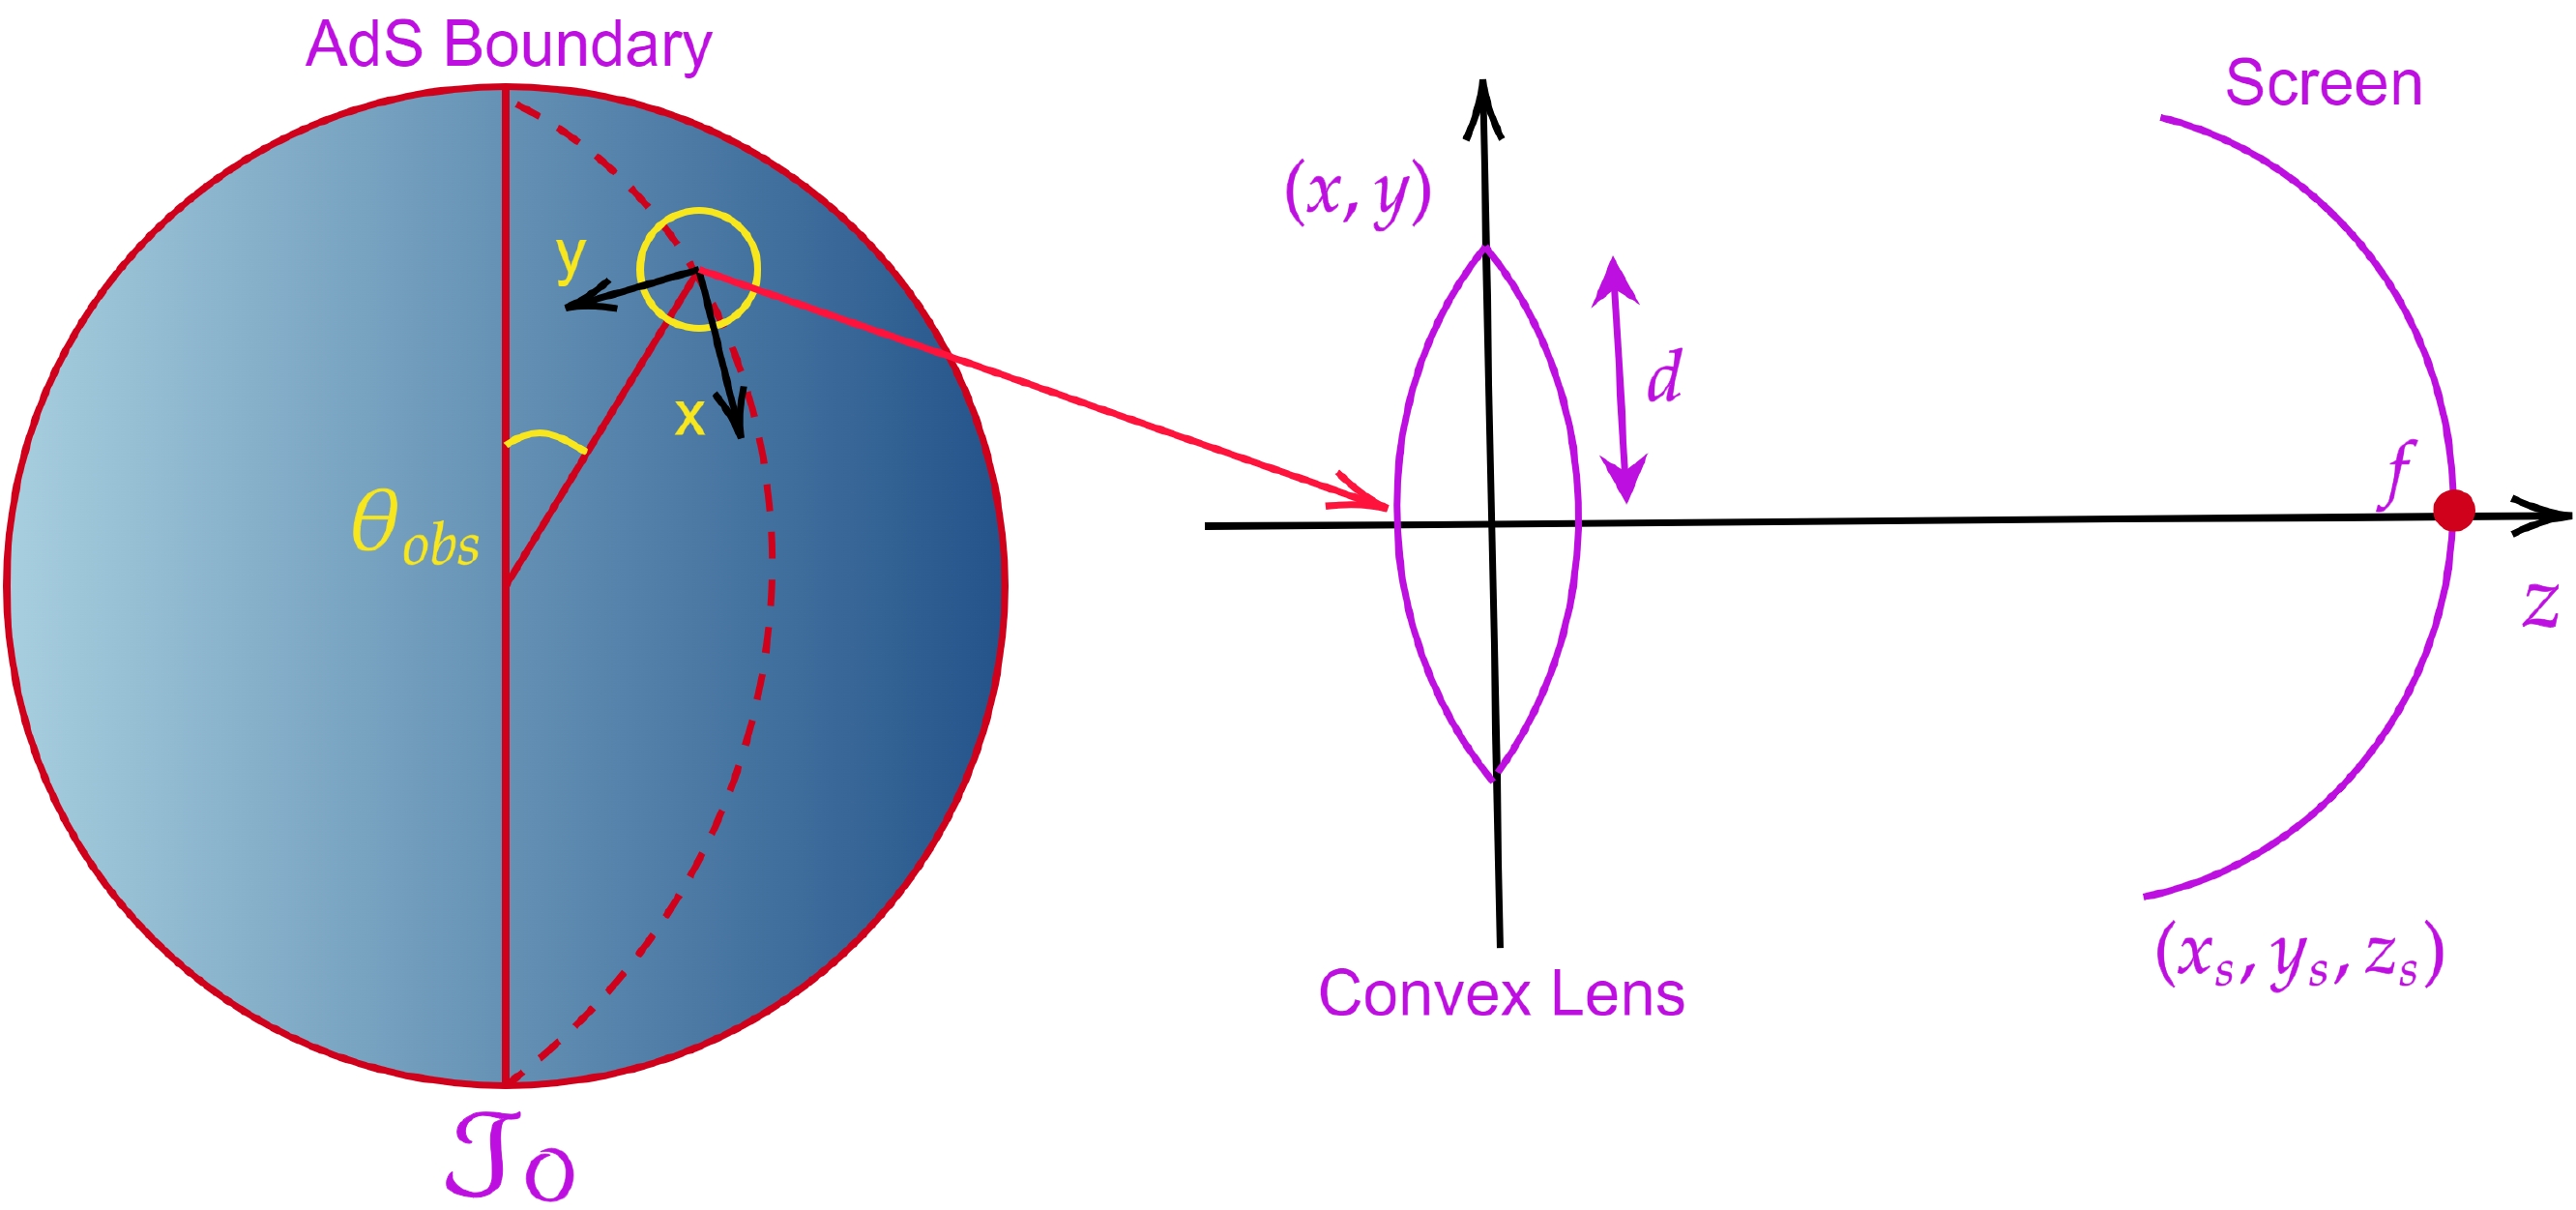
After analyzing the physical interpretation of the response function, we use it to directly interpret the BH image on the screen. We define a special optical system on the AdS boundary, where an observer looks up into the AdS bulk. The mechanism of our constructed optical system, which shows the image of the AdS BH from the response function, is depicted in Fig. 5. We consider a particular observational area at (
$ \theta,\; \varphi) = (\theta_{\rm obs},\; 0 $ ) on the AdS boundary, where the observation region is shown in a yellow circle on the left side of Fig. 5. Then, we rotate the original spherical coordinate system ($ \theta,\; \varphi $ ) to a new one ($ \theta',\; \varphi' $ ) as$ \sin\theta'\cos\varphi'+ {\rm i} \cos\theta' = {\rm e}^{{\rm i}\theta_{\rm obs}}(\sin\theta\cos\varphi+ {\rm i} \cos\theta), $

(18) (
$ \theta' = 0,\; \varphi' = 0 $ ), which corresponds to the central point of the observational region. In addition, we define cartesian coordinates ($ x,y,z $ ) with$ (x,y) = (\theta'\cos\varphi',\; \theta'\sin\varphi') $ on the AdS boundary. To construct an optical framework virtually, in the middle, we set the convex lens on the ($ x,y $ ) plane. The focal length and radius of the convex lens are denoted by f and d, respectively. Moreover, we adjust a spherical screen at$ (x,y,z) = (x_{\mathrm{s}},y_{\mathrm{s}},z_{\mathrm{s}}) $ , satisfying$x^{2}_{\mathrm{s}}+ y^{2}_{\mathrm{s}}+z^{2}_{\mathrm{s}} = f^{2}$ [37, 38]. The convex lens is considered to be a converter between the plane and spherical waves. An incident wave that comes from the left side and reaches the position of the convex lens is converted to a transmitted wave at the focus, which is observed on the screen, as shown on the right side of Fig. 5.The visual holographic image of a BH can be obtained by utilizing an optical system to observe the interference pattern generated when the scalar wave diffracts in the bulk. Thus, it is also possible to discuss the semi-classical nature of the wave scattering by BHs. We considered the method to construct images from waves in the gravitational lensing system and obtained images of gravitational lensing in wave optics [99−102]. For this purpose, image formation devices such as a convex lens and spherical screen are introduced so that we can construct the images of the BH from the response function based on the wave optics [99−102]. This optical system is designed to convert plane waves into spherical waves (see Fig. 5). Particularly, the lensed response around the observation point is mapped to the lens as the incident wave
$ \Xi(\hat{x}) $ , and the lens converts the incident wave into the transmitted wave$ \Xi_{Tr}(\hat{x}) $ and projects it onto the spherical screen, where the wave equation on the screen is recorded as$ \Xi_{\mathrm{s}}(\hat{x}_{\mathrm{s}}) $ . The focal length of an infinitely thin lens is$\pm f $ , and f is much larger than the radius of the lens, i.e.,$ f\gg d$ . Therefore, the role of the convex lens for the wave functions with frequency ω on the lens can be simply expressed as$ \Xi_{Tr}(\hat{x}) = {\rm e}^{-{\rm i}\omega\frac{|\hat{x}|^{2}}{2f}}\Xi(\hat{x}), $

(19) where
$\hat{x}=(x,y,0)$ is the coordinate position on the AdS boundary. The converted wave$\Xi_{Tr}(\hat{x})$ is projected onto the spherical screen, satisfying the condition$x^{2}_{\mathrm{s}}+y^{2}_{\mathrm{s}}+z^{2}_{\mathrm{s}}= f^{2}$ . The wave function observed on the screen is recorded as$ \Xi_{\mathrm{s}}(\hat{x}_{\mathrm{s}}) = \int_{|\hat{x}|\leq d} {\rm d}^{2}x\Xi_{Tr}(\hat{x}) {\rm e}^{{\rm i}\omega\mathbb{D}}, $

(20) in which
$\mathbb{D}$ is the distance from the convex lens ($x,y,0$ ) to the spherical screen$(x_\mathrm{s},y_\mathrm{s},z_\mathrm{s})$ , which is defined as$ \begin{aligned}[b] \mathbb{D} =\;& \sqrt{(x_\mathrm{s}-x)^2+(y_\mathrm{s}-y)^2+z_\mathrm{s}^2}\\ =\;& \sqrt{f^2-2\hat{x}_\mathrm{s}\cdot\hat{x}+|\hat{x}|^2} \simeq f-\frac{\hat{x}_\mathrm{s}\cdot\hat{x}}{f}+\frac{|\hat{x}|^2}{2f}\ , \end{aligned} $

(21) where
$\hat{x}_\mathrm{s}=(x_\mathrm{s},y_\mathrm{s})$ . Now considering the Fresnel approximation, such as$f\gg |\hat{x}|$ , we obtain$ \Xi_{\mathrm{s}}(\hat{x}_{\mathrm{s}})\propto\int_{|\hat{x}|\leq d} {\rm d}^{2}x\Xi(\hat{x})\Pi(\hat{x}){\rm e}^{-{\rm i}\frac{\omega}{f}\hat{x}.\hat{x}_{\mathrm{s}}}, $

(22) where
$\Pi(\hat{x})$ is the window function, which is defined as$ \Pi (\hat x) = \left\{ {\begin{array}{*{20}{l}} {1,\quad 0 < |\hat x| \le d,}\\ {0,\quad \;|\hat x| > d.} \end{array}} \right. $

(23) From Eq. (22), we can observe the image on the screen, which is obtained through the Fourier transformation of the incident wave [99−102]. We depicted different profiles of the dual BH on the screen when the observer is located at different positions of the AdS boundary. For instance, we plotted the holographic Einstein images for various values of parameter α and observational angles for fixed values of
$h_{e}=1$ and$\omega=80$ , as shown in Fig. 6. When$\alpha=0.01$ and$\theta=0^\circ$ , meaning that the observer is located at the north pole of the AdS boundary, the observer will see a clear ring with a series of concentric striped patterns, as shown in the left column of Fig. 6 (top row). These patterns are caused by a diffraction effect with imaging and are related to the lens radius d and the frequency ω. As we increase the values of α from top to bottom, we observe that the rings lie further away from the center in all cases; however, the luminosity of the ring and shadow radius changes according to the values of α, as shown in Fig. 7. When$\alpha=0.1$ (see the left panel of Fig. 7), one can see that the brightness curves reached the peak position at the two endpoints, –0.97 and 0.97, on the abscissa. Here, we observe the strongest brightness at these points. This effect changes when$\alpha=0.5$ , where the brightness curves change the positions at the points –0.98 and 0.98, indicating that α has a minor influence on the shadow radius, and the brightness of the ring sharply decreases (see the second panel from the left side of Fig. 7). Further, in the third panel of Fig. 7, when$\alpha=0.9$ , no change is observed in the shadow radius; however, the brightness of the ring gradually decreases. Further, when α increases up to$\alpha=1.3$ , we see that the position of the brightness curves changes at the points,$-0.99$ and$0.99$ , on the abscissa (see the right panel of Fig. 7).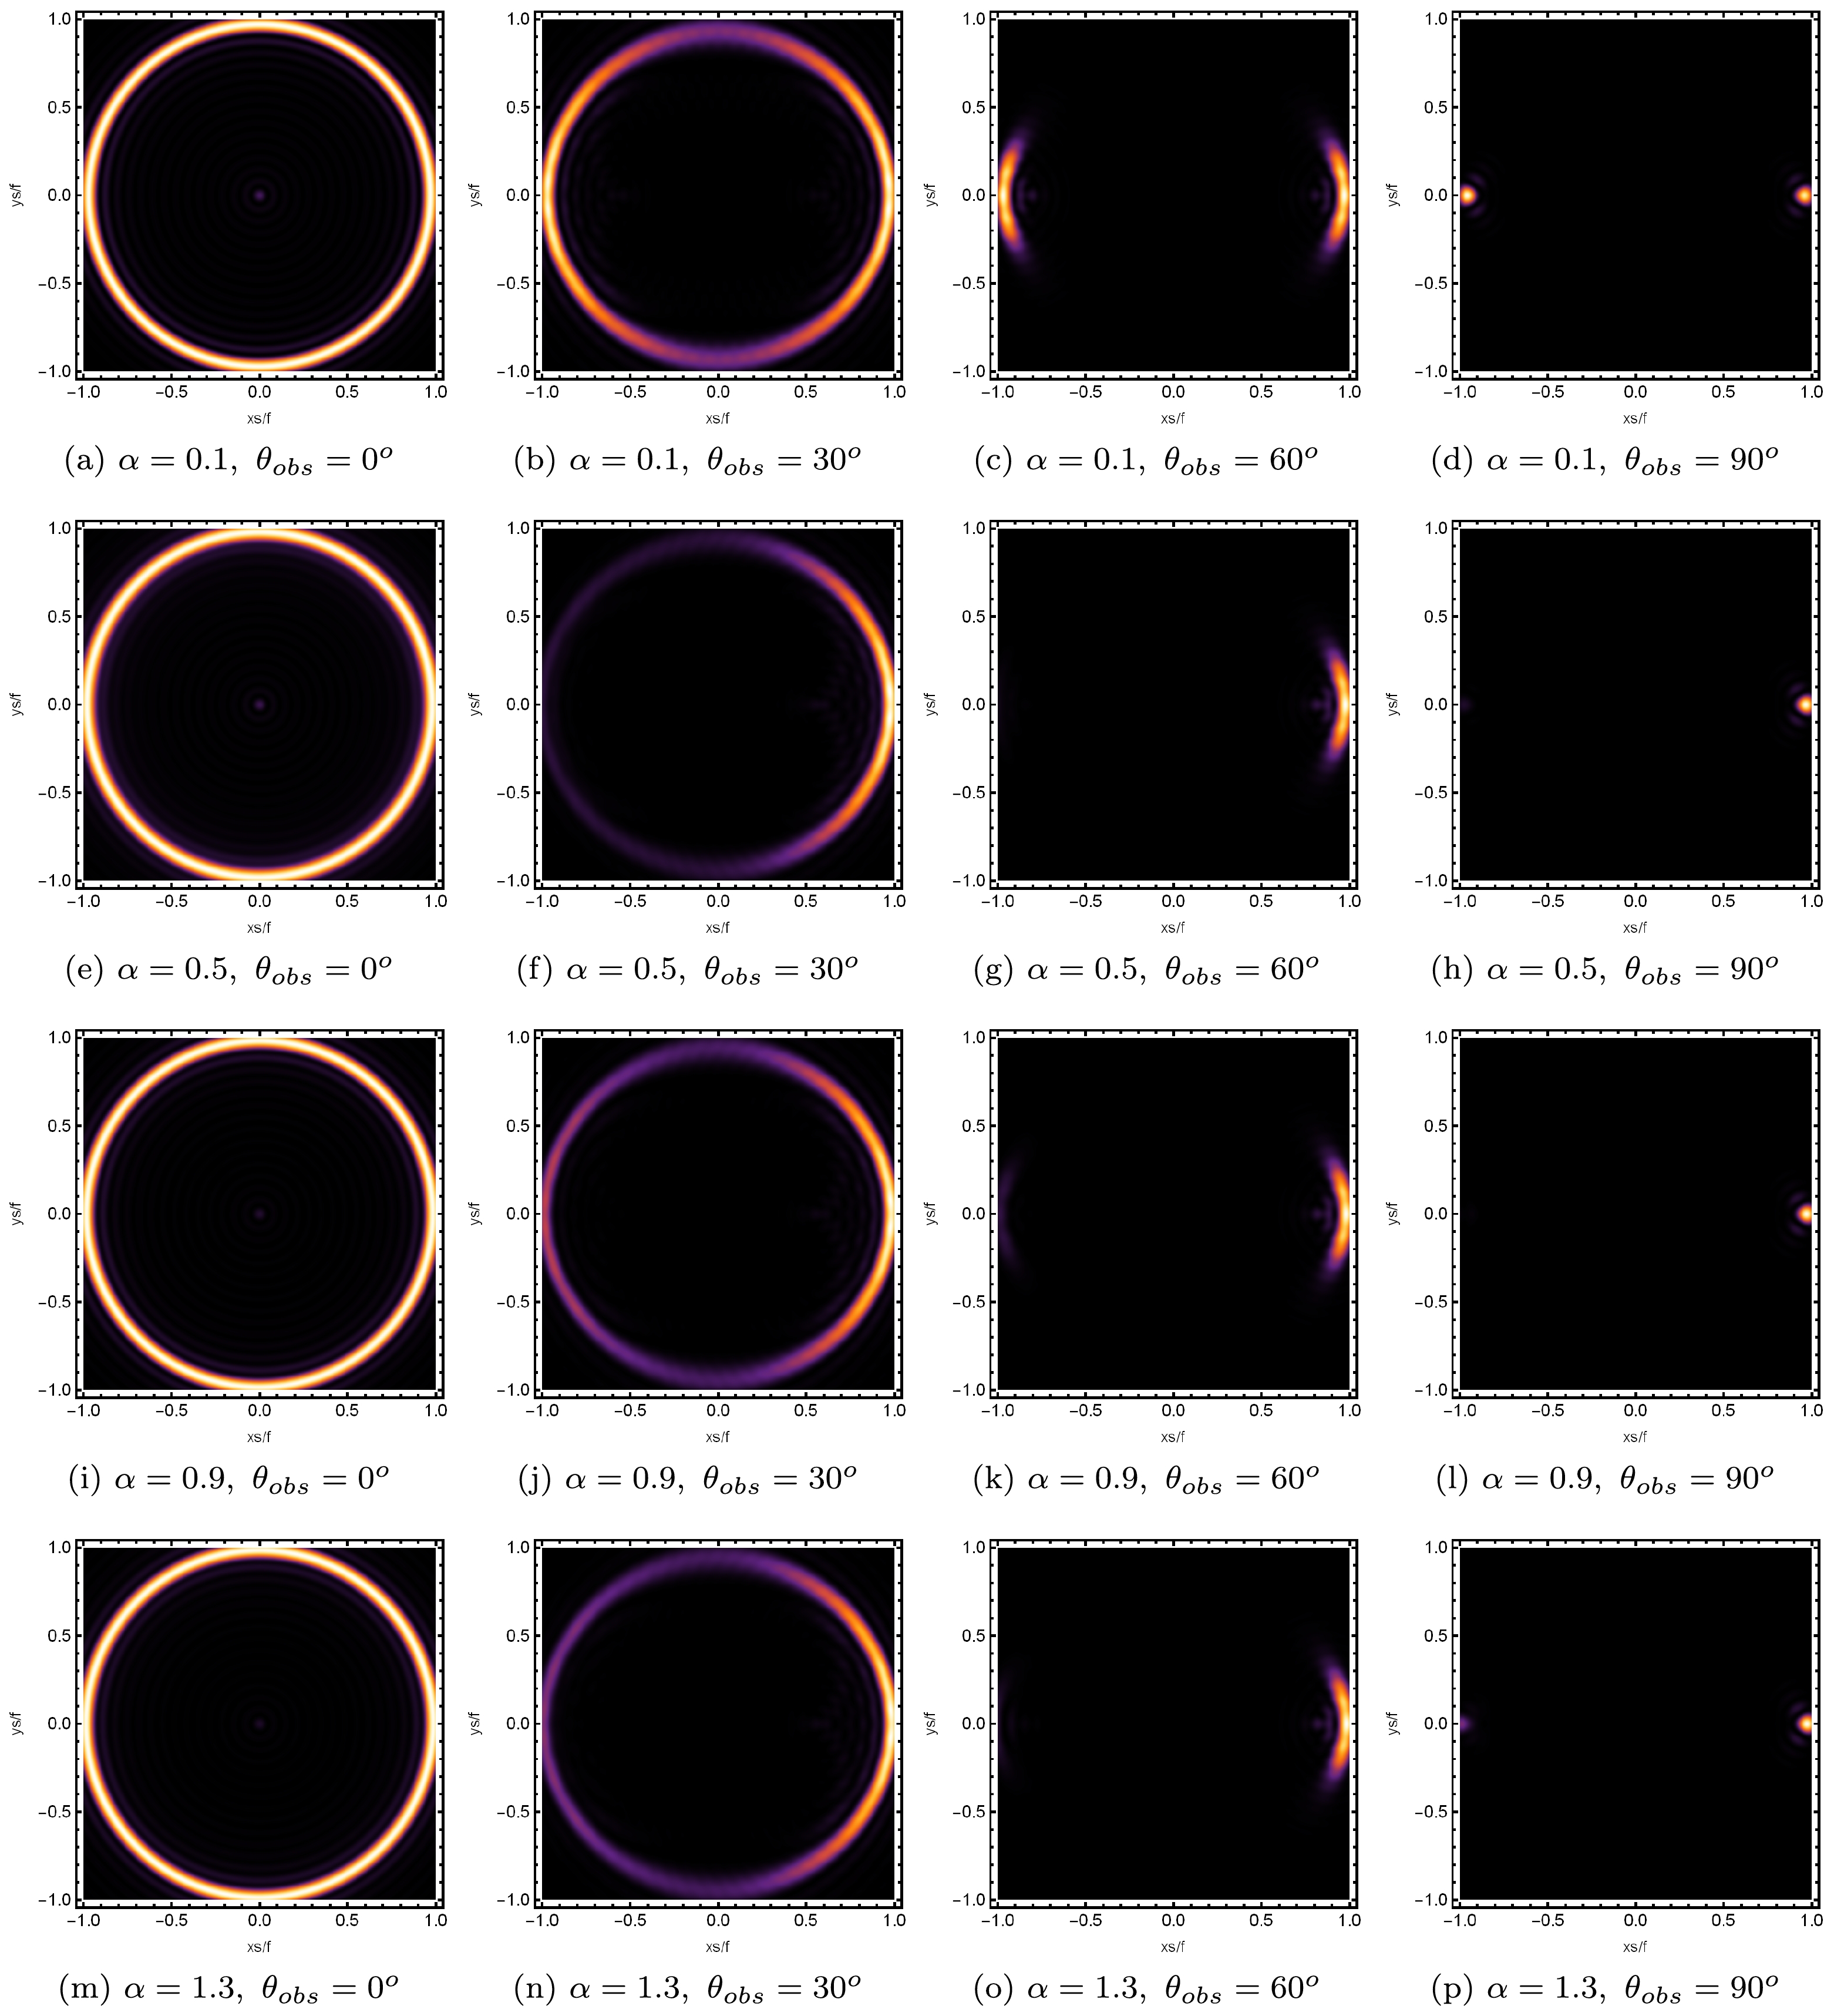
Figure 6. (color online) Observational appearance of the lensed response on the screen at various observation angles for different values of α, with
$h_{e}=1.2$ and$\omega=80$ .
Figure 7. (color online) Brightness of the lensed response on the screen for various α, with
$h_{e}=1.2$ and$\omega=80$ .In this case, we note that the radius of the shadow is slightly increased, and the corresponding brightness of the ring yields smaller values. Hence, according to the above discussion, we found that increasing α led to a change in the radius of the shadow and the luminosity of the ring, implying that the parameter α is sufficiently sensitive to analyze the luminosities and the radius of the shadow of the dual BH image. Next, we set
$\theta_{\rm obs}=$ 30°; as the values of the parameter α increased, the bright ring transformed into a luminosity deformed ring, and then, the shape of the strict axis-symmetric ring disappears (see the second column from the left side of Fig. 6). Notably, when α has smaller values, the right side of the ring is brighter while the left side of the ring is darker. In particular, when$\alpha=0.5$ , the left side of the ring also exhibited a little brightness but less than that of the right side of the ring. From top to bottom, we see that the overall brightness of the ring decreases, as the values of the parameter α increase. The concentration moves further toward the position of the angle at$\theta_{\rm obs}=$ 60° (see the third column from the left side of Fig. 6).In this case, when α has smaller values, we see that a bright light arcs on the right side of the screen, and when
$\alpha=0.5$ , a dimmer light ring also appears on the left side of the screen. From top to bottom, as the values of α increase, we see that only dimmer light arcs appear on the left side of the screen. When we set the observation angle at$\theta_{\rm obs}=$ 90°, a pair of bright light spots appeared in the middle of the left and right sides of the screen, as shown in the right column of Fig. 6 (top row). When$\alpha=0.5$ , only one bright light spot appears on the left side of the screen. As the parameter α increases, the bright light spot does not change the luminosity and lies far away from the center in all cases. These results are also consistent with [41, 42].Subsequently, we analyze the effect of wave source on the characteristics of the holographic Einstein image observed at the position of the north pole, with
$\alpha=0.1$ and$h_{e}=1.2$ , as shown in Fig. 8. The corresponding profiles, which show the brightness of the lensed response on the screen for the same parameters, are shown in Fig. 9. To observe the influence of the wave source, we set$\rho=0.02$ and$d=0.6$ for the convex lens. As the value of the frequency increases, the resulting ring becomes sharper. From this perspective, we concluded that the Einstein image captured through the geometric optics approximation has a good optical appearance in the high frequency limit. This effect can also be seen in Fig. 9, where the peak curve of brightness becomes steeper as the value of ω increases.
Figure 8. (color online) Profiles of the lensed response for various ω values at the observational angle
$\theta=0^\circ$ , with$\alpha=0.1$ and$h_{e}=1.2$ .
Figure 9. (color online) Brightness of the lensed response for various ω values, with
$\alpha=0.1$ and$h_{e}=1.2$ .We further investigate the influence of the horizon temperature T on the images of the lensed response of the above holographic Einstein image, which is observed for the fixed values of
$\alpha=0.1$ and$\omega=80$ , as shown in Figs. 11 and 12 corresponding to small values of the horizon$h_{e}$ , respectively. For a better understanding of the physical meaning of the horizon temperature, we plot the relation of temperature T and the inverse of the horizon$h_{e}$ , as shown in Fig. 10 with$\alpha=0.1$ . The influences of temperature on the shadow are found to be different at small and large event horizons. At the beginning, the horizon temperature T has a smaller value, and it has the lowest value at point ($T=0.2706$ ,$h_{e}=1.6$ ). After that, it sharply increases as the value of the horizon$h_{e}$ increases. This feature may be used to distinguish the STVG BH solution from other BH solutions [39, 40, 42]. When the horizon$h_{e}=1.6$ , we have$T=0.2706$ , and similarly, we have$T=$ 0.2725, 0.3103, and 0.3831 corresponding to$h_{e}=$ 1.5, 1, and 0.7, respectively. One can see that the horizon temperature increases with the decreasing value of the horizon$h_{e}$ . In all cases, one can see that a series of axis-symmetric concentric strict rings have appeared on the screen, as shown in Fig. 11. Here, we observed that the luminosity of the rings does not change and lies far away from the center in all cases. This phenomenon can also be seen in Fig. 12, where the brightness peak of the lensed response is far away from the center as the temperature T increases for the same values of the parameters, as indicated in Fig. 11. Figure 12 (see the left panel) corresponds to$T=0.2706$ , illustrating that the brightness curves attain the peak position at points$-0.96$ and$0.96$ on the abscissa; here, the brightness of the ring is at its maximum.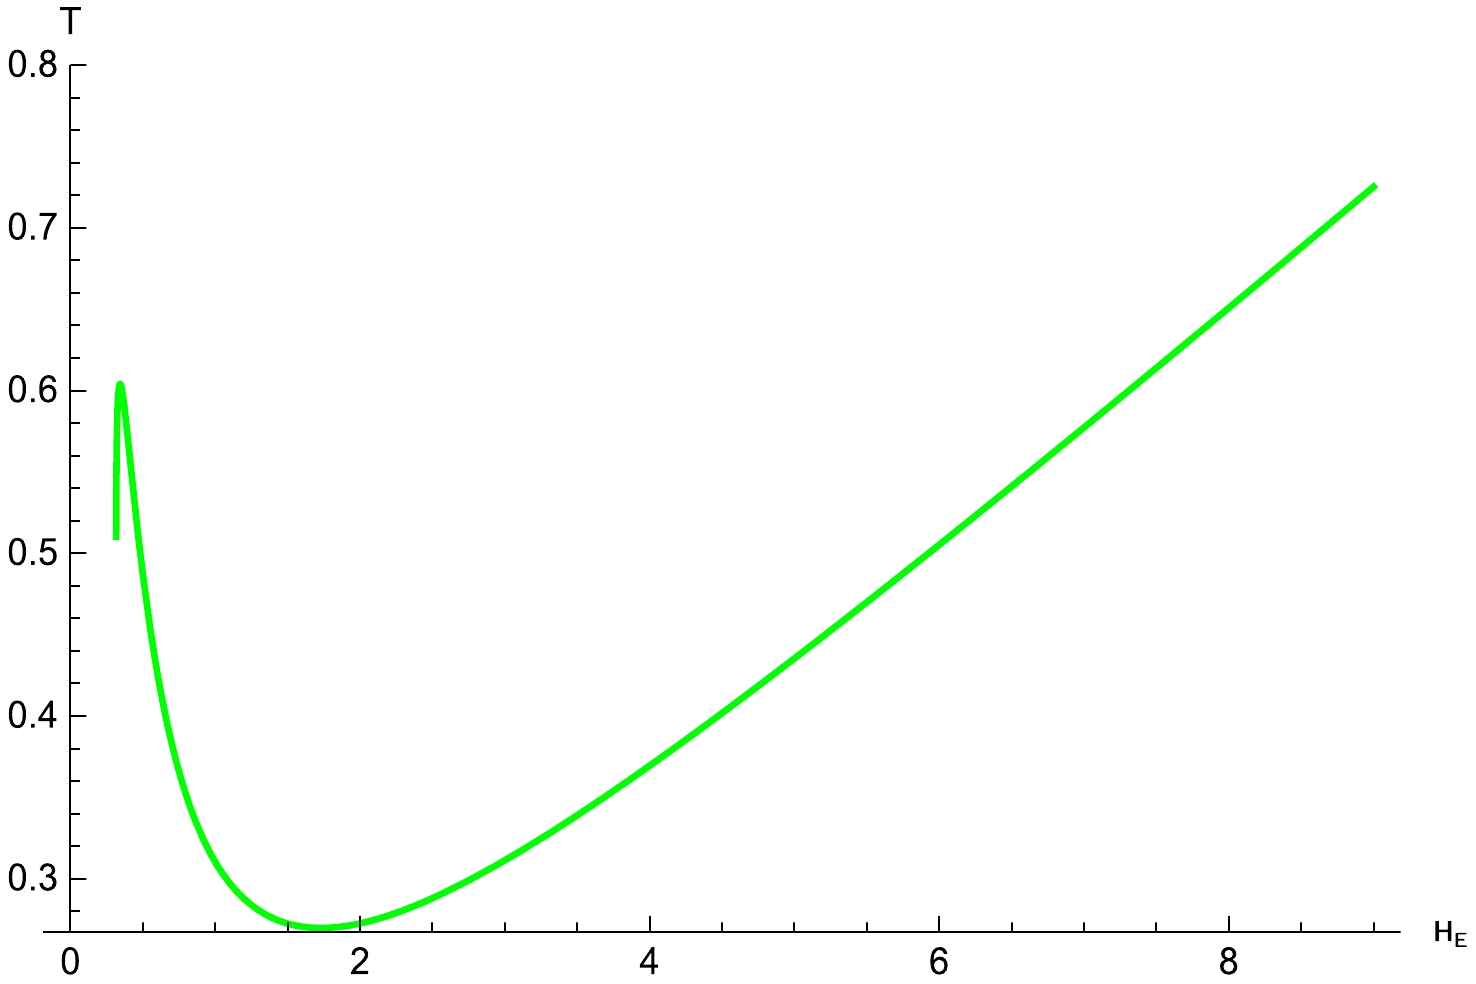
Figure 10. (color online) Relation between temperature T and the inverse of event horizon
$h_e$ , with$\alpha=0.1$ .
Figure 11. (color online) Profiles of the lensed response on the screen at the fixed value of the observational angle
$\theta=0^\circ$ for small$h_e$ , with$\alpha=0.1$ and$\omega=80$ .
Figure 12. (color online) Brightness of the lensed response on the screen for small
$h_e$ , with$\alpha=0.1$ and$\omega=80$ .When the temperature increases to
$T=0.2725$ (see the second panel from the left side of Fig. 12), the radius of the shadow shows a slight increase; however, the brightness of the ring decreases significantly. Similarly, as the temperature increases to$T=0.3103$ (see the third panel from the left side of Fig. 12), we observe a further increase in the radius of the shadow; however, the brightness of the ring continues to decrease. When the temperature further increases and reaches$T=0.3831$ (see the right panel of Fig. 12), the radius of the shadow becomes larger, and the brightness of the ring continues to decrease. This means that increasing the horizon temperature leads to a slight increase in the radius of the shadow and a decrease in the brightness of the ring. From these results, we can summarize that the smaller values of horizon$h_{e}$ are also sensitive to analyzing the optical appearance and the corresponding radius of the shadow of the Einstein ring. Further, we also observe a relatively smaller brightness curve in the middle of the peak curves, corresponding to a very dim light spot in the center of the screen, which is difficult to see in Fig. 11.We further study the effect of the large values of the horizon
$h_{e}$ on the image of the dual BH, as shown in Fig. 13. When the horizon$h_{e}=3$ and$T=0.3113$ (see the left panel of Fig. 13), we observed that a series of axis-symmetric concentric rings appeared on the screen, and one of them is a particularly bright ring that lies far away from the center. When the horizon grows to$h_{e}=5$ corresponding to$T=0.4354$ (see the second panel from the left side), we see smaller axis-symmetric concentric rings appearing in the image and the bright ring moving closer to the center. When we further increase the value of the horizon to$h_{e}=7$ , which corresponds to$T=0.5773$ (see the third panel from the left side), we observe that the bright ring comes closer to the center, and ultimately, the size of the ring becomes smaller. When the horizon$h_{e}=9$ at$T=0.7252$ (see the right panel), the brightest ring gradually moves inward. We also plot the brightness curves of the lensed response in Fig. 14 corresponding to the sub figures of Fig. 13 under the same parameter values. Particularly, when$T=0.3113$ , we see that the peaks of the brightness curves lie far away from the center, and when the temperature gradually increases to$T=0.4354$ , the peaks of the brightness curves become closer to the center. When the temperature rises to$T=0.5773$ , the peak of the brightness curves moves further towards the center, and when the temperature rises to$T=0.7252$ , the brightness curves gradually move towards the center. Notably, in Fig. 14, a relatively smaller curve of brightness is also observed between the peaks of the brightness curves, corresponding to the dim light spot in the center of the screen, as shown in Fig. 13. These figures show that, when the value of the temperature is smaller, the position of the brightest ring lies far away from the center, and at higher values, it gradually moves inward.
Figure 13. (color online) Profiles of the lensed response on the screen at the fixed value of the observational angle
$\theta=0^\circ$ for large$h_e$ , with$\alpha=0.1$ and$\omega=80$ .
Figure 14. (color online) Brightness of the lensed response on the screen for large
$h_e$ , with$\alpha=0.1$ and$\omega=80$ .To analyze the light deflection of AdS Schwarzschild STVG BH, we need to find how the light rays move in this space-time. Particularly, we investigate the optical geometry of the brightest ring in the image, which is located at the position of the photon sphere. In spherically symmetric space-time, an orbit of geodesics lies in a plane passing through the center of the BH. Therefore, without loss of generality, we can always rotate the orbital plane of the null geodesic to coincide with the equatorial plane. Hence, the Lagrangian of this system is defined as [33, 42]
$ {\cal{L}} = \frac{1}{2}g_{\kappa\lambda}\dot{x}^{\kappa}\dot{x}^{\lambda} = \frac{1}{2}\big(-f(r)\dot{t}^{2}+\frac{\dot{r}^{2}}{f(r)}+r^{2}(\dot{\theta}^{2}+\sin^{2}\theta \dot{\phi}^{2})\big), $

(24) where
$\dot{x}^{\kappa}$ is the four velocity of the light ray, and ''.'' is the derivative with respect to the affine parameter s. As we consider an equatorial plane, we impose the initial conditions as$\theta=\pi/2$ and$\dot{\theta}=0$ . Since the metric coefficients do not depend explicitly on time t and the azimuthal angle ϕ, we have two conserved quantities, which are energy E and angular momentum L of the photon, defined as$ E = f(r)\dot{t}, \quad L = r^{2}\dot{\phi}. $

(25) Based on the null geodesics, we have
$g_{\kappa\lambda}\dot{x}^{\kappa}\dot{x}^{\lambda}=0$ , and using Eq. (25), we can write$ \dot{r}^{2} = E^{2}-V(r)L^{2}, $

(26) where
$V(r)=f(r)/r^{2}$ is an effective potential. We further define the impact parameter$b=L/E$ , which is the vertical distance between the geodesic line and the parallel line passing through the origin. In this space-time, one circular, null geodesic exists on the equatorial plane. This is essentially the photon sphere, projected on the equatorial plane, yielding a ring-like circular shape known as a photon circular orbit. Here, the effective potential$V(r)$ is used to represent the radial geodesic, which is defined as follows:$ \dot{r}^{2}+V(r) = \frac{1}{b^{2}}. $

(27) At the photon sphere, i.e., (
$r=r_{ph}$ ), the motions of the photons satisfy the conditions$\dot{r}=0$ and$\ddot{r}=0$ , which also means that$ V(r_{ph}) = \frac{1}{b^{2}_{ph}}, \quad V'(r_{ph}) = 0, $

(28) corresponding to the maximum position of the effective potential
$V(r)$ . We plot the profile of the effective potential$V(r)$ in Fig. 15 for a fixed value of α as an example.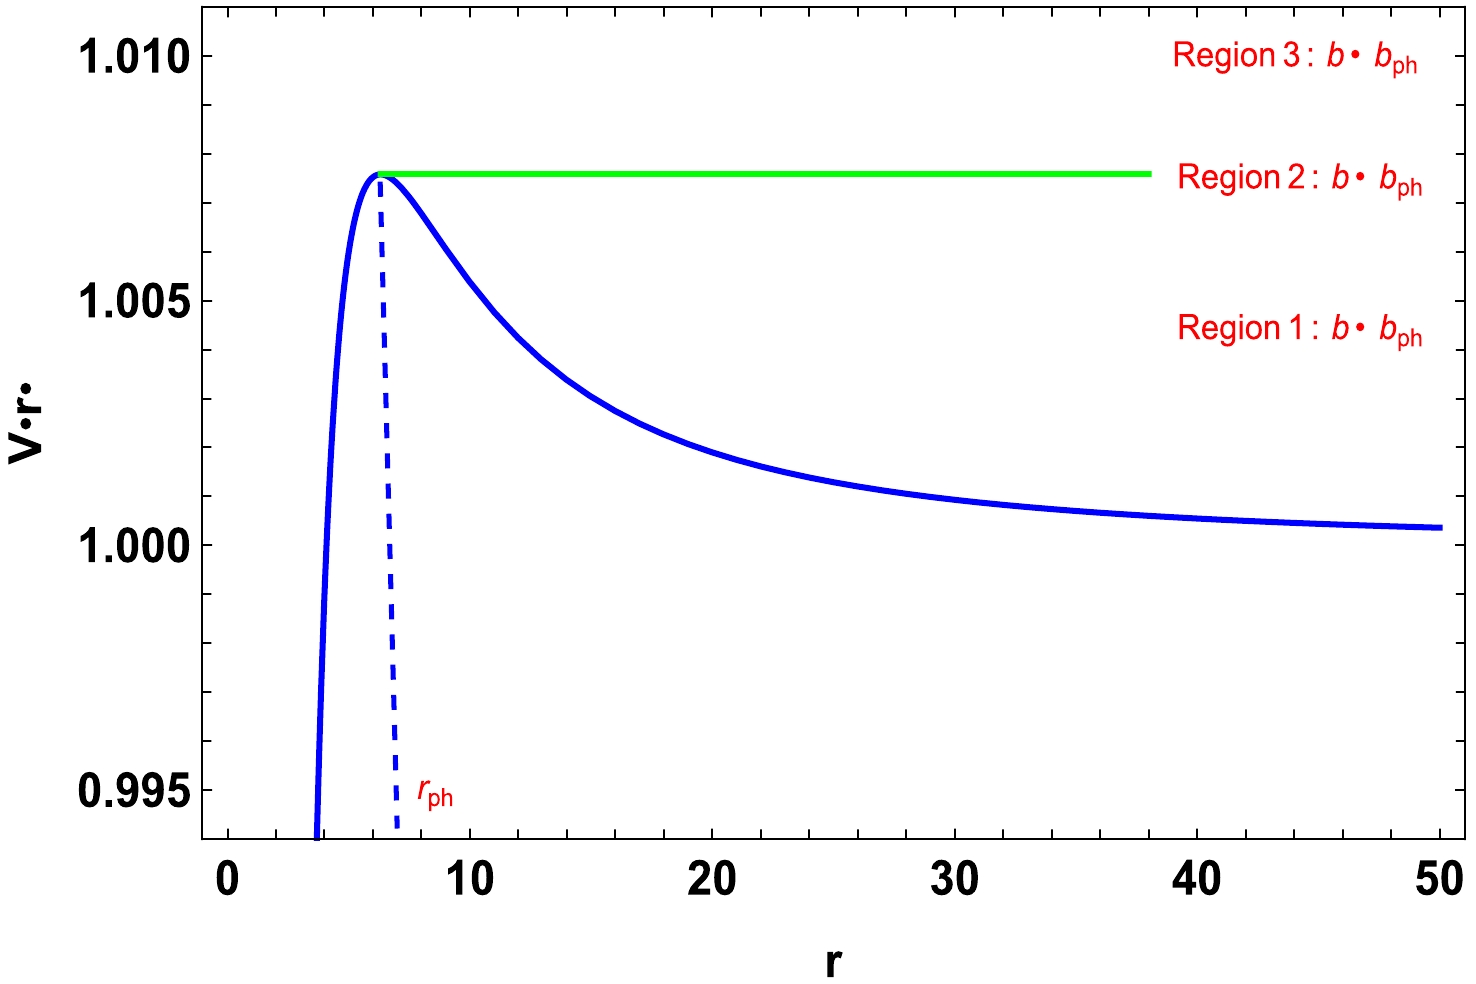
Figure 15. (color online) The profile of the effective potential
$V(r)$ for$\alpha=1.5$ , with$M=1$ . The dashed line indicates the radii of the photon sphere$r_{ph}$ . The regions$1$ ,$2$ , and$3$ correspond to$V(r)<1/b^{2}_{ph}$ ,$V(r)=1/b^{2}_{ph}$ (green line), and$V(r)>1/b^{2}_{ph}$ , respectively.We see that the effective potential vanishes on the event horizon. Then, it increases and reaches the peak position at the photon sphere
$r_{ph}$ and subsequently moves down with respect to the radius r. When a photon moves in the radially inward direction, it generally exhibits different behaviors of motion, which we classify into three different regions. In region$1$ , if the photon begins its motion at$r>r_{ph}$ , the photon will encounter the potential barrier and be reflected in the outward direction. Further, when$b<b_{ph}$ (correspond to region 3), the photon does not face any obstacles and hence continues moving in the inward direction and finally falls into the BH singularity. Particularly, in region 2, namely$b=b_{ph}$ , the photons begin their motion at the position of the photon sphere, rotating around the BH in a state of constant rotation. Hence, the closer the value of the impact parameter to$b_{ph}$ , the larger the number of cycles for which the photons revolve around the BH.Further, we can naturally define the ingoing angle
$\theta_{in}$ of the photon with the normal vector of boundary$n^{\tau}\equiv\partial/\partial r^{\tau}$ , given as follows [38]:$ \cos\theta_{in} = \frac{g_{\zeta\xi}v^{\zeta}n^{\xi}}{|v| |n|}\bigg|_{r = \infty} = \sqrt{\frac{\dot{r}^{2}/f(r)}{\dot{r}^{2}/f(r)+L^{2}/r^{2}}}\bigg|_{r = \infty}, $

(29) or equivalently,
$ \sin\theta^{2}_{in} = 1-\cos\theta^{2}_{in} = \frac{L^{2}V(r)}{\dot{r}^{2}+L^{2}V(r)} \bigg|_{r = \infty} = \frac{L^{2}}{E^{2}}. $

(30) Hence, the ingoing angle of photon orbit from the boundary satisfies the following:
$ \sin\theta_{in} = \frac{L}{E}, $

(31) which is shown in Fig. 16. Here, the light ray approaches the photon sphere and revolves around the BH many times, since the angular velocity is non-zero. We further focused on the main contribution to the final response function, which originates from the special angular momentum as
$L_{p}$ , beginning from the south pole, moving around the BH once, and reaching the north pole, which can be determined by the following conditions as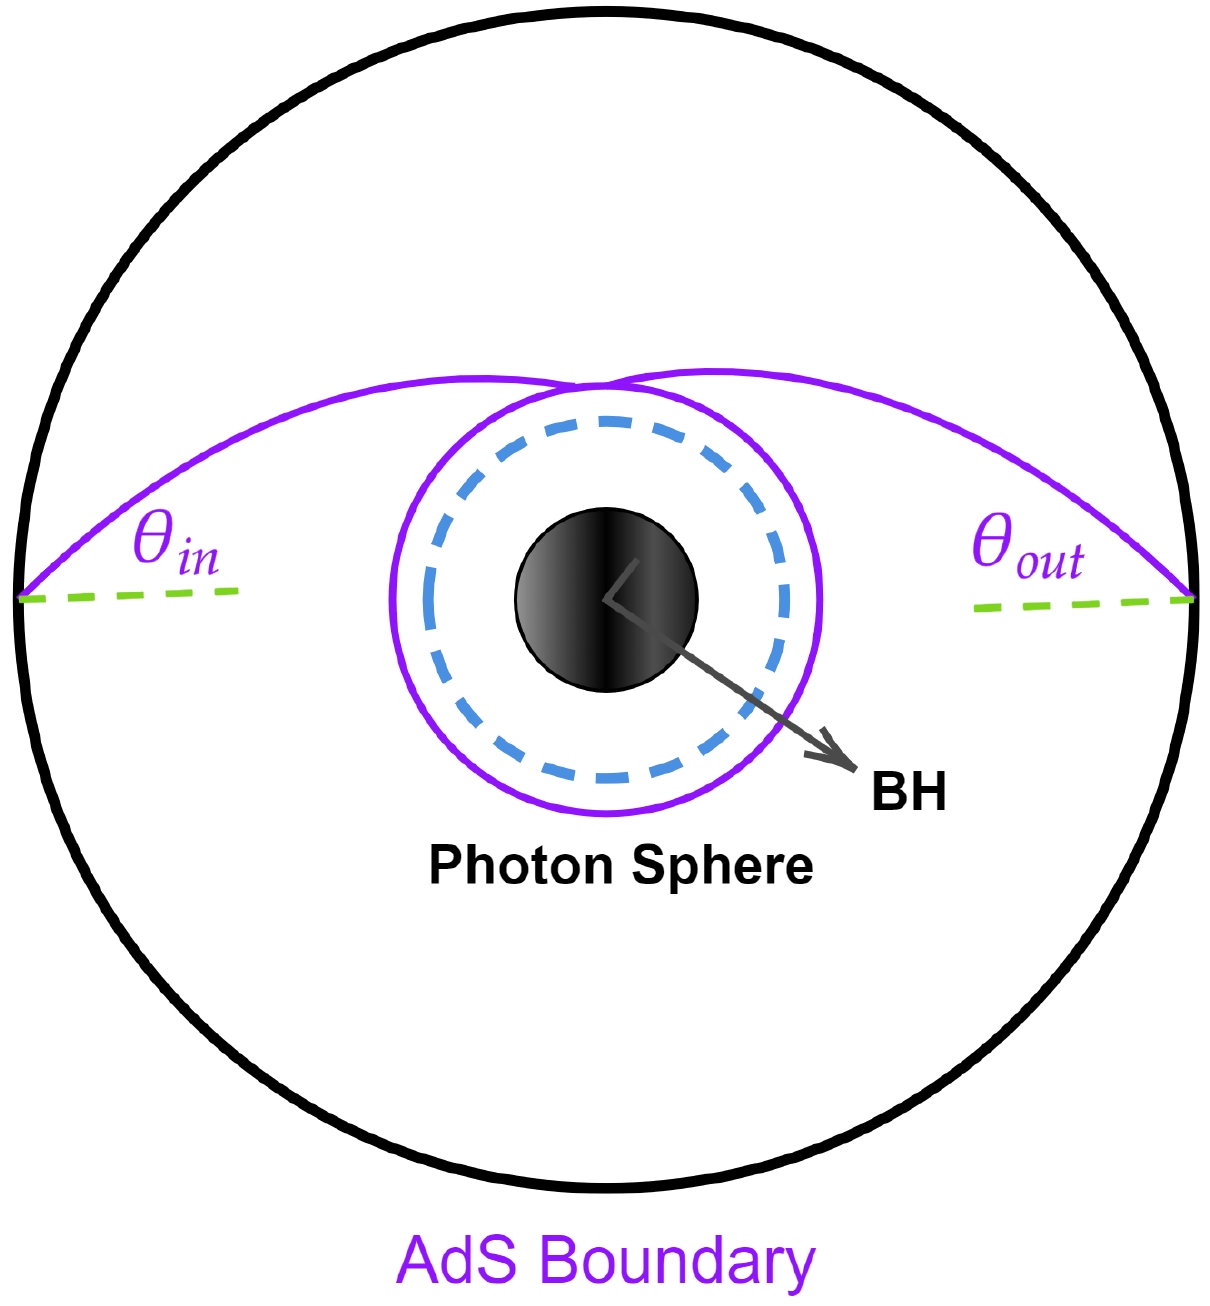
Figure 16. (color online) Schematic diagram of the dominant contribution to the final response function moving from the incident photon and rotating once around the BH.
$ \dot{r} = 0,\quad \frac{{\rm d}V}{{\rm d}r} = 0. $

(32) When an observer on the AdS boundary looks up into the AdS bulk, the resulting angle
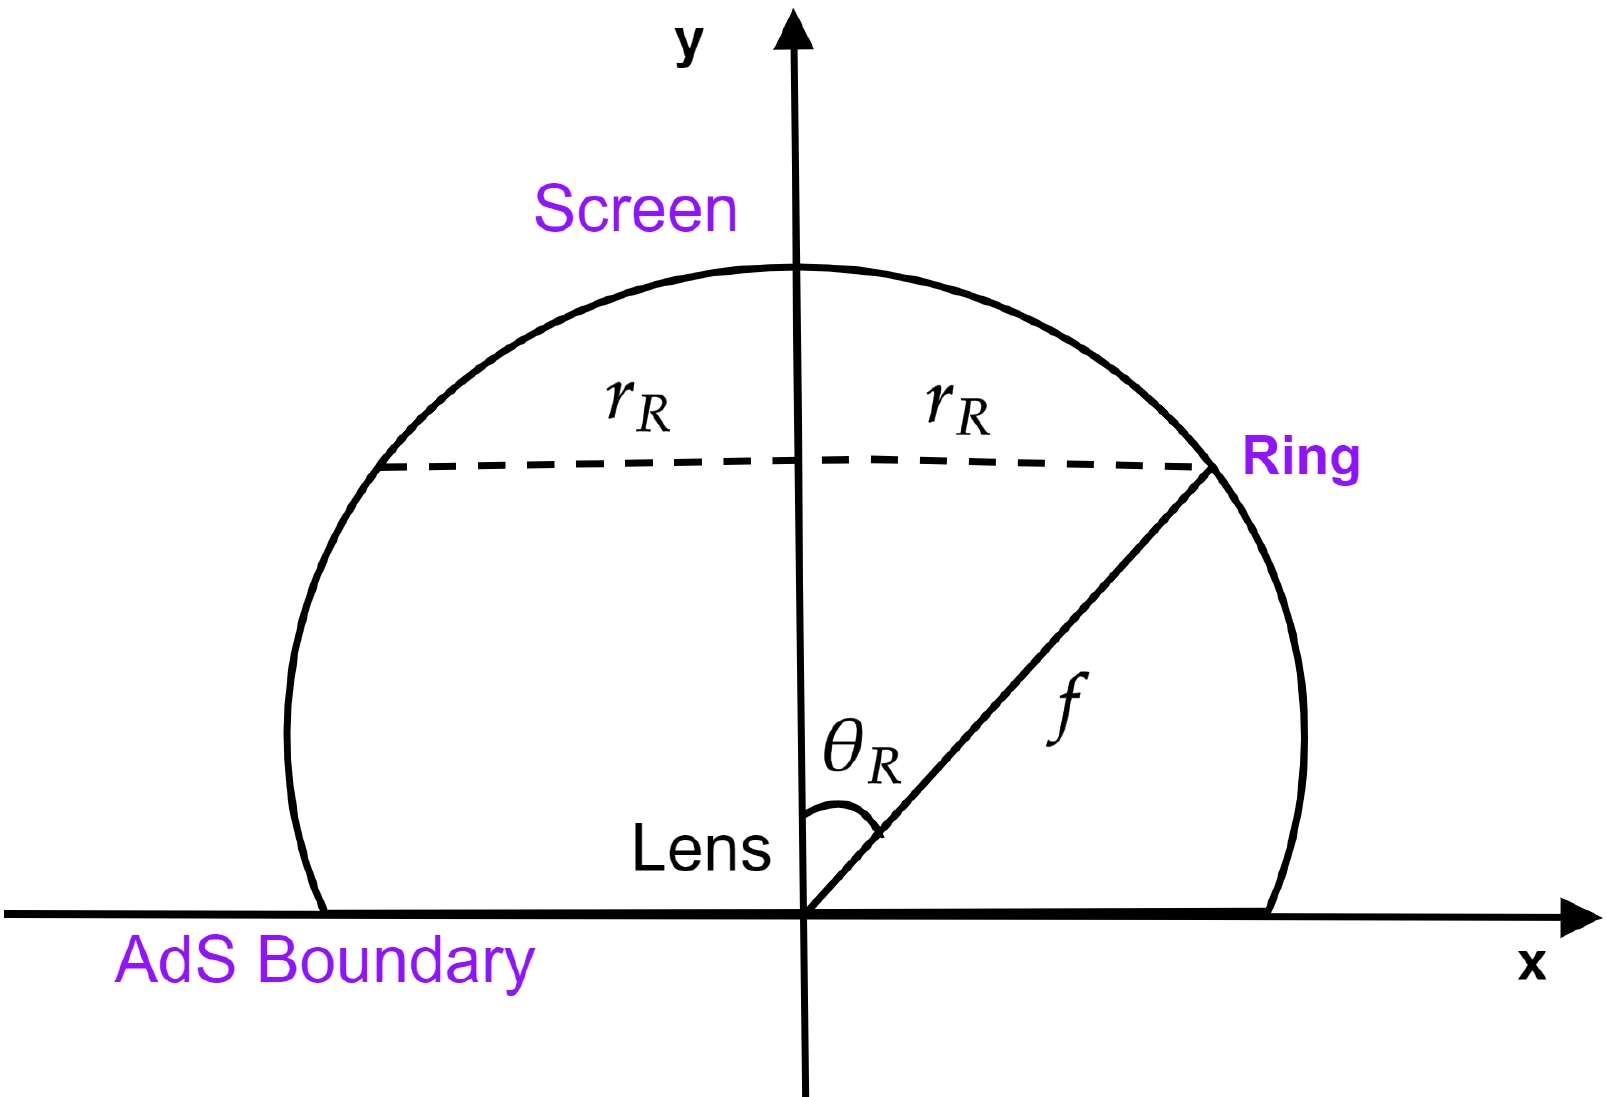
$\theta_{in}$ provides the angular distance of the image of the incident ray from the zenith. If both ends of the geodesics and the center of the BH are aligned, the observer recognizes a picture of the ring having a radius corresponding to the incident angle$\theta_{in}$ because of axis-symmetry [38]. In addition, as shown in Fig. 17, one can obtain the angle of the Einstein ring, which is formed on the screen, having ring radius$\theta_{R}$ , as given below:$ \sin\theta_{R} = \frac{r_{R}}{f}. $

(33) Further, when the angular momentum is sufficiently large, such as
$\sin\theta_{in}=\sin\theta_{R}$ , we have the following relation [38]:$ \frac{L_{p}}{E} = \frac{r_{R}}{f}. $

(34) Since, both the incident angle of the photon and the angle of the photon ring describe the angle at which the observer can see the photon ring, these should be essentially equal, which will be verified numerically, in future studies. We depict the Einstein ring radius and Einstein radius of the photon orbit for different values of α and ω inFigs. 18 and 19, respectively.

Figure 18. (color online) Comparison of the Einstein ring radius (discrete red points) in the unit of f with the Einstein radius of the photon orbit (blue curve) for different values of α and a fixed
$\omega=80$ .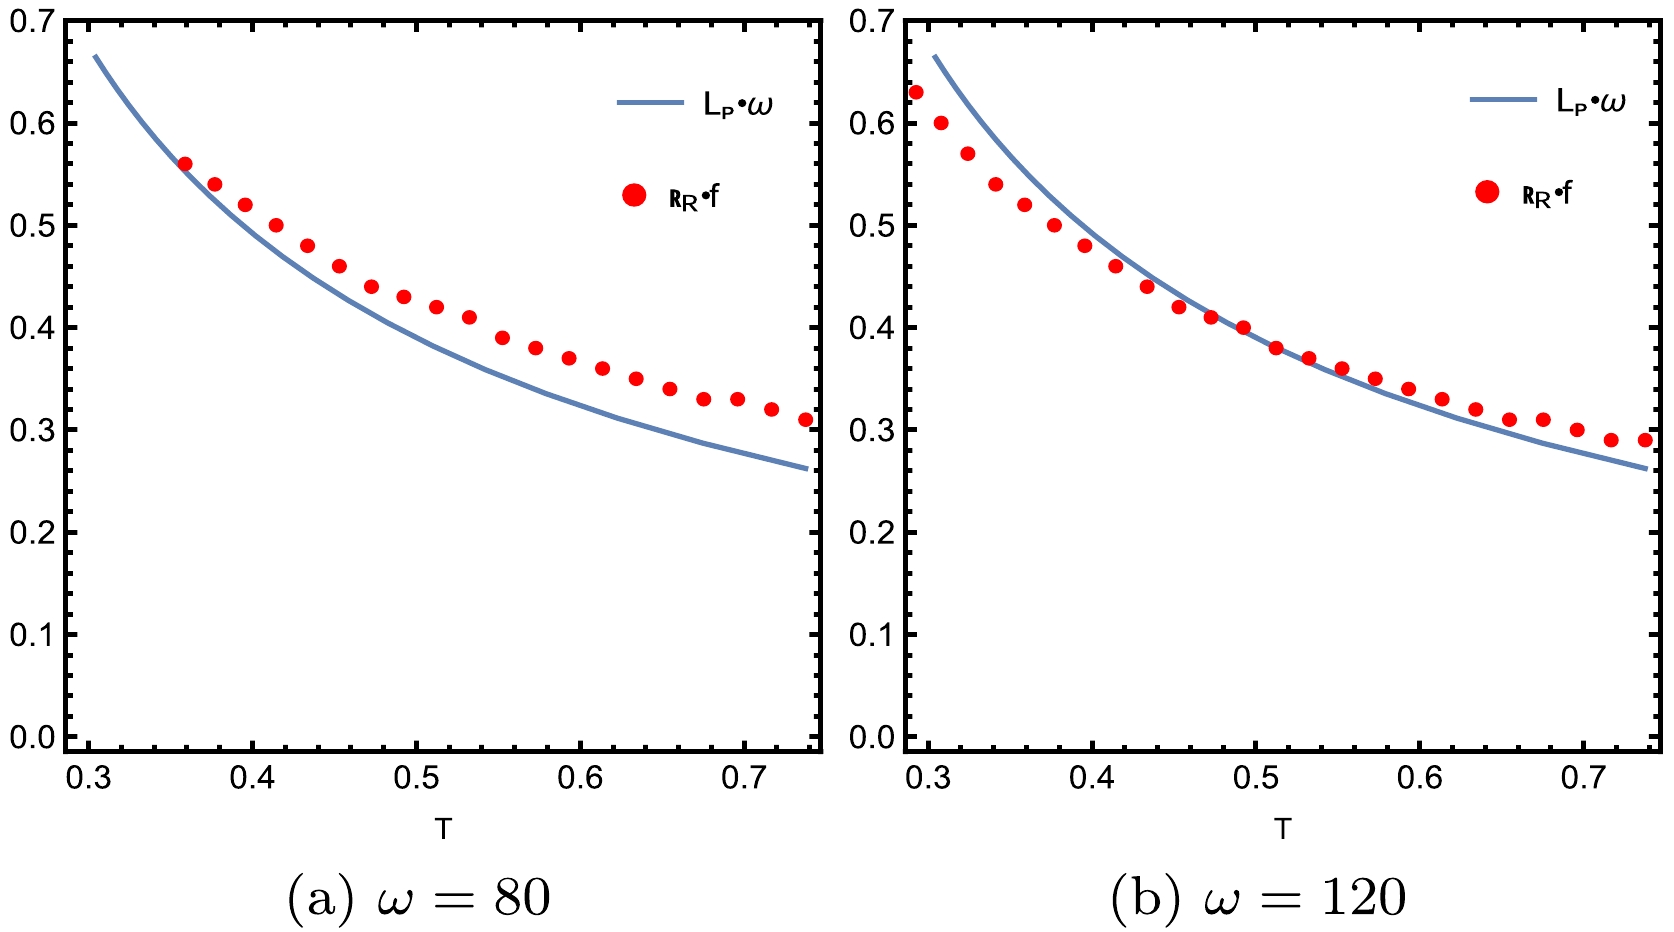
Figure 19. (color online) Comparison of the Einstein ring radius (discrete red points) in the unit of f with the Einstein radius of the photon orbit (blue curve) for different values of ω and a fixed
$\alpha=0.5$ .The blue curve depicts the photon ring position in both figures, which is the geodesics prediction, providing the angle of incidence of the photon to the AdS boundary. In contrast, the red points represent the Einstein ring radius, constructed from the response function based on wave optics, where the angular momentum can be considered as some wave packets, realized by the superposition of the spherical harmonics. FromFig. 18, we observe that the Einstein ring radius decreases with increasing temperature and the discrete red points always lie on the blue line or in its vicinity. Further, Fig. 19 (left panel) shows that, when
$\omega=80$ at lower temperature values, the discrete red points lie approximately on the blue line; however, they gradually move away from it as the temperature increases. As we increase ω to$\omega=120$ (see the right panel of Fig. 19) at the lower temperature values, the discrete red points lie approximately below the blue line; however, as the temperature increases, they cross the line and lie on it or in its vicinity. Further, both panels of Fig. 19 illustrate that the Einstein ring radius decreases with increasing temperature for both values of ω. Hence, one can observe that the accuracies of high and low-temperature fitting differ at different frequencies, implying that the variation of ω also significantly affects the results of both the wave and geometric optics. In all cases, as expected, the position of the photon rings given by geometric optics always lies on the blue line or in its vicinity with that of wave optics. -
Gravitational lensing by BHs is one of the most peculiar astrophysical tools for analyzing the strong field properties of gravity and provides information regarding the significant properties of distant stars that are too dim to be observed. Investigating the modified theories of gravity is thus beneficial, as it can help identify exotic objects. Supposing that a light source exists behind the gravitational body, when the light source, gravitational body, and observer are aligned, the observer observes the bright ring-like shape of the light source, which is the so-called the Einstein Ring. When the gravitational body is a BH, some light rays are strongly deflected and revolve around the BH several times, even infinitely, on the photon sphere. In this study, we investigated the holographic images of a BH in the bulk from a given response function on the AdS boundary. Considering the oscillating Gaussian source
${\cal{J}}_{\cal{O}}$ with frequency ω produced at a point on the boundary, we derive the local response function in the context of the AdS/CFT correspondence, which is presented on the other side of the AdS boundary. When the scalar wave passes through the BH, it always generates a diffraction pattern in the bulk geometry of the BH space-time, which is analyzed through the local response function. Our results show that the absolute amplitude of the total response function varies significantly with the variation in the coupling parameter α, frequency ω, and positions of the horizon$h_{e}$ .As the value of α increases, the resulting diffraction pattern decreases, and this effect is vice versa when we change the values of ω and the positions of the horizons. Although we analyzed the diffraction pattern of the response function, it does not directly offer concrete information on BHs. With the help of an optical system comprising a convex lens and spherical screen, we obtained the images of the BH from the response function based on wave optics. We depicted the resulting Einstein ring image on the screen for different values of α and observational angles in Fig. 6. When the position of the observer changes, the resulting Einstein image changes into a luminosity deformed ring, light arcs, or a bright light spot. In addition, we show the effect of α on the brightness curves of the lensed response, and the peaks of the curves seem to always lie far away from the center in all cases, as shown in Fig. 7. Here, one can see that, for smaller values of α, the luminosity of the ring has the maximum value, which gradually decreases as α increases. Further, in all cases, the shadow radius increases with respect to increasing values of α. Hence, α is sensitive to observing the holographic Einstein image of the STVG BH. Similarly, Figs. 8 and 9 depict the Einstein ring image and corresponding brightness profiles for different values of ω. In Fig. 8, the width of the Einstein ring becomes larger for lower values of ω and becomes sharper for larger values. This effect can also be seen in Fig. 9, where the peak curves of the brightness show sharper wave oscillations with increasing values of ω. In general, the optical appearance of the Einstein ring and the brightness profiles are closely related to the BH-involved parameters, optical system, and wave source.
We also show the optical appearance of the horizon temperature with respect to the inverse of horizon
$h_{e}$ with a fixed value of parameter$\alpha=0.1$ , as shown in Fig. 10. At the beginning of the horizon$h_{e}$ , the temperature is lower; however, it increases with the increasing values of the horizon radius. This behavior of the horizon temperature could be used to distinguish the STVG BH solutions from the BH solutions of previous studies [39, 40, 42]. Further, the influence of the temperature with respect to smaller and larger values of the horizon$h_{e}$ is also depicted on the profiles of the holographic images and the brightness curves of the lensed response, as shown in Figs. 11−14. For smaller values of the horizon$h_{e}$ , a series of concentric striped patterns exist, in which one of them is the brightest ring, which lies far away from the center, as shown in Fig. 11. This effect can also be observed in the brightness profiles (see Fig. 12), where the luminosity of the ring keeps decreasing as we increase the horizon temperature, and the peak curves always stay close to the boundary. In addition, we found that, at lower horizon temperature values, the shadow radius is minimal; however, it increases as the temperature increases. Conversely, for large values of the horizon$h_{e}$ , we found that the brightest ring gradually moves towards the center with increasing temperature. An accurate visualization of this effect is depicted in Fig. 13, and the corresponding brightness curves of the lensed response are shown in Fig. 14. One can see that, when$T=0.3113$ , the luminosity of the ring and shadow radius have the maximum values, and the increasing values of the horizon temperature reduce the luminosity of the ring and shadow radius (see Fig. 14).Based on the geometric optics, we also analyzed the Einstein ring radius corresponding to the position of the photon orbit, which is calculated from the geodesic analysis with the Einstein radius of the image constructed from the response function based on wave optics, as shown in Figs. 18 and 19 for different values of parameters α and ω, respectively. Figure 18 indicates that the discrete red points always lie on the blue line at smaller values of the horizon temperature and then gradually move away from it with increasing values of temperature in all cases. Conversely, from Fig. 19, the discrete red points always lie above, below, or close to the blue line at lower or higher horizon temperature values. Hence, the changes in the positions of the photon orbit and the Einstein radius obtained from wave optics are observed with respect to different values of parameters α and ω in both figures. As expected, in all cases, the Einstein ring radius obtained by our wave optics fits well with that of geometric optics. Finally, we concluded that the holographic Einstein ring provides significant information regarding the geometric structure of space-time and helps us analyze different gravity models comprehensively. Moreover, holographic images can be used as an effective tool to distinguish different types of BHs for fixed wave sources and optical systems. We hope these observations may provide a more intuitive understanding of Einstein rings and their related consequences for tabletop experiments in the future.
-
The linear response
$\langle O\rangle$ with respect to the external source${\cal{J}}_{\cal{O}}$ on unit$S^2$ is written as$ \langle O\rangle = -2\pi\int {\rm d} v' {\rm d}\theta' \sin\theta' G(v,v',\theta,\theta'){\cal{J}}_{\cal{O}}(v',\theta')\ , $

(A1) where we have considered that the source
${\cal{J}}_{\cal{O}}$ is axisymmetric, and$G(v,v',\theta,\theta')$ is known as the retarded Green function. Further, the Green function is given by the real-time correlation function as [37, 38])$ G = - {\rm i} \Theta(v-v') \langle [O(v,\theta),O(v',\theta')]\rangle , $

(A2) where
$\Theta(v-v')$ is the step function, and$\langle \cdots\rangle$ is the ensemble average with the equilibrium density matrix (for details, see Ref. [103]). Now, we consider that the source${\cal{J}}_{\cal{O}}$ is monochromatic with frequency ω. The Green function and the source can be expanded in terms of Fourier modes and spherical harmonics$Y_{l}(\theta)\simeq Y_{lm=0}(\theta)$ as$ G = \sum\limits_{l = 0}^{\infty} \int \frac{{\rm d}\omega'}{2\pi} {\rm e}^{-{\rm i}\omega'(v-v')} G_l(\omega)Y_{l0}(\theta)Y_{l0}(\theta'), $

(A3) and
$ {\cal{J}}_{\cal{O}}(v',\theta') = {\rm e}^{-{\rm i}\omega v'}\sum\limits_{l = 0}^{\infty}Y_{l0}(\theta'), $

(A4) where l denotes the magnetic quantum number. Thus, we can rewrite the response function (35) as
$ \langle O\rangle = -{\rm e}^{-{\rm i}\omega v} \sum\limits_{l = 0}^{\infty} G_l(\omega) Y_{l0}(\theta), $

(A5) where
$G_l(\omega)$ is a well-studied quantity in quantum field theory. For instance, the Green function of a weakly coupled field theory with mass m and coupling β is given by$ G_l(\omega) = \frac{1}{-\omega^2+l(l+1)+m_T^2} $

(A6) in which
$m_T=m^2+{\cal{O}}(\beta T^2)$ is the effective mass with the thermal effect. Then, the Einstein radius for the weakly coupled theory is given by$\sin^{2}\theta_{\rm{R}} $ $=1-m_T^2/\omega$ and is not dependent on the temperature, as$\omega\rightarrow\infty$ and gives$\theta_{\rm{R}} $ $\simeq \pi/2$ . This indicates that, if the Einstein ring depends on temperature, we can determine that the given quantum field theory has its gravity dual.
Dynamics of holographic images of scalar-tensor-vector gravity-AdS black holes
- Received Date: 2024-04-16
- Available Online: 2024-09-15
Abstract: Using AdS/CFT correspondence, we analyze the holographic Einstein images via the response function of the complex scalar field as a probe wave on an AdS Schwarzschild scalar-tensor-vector gravity (STVG) black hole (BH). We find that the amplitude of the response function


 Abstract
 HTML
HTML Reference
 Related
 PDF
PDF






 DownLoad: