-
The importance of the accurate measurement of neutron induced fission cross sections has gradually emerged along with the development of reactor designs and nucleosynthesis calculations [1, 2]. Researchers are aiming to reduce the uncertainties of fission cross sections to less than 1%, which is difficult to achieve with the commonly used fission chamber as the detector because the interference of α particles from the α decay of fission samples cannot be eliminated [3]. To improve the accuracy of fission cross section measurement, newly designed detectors with particle identification capabilities should be introduced.
The time projection chamber (TPC), proposed by David R. Nygren [4], is an advanced gaseous detector with particle identification capabilities, which has been widely used in the field of nuclear and high energy physics [5−7]. TPCs allow three-dimensional track (3D-Track) reconstruction of charged particles and particle identification by comparing the reconstructed 3D-Tracks of different particles. Several research teams have been devoted to the design of the fission-TPC, such as the NIFFTE project at Los Alamos [8−12] and FIDIAS project established by CEA-Irfu (France) and NCRS-Demokritos (Greece) [13, 14]. The NIFFTE project has already measured the fission cross section ratio of 238U/235U over a neutron energy range of 0.5−30 MeV and 239Pu/235U over a neutron energy range of 0.1−100 MeV, for which high-precision results were obtained [11, 15]. For the cross section ratio of 238U/235U, the uncertainties were 1.0%−2.0% above the 238U(n, f) threshold energy of 1.2 MeV, whereas for the cross section ratio of 239Pu/235U, the uncertainties were 0.5%−1.5%. Preliminary measurements showed that using the TPC can effectively reduce the uncertainties of measured fission cross sections. However, fission cross section measurements of actinides other than 235,238U and 239Pu using TPCs are still limited. For example, ionization chambers are adopted as fission fragment detectors for almost all the existing measurements of the fission cross sections of 232Th. Using a TPC as the detector for fission fragments of actinides such as 232Th would represent progress in the field of fission cross section measurement and is therefore is the subject of this study.
For measurement using fission chambers, the identification of fission events introduces relatively large uncertainties to the measured cross sections because only one parameter, energy, is generally used in the particle identification process. If more parameters can be considered in addition to energy, the uncertainty can be further reduced. In our previous study [16], when using a grid ionization chamber (GIC) as the particle detector for the measurement of the 232Th(n, f) reaction, the threshold of the fission events in the total energy spectrum had to be set sufficiently high to reject the α particles from the daughter nuclei of 232Th, resulting in a lower detection efficiency. However, with a TPC, low energy fission events, which should be below the threshold of the GIC, can be mostly distinguished by other parameters such as the track length and the shape of the 3D-Track, which are obtained from the track reconstruction process, leading to higher detection efficiency. The higher the detection efficiency, the smaller the portion of fission events that must be determined via simulation. Therefore, in principle, the uncertainty of a fission cross section result is smaller when using a TPC.
The TPC used in this study was designed and fabricated by the back-streaming white neutron source (Back-n) team of the China Spallation Neutron Source (CSNS) [17]. Several test experiments have been conducted using the TPC, including the readout system test [18], gap uniformity study [19], and α source measurement [20]. These studies verified the reliability of the readout system, amplification structure, and track reconstruction algorithm. In our previous study, we developed a method of measuring the cross section of the 232Th(n, f) reaction using our TPC and obtained the result at a neutron energy of 5.0 MeV [17]. The measured cross section agreed with the evaluation data, including those of JENDL-4.0, ROSFOND-2010, CENDL-3.2, ENDF/B-VIII.0, and BROND-3.1, within the measurement uncertainty. In the present study, the experimental scheme was upgraded to measure the cross sections with high precision and at more energy points, and the uncertainty was analyzed in detail. The cross sections of the 232Th(n, f) reaction were measured in the 4.50−5.40 MeV region at five energies using quasi-monoenergetic neutrons at Peking University (PKU). A small fission chamber was used to determine the neutron flux through the 238U(n, f) reaction, which was set on the top shell of the TPC to reduce the distance between the 232Th and 238U samples. A detailed simulation was performed to determine the detection efficiencies, calculate of the neutron flux ratio of the 238U sample to the 232Th sample, and correct the fission events induced by low-energy neutrons. Our study contained the first fission cross section measurement of 232Th adopting a TPC as the fission detector, and the uncertainties of our results were relatively small among the existing measured results. The remainder of this paper is organized as follows. A description of the experiment is presented in Sec. II, and the data analysis is shown in Sec. III. The results and discussions are presented in Sec. IV, and the conclusions are given in Sec. V.
-
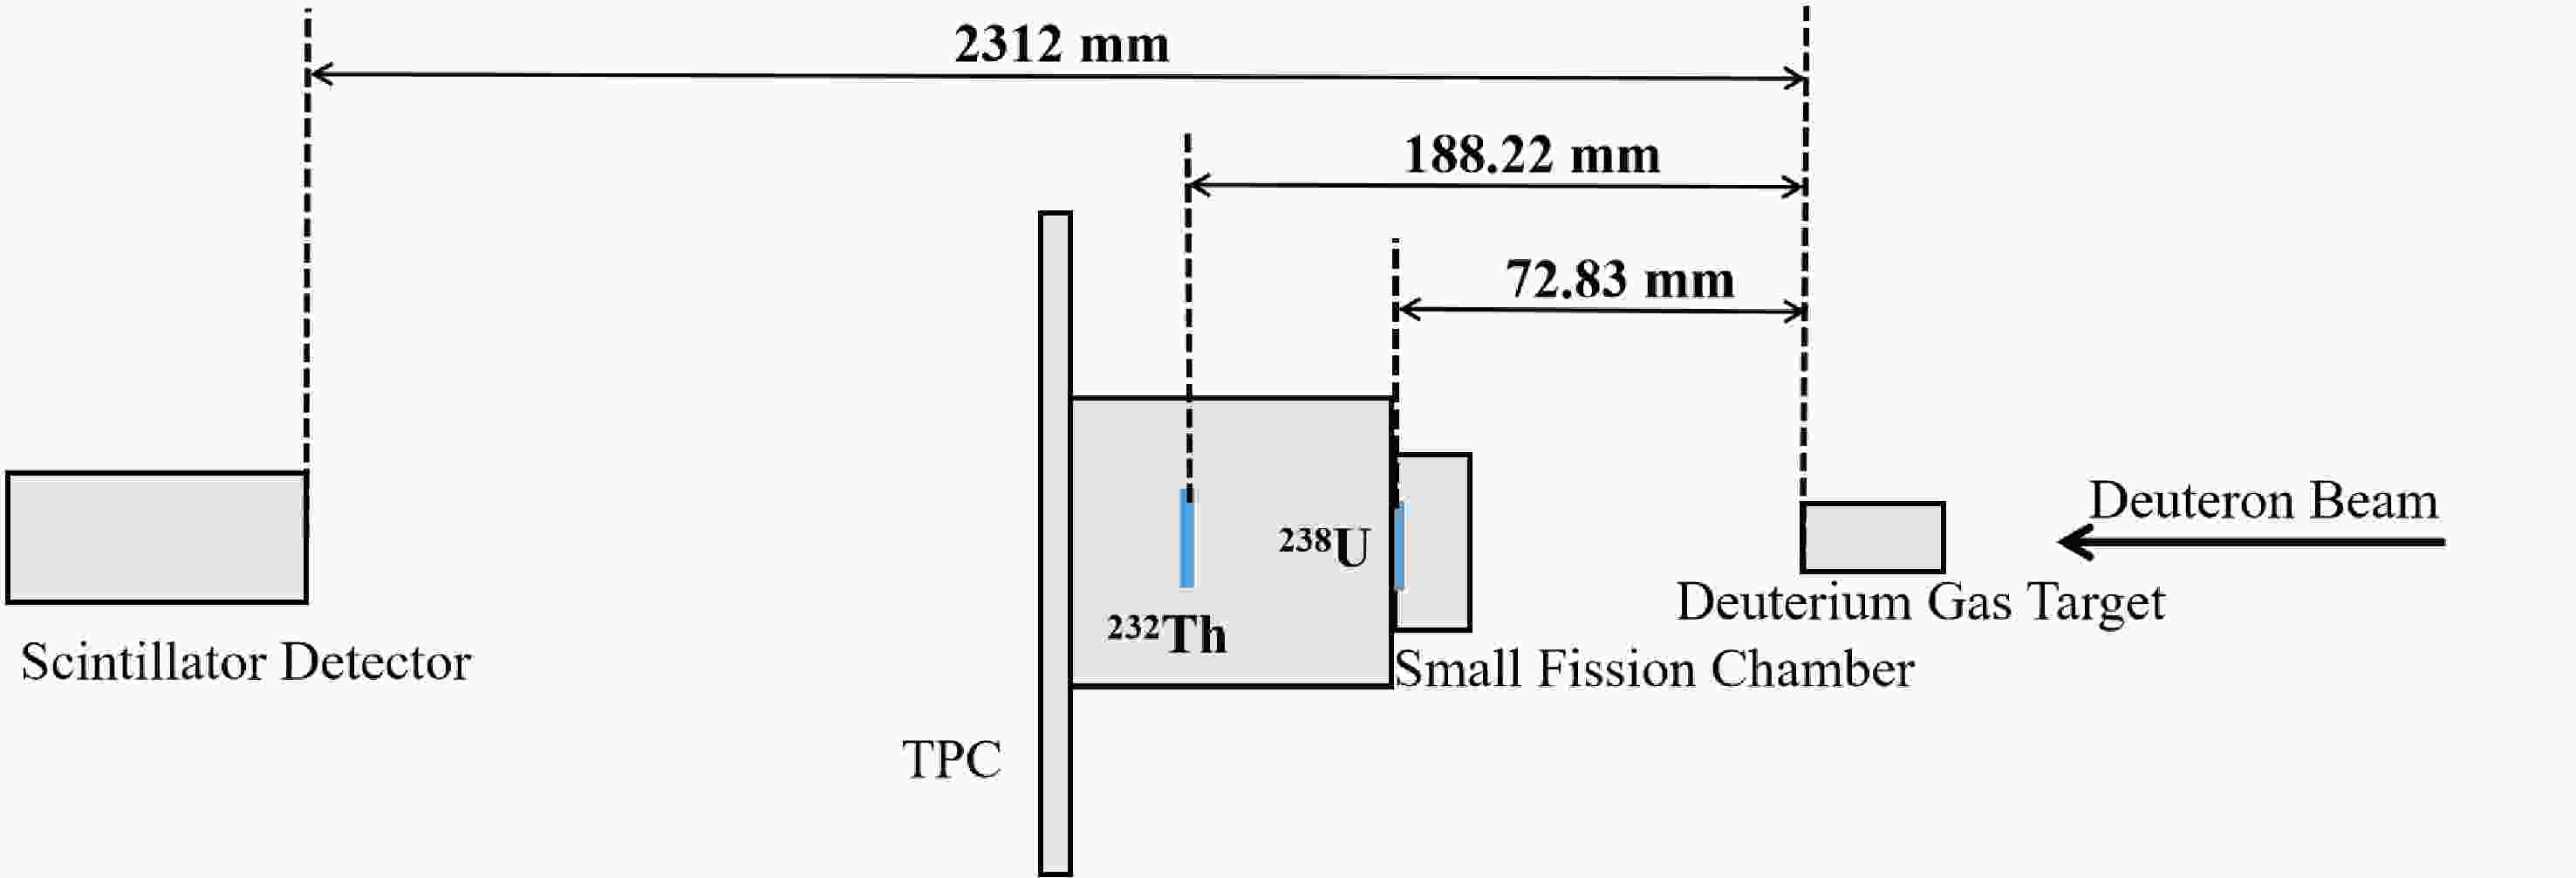
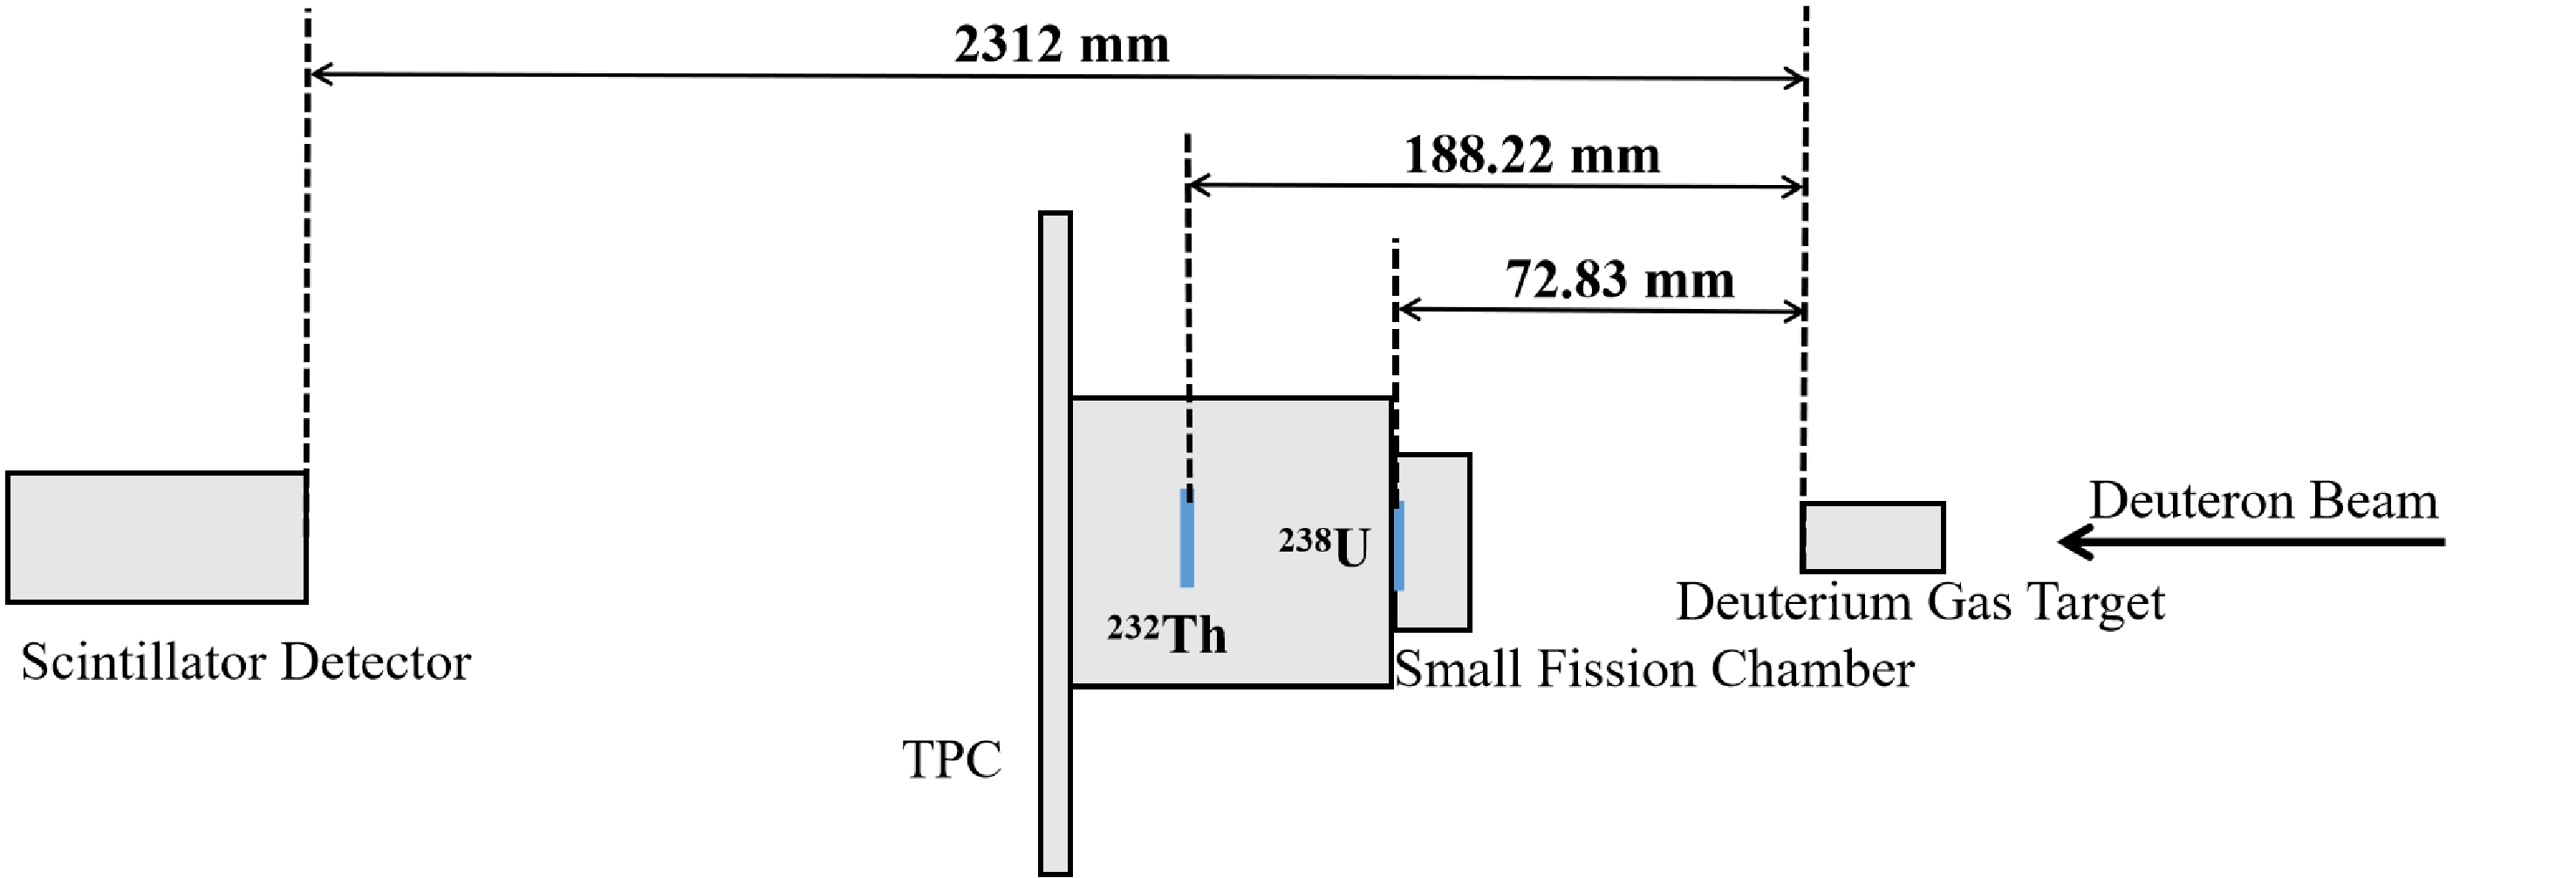
The experiment was performed at PKU using the 4.5 MV Van de Graaff accelerator. As shown in Fig. 1, the experimental setup consisted of three parts: the accelerator neutron source and neutron detector (a small fission chamber and EJ-309 scintillator detector, respectively), charged-particle detector (TPC), and samples. All the instruments were placed in the direction of 0° with respect to the deuteron beam line.
-
Quasi-monoenergetic neutrons were produced through the 2H(d, n)3He reaction using the deuterium gas target at PKU [21, 22]. The deuteron beam current was approximately 0.5−0.8 μA, and neutrons with energies ranging from 4.50 to 5.40 MeV at five neutron energies were obtained in the 0° direction with respect to the deuteron beam line. The deuterium gas target was 2.0 cm in length with a 5-μm-thick molybdenum film (as the entrance window of the gas target), and the gas pressure was 3.0 atm. The correlation deuteron energies ranged from 2.080 to 2.762 MeV, which were determined using the neutron simulation code according to the parameters of the deuterium gas target.
A small fission chamber with a 238U3O8 sample was used to determine the neutron flux [23]. As mentioned in Ref. [17], the relatively large uncertainty of the previous result mainly originated from the long distance between the 232Th(OH)4 and 238U3O8 samples. Therefore, in this study, after setting the small fission chamber at the top shell of our TPC, the distance between them was reduced from 238.3 to 115.39 mm. In addition, the distance between the two samples was fixed so that the impact of the slight vibration of the apparatuses could be significantly reduced. For the small fission chamber, the 238U3O8 sample was placed at the cathode, and the distance between the cathode and anode was 8.3 mm. The signal amplitude of the anode is related to not only the deposited energy of the particle in the sensitive region, but also the emission angle. A flowing Ar + 3.51% CO2 gas mixture with a pressure slightly higher than 1.0 atm was used as the working gas. The voltage of the anode was +200 V and the cathode was grounded.
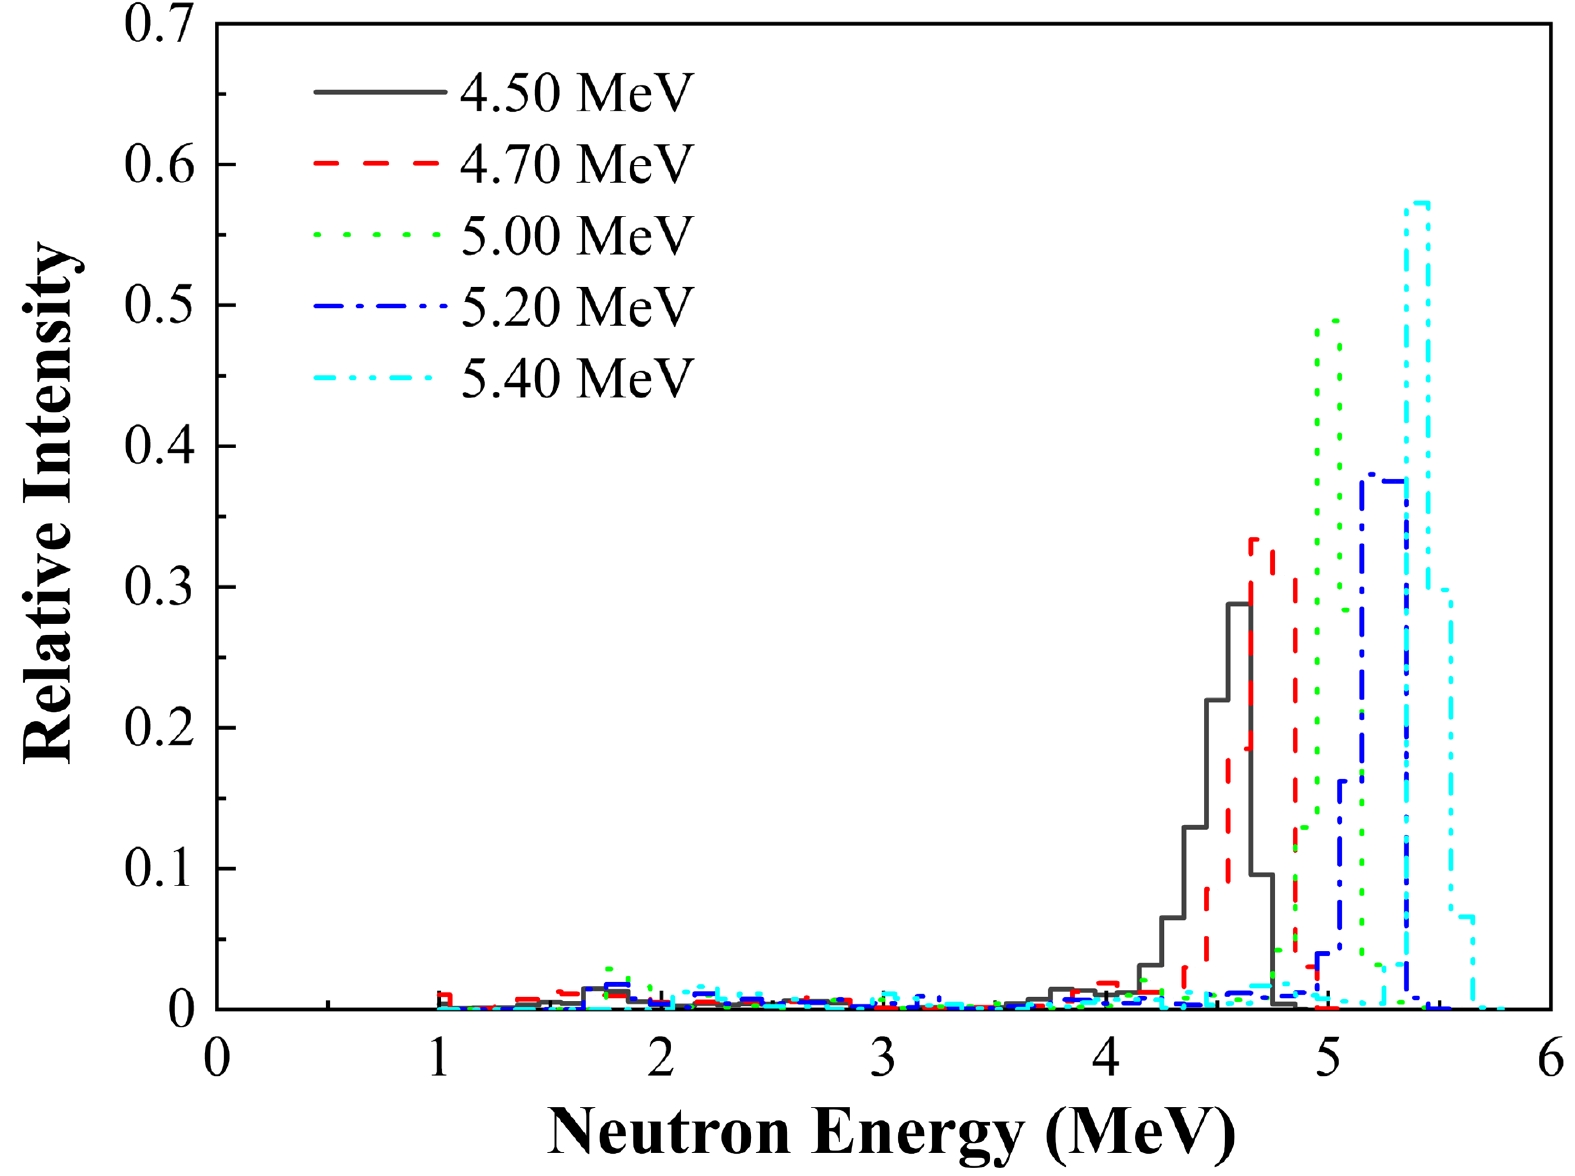
An EJ-309 scintillator detector was used to determine the neutron energy spectra. The protons generated from n-p scattering could be detected by this detector. The spectra of the five neutron energies were obtained using the unfolding method [24], as displayed in Fig. 2. The uncertainties of the neutron energies were determined by the sigma values of the Gaussian fitting of the dominant neutron peaks. As shown in Fig. 2, there were lower energy neutrons in addition to the dominant neutron peaks, with proportions of 16.4% to 18.6%. The fission events induced by the low energy neutrons should be corrected.
-
The TPC developed by the Back-n team of the CSNS was used as the particle detector to detect the forward fission fragments. The structure and electronics of our TPC are detailed in Refs. [17−19], and the settings were the same as in a previous measurement in Ref. [17], which was verified as the appropriate conditions. The cathode was placed in the middle area of the TPC chamber, where the 232Th(OH)4 sample was mounted. P10 gas (90% argon, 10% methane) was chosen as the working gas with a pressure slightly higher than 1.0 atm and a gas flow of approximately 30 mL/min. The electron drift velocity was calculated with Garfield++ [25]. The selection of the applied voltages in the TPC was based on the simulation of the trigger efficiency. The trigger efficiency,
$ { \varepsilon }_{\text{t}} $ , is the ratio of the fission events that trigger the DAQ to the total fission events. The fission events that trigger the DAQ must satisfy two conditions: not be absorbed by the sample, and have a large signal over the trigger threshold. The simulated result is shown in Ref. [17]. The mesh voltage was chosen as –270 V, and the corresponding voltage of the cathode was –1215 V for all neutron energies, which were the same as in the previous measurement in Ref. [17]. -
Table 1 shows the data of the 232Th(OH)4 and 238U3O8 samples used in this study. The number of 232Th and 238U nuclei in the samples was measured through their α activities. For the 232Th sample, the number of nuclei was measured using a small solid angle device to eliminate the interference of α particles from the daughter nuclei [26, 27]. For the 238U sample, the number of nuclei was measured using the GIC based on the energy spectrum of the emitted α particles, and the influence of other isotopes was neglected [28]. The 232Th(OH)4 and 238U3O8 samples were mounted on the cathodes of the TPC and small fission chamber, respectively.
Sample Isotopic enrichment (%) Diameter /mm Thickness/(μg/cm2) Number of nuclei (232Th or 238U) 232Th(OH)4 100 44.0 601.9 1.808×10¹⁹ (1±1.5%) 238U3O8 99.9 20.0 201.8 1.36×10¹⁸ (1±1.0%) Table 1. Data of the samples.
-
The 232Th(n, f) reaction was measured at five neutron energies between 4.50 and 5.40 MeV. For each neutron energy, the measurement duration was 4−6 h. The total duration for all five energies was ~30 h. Signals from the readout pads of our TPC and the anode signal of the small fission chamber were recorded separately. The EJ-309 scintillator detector was kept running to measure the neutron energy spectrum for all neutron energies.
-
The calculation formula of the cross section of the 232Th(n, f) reaction,
$ {\text{σ}}_{\text{Th}} $ , is$ \sigma_{\rm Th} = \frac{C_{\rm Th,all}}{N_{\rm Th}\cdot \varPhi_{\rm Th}} \cdot \rho^{\rm low} \, , $

(1) where
$ N_{\rm Th} $ is the number of 232Th nuclei in the sample, as shown in Table 1,$ C_{\rm Th,all} $ represents the total fission events of the 232Th(n, f) reaction including those undetected after the correction of self-absorption and the sub-threshold,${\varPhi_{\rm Th}}$ is the neutron flux through the 232Th(OH)4 sample, and$ \rho^{\rm low} $ is the correction coefficient of fission events due to low-energy neutrons. The determination of the three parameters$ C_{\rm Th,all} $ ,$\varPhi_{\rm Th}$ , and$ \rho^{\rm low} $ is detailed in the following sections. -
The total fission events of the 232Th(n, f) reaction,
${ {C}}_{\text{Th,all}}$ , can be calculated using$ { {C}}_{\text{Th,all}}\text=\frac{{ {C}}_{\text{Th}}}{{{ \varepsilon }}_{\text{Th}}} ,$

(2) where
${ {C}}_{\text{Th}}$ is the net fission count determined from the data of our TPC, and${{ \varepsilon }}_{\text{Th}}$ is the detection efficiency of our TPC. The following section describes the determination of these two parameters. -
The waveforms of signals obtained from the anode pads were used in the data analysis. Ref. [17] presents the details of the data analysis (which consisted of waveform processing and track reconstruction), from which the track parameters, including the track length, total amplitude of signals, number of hits, and shape of 3D-Tracks, were obtained for particle identification. Figure 3 shows the projections on different planes of the typical 3D-Tracks of a fission fragment and an α particle. The X-Y plane was parallel to the readout plane, and the electrons drifted along the Z direction. In the 3D-Track projections, each blue dot represents one responding pad, and the size of the dot represents the waveform amplitude. Ref. [17] presents the definition of the shape of the 3D-Tracks, which is the configuration of the blue dots with different sizes in 3D-Track figures such as those in Fig. 3. In the fission cross section measurement, the fission fragments from the (n, f) reaction were the events to be measured, whereas the alpha particles, which mainly originated from alpha decay and (n, α) reactions, were the interferences. Moreover, protons were generated from the (n, p) reactions and n-p scattering, but their signals could barely be detected owing to low gas gain. As shown in Figs. 3 (a) and (b), the shapes of the fission fragment and alpha particle were obviously different. Therefore, the shape of 3D-Track was the main factor for the selection of the fission events.
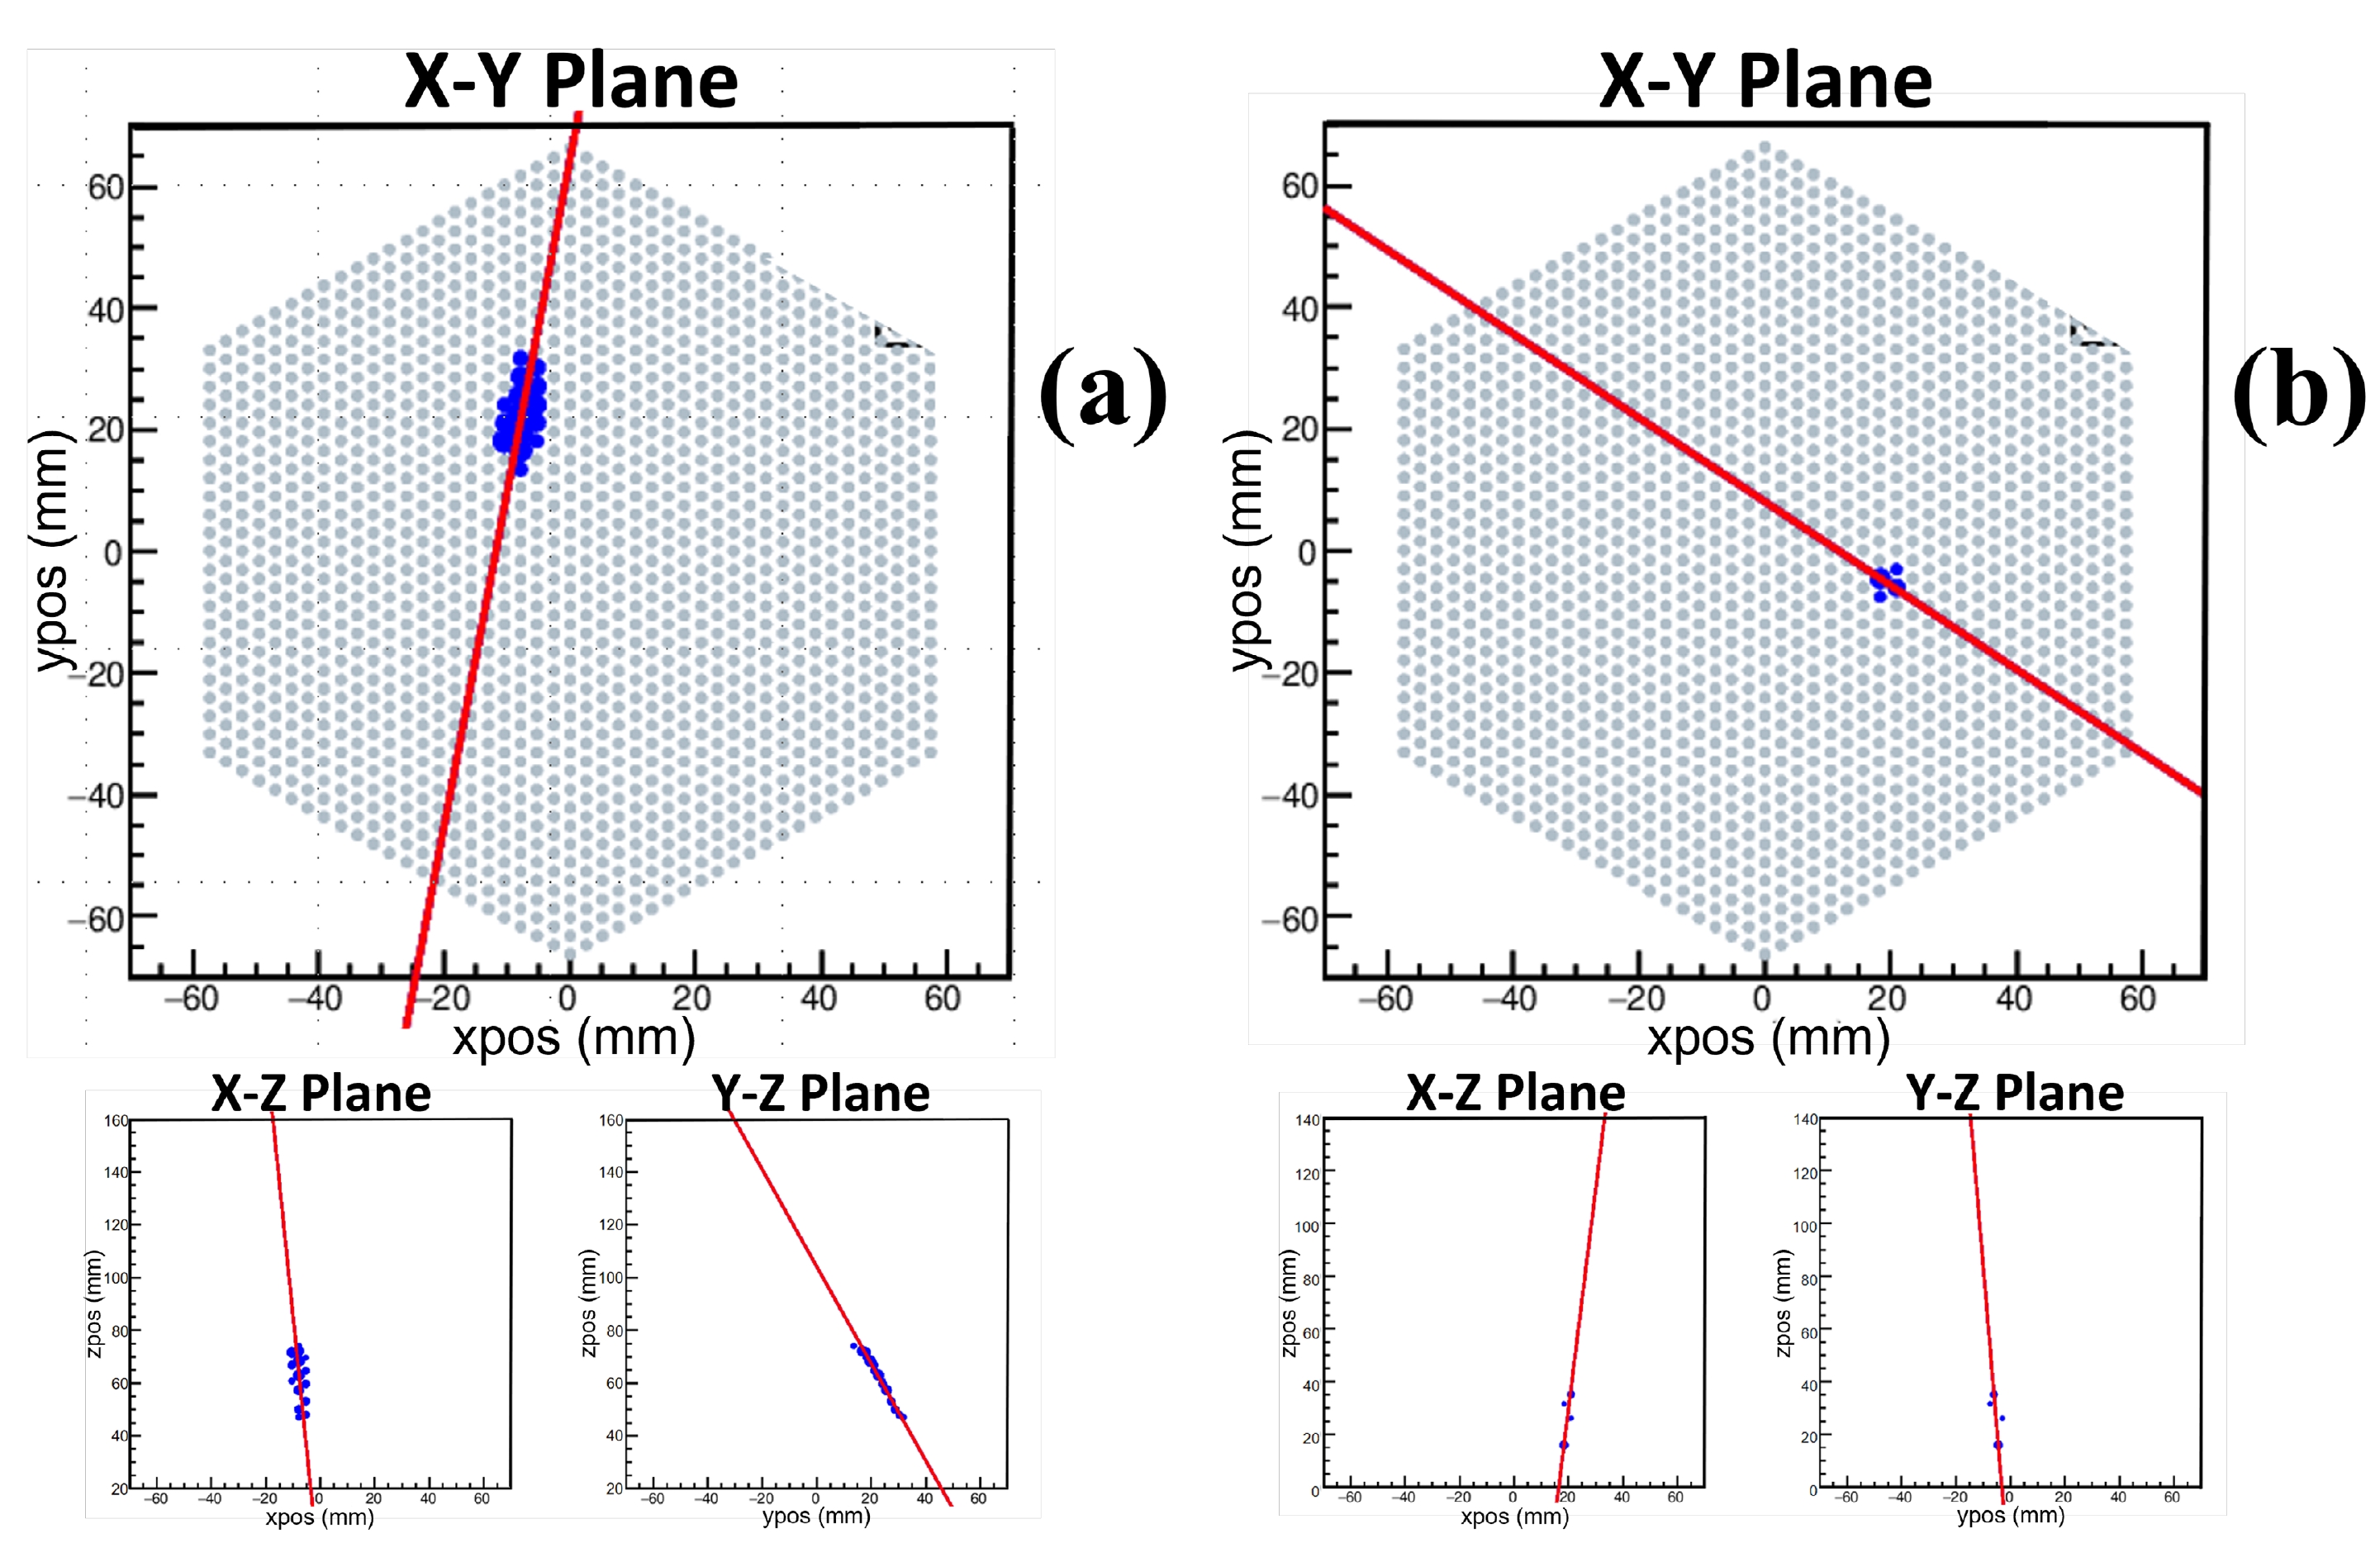
Figure 3. (color online) Projections of the typical 3D-Tracks of (a) a fission fragment and (b) an α particle.
The track length, total amplitude, and number of hits can be used for particle identification, as shown in the spectra of Fig. 4. In Fig. 4 (a), the region of the spectrum where fission events may exist was divided into three areas:

Figure 4. (color online) (a) Two-dimensional spectrum of the total amplitude vs. track length of the events. (b) Two dimensional spectrum of the total amplitude vs. number of hits of the events. Both spectra are the results at En = 5.20 MeV.
A. Total amplitude 0−1500 channels, track length 0−20 mm;
B. Total amplitude 1500−3500 channels, track length 0−60 mm;
C. Total amplitude larger than 3500 channels.
In area C, because the total amplitude of the events was sufficiently high, all events were considered fission events. In areas A and B, because the total amplitude of the events was low or not sufficiently high, the shape of the 3D-Track should be considered. Figures 5(a), (b), and (c) show the two-dimensional spectra of the total amplitude vs. number of hits of events and the typical projections of the 3D-Tracks of fission events in areas A, B, and C, respectively. For events in which the number of hits was not less than four (≥4), the shape of the track of each event was examined artificially according to the determination standard in Ref. [17]. For the remaining fission events whose number of hits was less than four (< 4) (mainly because of the large energy loss in the sample), the distribution of these events was determined through the detection efficiency simulation. In addition to the events presented in Fig. 4 (a), there were several events whose track lengths could not be successfully calculated owing to the existence of ''fake hit'' pads (mainly caused by electronic noise and channel crosstalk). To select fission events without the parameter of track length, the shape of the 3D-Track was checked manually one by one. Therefore, the net count of fission events,
${C}_{\text{Th}}$ , can be calculated using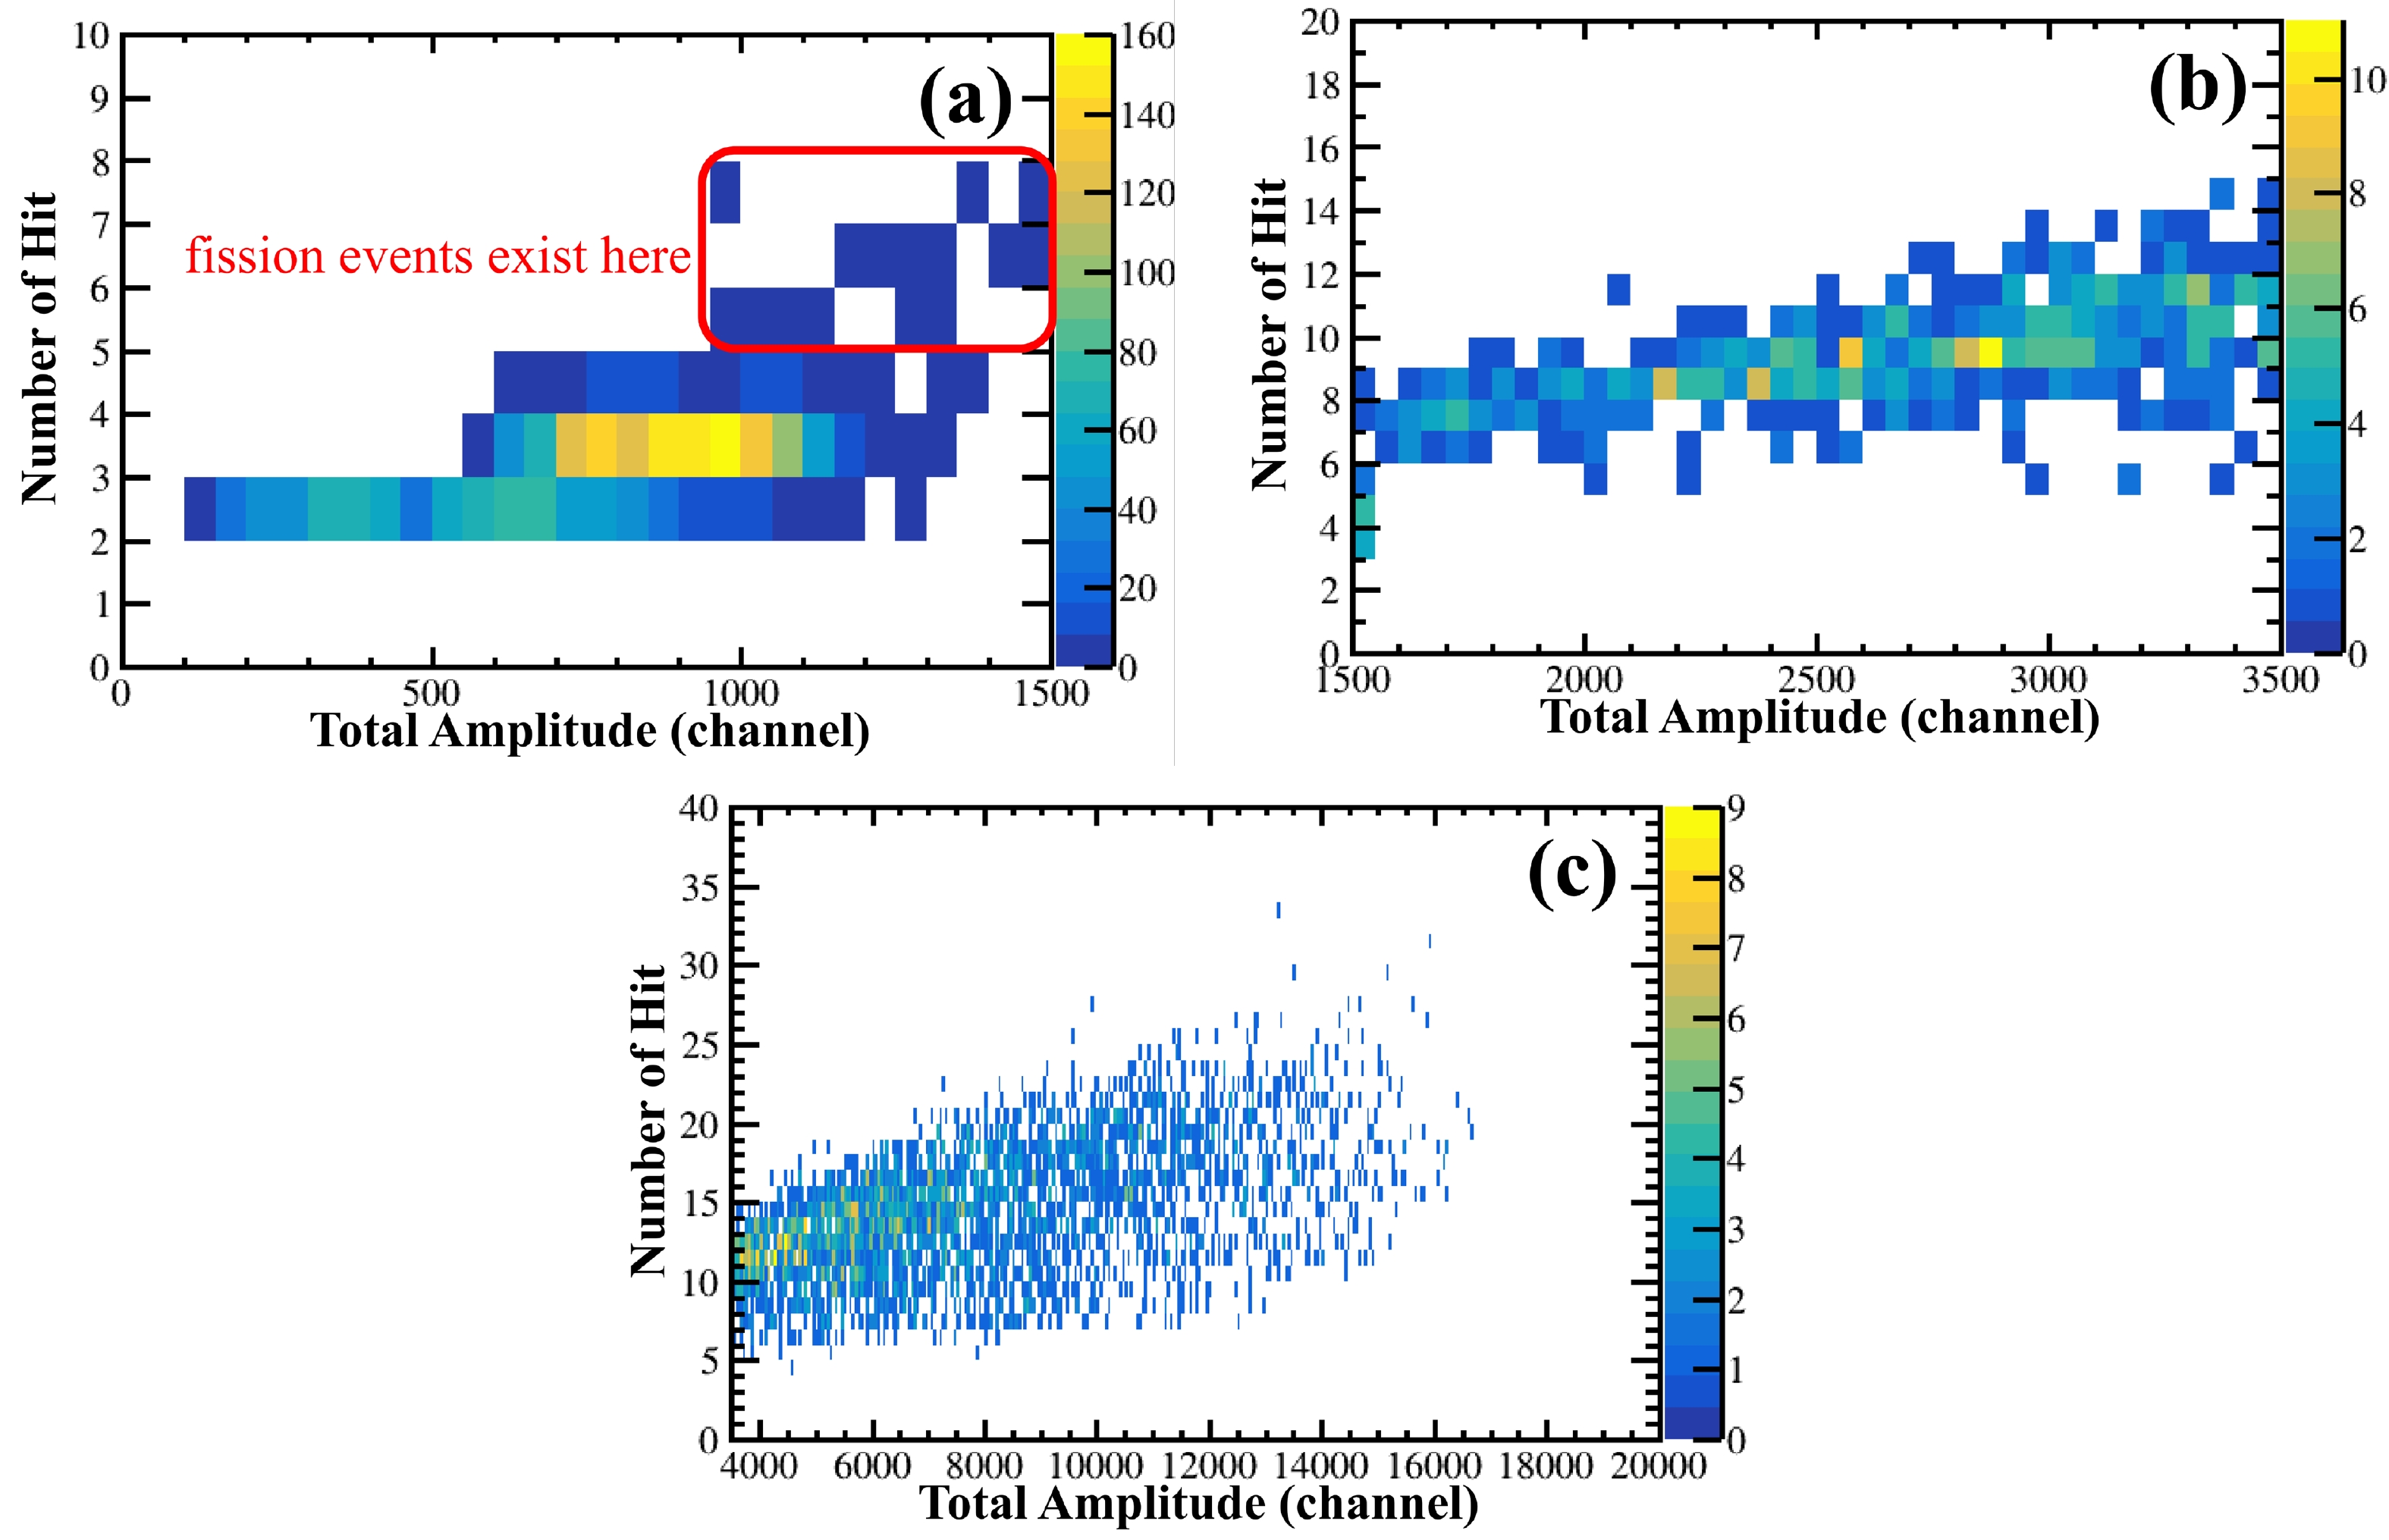
Figure 5. Two-dimensional spectra of the total amplitude vs. number of hits of the events in (a) area A, (b) area B, and (c) area C. In Fig. 5 (a), most events are alpha events (> 98%). In Fig. 5 (b), most events are fission events (> 97%). In Fig. 5 (c), all events are fission events. The selection of the fission events is based on the shapes of the 3D-Tracks. After the particle identification process, we confirmed that the selected fission events in Fig. 5 (a) exist in the red box.
$ {{C}}_{\text{Th}}\text={{C}}_{\text{Th}}^{\text{A}}\text+{{C}}_{\text{Th}}^{\text{B}}\text+{{C}}_{\text{Th}}^{\text{C}}\text+{{C}}_{\text{Th}}^{\text{R}} $

(3) where
$ {{C}}_{\text{Th}}^{\text{A}} $ ,$ {{C}}_{\text{Th}}^{\text{B}} $ , and$ {{C}}_{\text{Th}}^{\text{C}} $ are the fission counts in areas A, B, and C, respectively, and$ {{C}}_{\text{Th}}^{\text{R}} $ represents the fission counts of the events whose track length could not be reconstructed, which was determined by examining the 3D-Track of each event. Table 2 shows the net fission counts of each neutron energy and the proportion of the total events of the four parts. Because of the different measurement durations and beam currents, the results of$ {{C}}_{\text{Th}} $ varied for different neutron energies.En /MeV ${{C} }_{\text{Th} }$ 

Proportion (%) $ {{C}}_{\text{Th}}^{\text{A}} $ 

$ {{C}}_{\text{Th}}^{\text{B}} $ 

$ {{C}}_{\text{Th}}^{\text{C}} $ 

$ {{C}}_{\text{Th}}^{\text{R}} $ 

4.50 2636 (1±1.95%) 0.83 10.17 88.13 0.87 4.70 2822 (1±1.90%) 0.67 12.05 86.54 0.74 5.00 4340 (1±1.52%) 0.48 11.29 87.17 1.06 5.20 3973 (1±1.59%) 0.58 11.43 87.19 0.80 5.40 3002 (1±1.83%) 0.67 10.09 88.24 1.00 Table 2. Net fission counts of each neutron energy and the proportion of the total events of the four parts.
-
The detection efficiency,
$ {{ \varepsilon }}_{\text{Th}} $ , was determined according to simulation [17].$ {{ \varepsilon }}_{\text{Th}} $ can be calculated using$ {{ \varepsilon }}_{\rm Th}\text={{ \varepsilon }}_{\text{t}}\text{×}{{ \varepsilon }}_{\text{r}} $

(4) where
$ {{ \varepsilon }}_{\text{t}} $ is the trigger efficiency defined in Sec. II.B, and$ {{ \varepsilon }}_{\text{r}} $ is the reconstruction efficiency, which determines the ratio of the events with no less than four hit pads (whose track length can be successfully calculated in simulation) to the events that trigger the DAQ. Geant4 was used to simulate the trigger efficiency of our TPC, and the emitted fission fragments were set as isotropic in the center-of-mass system. As the counting rate of our TPC was very low during the measurement (lower than 0.5 s–1), there was no need to consider the dead time (shorter than 10 μs) in the simulation. The simulated results of$ {{ \varepsilon }}_{\text{t}} $ and$ {{ \varepsilon }}_{\text{r}} $ were 0.846−0.850 and 0.987, respectively, suggesting that most undetected events resulted from the triggering process. Therefore, the result of$ {{ \varepsilon }}_{\text{Th}} $ was 0.835−0.839. As discussed, fission events with less than four hit pads could not be reconstructed. In addition, fission events with ''fake hit'' pads, as presented in Sec. III.A.1, also could not be reconstructed. Regardless of the ''fake hit'' pads, the pad number of ''real hits,'' which composed the track of the fission fragment, was not less than four. Therefore, in the simulation, the portion of fission events with ''fake hit'' pads was included in the portion of fission events with no less than four hit pads (which could be correctly reconstructed). Thus, the${{C}}_{\text{Th}}^{\text{R}}$ loss in Sec. III.A.1 did not result from the reconstruction efficiency. -
The small fission chamber was used to determine the neutron flux. The neutron flux through the 232Th(OH)4 sample,
$ {\varPhi}_{\text{Th}} $ , can be calculated using$ {\varPhi}_{\text{Th}}\text=\frac{{\varPhi}_{\text{U}}}{{G}} , $

(5) where
$ {\varPhi}_{\text{U}} $ is the neutron flux through the 238U3O8 sample, which can be calculated according to the fission counts from the small fission chamber, and G is the ratio of the main neutron flux through the 238U3O8 sample to that through the 232Th(OH)4 sample. The determination of the two parameters$ {\varPhi}_{\text{U}} $ and G is detailed below. -
The neutron flux through the 238U3O8 sample,
$ {\varPhi}_{\text{U}} $ , can be calculated using$ {\varPhi}_{\text{U}}\text=\frac{{{C}}_{\text{U}}}{{{ \varepsilon }}_{\text{U}}}\cdot \frac{\text{1}}{{\sigma}_{\text{U}}{N}_{\text{U}}}, $

(6) where
${{N}}_{\text{U}}$ is the number of 238U nuclei, as shown in Table 1, and$ {\text{σ}}_{\text{U}} $ is the standard cross section of the 238U(n, f) reaction [29].${{C}}_{\text{U}}$ is the fission count of the 238U(n, f) reaction, and$ {{ \varepsilon }}_{\text{U}} $ is the detection efficiency of the small fission chamber. Figure 6 shows the anode spectrum of the small fission chamber at En = 5.2 MeV, from which${{C}}_{\text{U}}$ was determined. As shown in Fig. 6 , the event counts from channels 40 to 60 (most of these were also fission events) were very small, which are represented by the valley area of the spectrum. The lower threshold was set at 50 channel, that is, the center of the valley area; a similar method was also adopted in Ref. [23]. The detection efficiency of the fission events of 238U,$ {{ \varepsilon }}_{\text{U}} $ , was calculated using a Monte Carlo simulation based on Geant4. The emitted fission fragments of the small fission chamber were also set as isotropic in the center-of-mass system. Most undetected fission events were due to the self-absorption effect. Table 3 shows the results of${{C}}_{\text{U}}$ and$ {{ \varepsilon }}_{\text{U}} $ at each neutron energy. Owing to the presence of noise signals at En = 5.2 MeV, the result of${{C}}_{\text{U}}$ at this energy point was estimated with a relatively large uncertainty of 3.0%. For the other energy points, the uncertainty of${{C}}_{\text{U}}$ was 1.1%−1.5%.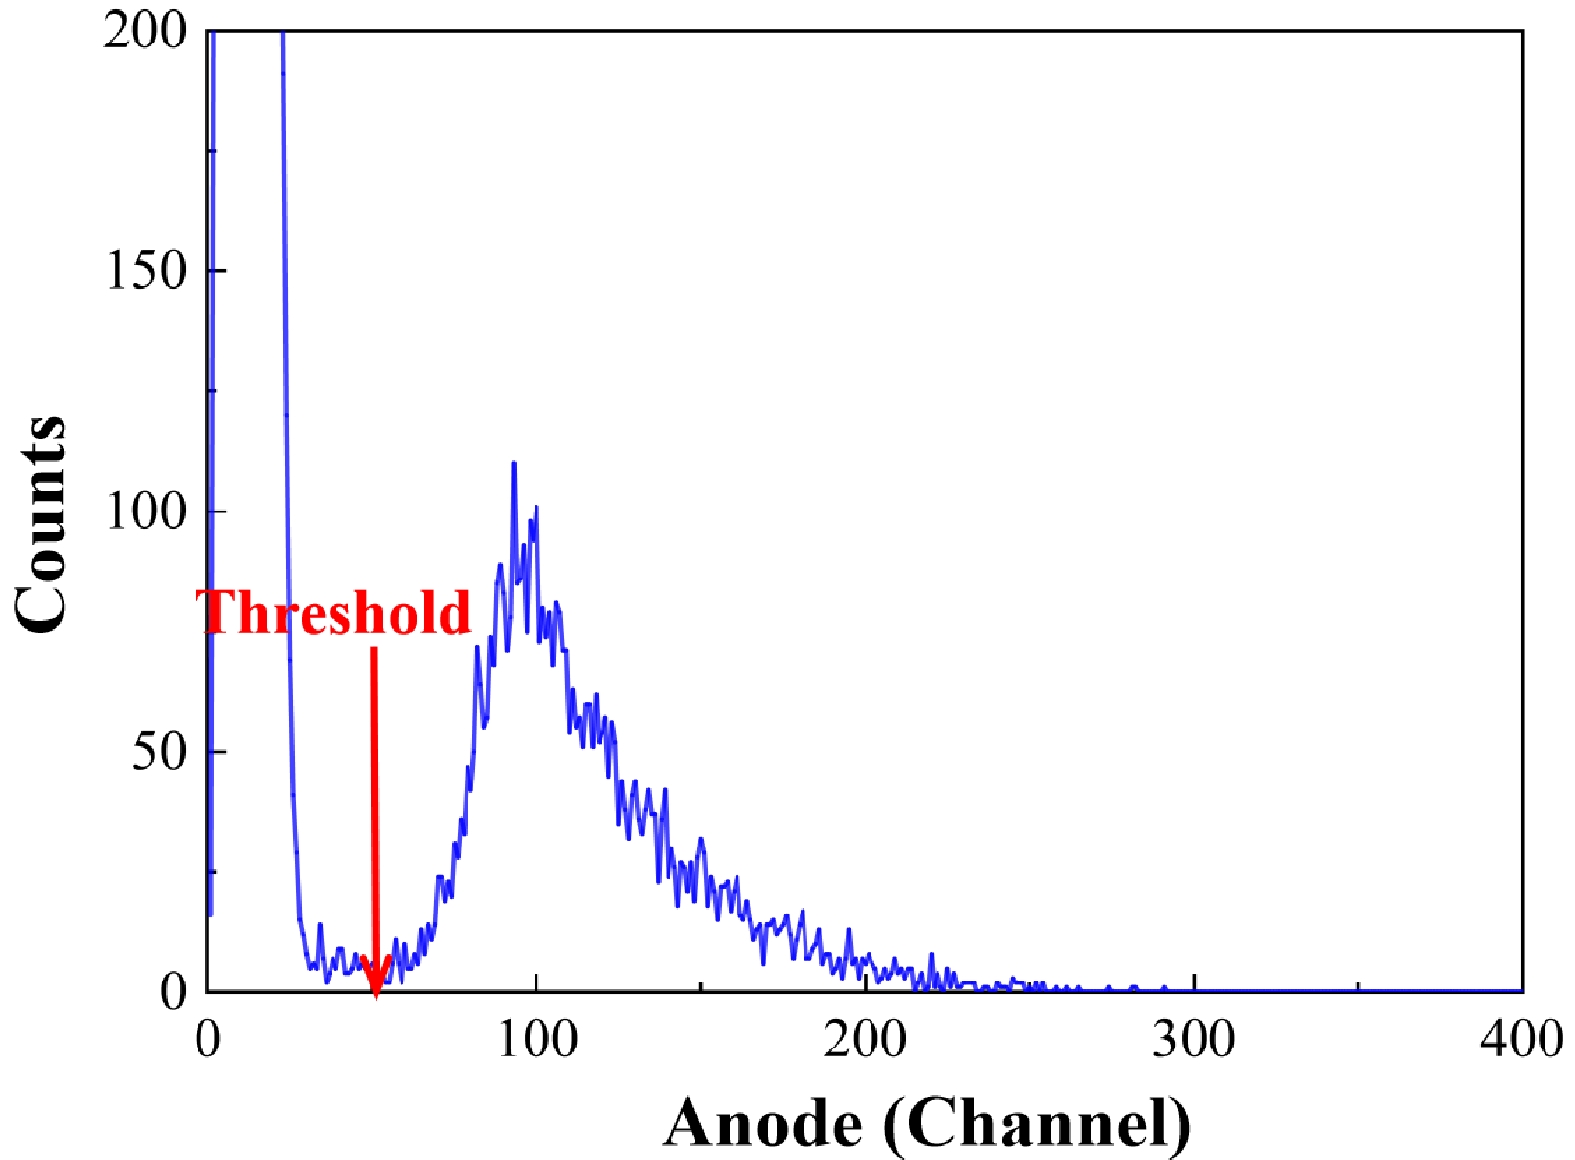
Figure 6. (color online) Anode spectrum from the 238U(n, f) reaction using the small fission chamber.
En /MeV ${{C} }_{\text{U} }$ 

$ {{ \varepsilon }}_{\text{U}} $ 

4.50 4748 (1±1.45%) 0.959 (1±0.33%) 4.70 4762 (1±1.45%) 0.958 (1±0.33%) 5.00 7583 (1±1.15%) 0.958 (1±0.33%) 5.20 7000 (1±3.00%) 0.958 (1±0.33%) 5.40 5249 (1±1.38%) 0.958 (1±0.33%) Table 3. Results of
${{C}}_{\text{U}}$ and$ {{ \varepsilon }}_{\text{U}} $ at each neutron energy. -
In our previous studies, the parameter G was calculated using a Monte Carlo simulation based on Matlab [17, 30]. In the present study, we further developed the neutron simulation code based on Geant4, which was used for the correction of events induced by low-energy neutrons; therefore, the angular distributions of the 2H(d, n)3He reaction from ENDF/B-VIII.0 were adopted in the simulation. As the neutron transport in materials can be simulated by Geant4, the simulated result of G was more accurate. According to the simulation, the value of G was 5.80−5.87 for different neutron energies. In the measurement, as the neutrons generated in the gas target ejected in all directions, the neutron flux covered the entire samples. The physical dimensions of both the 232Th(OH)4 and 238U3O8 samples were small compared with the distances between the deuterium gas target and the samples. Even though the distributions of the neutron flux at different positions of the samples had slight variations, the result of G was barely affected by the un-uniformity of the neutron flux.
-
As shown in Fig. 2, the low-energy neutrons accounted for 16.4%−18.6% of the total neutrons near the EJ309 scintillator detector. The low-energy neutrons also induced fission events, and the proportion of low-energy neutrons varied at different energies. Combining the data from the EJ309 scintillator detector with the neutron simulation results based on Geant4, the ratio of the low-energy neutrons to the total neutrons through the 232Th(OH)4 and 238U3O8 samples could be determined. For the 232Th(OH)4 sample, the ratio was 10.5%−12.8%. For the 238U3O8 sample, the ratio was 3.6%−4.7%. The significant difference in the ratio values of the two samples was mainly due to the structure of the TPC, which moderated the neutrons. Moreover, the difference in the excitation functions of the 232Th(n, f) and 238U(n, f) reactions also contributed to the different ratio values. The parameter
$ {\text{ρ}}^{\text{low}} $ was introduced to correct the influence of the low-energy neutrons [16].Using the data from the EJ309 scintillator detector and the simulation, the neutron spectra at the position of the two samples were obtained and used in the calculation of
$ {\text{ρ}}^{\text{low}} $ . The determination of$ {\text{ρ}}^{\text{low}} $ is described in Ref. [16], using a method already adopted in Ref. [17].$ {\text{ρ}}^{\text{low}} $ can be calculated using$ {\rho}^{\text{low}}\text=\frac{\text{1}-{k}_{\text{Th}}^{\text{low}}}{\text{1}-{k}_{\text{U}}^{\text{low}}}, $

(7) where
${k}_{\text{Th}}^{\text{low}}$ and${k}_{\text{U}}^{\text{low}}$ are the ratios of the low-energy neutron induced fission events to the total fission events for the 232Th(n, f) and 238U(n, f) reactions, respectively.${k}_{\text{Th}}^{\text{low}}$ and${k}_{\text{U}}^{\text{low}}$ can be determined via$ k_{\text{Th(U)}}^{\text{low}} = \frac{\sum _{E_{n}\in \text{low\_energy}}{I}^{E_{n}}\cdot{\sigma}_{\text{Th(U)}}^{E_{n}}}{\sum _{E_{n}}{I}^{E_{n}}\cdot {\sigma}_{\text{Th(U)}}^{E_{\text{n}}}}, $

(8) where
$I^{E_n}$ is the relative intensity at neutron energy$E_n$ according to the neutron energy spectra, and${\sigma}_{\text{Th}}^{E_n}$ and${\sigma}_{\text{U}}^{E_n}$ are the cross sections of the 232Th(n, f) and 238U(n, f) reactions, which were obtained from ENDF/B-VIII.0. The value of${k}_{\text{Th}}^{\text{low}}$ was 7.8%−10.1% and$ {\text{k}}_{\text{U}}^{\text{low}} $ was 2.7%−3.9% for different neutron energies. The difference between${k}_{\text{Th}}^{\text{low}}$ and${k}_{\text{U}}^{\text{low}}$ was contributed to by the difference between both the proportions of low-energy neutrons and the excitation functions of the 232Th(n, f) and 238U(n, f) reactions. Because the 232Th(OH)4 sample was further from the neutron source, the result of${k}_{\text{Th}}^{\text{low}}$ was larger. According to the${k}_{\text{Th}}^{\text{low}}$ and${k}_{\text{U}}^{\text{low}}$ values,${\rho}^{\text{low}}$ was 0.935−0.946. -
Rewriting Eq. (1) according to Eqs. (2), (5), and (6), the cross section of the 232Th(n, f) reaction,
${\sigma}_{\text{Th}}$ , can be calculated via$ \sigma_{\text{Th}} = \sigma_{\text{U}} \frac{N_{\text{U}}\cdot C_{\text{Th}} \cdot \varepsilon_{\text{U}}}{N_{\text{Th}}\cdot C_{\text{U}}\cdot \varepsilon _{\text{Th}}} G \cdot \rho^{\text{low}}, $

(9) where
${\sigma}_{\text{U}}$ is the standard cross section of the 238U(n, f) reaction [29].$N_{\text{U}}$ and$N_{\text{Th}}$ are the numbers of 238U and 232Th nuclei in the samples, as shown in Table 1.$C_{\text{Th}}$ and$C_{\text{U}}$ are the net fission counts of the 232Th(n, f) and 238U(n, f) reactions, as described in Secs. III.A.1 and III.B.1, respectively.$ {{ \varepsilon }}_{\text{U}} $ and$ {{ \varepsilon }}_{\text{Th}} $ are the detection efficiencies of fission events determined from simulation. G is the ratio of the main neutron flux through the 238U3O8 sample to that through the 232Th(OH)4 sample, as described in Sec. III.B.2.${\rho}^{\text{low}}$ is the correction coefficient of the low-energy neutron induced fission events, as presented in Sec. III.C. According to our previous study [16], the counts of the forward and backward fission fragments were almost the same for the 232Th(n, f) reaction in the 4.20 MeV ≤ En ≤ 5.50 MeV region. Although only the forward fission fragments were detected by our TPC in the measurement, the present result can be considered as the fission cross section of 232Th. -
Using Eq. (9), the cross sections of the 232Th(n, f) reaction at the five energies were calculated, as presented in Table 4. Figure 7 (a) shows the present data compared with evaluation data, which reveals the consistency between the present results and the evaluation data. Figure 7 (b) shows the present cross sections compared with the data from evaluations and measurements in the energy range
$4.0\;{\rm MeV}\le E_n \le 6.0\;{\rm MeV}$ . As shown in Fig. 7(b), the data of different evaluation libraries exhibited significant differences in this neutron energy range. For example, the discrepancies between the JENDL-4.0 and ROSFOND-2010 data reached approximately 5%. With new measurements adopting new methods, the discrepancies between different evaluation libraries are expected to reduce. Our present results were similar to the data of CENDL-3.2. Compared with the measurement data, our results were consistent with the latest measurement data of Gledenov [16], Chen [31], and Michalopoulou [32]. According to the discussion in Ref. [16], the systematic deviations between previous results may be related to the neutron sources (mono-energetic or white neutron sources). Our present measurement using the TPC was based on a mono-energetic neutron source. Future measurements using the TPC based on a white neutron source such as CSNS Back-n will have the opportunity for verification. Sources of uncertainty are listed and quantified in Table 5. The uncertainties of our fission cross sections were less than 5% at the five neutron energies, which is relatively small among the existing measurement data. Our results represent the first measurement of the cross sections of the 232Th(n, f) reaction using the TPC as the fission fragments detector, revealing the potential of our TPC for high accuracy fission cross section measurement.En /MeV Cross section (b) 4.50 ± 0.12 0.1477 ± 0.0065 4.70 ± 0.10 0.1559 ± 0.0070 5.00 ± 0.07 0.1490 ± 0.0061 5.20 ± 0.09 0.1474 ± 0.0070 5.40 ± 0.05 0.1486 ± 0.0063 Table 4. Measured 232Th(n, f) cross sections.
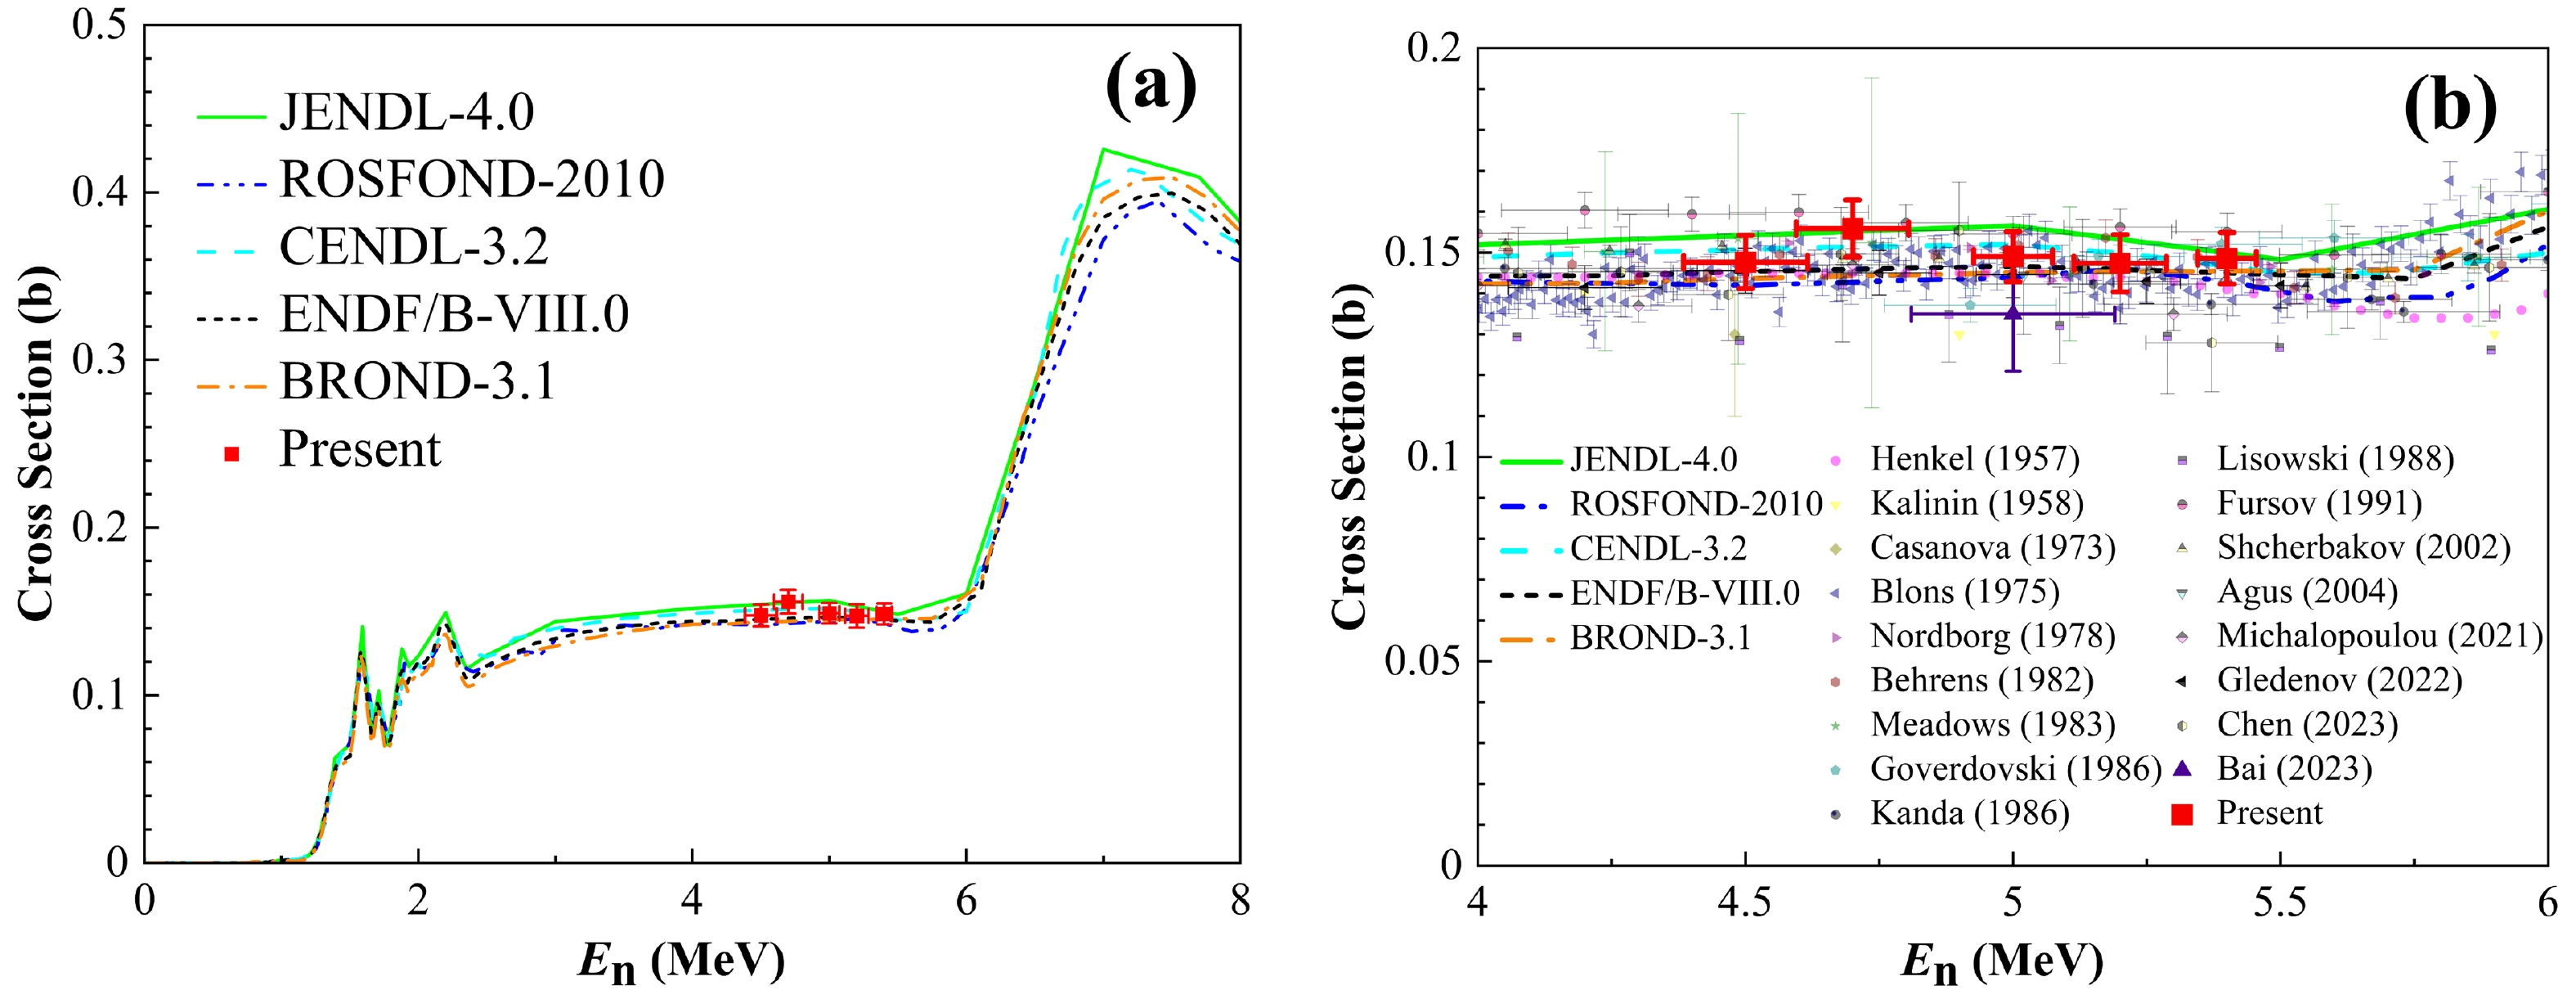
Figure 7. (color online) Present 232Th(n, f) cross section compared with (a) evaluations and (b) data from previous measurements and evaluations for
$4.0\;{\rm MeV}\le E_n \le 6.0\;{\rm MeV}$ .Source Magnitude (%) ${\sigma}_{\text{U} }$ 

1.3−1.4 $N_{\text{U} }$ 

1.0 $N_{\text{Th} }$ 

1.5 $C_{\text{Th} }$ 

1.5−2.0 $C_{\text{U} }$ 

1.1−3.0 $ {{ \varepsilon }}_{\text{U}} $ 

0.3 $ {{ \varepsilon }}_{\text{Th}} $ 

1.4−2.2 ${\rho}^{\text{low} }$ 

1.4−1.8 G 1.3−1.8 ${E}_{n}$ 

1.0−2.6 ${\sigma}_{\text{Th} }$ 

4.1−4.7 Table 5. Sources of uncertainty and their magnitudes.
The relative uncertainty of the cross section,
$\delta \sigma_{\text{Th}}/\sigma_{\text{Th}}$ , was determined according to the error propagation principle [16].$\delta \sigma_{\text{Th}}/\sigma_{\text{Th}}$ was calculated via$ \frac{\delta \sigma_{\rm Th}}{\sigma_{\rm Th}} = \sqrt{\sum _{i=9}{\left(\frac{\delta y_i}{y_i}\right)}^{\text{2}}} ,$

(10) where
$ \text{δ}{\text{y}}_{\text{i}}/{\text{y}}_{\text{i}}(i=1 ~ 9) $ represents$ \text{δ}{\text{σ}}_{\text{U}}/{\text{σ}}_{\text{U}} $ ,$ \text{δ}{\text{N}}_{\text{U}}/{\text{N}}_{\text{U}} $ ,$ \text{δ}{\text{N}}_{\text{Th}}/{\text{N}}_{\text{Th}} $ ,$ \text{δ}{\text{C}}_{\text{Th}}/{\text{C}}_{\text{Th}} $ ,$ \text{δ}{\text{C}}_{\text{U}}/{\text{C}}_{\text{U}} $ ,${ \text{δ}}{{ \varepsilon }}_{\text{U}}/{{ \varepsilon }}_{\text{U}} $ ,$ {\text{δ}}{{ \varepsilon }}_{\text{Th}}/{{ \varepsilon }}_{\text{Th}} $ ,$ \text{δ}{\text{ρ}}^{\text{low}}/{\text{ρ}}^{\text{low}} $ , and$ \text{δ}\text{G}/\text{G} $ , respectively, which are the corresponding terms of the relative uncertainties of the sources in Table 5.$ \text{δ}{\text{σ}}_{\text{U}}/{\text{σ}}_{\text{U}} $ originates from the uncertainty of the standard cross section of the 238U(n, f) reaction [29].$ \text{δ}{\text{N}}_{\text{U}}/{\text{N}}_{\text{U}} $ and$ \text{δ}{\text{N}}_{\text{Th}}/{\text{N}}_{\text{Th}} $ are the uncertainties of the number of 238U and 232Th nuclei, which can be determined during the measurement of the number of nuclei [26, 28]. The uncertainty of the net fission count of the 232Th(n, f) reaction,$ \text{δ}{\text{C}}_{\text{Th}}/{\text{C}}_{\text{Th}} $ , is composed of two parts: the statistical uncertainty,$ \delta {\text{C}}_{\text{Th}}^{\mathrm{S}\mathrm{t}\mathrm{a}\mathrm{t}}/{\text{C}}_{\text{Th}}^{\mathrm{S}\mathrm{t}\mathrm{a}\mathrm{t}} $ , and the uncertainty from the process of fission fragment identification,$ {\text{C}}_{\text{Th}}^{\mathrm{S}\mathrm{t}\mathrm{a}\mathrm{t}}/{\text{C}}_{\text{Th}}^{\mathrm{P}\mathrm{I}\mathrm{D}} $ .$ \text{δ}{\text{C}}_{\text{Th}}/{\text{C}}_{\text{Th}} $ can be calculated using$ \frac{\text{δ}{\text{C}}_{\text{Th}}}{{\text{C}}_{\text{Th}}}=\sqrt{{\left(\frac{\delta {\text{C}}_{\text{Th}}^{\mathrm{S}\mathrm{t}\mathrm{a}\mathrm{t}}}{{\text{C}}_{\text{Th}}^{\mathrm{S}\mathrm{t}\mathrm{a}\mathrm{t}}}\right)}^{2}+{\left(\frac{\delta {\text{C}}_{\text{Th}}^{\mathrm{P}\mathrm{I}\mathrm{D}}}{{\text{C}}_{\text{Th}}^{\mathrm{P}\mathrm{I}\mathrm{D}}}\right)}^{2}} .$

(11) The statistical uncertainty was 1.52%−1.95% for different neutron energies. In the process of fission fragment identification, the shapes of the 3D-Track figures were examined for low-energy events to determine whether they were fission events; however, several events could not be distinguished. The number of the indistinguishable events was between 1 and 7 at different energies, and
$ \delta {\text{C}}_{\text{Th}}^{\mathrm{P}\mathrm{I}\mathrm{D}}/{\text{C}}_{\text{Th}}^{\mathrm{P}\mathrm{I}\mathrm{D}} $ was from 0.11% to 0.25%. The uncertainties of the detection efficiency,$ {\text{δ}}{{ \varepsilon }}_{\text{U}}/{{ \varepsilon }}_{\text{U}} $ and$ {\text{δ}}{{ \varepsilon }}_{\text{Th}}/{{ \varepsilon }}_{\text{Th}} $ , were determined according to a comparison of the results of different simulation parameters. The relatively large uncertainty of${ \text{δ}}{ \varepsilon }_{\text{Th}}/{{ \varepsilon }}_{\text{Th}} $ was due to the imperfection of the simulation of our TPC, which originated from the trigger process and track reconstruction process simulations. In the simulation of the detection efficiency of our TPC, the trigger threshold in the trigger process and the tracking parameters in the track reconstruction process affected the result. Restricted by the present simulation techniques, the input trigger threshold in the simulation might have been slightly difference from the exact threshold of each pad, which mainly contributed to the uncertainty of the detection efficiency. With the possibility of changing the trigger threshold and tracking parameters in the simulation, the simulation results of$ {{ \varepsilon }}_{\text{Th}} $ had differences of 1.4% to 2.2% for different neutron energies. Although the accurate uniformity of the 232Th(OH)4 sample was not determined nor considered in the simulation, its contribution to the uncertainties was small compared with the uncertainty from the trigger and track reconstruction process. The uncertainty of the correction coefficient of the low-energy neutrons,$ \text{δ}{\text{ρ}}^{\text{low}}/{\text{ρ}}^{\text{low}} $ , was determined by comparing the present results and the recalculation results regardless of the data from the EJ309 scintillator detector. The relative deviation of the recalculation results (using only the results of the neutron simulation) and the present results (using both the data from the EJ309 scintillator detector and the results of the neutron simulation) of$ {\text{ρ}}^{\text{low}} $ was 1.4%−1.8% for different neutron energies, which was considered the result of$ \text{δ}{\text{ρ}}^{\text{low}}/{\text{ρ}}^{\text{low}} $ . The uncertainty of G,$ \text{δ}\text{G}/\text{G} $ , was the difference between the original and re-calculated values after changing the distance between our TPC and the neutron source in the simulation. With the 1-mm variation in the distance between the neutron source and our TPC when setting the geometries of the simulation, the magnitude of the uncertainty of G was 1.3%−1.8% at different neutron energies. As illustrated in Sec. II.1, the uncertainties of the neutron energies were determined using the sigma values of the Gaussian fitting of the dominant neutron peaks in the neutron spectra. -
In our previous study [17], an experimental program was established for the measurement of the cross section of the 232Th(n, f) reaction using our TPC, and the 232Th(n, f) cross section was measured at a neutron energy of 5.0 MeV. The result was consistent with the evaluation data. However, there were two main drawbacks of the previous study: the relatively large uncertainty of 10.1%, which was mainly contributed by parameters G (8.6%) and
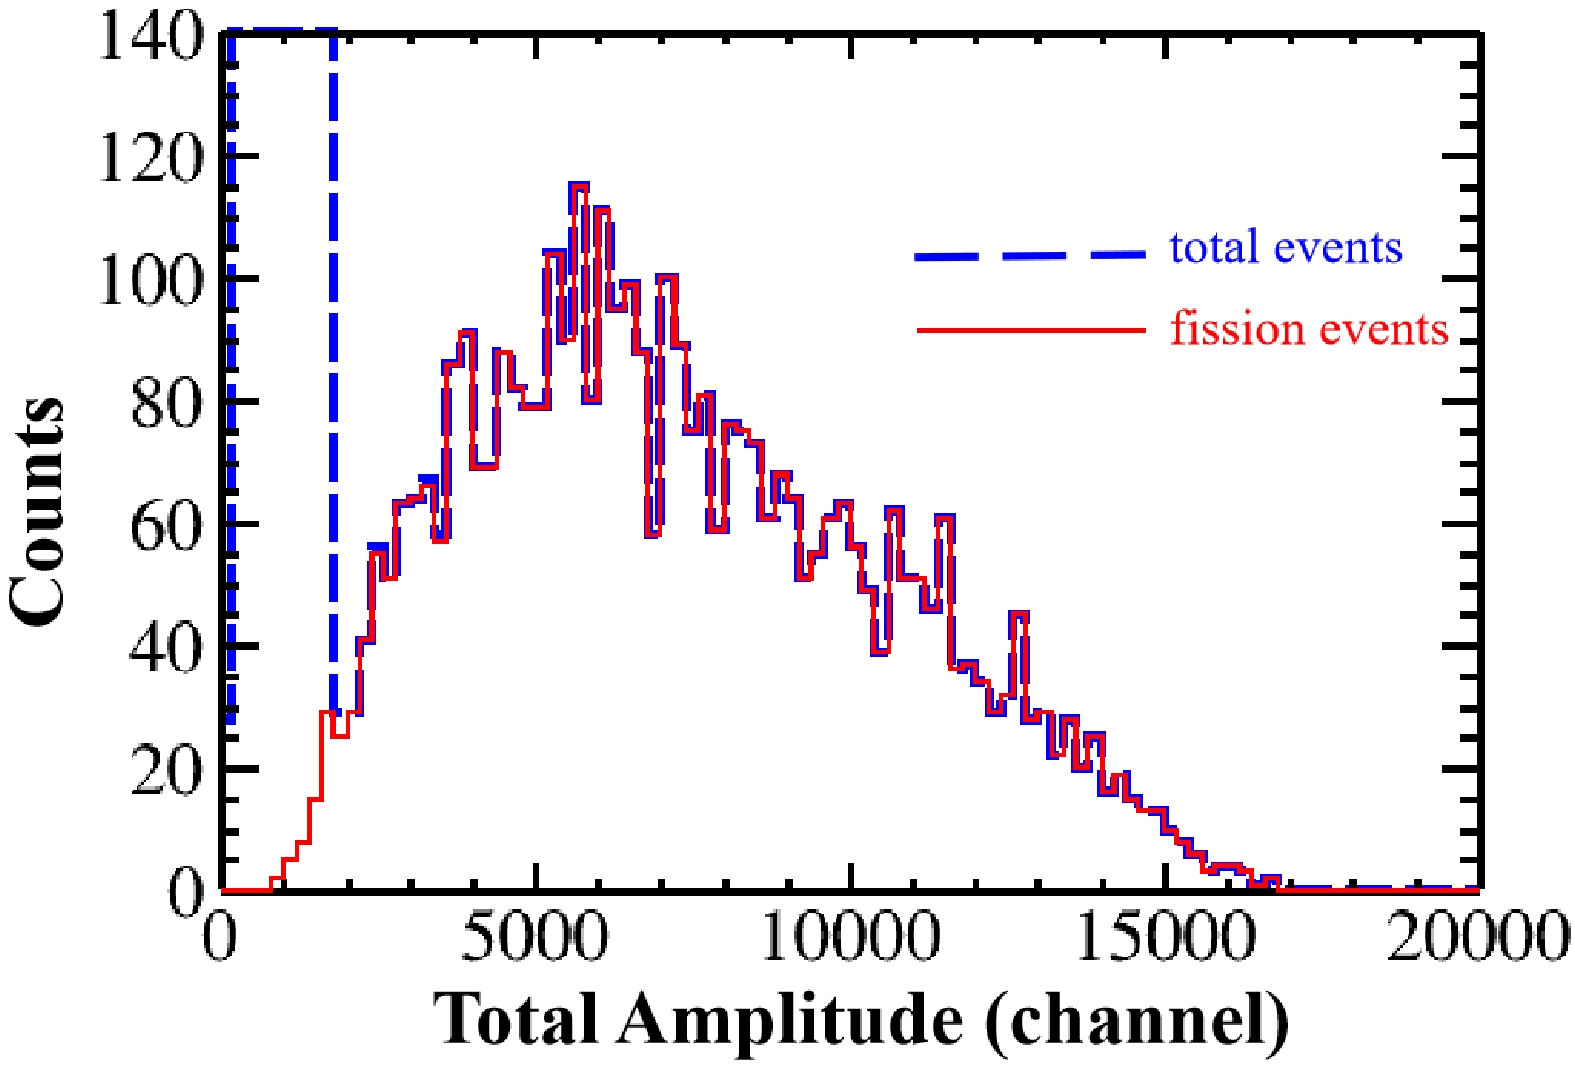
$ {\text{ρ}}^{\text{low}} $ (3.7%), both of which originated from the significant distance between the two fission samples, and the limited neutron energy point of only 5.0 MeV. In this study, the distance between the two samples was greatly reduced, resulting in smaller uncertainties for both G and$ {\text{ρ}}^{\text{low}} $ of less than 2% and smaller uncertainties for the present cross sections of less than 5%. The cross sections for the 232Th(n, f) reaction were measured at five energies of$ 4.5\;\mathrm{M}\mathrm{e}\mathrm{V}\le E_n \le 5.4\;\mathrm{M}\mathrm{e}\mathrm{V} $ .Compared with our previous study using a GIC [16], the particle identification of our TPC resulted in a higher detection efficiency of the fission fragments and more accurate fission counts. Figure 8 shows the total amplitude spectra of the total events and selected fission events at En = 5.2 MeV. The spectrum of the total events was similar to the anode spectrum of the GIC. As shown in Fig. 8 , there were significant α events below 2000 channels; therefore, the low-energy fission events less than 2000 channels could barely be distinguished. In Ref. [16], the proportion of low-energy fission events was determined based on simulation with a relatively large uncertainty, and the detection efficiency was 0.76−0.79 (1% ± 3.0%). Using our TPC, the proportion of most low-energy fission events could be distinguished according to other parameters, such as total amplitude, track length, number of hits, and most uniquely, the shape of the 3D-Track, which was examined artificially as a result of the track reconstruction of our TPC. Only the fission events with an extremely small number of hits (less than four) need to be determined via simulation. Therefore, the uncertainty of the present fission cross sections was smaller.
As the first specialized TPC used for fission cross section measurement, the NIFFTE TPC is designed for high-precision cross section results with uncertainties less than 1% [8−12]. Studies measuring the fission cross section of 238U relative to 235U at 0.5 − 30 MeV and 239Pu relative to 235U at 0.1−100 MeV were published in 2018 and in 2021, respectively, which were the first attempts at using a TPC as the fission fragment detector in cross section measurement [11, 15]. The results were accurate with uncertainties less than 2%. Compared with our results, the statistical uncertainties (contributed by the uncertainties of event counts and number of nuclei) and detection efficiency of their work were significantly smaller. The statistical uncertainties were less than 1.2% and the efficiency correction uncertainties were less than 0.5%. However, only the fission cross sections of 239Pu and 238U have been measured by the NIFFTE. Our fission cross section measurement is the first to adopt a TPC as the fission fragment detector for other actinides, such as 232Th.
According to Table 5, the main sources of uncertainty included G,
$ {\text{ρ}}^{\text{low}} $ ,$ {\text{C}}_{\text{Th}} $ ,$ {\text{N}}_{\text{Th}} $ , and$ {{ \varepsilon }}_{\text{Th}} $ . With further improvements in the experimental setup, for example, by setting the 232Th(OH)4 and 238U3O8 samples back-to-back, the uncertainties of G and$ {\text{ρ}}^{\text{low}} $ can be reduced to less than 0.5%. When provided longer measurement durations for the cross section measurement and determining the number of 232Th nuclei, the uncertainties of$ {\text{C}}_{\text{Th}} $ and$ {\text{N}}_{\text{Th}} $ can be reduced to approximately 1% . The uncertainty of$ {{ \varepsilon }}_{\text{Th}} $ may be reduced further as the simulation technique of our TPC improves in the future. At present, only forward fission fragments can emerge from the sample, and only the forward events can be detected because our TPC only has one readout plane on the forward side and the 232Th sample was prepared on a tantalum backing and mounted on the cathode. In the future, with the development of our TPC project, a new version of the TPC will have readout planes on both sides, and self-supporting samples on the cathode will be adopted. Using the new version of the TPC, both the forward and backward fission fragments should be detected, which will further improve the accuracy. With the future optimization of our TPC and longer measurement duration, the uncertainty of the fission cross section of 232Th can be reduced to less than 3.0%. -
The cross sections of the 232Th(n, f) reaction were measured at five neutron energies in the 4.50 ≤ En ≤ 5.40 MeV region using our TPC as the fission fragment detector. Compared with our previous measurement, owing to the reduction in the distance between the 238U3O8 and 232Th(OH)4 samples, measurement uncertainties were significantly decreased from 10.1 to 4.1%−4.7%. With the track reconstruction and particle identification capabilities of our TPC, the detector efficiency of the fission fragments was sufficiently higher, leading to more accurate fission counts and smaller uncertainty of the cross sections. The uncertainties of these results were less than 5% and our results agreed with the evaluation data, indicating that our TPC is suitable for fission cross section measurements. Ours is the first cross section measurement of the 232Th(n, f) reaction using a TPC, revealing that TPCs are suitable for not only 235,238U and 239Pu but also other actinide fission cross section measurements. After adopting further measurement improvements using our TPC, the uncertainty of cross section for the 232Th(n, f) reaction is expected to reduce to 3.5%, suggesting that our TPC will have the potential for high-precision fission cross section measurements. Other fission reactions of actinides will be measured in the future.
Cross section measurement for the 232Th(n, f ) reaction in the 4.50−5.40 MeV region using a time projection chamber
- Received Date: 2024-03-01
- Available Online: 2024-10-15
Abstract: Accurate cross sections of neutron induced fission reactions are required in the design of advanced nuclear systems and the development of fission theory. Time projection chambers (TPCs), with their track reconstruction and particle identification capabilities, are considered the best detectors for high-precision fission cross section measurements. The TPC developed by the back-streaming white neutron source (Back-n) team of the China Spallation Neutron Source (CSNS) was used as the fission fragment detector in measurements. In this study, the cross sections of the 232Th(n, f) reaction at five neutron energies in the 4.50−5.40 MeV region were measured. The fission fragments and α particles were well identified using our TPC, which led to a higher detection efficiency of the fission fragments and smaller uncertainty of the measured cross sections. Ours is the first measurement of the 232Th(n, f) reaction using a TPC for the detection of fission fragments. With uncertainties less than 5%, our cross sections are consistent with the data in different evaluation libraries, including JENDL-4.0, ROSFOND-2010, CENDL-3.2, ENDF/B-VIII.0, and BROND-3.1, whose uncertainties can be reduced after future improvement of the measurement.


 Abstract
 HTML
HTML Reference
 Related
 PDF
PDF




 DownLoad: