


 Abstract
 HTML
HTML Reference
 Related
 PDF
PDF


-
The Hanbury Brown-Twiss (HBT) correlation, commonly referred to as the Bose-Einstein correlation, has become an important observable for investigating the spatial and temporal structure of particle-emitting sources created in relativistic heavy-ion collisions [1−6]. HBT radii are key parameters in HBT analyses that provide insights into the spatial and temporal dimensions of sources.
Because of their interactions with source media, the mass of the particles in the medium may vary from their vacuum mass. This variation can result in a squeezing effect, leading to an experimental observable known as squeezed back-to-back correlation (SBBC) between bosons and antibosons [7−16]. For sources that have a broad temporal distribution, the SBBC may be completely suppressed [10, 13]. Consequently, even with the squeezing effect, SBBC cannot provide feedback for sources with a broad temporal distribution. The squeezing effect influences the HBT correlation by reducing the impact of flow [10, 16], leading to a non-flow behavior in the one-dimensional HBT radii. Even for sources with broad temporal distributions, this non-flow behavior persists in the HBT radii [16]. Thus, the non-flow behavior of the HBT radii offers a new way to study squeezing effects beyond SBBC. Previous research on the influences of the squeezing effect on HBT was based on the spherically symmetric Gaussian expanding source [10, 16]. In fact, the sources formed in relativistic heavy-ion collisions are not spherically symmetric. In addition, one-dimensional HBT radii can not provide detailed information for each dimension. Hence, the impact of the squeezing effect on three-dimensional HBT radii must be studied further.
In this study, a locally thermalized cylinder expansion source [17, 18] is used to study the influences of the squeezing effect on three-dimensional HBT radii. The squeezing effect on the three-dimensional HBT radii of ϕϕ and
$ D^0 $ $ D^0 $ is shown. The impact of the squeezing effect is more pronounced for the heavier bosons, which significantly influences the HBT results [16]. In addition, owing to their electrically neutral nature, ϕ and$ D^0 $ are not influenced by the Coulomb effect, making them better probes than charged bosons for investigating the squeezing effect.Currently, there are no HBT experimental measurements for ϕϕ and
$ D^0 $ $ D^0 $ . Most experiments are for HBT measurements and analysis involving two pions and two kaons [19−30]. Owing to their higher mass, kaons may serve as a more effective probe for studying the squeezing effect in HBT radii compared to pions. Thus, we also investigate the impact of the squeezing effect on the three-dimensional HBT radii of$ K^+ $ $ K^+ $ . In the calculations, the Coulomb effect is not considered.The squeezing effect affects the HBT radii by suppressing the influence of transverse flow on the transverse source distribution and increasing the width of the space-time rapidity distribution of the particle-emitting source, ultimately increasing the HBT radii, particularly for large transverse pair momentum
$ K_T $ . Consequently, the HBT radii no longer decreases monotonically with$ K_T $ . This phenomenon is referred to as the non-flow behavior of the HBT radii [16]. This strange HBT radii behavior may offer new insights into the study of squeezing effects. The squeezing effect has a more significant impact on$ R_o $ and$ R_l $ than$ R_s $ . The impact of the squeezing effect on HBT radii is enhanced for bosons with larger masses and at lower freeze-out temperatures.The ϕ, D, and kaon mesons serve as excellent probes for investigating the quark-gluon plasma (QGP) generated during relativistic heavy-ion collisions because they contain either a strange or a charm quark, which are known to experience the complete QGP evolution resulting from these collisions. A great deal of attention has been triggered by the latest investigations into experimental data related to the ϕ, D, and kaon mesons [31−65]. In addition, it was anticipated that the interactions with the medium would induce modifications to the masses of ϕ, D, and kaon mesons within the particle-emitting sources produced during relativistic heavy-ion collisions [66−75]. Consequently, the analysis presented in this paper applies to relativistic heavy-ion collisions.
The rest of the paper is organized as follows: Section II presents the equations of the HBT correlation function with the squeezing effect for cylinder expansion sources. Additionally, this section presents the formulas of the three-dimensional HBT radii based on a Gaussian form. Section III examines the impact of the squeezing effect on the distributions of sources for the ϕ,
$ D^0 $ , and$ K^+ $ mesons. It also analyzes how the squeezing effect influences the three-dimensional HBT radii of ϕϕ,$ D^0 $ $ D^0 $ , and$ K^+ $ $ K^+ $ . Finally, Sec. IV concludes the paper with a summary and discussion. -
The HBT correlation function of two identical bosons was defined as [1−6]
$ \begin{eqnarray} C({\bf{q}},{\bf{K}}) =1+\frac{\bigg|\displaystyle\int {\rm d}^{4}rS(r,K){\rm e}^{{\rm i}q\cdot r}\bigg|^{2}}{\displaystyle\int {\rm d}^{4}rS(r,k_1){\rm d}^{4}rS(r,k_2)}. \end{eqnarray} $

(1) $ S(r,k) $ denotes the emission function. The momenta of the two bosons are denoted by$ k_1 $ and$ k_2 $ , respectively. Additionally,$ {\bf{q}} = {\bf{k}}_1-{\bf{k}}_2 $ and$ {\bf{K}} = ({\bf{k}}_1+{\bf{k}}_2)/2 $ are the relative and pair momentum of two identical bosons. For cylinder expansion sources, the emission function can be represented as [17, 18]$ \begin{aligned}[b] S(r,k) =\;& M_T\cosh(\eta-Y)f(r,k)\\ &\times\exp\left(-\frac{r_T^2}{2R_g^2}-\frac{\eta^2}{2(\delta\eta)^2}\right)\delta(\tau-\tau_0). \end{aligned} $

(2) Here,
$ M_T = \sqrt{m^2+k_T^2} $ is the transverse mass, where m and$ k_T = \sqrt{k_x^2+k_y^2} $ are the mass and the transverse momentum of boson in a vacuum, respectively. Y is the rapidity of the boson.$ r_T = \sqrt{x^2+y^2} $ and$ \eta = \dfrac{1}{2}\ln[(t+z)/ (t-z)] $ are the transverse coordinate and the space-time rapidity, respectively.$ R_g $ and$ \delta\eta $ are the parameters that govern the width of the transverse distribution and the width of the space-time rapidity distribution, respectively.$ \tau = \sqrt{t^2-z^2} $ is the proper time. In this study, it is assumed that the bosons freeze-out at a constant proper time$ \tau_0 $ .$ f(r,k) $ is the momentum distribution of the bosons at the freeze-out point r. When the squeezing effect is not taken into account, the boson$ f(r,k) $ is [17, 18]$ \begin{equation} f(r,k) = \frac{1}{\exp[k^{\mu}u_{\mu}(r)/T]-1}. \end{equation} $

(3) $ k^{\mu}=(E_{{\bf{k}}}=\sqrt{{\bf{k}}^2+m^2},{{\bf{k}}}) $ is the four-momentum of the boson. T is the freeze-out temperature of the boson.$ u_{\mu}(r) $ is the four-velocity, which was assumed as [17, 18]$ \begin{eqnarray} u_{\mu}(r) = (\cosh\eta\cosh\eta_T,\sinh\eta_T \vec{e}_T,\sinh\eta\cosh\eta_T), \end{eqnarray} $

(4) Here,
$ \vec{e}_T = (x/r_T,y/r_T) $ . The transverse flow rapidity, denoted as$ \eta_T $ , is defined as [18]$ \begin{equation} \begin{cases} \eta_T= \eta_{T{\rm max}}\dfrac{r_T}{R_G} \,\,\,\,\,\,\,\,\,\, r_T<R_G,\\ \eta_T= \eta_{T{\rm max}} \,\,\,\,\,\,\,\,\,\,\,\,\,\,\,\,\,\, r_T\geq R_G. \end{cases} \end{equation} $

(5) The value of
$ \eta_{T{\rm max}} $ is calculated using$ \eta_{T{\rm max}} = $ $ \dfrac{1}{2}\ln\left(\dfrac{1+\beta}{1-\beta}\right) $ , where β is a parameter.When the squeezing effect is considered,
$ f(r,k) $ becomes [1−10, 16]$ \begin{equation} f(r,k) = |c_{{\bf{k}}'}|^2\,n_{{\bf{k}}'}+\,|s_{-{\bf{k}}'}|^2\,(\,n_{-{\bf{k}}'}+1), \end{equation} $

(6) $ \begin{equation} c_{{\bf{k}}'}=\cosh[\,r_{{\bf{k}}'}\,], \,\,\,s_{{\bf{k}}'}=\sinh[\,r_{{\bf{k}}'}\,], \end{equation} $

(7) $ \begin{eqnarray} r_{{\bf{k}}'}=\frac{1}{2} \log \left[E_{{\bf{k}}'}/\varepsilon_{{\bf{k}}'}\right], \end{eqnarray} $

(8) $ \begin{eqnarray} E_{{\bf{k}}'}(r)=\sqrt{{\bf{k}}'^2(r)+m^2}=k^{\mu} u_{\mu}(r), \end{eqnarray} $

(9) $ \varepsilon_{{\bf{k}}'}(r)=\sqrt{{\bf{k}}'^2(r)+m_*^2} =\sqrt{[E_{{\bf{k}}'}(r)]^2-m^2+m_*^2}, $

(10) $ \begin{equation} n_{{\bf{k}}'}=\frac{1}{\exp(\varepsilon_{{\bf{k}}'}(r)/T)-1}. \end{equation} $

(11) Here,
$ {\bf{k}}' $ denotes the local-frame momentum corresponding to$ {\bf{k}} $ , while$ m_* $ refers to the mass of the boson in the source medium. When$ m_* = $ m, it means there is no change in mass in the medium, causing$ f(r,k) $ in Eq. (6) to be equal to$ f(r,k) $ in Eq. (3). This condition, where$ m_* = $ m, also implies that the squeezing effect is not considered in the calculations.The Gaussian form of the HBT correlation function can be expressed as [18]:
$ \begin{equation} C({\bf{q}},{\bf{K}}) = 1+\lambda\exp[-q^2_oR^2_o({\bf{K}})-q^2_sR^2_s({\bf{K}})-q^2_lR^2_l({\bf{K}})], \end{equation} $

(12) Here, λ represents the coherence parameter.
$ q_l $ is the spatial component of$ {\bf{q}} $ in the beam direction ("longitudinal" direction), while$ q_o $ and$ q_s $ are the spatial components of$ {\bf{q}} $ parallel to the transverse component$ {\bf{K}}_T $ of$ {\bf{K}} $ ("out" direction) and perpendicular to the transverse component$ {\bf{K}}_T $ ("side" direction), respectively.$ R^2_o $ ,$ R^2_s $ , and$ R^2_l $ were expressed as [17, 18]$ \begin{eqnarray} R_o^2 = \langle(r_o-\beta_o t)^2\rangle - \langle r_o-\beta_o t\rangle^2, \end{eqnarray} $

(13) $ \begin{eqnarray} R_s^2 = \langle r_s^2\rangle, \end{eqnarray} $

(14) $ \begin{eqnarray} R_l^2 = \langle(r_l-\beta_l t)^2\rangle - \langle r_l-\beta_l t\rangle^2, \end{eqnarray} $

(15) $ \begin{eqnarray} \beta_i = \frac{2K_i}{E_1+E_2} \approx \frac{K_i}{E_K}. \end{eqnarray} $

(16) Here, the average notation is defined as
$ \begin{eqnarray} \langle\zeta\rangle = \frac{\displaystyle\int {\rm d}^{4}r\zeta S(r,K)}{\displaystyle\int {\rm d}^{4}rS(r,K)}. \end{eqnarray} $

(17) -
In this section, the impact of the squeezing effect on the three-dimensional HBT radii of ϕϕ,
$ D^0 $ $ D^0 $ , and$ K^+ $ $ K^+ $ is shown. In the calculations, the parameters$ R_G $ and$ \delta\eta $ are considered to be 6 fm and 3.0 [18], respectively, representing the transverse width and the space-time rapidity width of the source. The parameter$ \tau_0 $ is taken to be 10 fm/c [18]. The transverse expansion velocity of the source is determined by the parameter β and is set to 0, 0.3, and 0.5.The masses of the particles ϕ,
$ D^0 $ , and$ K^+ $ in a vacuum, represented by m, are known to be 1.01946 GeV, 1.86484 GeV, and 0.49368 GeV [76], respectively. The mass modification in a medium is represented by$ \delta m $ , where$ \delta m = m-m_* $ . If$ \delta m = 0 $ , this indicates that the squeezing effect is not considered in the calculations. In the pionic medium, it is anticipated that the masses of the particles ϕ,$ D^0 $ , and$ K^+ $ will decrease [66, 70]. Thus,$ \delta m $ is assumed to be greater than 0. The freeze-out temperature for the ϕ meson is considered to be 0.14 GeV [9, 16], with a comparative analysis performed for 0.15 GeV. The freeze-out temperature for the$ D^0 $ meson is set to 0.14 GeV and 0.15 GeV, and the freeze-out temperature for the$ K^+ $ meson is similarly set to 0.14 GeV and 0.15 GeV. The rapidity Y is considered to be within the range of$ (-1,1) $ , except in the longitudinally co-moving system (LCMS) shown in Figs. 3, 7, and 11. In the LCMS, Y = 0 [3, 17].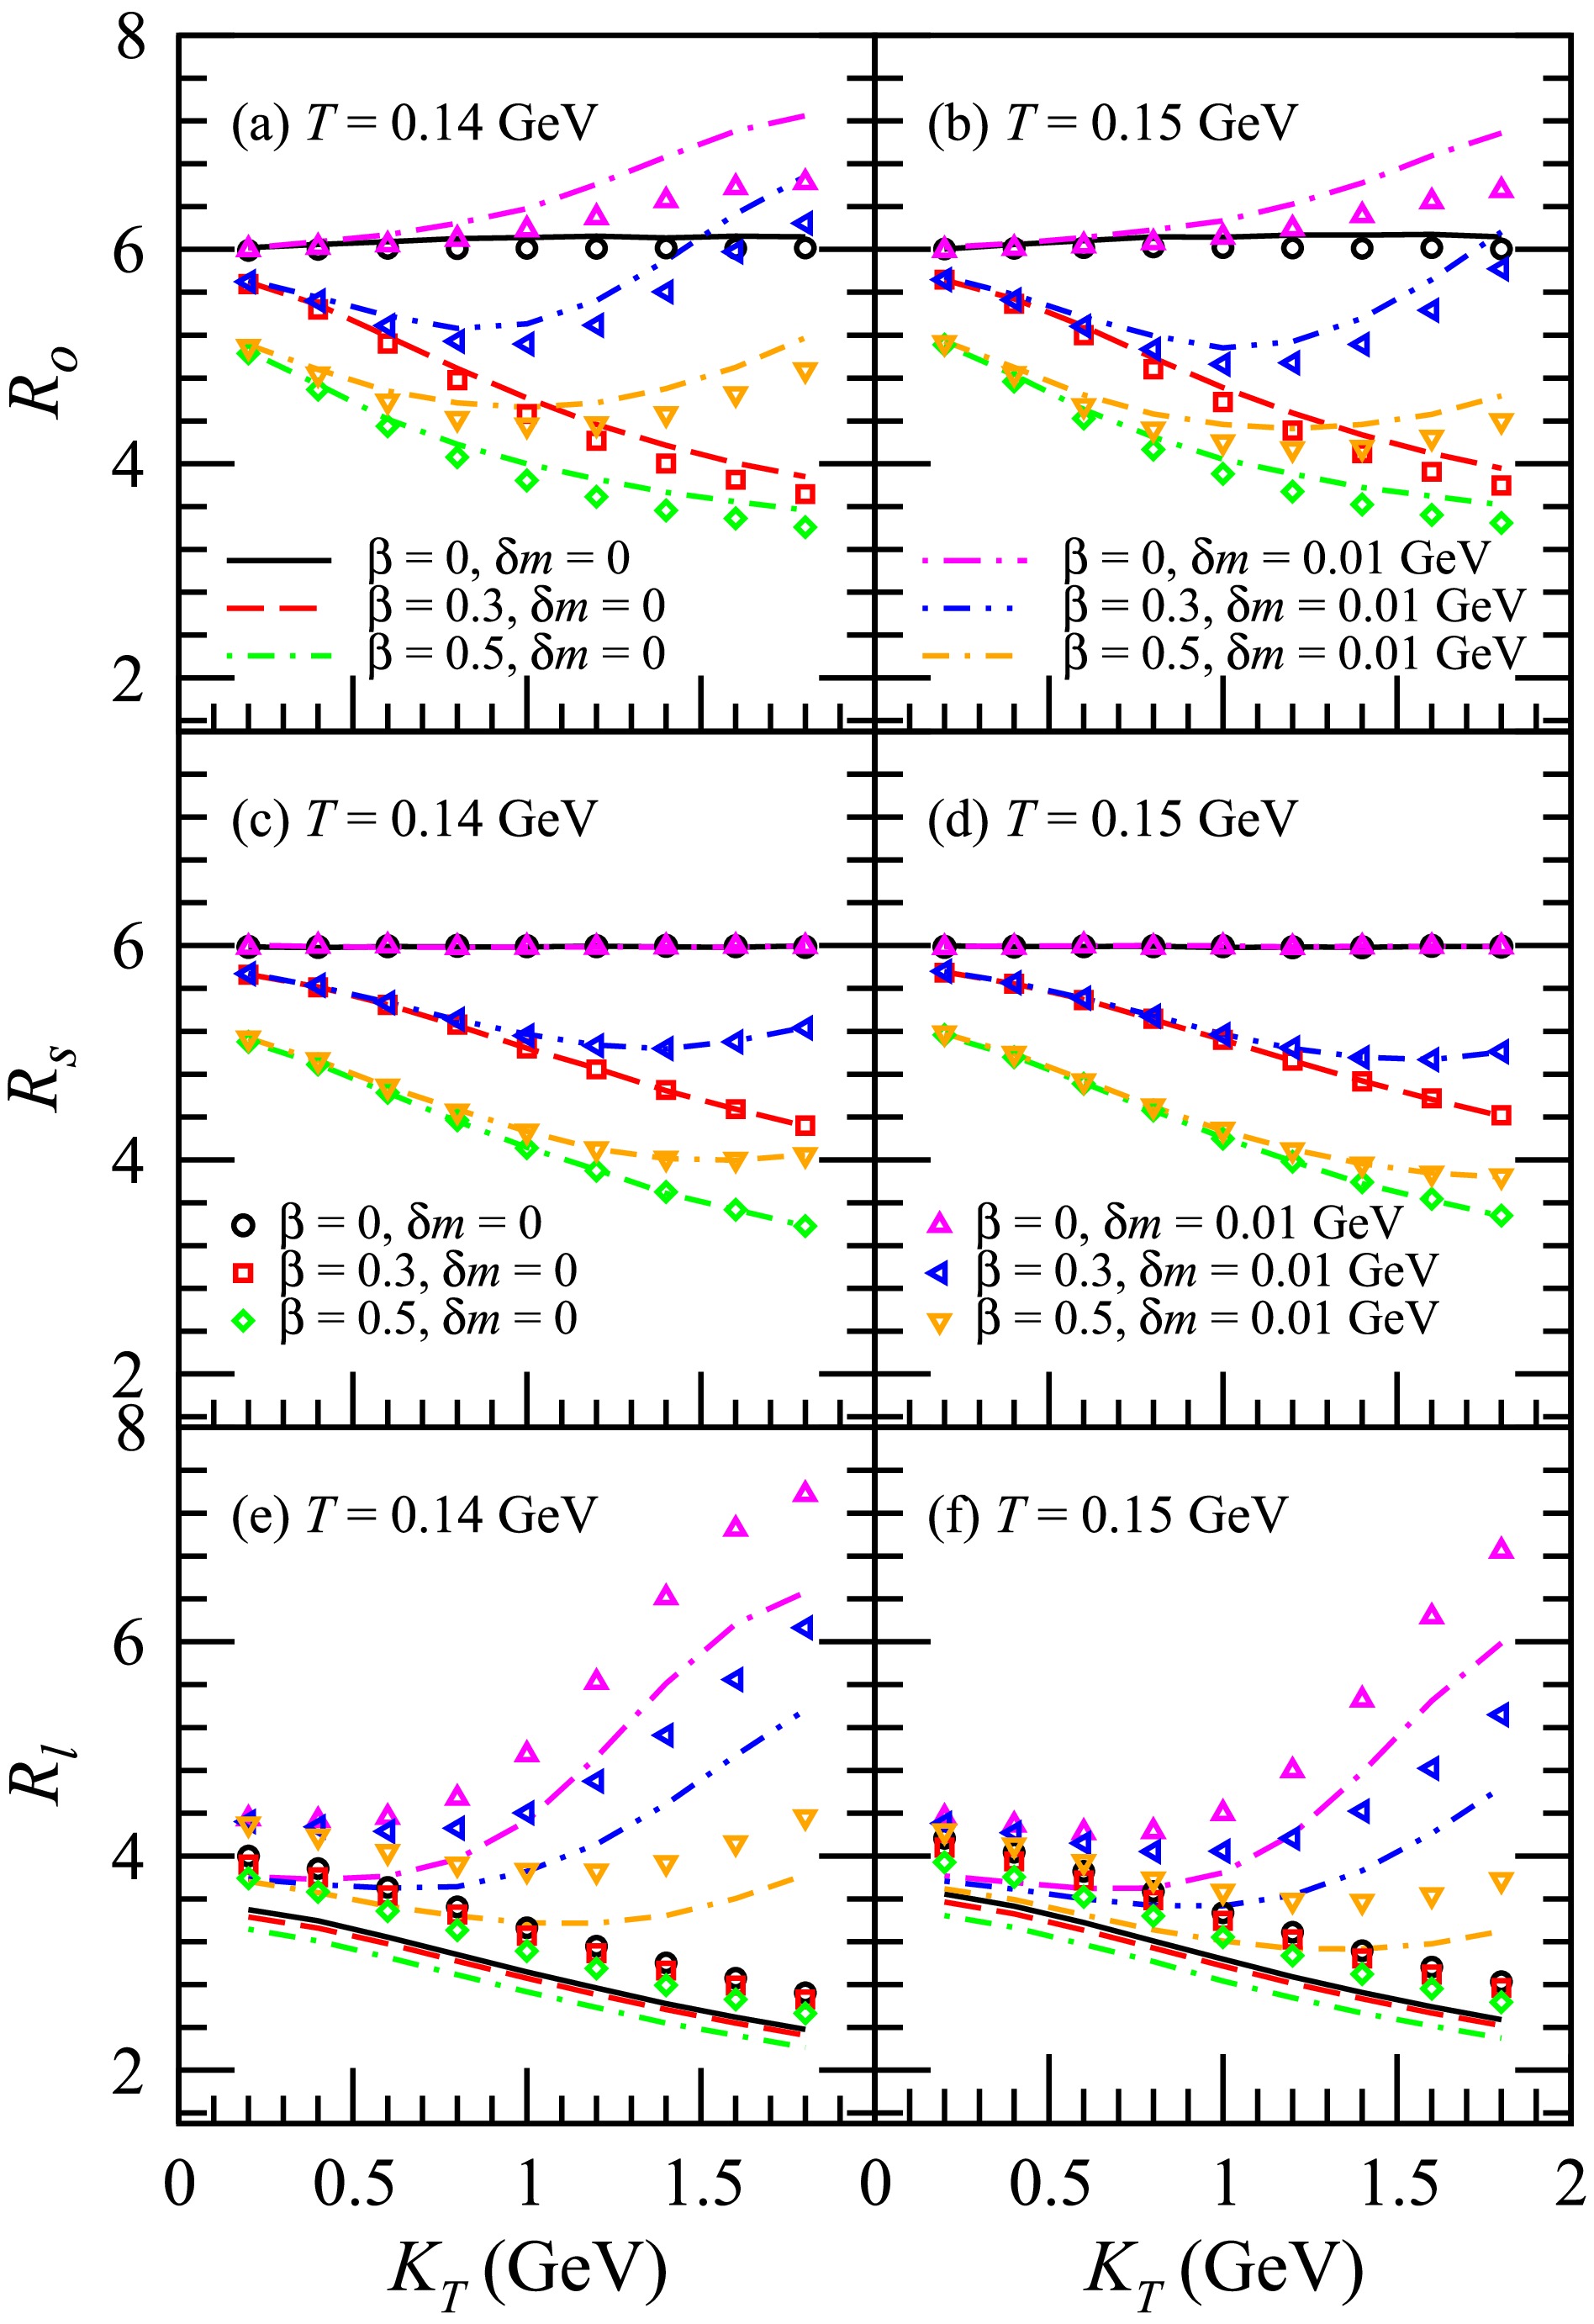
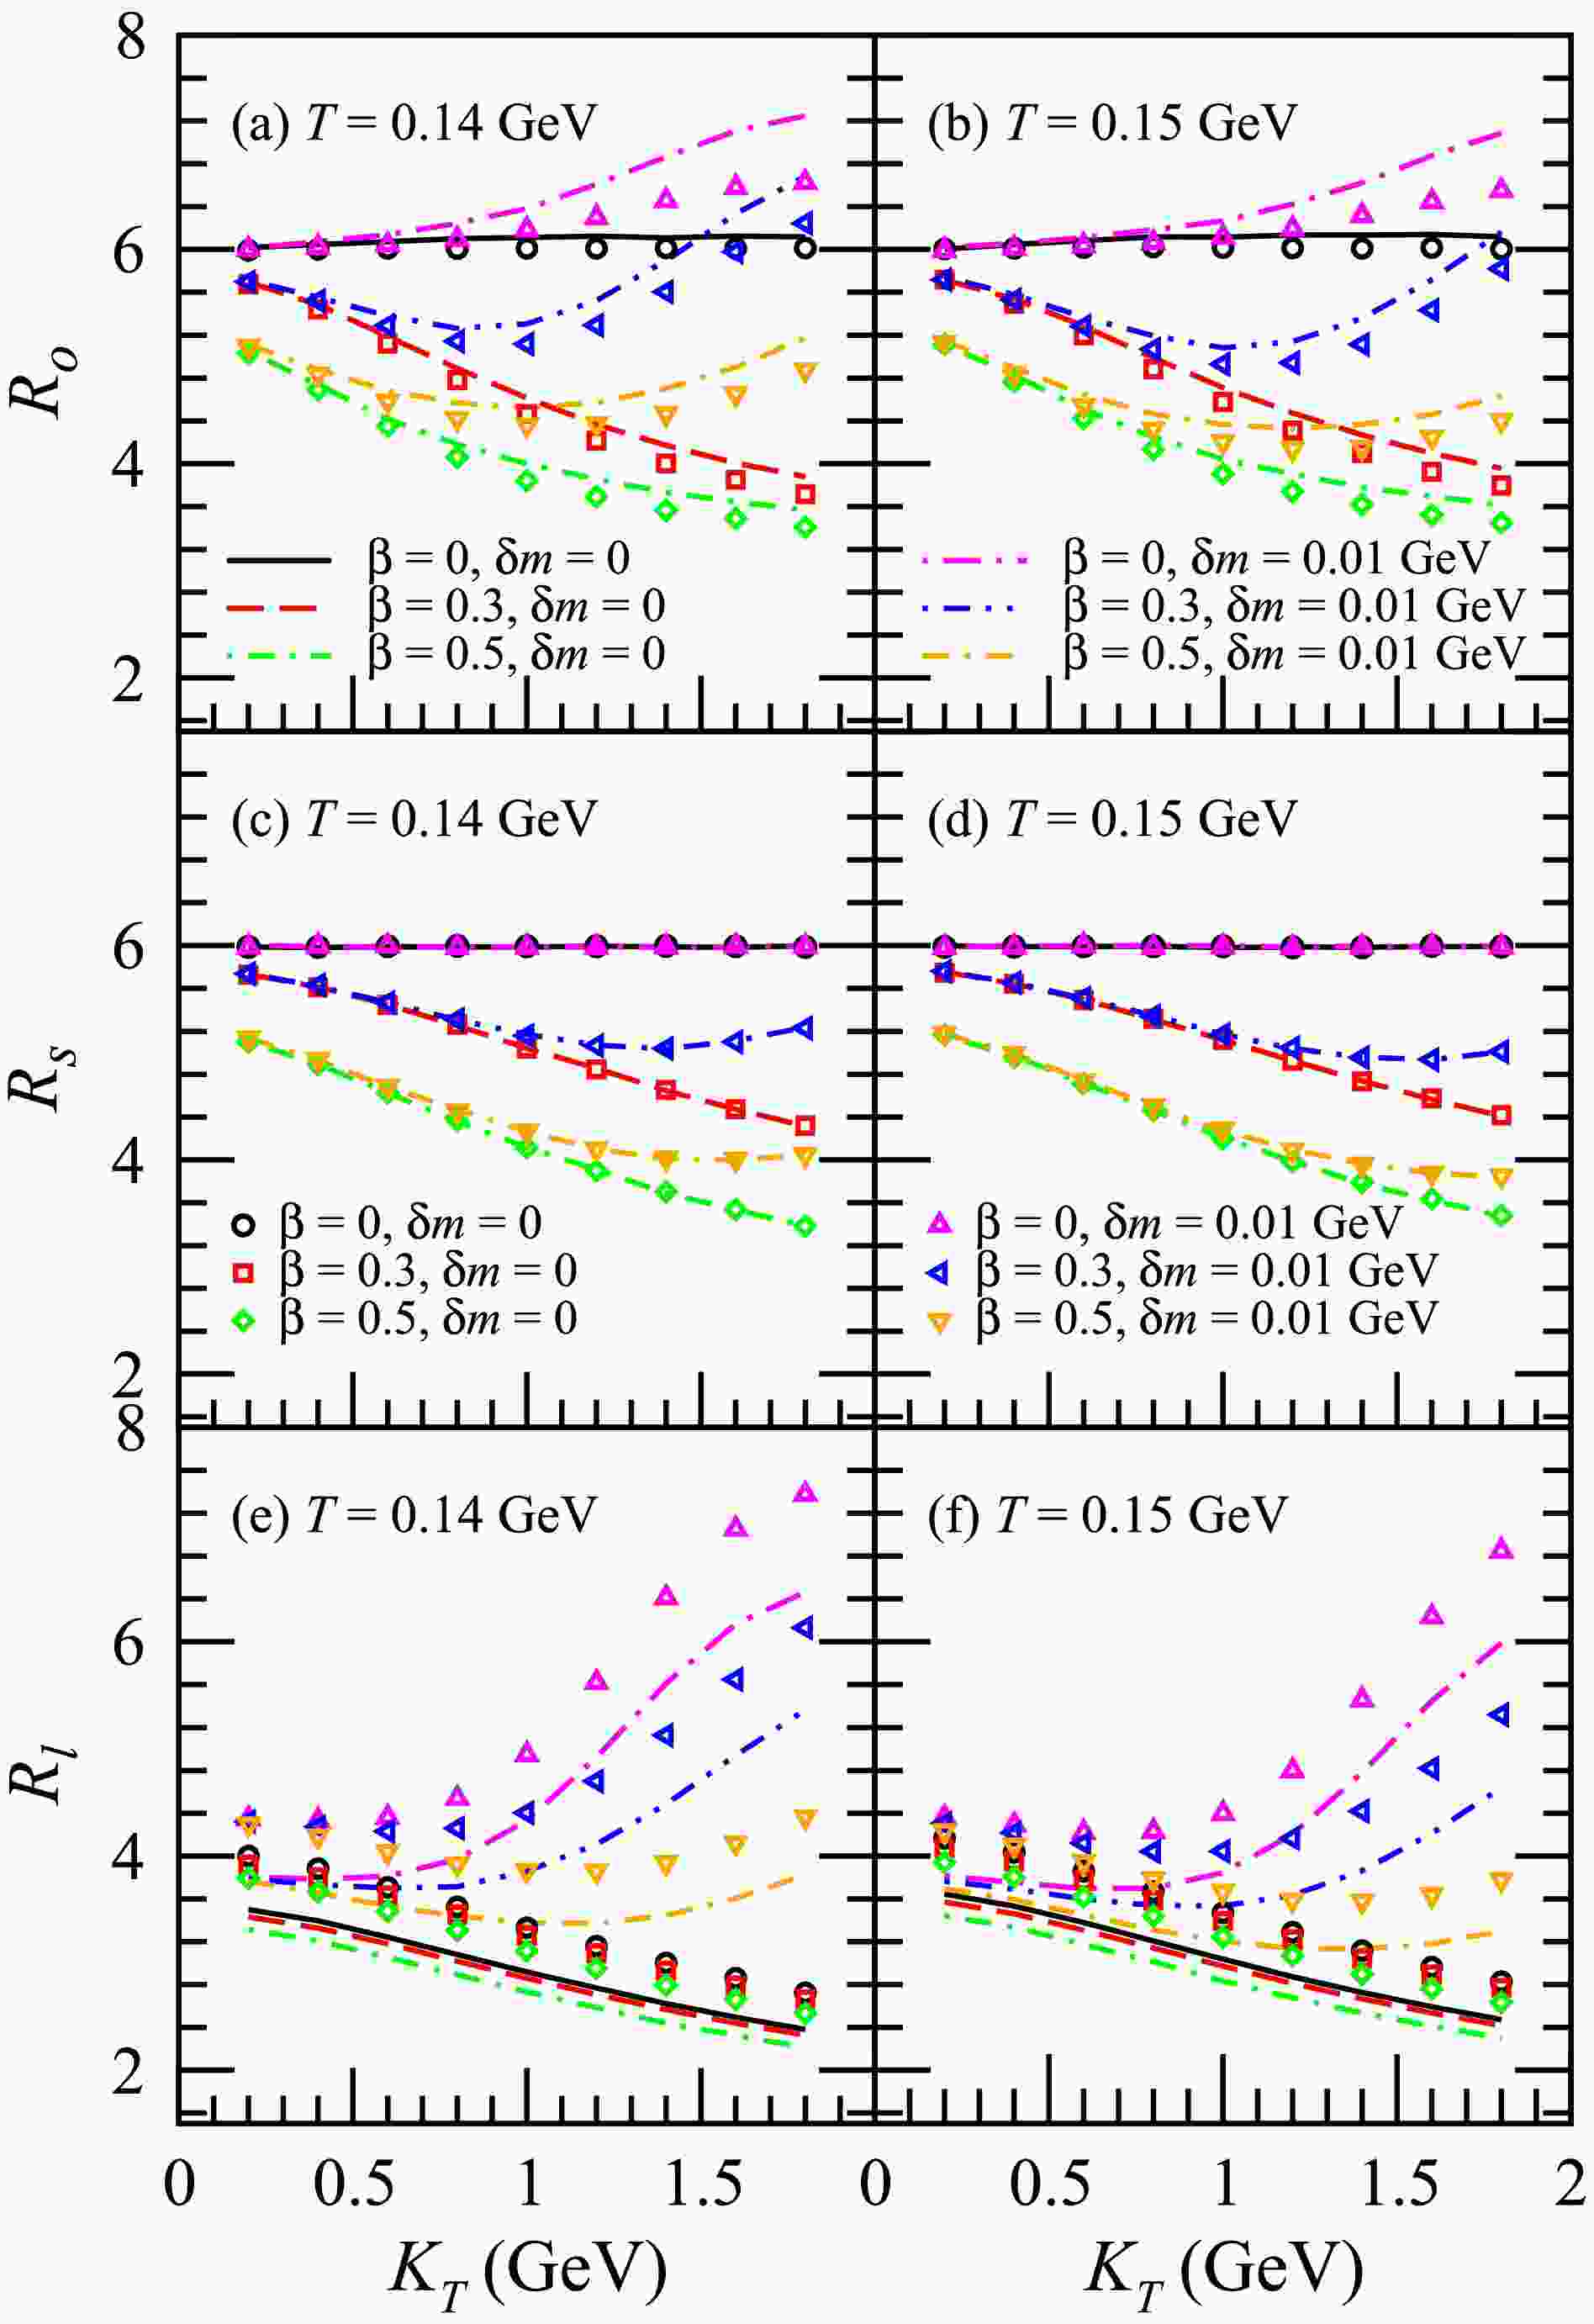
Figure 3. (color online) HBT radii
$ R_o $ ,$ R_s $ , and$ R_l $ of ϕϕ with respect to the transverse pair momentum$ K_T $ . The plots illustrate the results of$ R_o $ in (a) and (b),$ R_s $ in (c) and (d), and$ R_l $ in (e) and (f). The lines represent the results for Y within the range of$ (-1,1) $ , while the symbols denote the results calculated in the LCMS.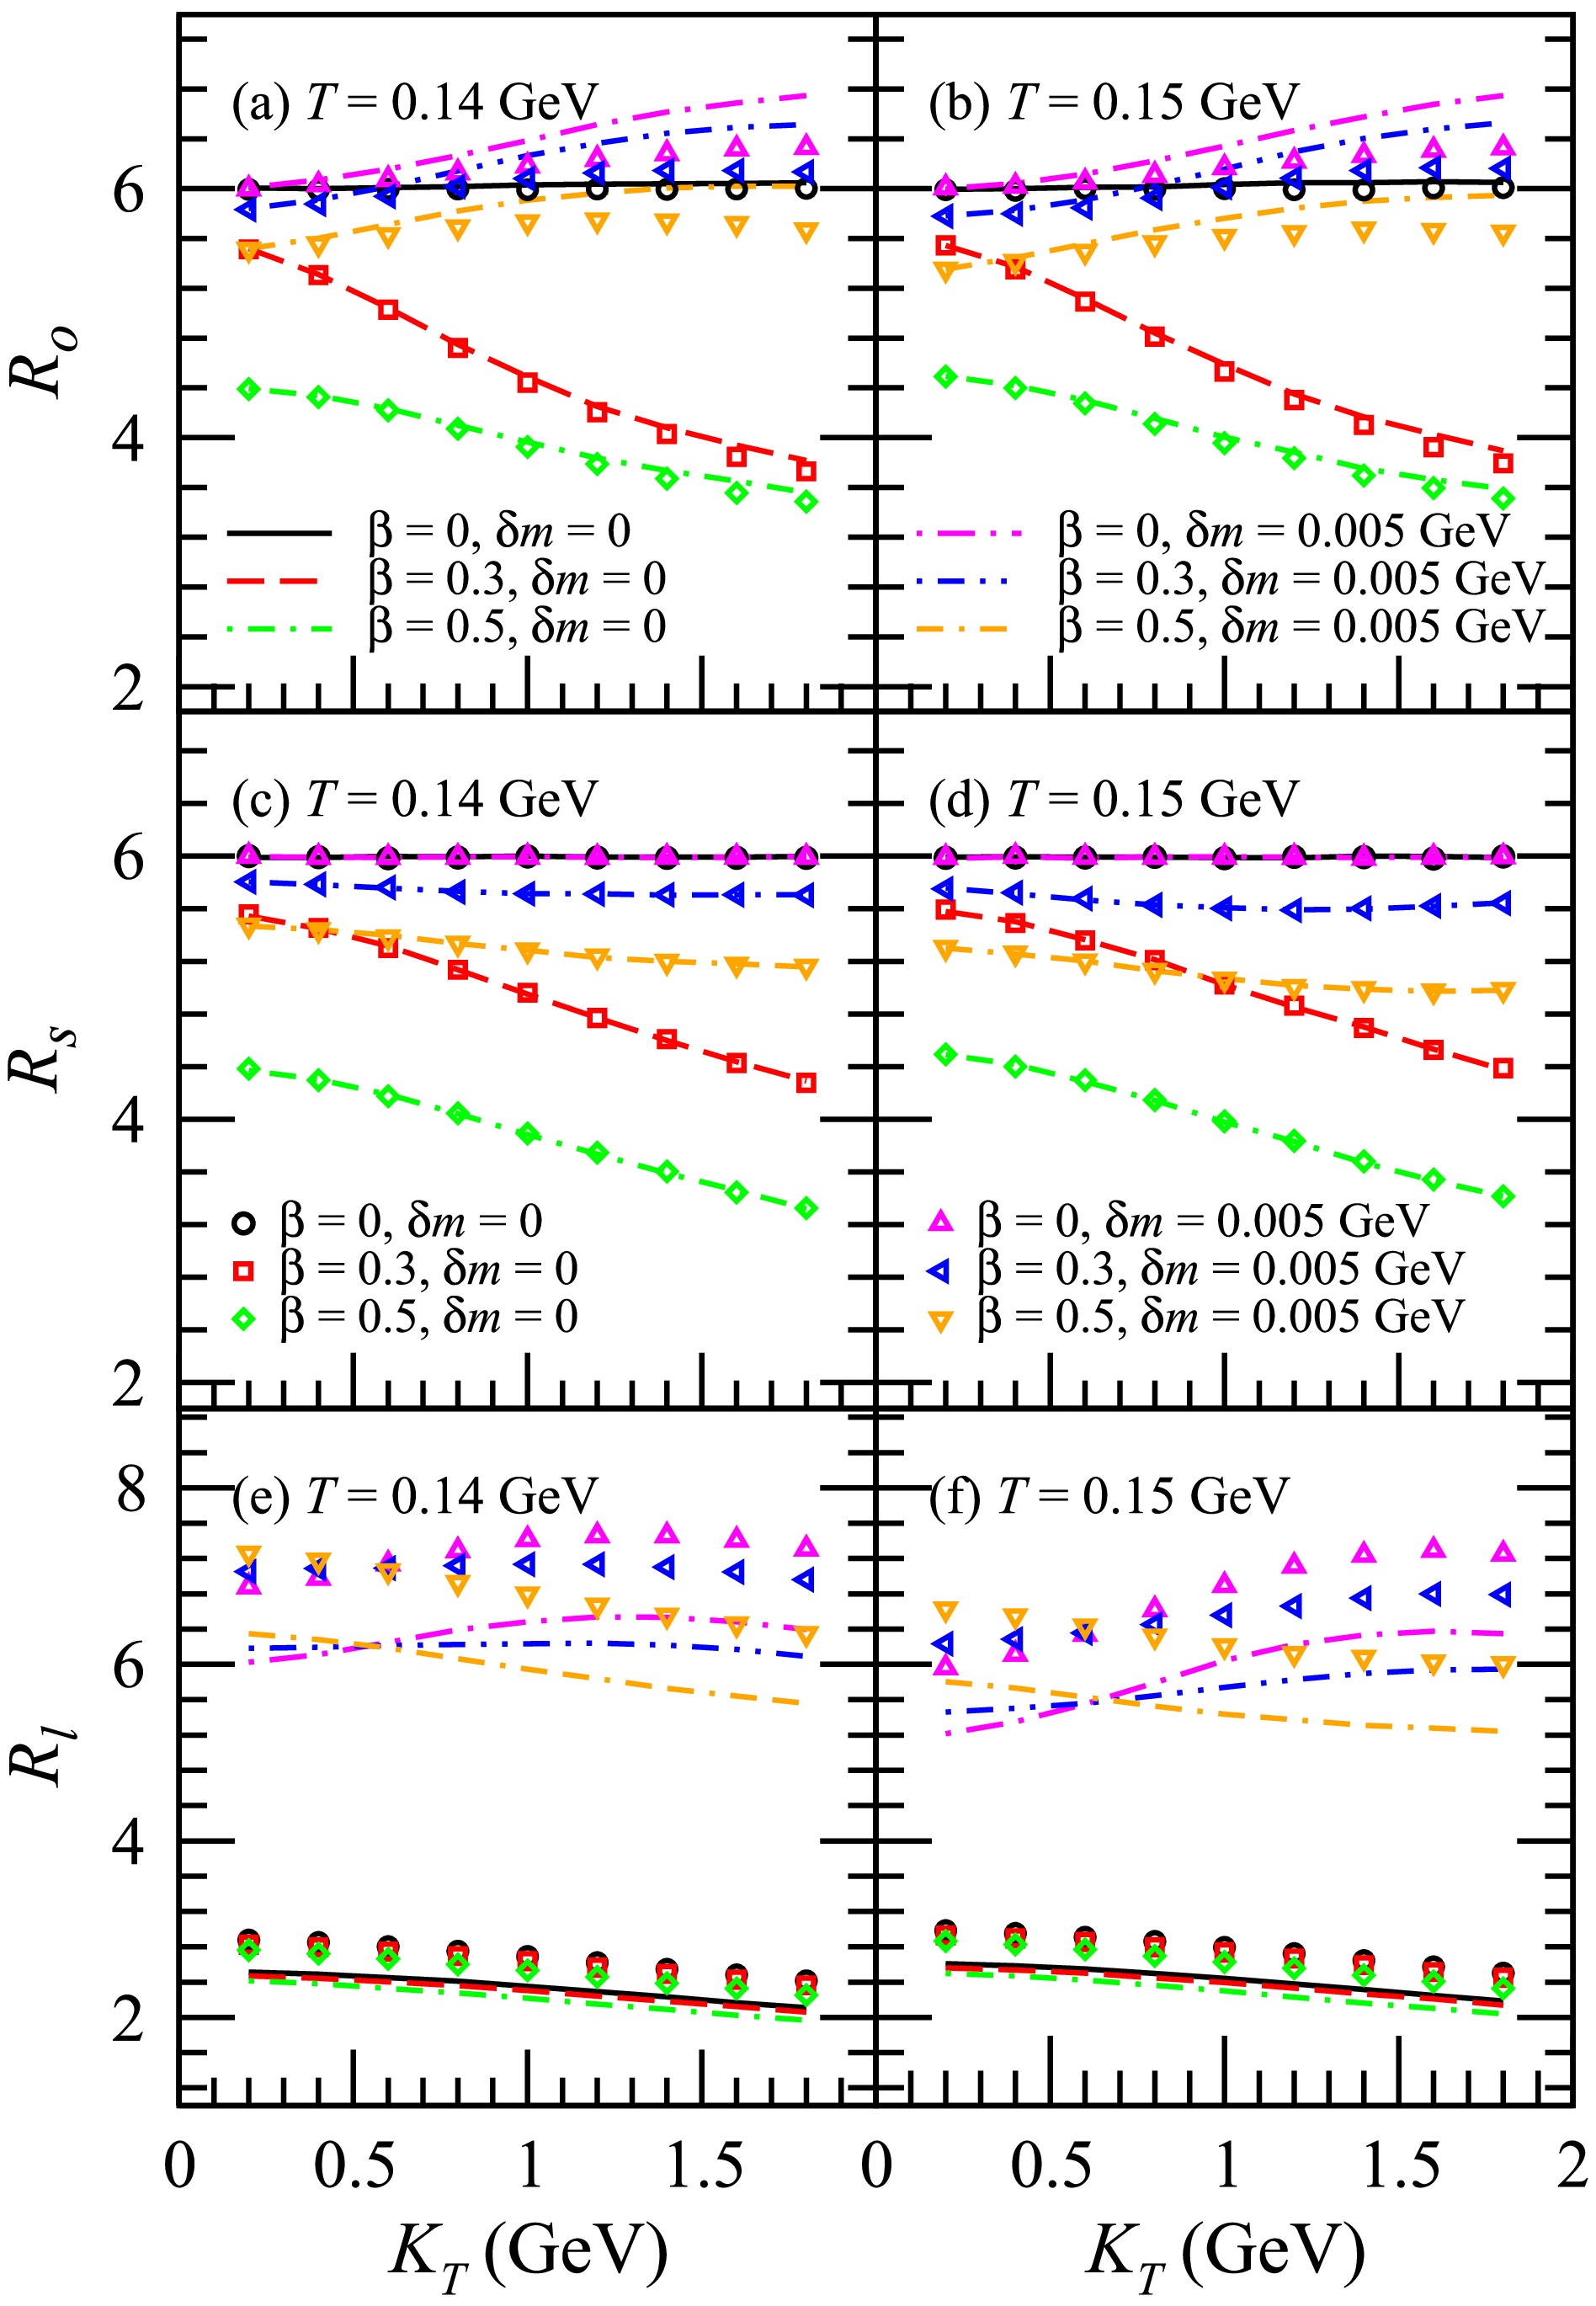
Figure 7. (color online) HBT radii
$ R_o $ ,$ R_s $ , and$ R_l $ of$ D^0 $ $ D^0 $ with respect to the transverse pair momentum$ K_T $ . The plots illustrate the results of$ R_o $ in (a) and (b),$ R_s $ in (c) and (d), and$ R_l $ in (e) and (f). The lines represent the results for Y within the range of$ (-1,1) $ , while the symbols denote the results calculated in the LCMS.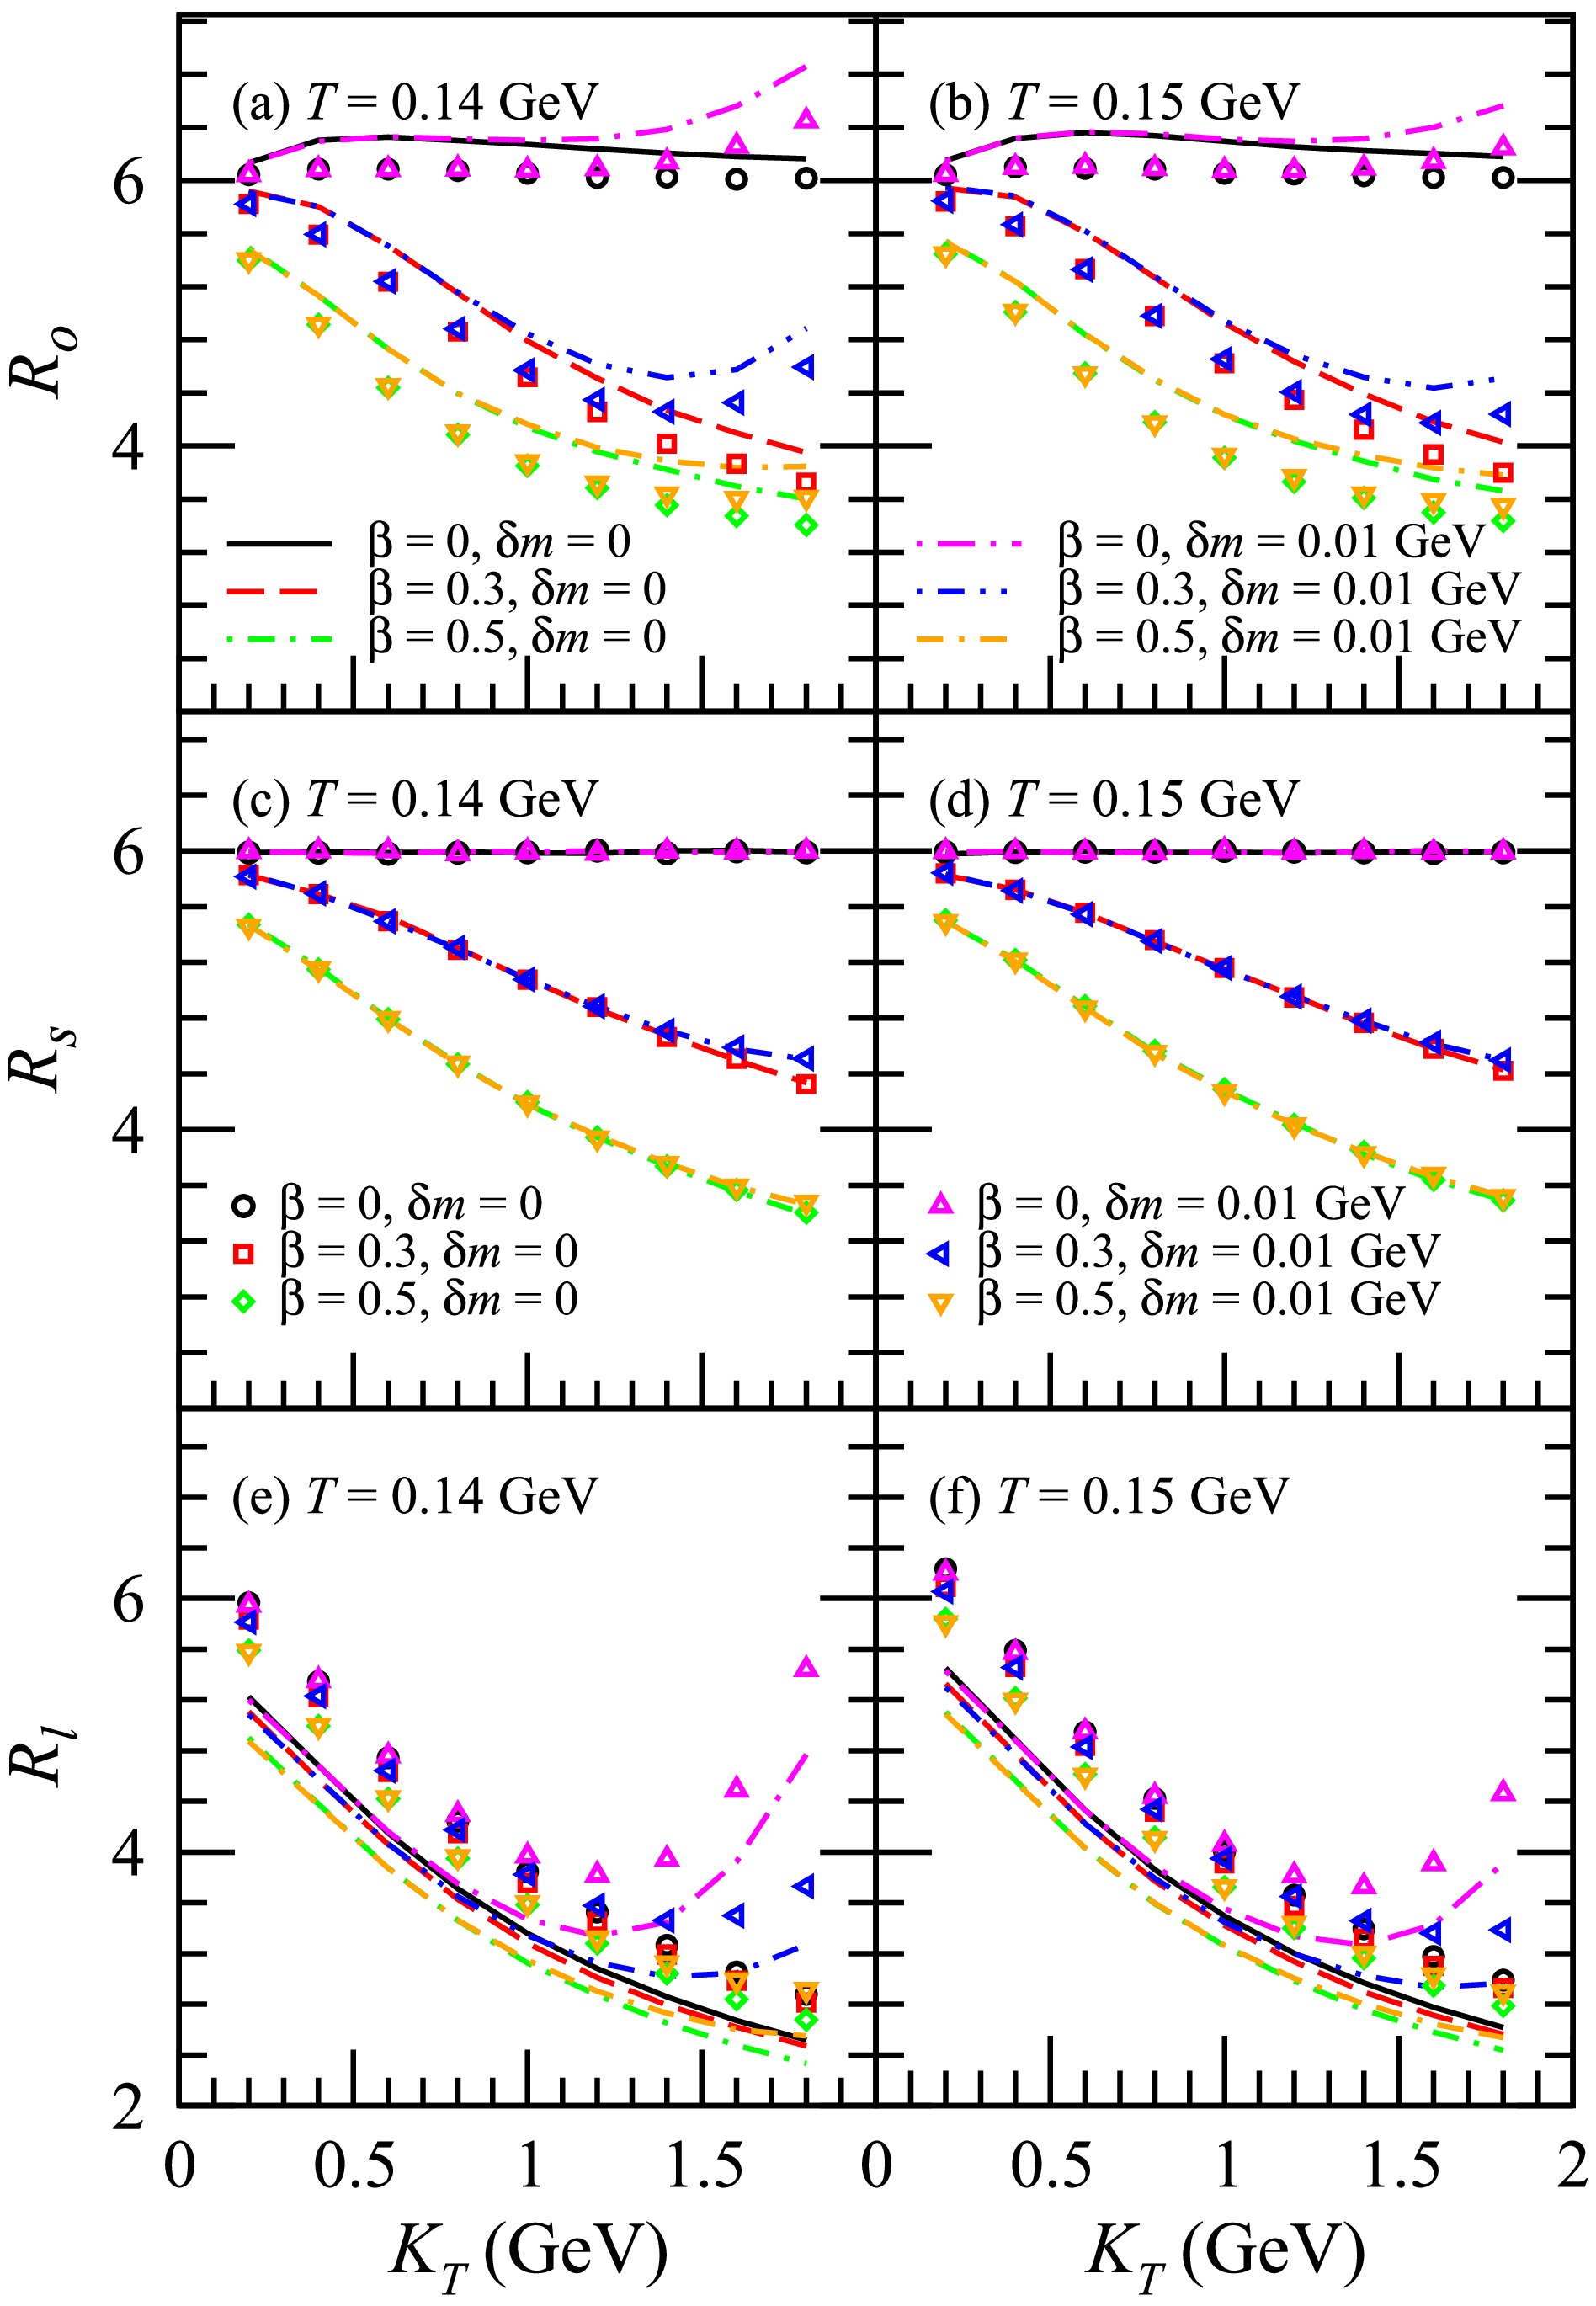
Figure 11. (color online) HBT radii
$ R_o $ ,$ R_s $ , and$ R_l $ of$ K^+ $ $ K^+ $ with respect to the transverse pair momentum$ K_T $ . The plots illustrate the results of$ R_o $ in (a) and (b),$ R_s $ in (c) and (d), and$ R_l $ in (e) and (f). The lines represent the results for Y within the range of$ (-1,1) $ , while the symbols denote the results calculated in the LCMS. -
In Fig. 1, the normalized distributions of the transverse coordinate of the ϕ emission sources are shown for
$ k_T $ values of 0.5 GeV and 1.5 GeV. Here, T = 0.14 GeV in plots (a) and (b) and T = 0.15 GeV in plots (c) and (d).$ \beta = 0 $ indicates that velocity expansion is absent in the transverse plane and that the transverse source distributions for$ k_T $ = 1.5 GeV are identical to those for$ k_T $ = 0.5 GeV. When the squeezing effect is not considered ($ \delta m = 0 $ ), the transverse flow leads to a shift in the transverse source distributions for$ k_T $ = 0.5 GeV toward a smaller transverse coordinate$ r_T $ . However, in the transverse source distributions for$ k_T $ = 1.5 GeV, it leads to a shift toward a larger transverse coordinate$ r_T $ . This occurs because particles with low transverse momentum are more likely to be produced in greater quantities at lower transverse velocities, while locations with higher transverse velocities tend to generate more high transverse momentum particles. In the model discussed in this paper, the transverse flow increases as the transverse coordinate$ r_T $ increases. With the increase in transverse velocity, this phenomenon becomes more pronounced. This phenomenon is slighlty more pronounced for$ T = 0.14 $ GeV than for$ T = 0.15 $ GeV. The mass of the ϕ meson is expected to decrease around 0.01 GeV in the pionic medium [70]. When considering the squeezing effect, the$ \delta m $ for a ϕ meson is taken as 0.01 GeV, as in Figs. 1−3. For$ \beta = 0 $ , the squeezing effect does not affect the transverse source distribution. However, for$ \beta > 0 $ , the squeezing effect reduces the influence of transverse flow on the transverse source distribution at$ k_T $ = 1.5 GeV while having no impact at$ k_T $ = 0.5 GeV. This phenomenon is more pronounced for T = 0.14 GeV.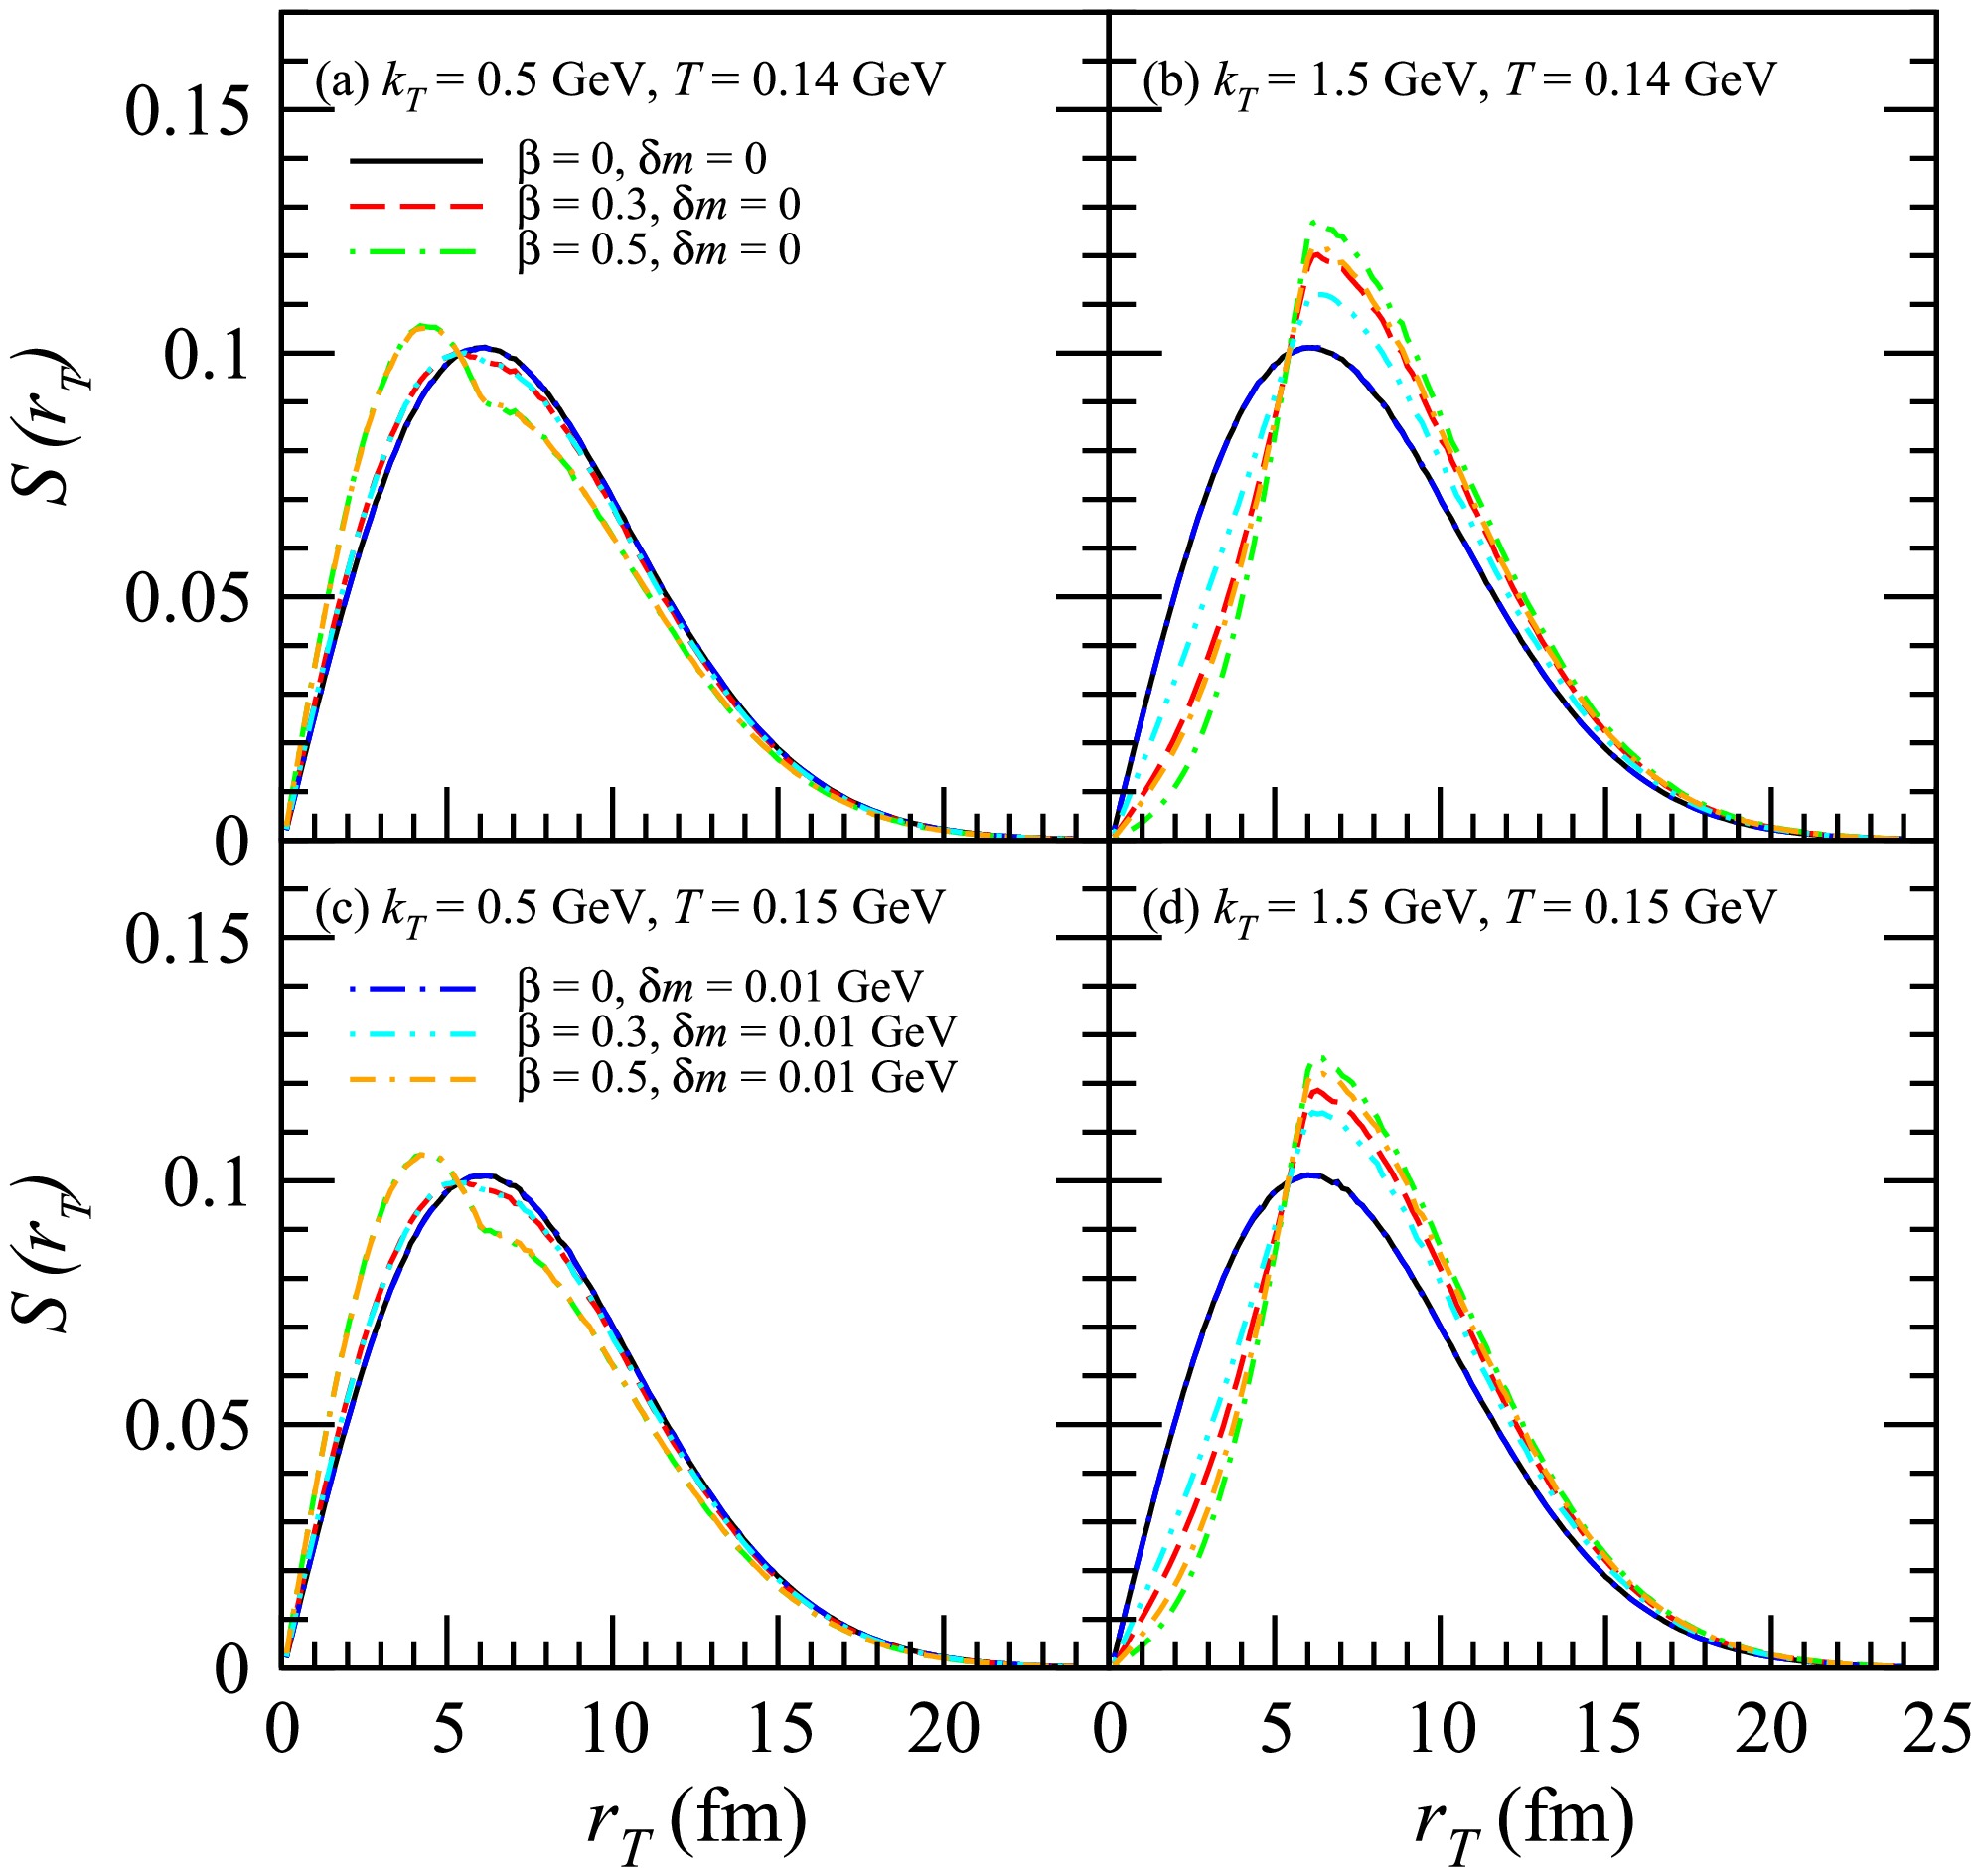
Figure 1. (color online) Normalized distributions of the transverse coordinate of the ϕ emission sources for
$ k_T $ = 0.5 GeV and 1.5 GeV. Here, T = 0.14 GeV in plots (a) and (b) andT = 0.15 GeV in plots (c) and (d).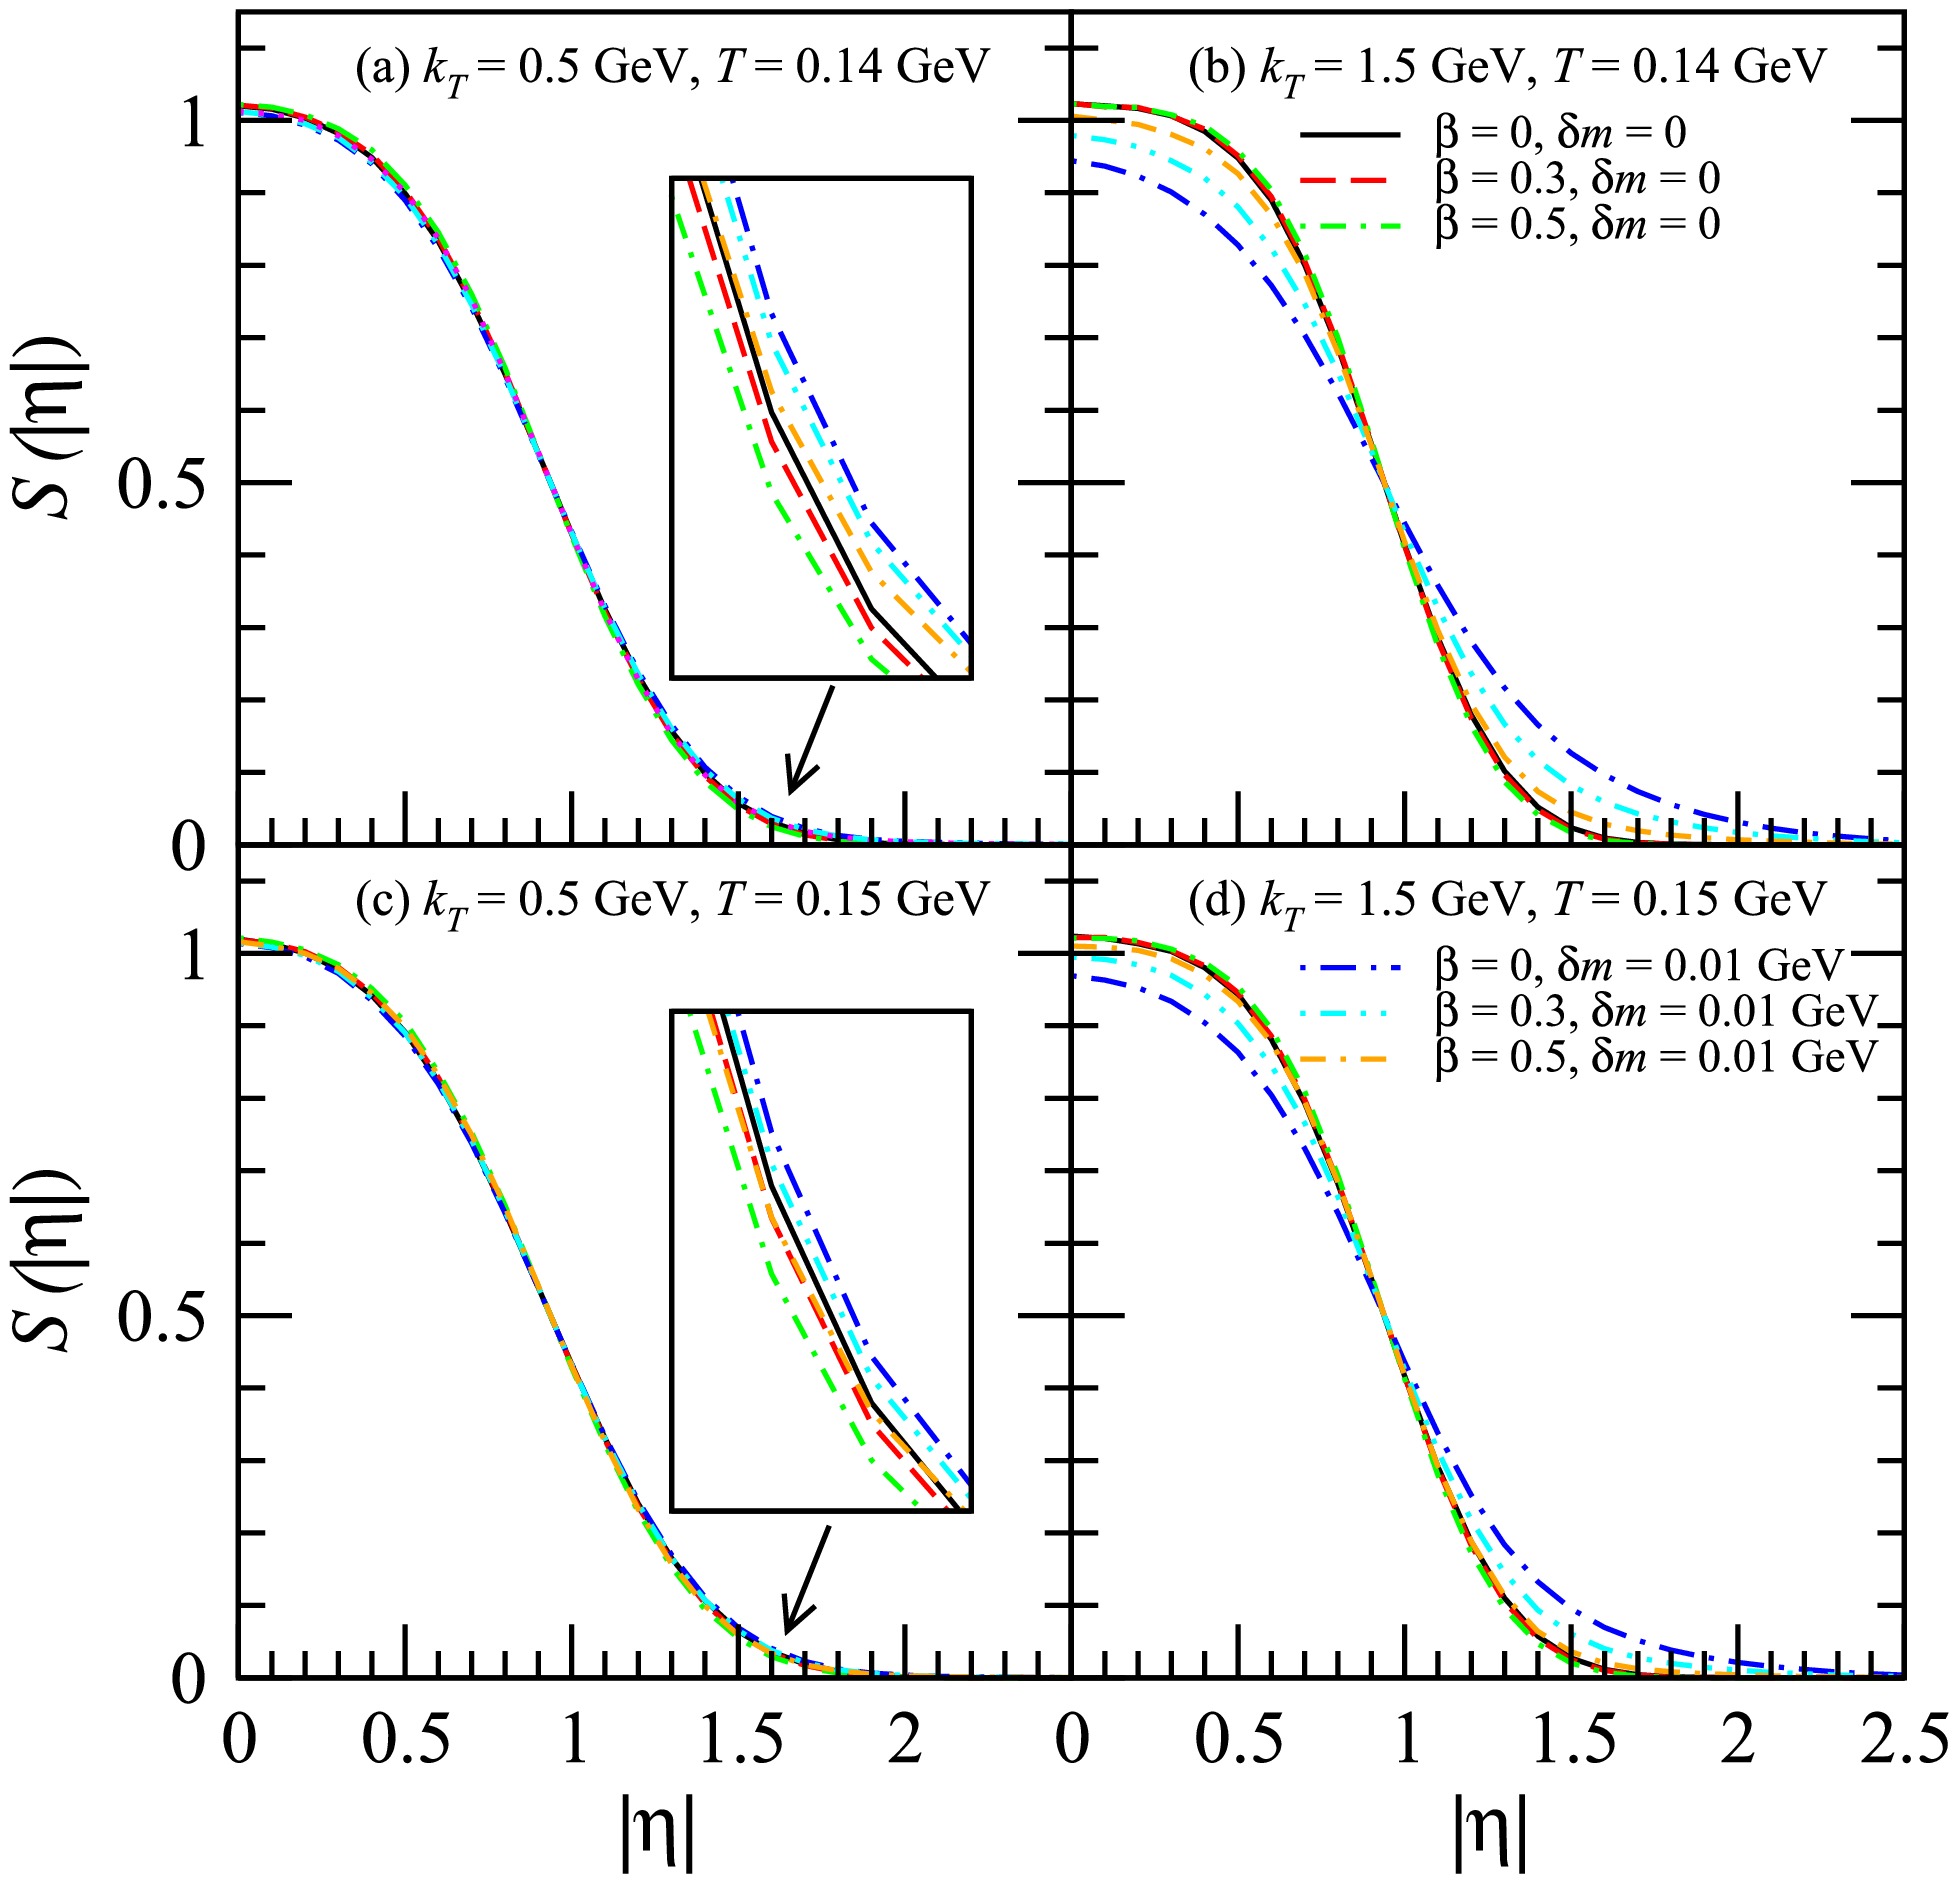
Figure 2. (color online) Normalized distributions of
$ |\eta| $ for the ϕ emission sources at$ k_T $ = 0.5 GeV and 1.5 GeV.In Fig. 2, the normalized distributions of
$ |\eta| $ for the ϕ emission sources for$ k_T $ = 0.5 GeV and 1.5 GeV are shown. Here, η is the space-time rapidity. For$ \delta m = 0 $ , the transverse flow reduces both the width of the temporal distribution and the width of the longitudinal distribution of the sources. The squeezing effect leads to the widening of the source space-time rapidity distribution, which is more obvious for$ k_T $ = 1.5 GeV. This phenomenon is more pronounced for lower transverse flow or smaller freeze-out temperatures.For the discussed model,
$ t = \tau\cosh\eta $ and$ z = \tau\sinh\eta $ . Therefore, by reducing the width of the source space-time rapidity distribution, the transverse flow reduces the width of the temporal distribution of the longitudinal distribution. However, the squeezing effect leads to the widening of the source space-time rapidity distribution, which results in an expansion of both the temporal distribution and the longitudinal distribution of the source.Figure 3 shows the HBT radii
$ R_o $ ,$ R_s $ , and$ R_l $ of ϕϕ with respect to the transverse pair momentum$ K_T $ . The plots illustrate the results of$ R_o $ in (a) and (b),$ R_s $ in (c) and (d), and$ R_l $ in (e) and (f). The lines represent the results for Y within the range$ (-1,1) $ , while the symbols denote the results calculated in the LCMS. In this paragraph, the results for Y in the range$ (-1,1) $ are discussed first, followed by a discussion of the differences between these results and those obtained in the LCMS. The value of$ R_o $ is related to the temporal and transverse spatial distribution of the source. When the squeezing effect is not considered ($ \delta m = 0 $ ), the transverse flow causes a reduction in the transverse spatial distribution width, particularly for large$ K_T $ (see Fig. 1). Furthermore, the transverse flow slightly diminishes the width of the source space-time rapidity distribution (see Fig. 2), leading to a decrease in the width of the source temporal distribution. Therefore, under the influence of the transverse flow,$ R_o $ decreases as$ K_T $ increases for$ \beta > 0 $ . The squeezing effect reduces the influence of transverse flow on the transverse source distribution for large$ k_T $ (see Fig. 1 (b) and (d)) while having no impact for small$ k_T $ (see Fig. 1 (a) and (c)). Moreover, the squeezing effect results in the widening of the source space-time rapidity distribution, consequently expanding the temporal distribution of the source, particularly for large$ k_T $ (see Fig. 2). As a result, the squeezing effect leads to an increase in$ R_o $ , which is more pronounced at high$ K_T $ values. The value of$ R_s $ is only related to the transverse spatial distribution of the source. When$ \beta = 0 $ , the squeezing effect has no impact on the transverse source distribution (see Fig. 1), thus not influencing$ R_s $ either. For$ \beta > 0 $ , the squeezing effect leads to an increase in$ R_s $ , which is more pronounced at high$ K_T $ values. This outcome is due to the impact of the squeezing effect on the transverse source distribution. The value of$ R_l $ is related to the temporal and longitudinal spatial distribution of the source. The squeezing effect leads to the widening of the source space-time rapidity distribution, which results in an expansion of both the temporal distribution and the longitudinal distribution of the source. These effects are more pronounced for large$ k_T $ . Hence, the squeezing effect leads to an increase in$ R_l $ , which is more pronounced at high$ K_T $ values. The squeezing effect has a more significant impact on$ R_o $ and$ R_l $ than$ R_s $ . The squeezing effect has a slightly greater impact on$ R_o $ ,$ R_s $ , and$ R_l $ at$ T=0.14 $ GeV compared to$ T=0.15 $ GeV.$ R_o $ ,$ R_s $ , and$ R_l $ no longer monotonically decreasing with increasing$ K_T $ because the squeezing effect is more pronounced at high$ K_T $ is called the non-flow behavior of the HBT radii [16]. The$ R_o $ calculated in the LCMS is slightly lower than that calculated for Y in the range$ (-1,1) $ . Conversely, the$ R_s $ calculated in the LCMS is the same as that calculated for Y in the range$ (-1,1) $ . However, the$ R_l $ calculated in the LCMS is greater than that calculated for Y in the range$ (-1,1) $ . The impact of the squeezing effect on the HBT radii in the LCMS is similar to its impact on the HBT radii for Y in the range$ (-1,1) $ . When accounting for the squeezing effect, the difference between the values of$ R_o $ and$ R_l $ calculated in the LCMS and the values of$ R_o $ and$ R_l $ for Y within the range$ (-1,1) $ is greater than the difference observed without the squeezing effect.Figure 4 shows the HBT radii
$ R_o $ ,$ R_s $ , and$ R_l $ of ϕϕ with respect to the in-medium mass modification$ \delta m $ for$ K_T $ = 0.5 GeV and 1.5 GeV. When$ \beta = 0 $ , the squeezing effect does not affect$ R_s $ , which remains constant as$ \delta m $ increases. However, in other instances, as$ \delta m $ increases, the values of$ R_o $ ,$ R_s $ , and$ R_l $ increase before they reach a plateau, indicating a decreasing slope for the relationship between$ R_o $ ,$ R_s $ , and$ R_l $ and$ \delta m $ . Ultimately,$ R_o $ ,$ R_s $ , and$ R_l $ stabilize with minimal changes as$ \delta m $ increases. When$ \delta m < $ 0.02 GeV, the slopes of the functions of$ R_o $ ,$ R_s $ , and$ R_l $ versus$ \delta m $ are significantly larger at$ K_T $ = 1.5 GeV than at$ K_T $ = 0.5 GeV, and they are slightly larger at T = 0.14 GeV than at T = 0.15 GeV.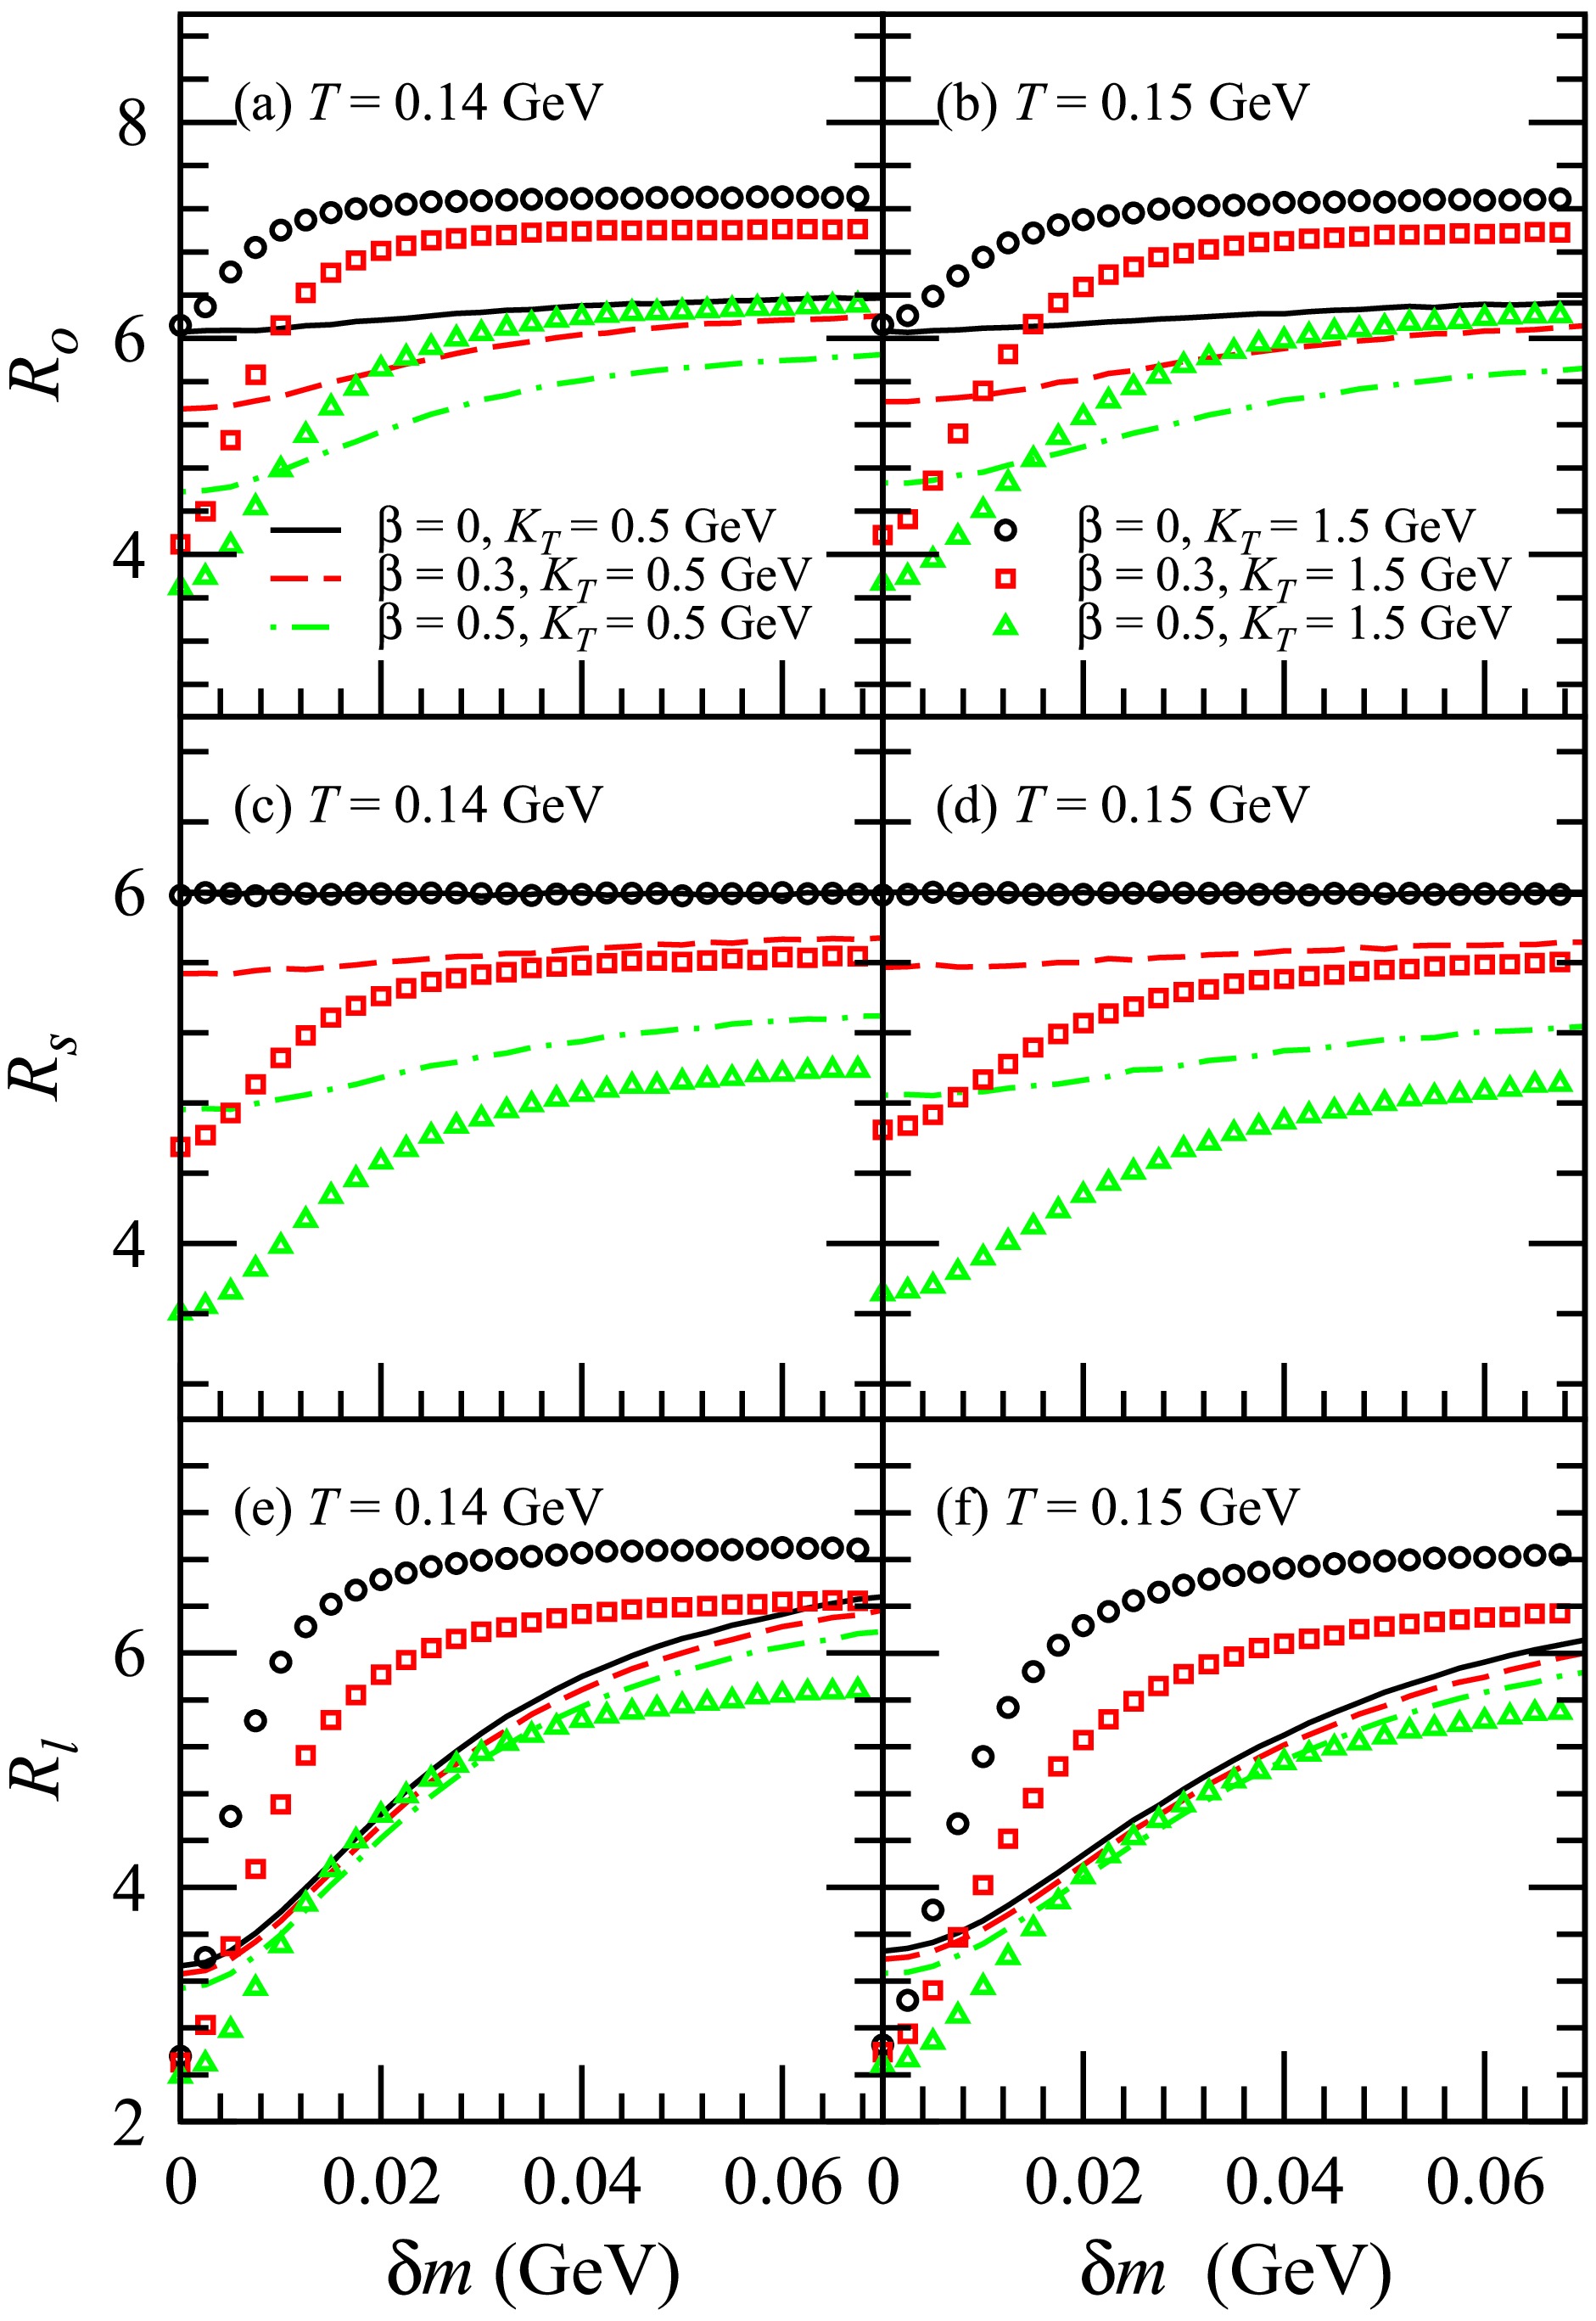
Figure 4. (color online) HBT radii
$ R_o $ ,$ R_s $ , and$ R_l $ of ϕϕ with respect to the in-medium mass modification$ \delta m $ for$ K_T $ = 0.5 GeV and 1.5 GeV. The plots illustrate the results of$ R_o $ in (a) and (b),$ R_s $ in (c) and (d), and$ R_l $ in (e) and (f). -
Figure 5 shows the normalized distributions of the transverse coordinate of the
$ D^0 $ emission sources for$ k_T $ = 0.5 GeV and 1.5 GeV. Here, T = 0.14 GeV in plots (a) and (b) and T = 0.15 GeV in plots (c) and (d). For$ \beta = 0 $ , it indicates that velocity expansion is absent in the transverse plane and that the transverse source distributions for$ k_T $ = 1.5 GeV are identical to those for$ k_T $ = 0.5 GeV. When the squeezing effect is not considered ($ \delta m = 0 $ ), the transverse flow shifts the transverse source distributions for$ k_T $ = 0.5 GeV toward a smaller transverse coordinate$ r_T $ and shifts the transverse source distributions for$ k_T $ = 1.5 GeV toward a larger transverse coordinate$ r_T $ . The mass of the$ D^0 $ meson is expected to be reduced by approximately 0.005 GeV in the pionic medium [66]. When considering the squeezing effect, the$ \delta m $ for the$ D^0 $ meson is taken as 0.005 GeV, as in Figs. 5−7. For$ \beta = 0 $ , the squeezing effect does not affect the transverse source distribution. However, for$ \beta > 0 $ , the squeezing effect reduces the influence of the transverse flow on the transverse source distribution, which is more pronounced for$ k_T $ = 1.5 GeV. This phenomenon is slightly more pronounced for T = 0.14 GeV. The squeezing effect affects the transverse source distribution of the$ D^0 $ meson to a greater extent than for the ϕ meson.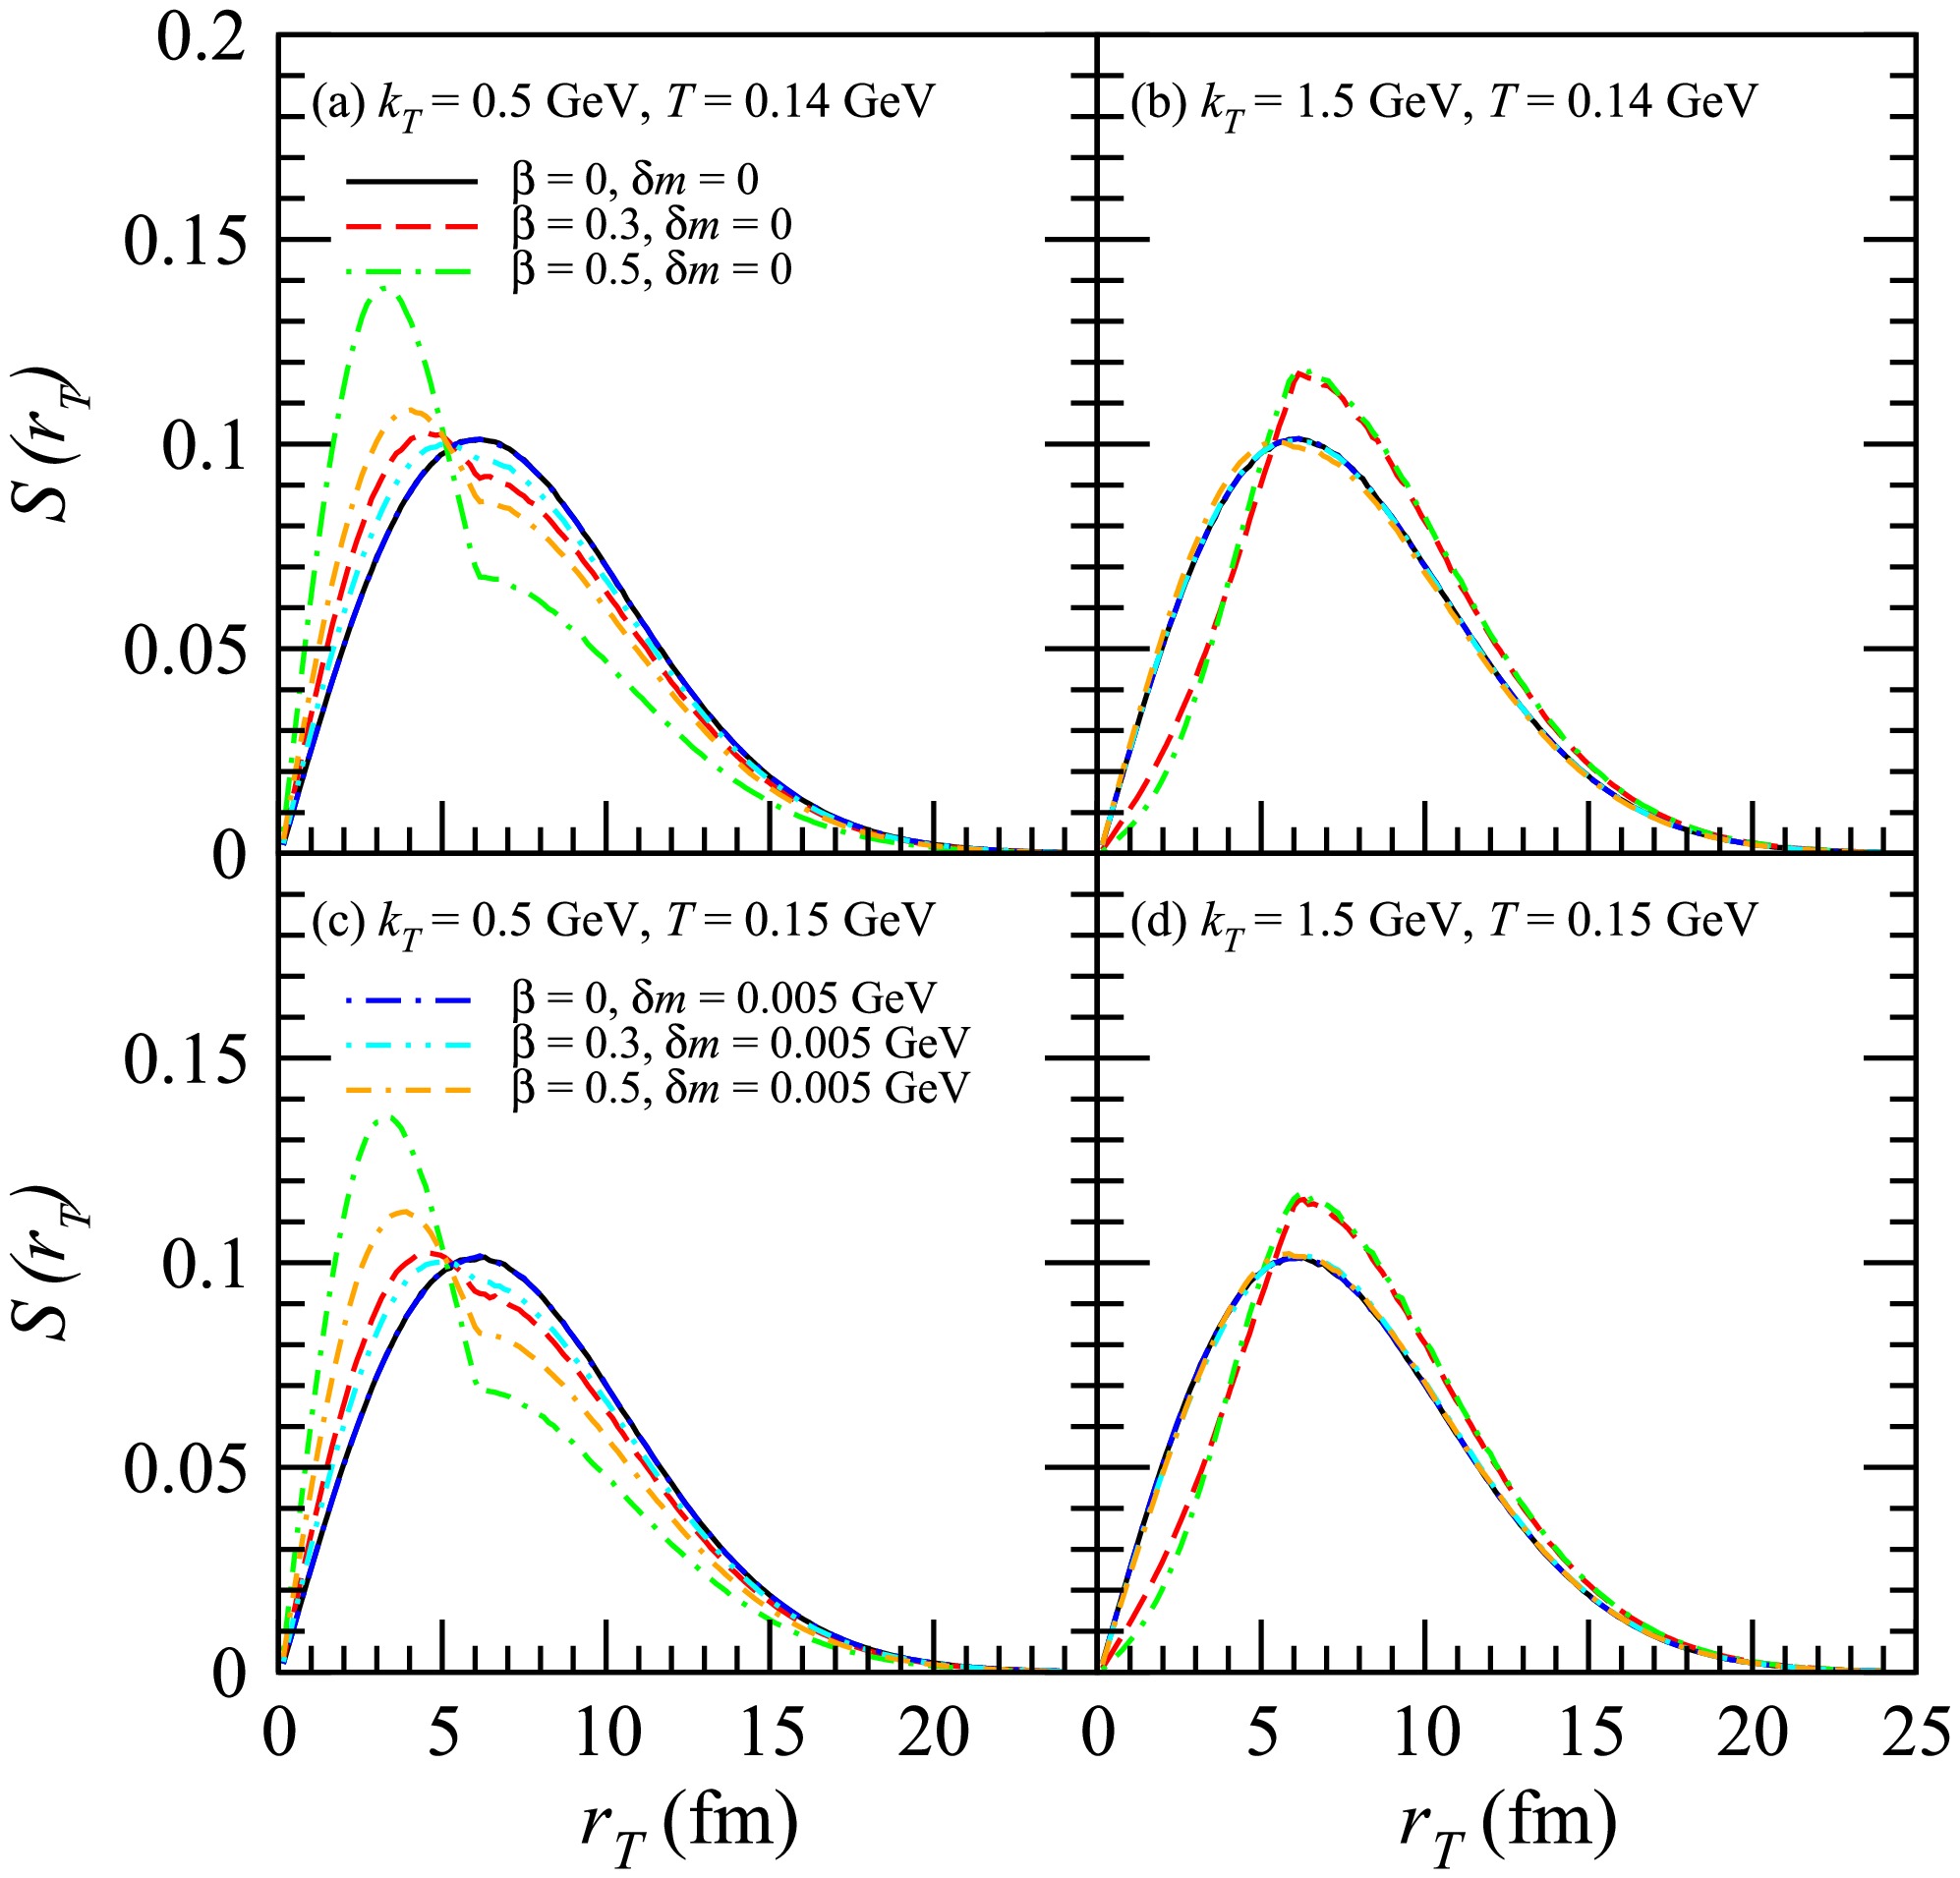
Figure 5. (color online) Normalized distributions of the transverse coordinate of the
$ D^0 $ emission sources for$ k_T $ = 0.5 GeV and 1.5 GeV. Here, T = 0.14 GeV in plots (a) and (b) and T = 0.15 GeV in plots (c) and (d).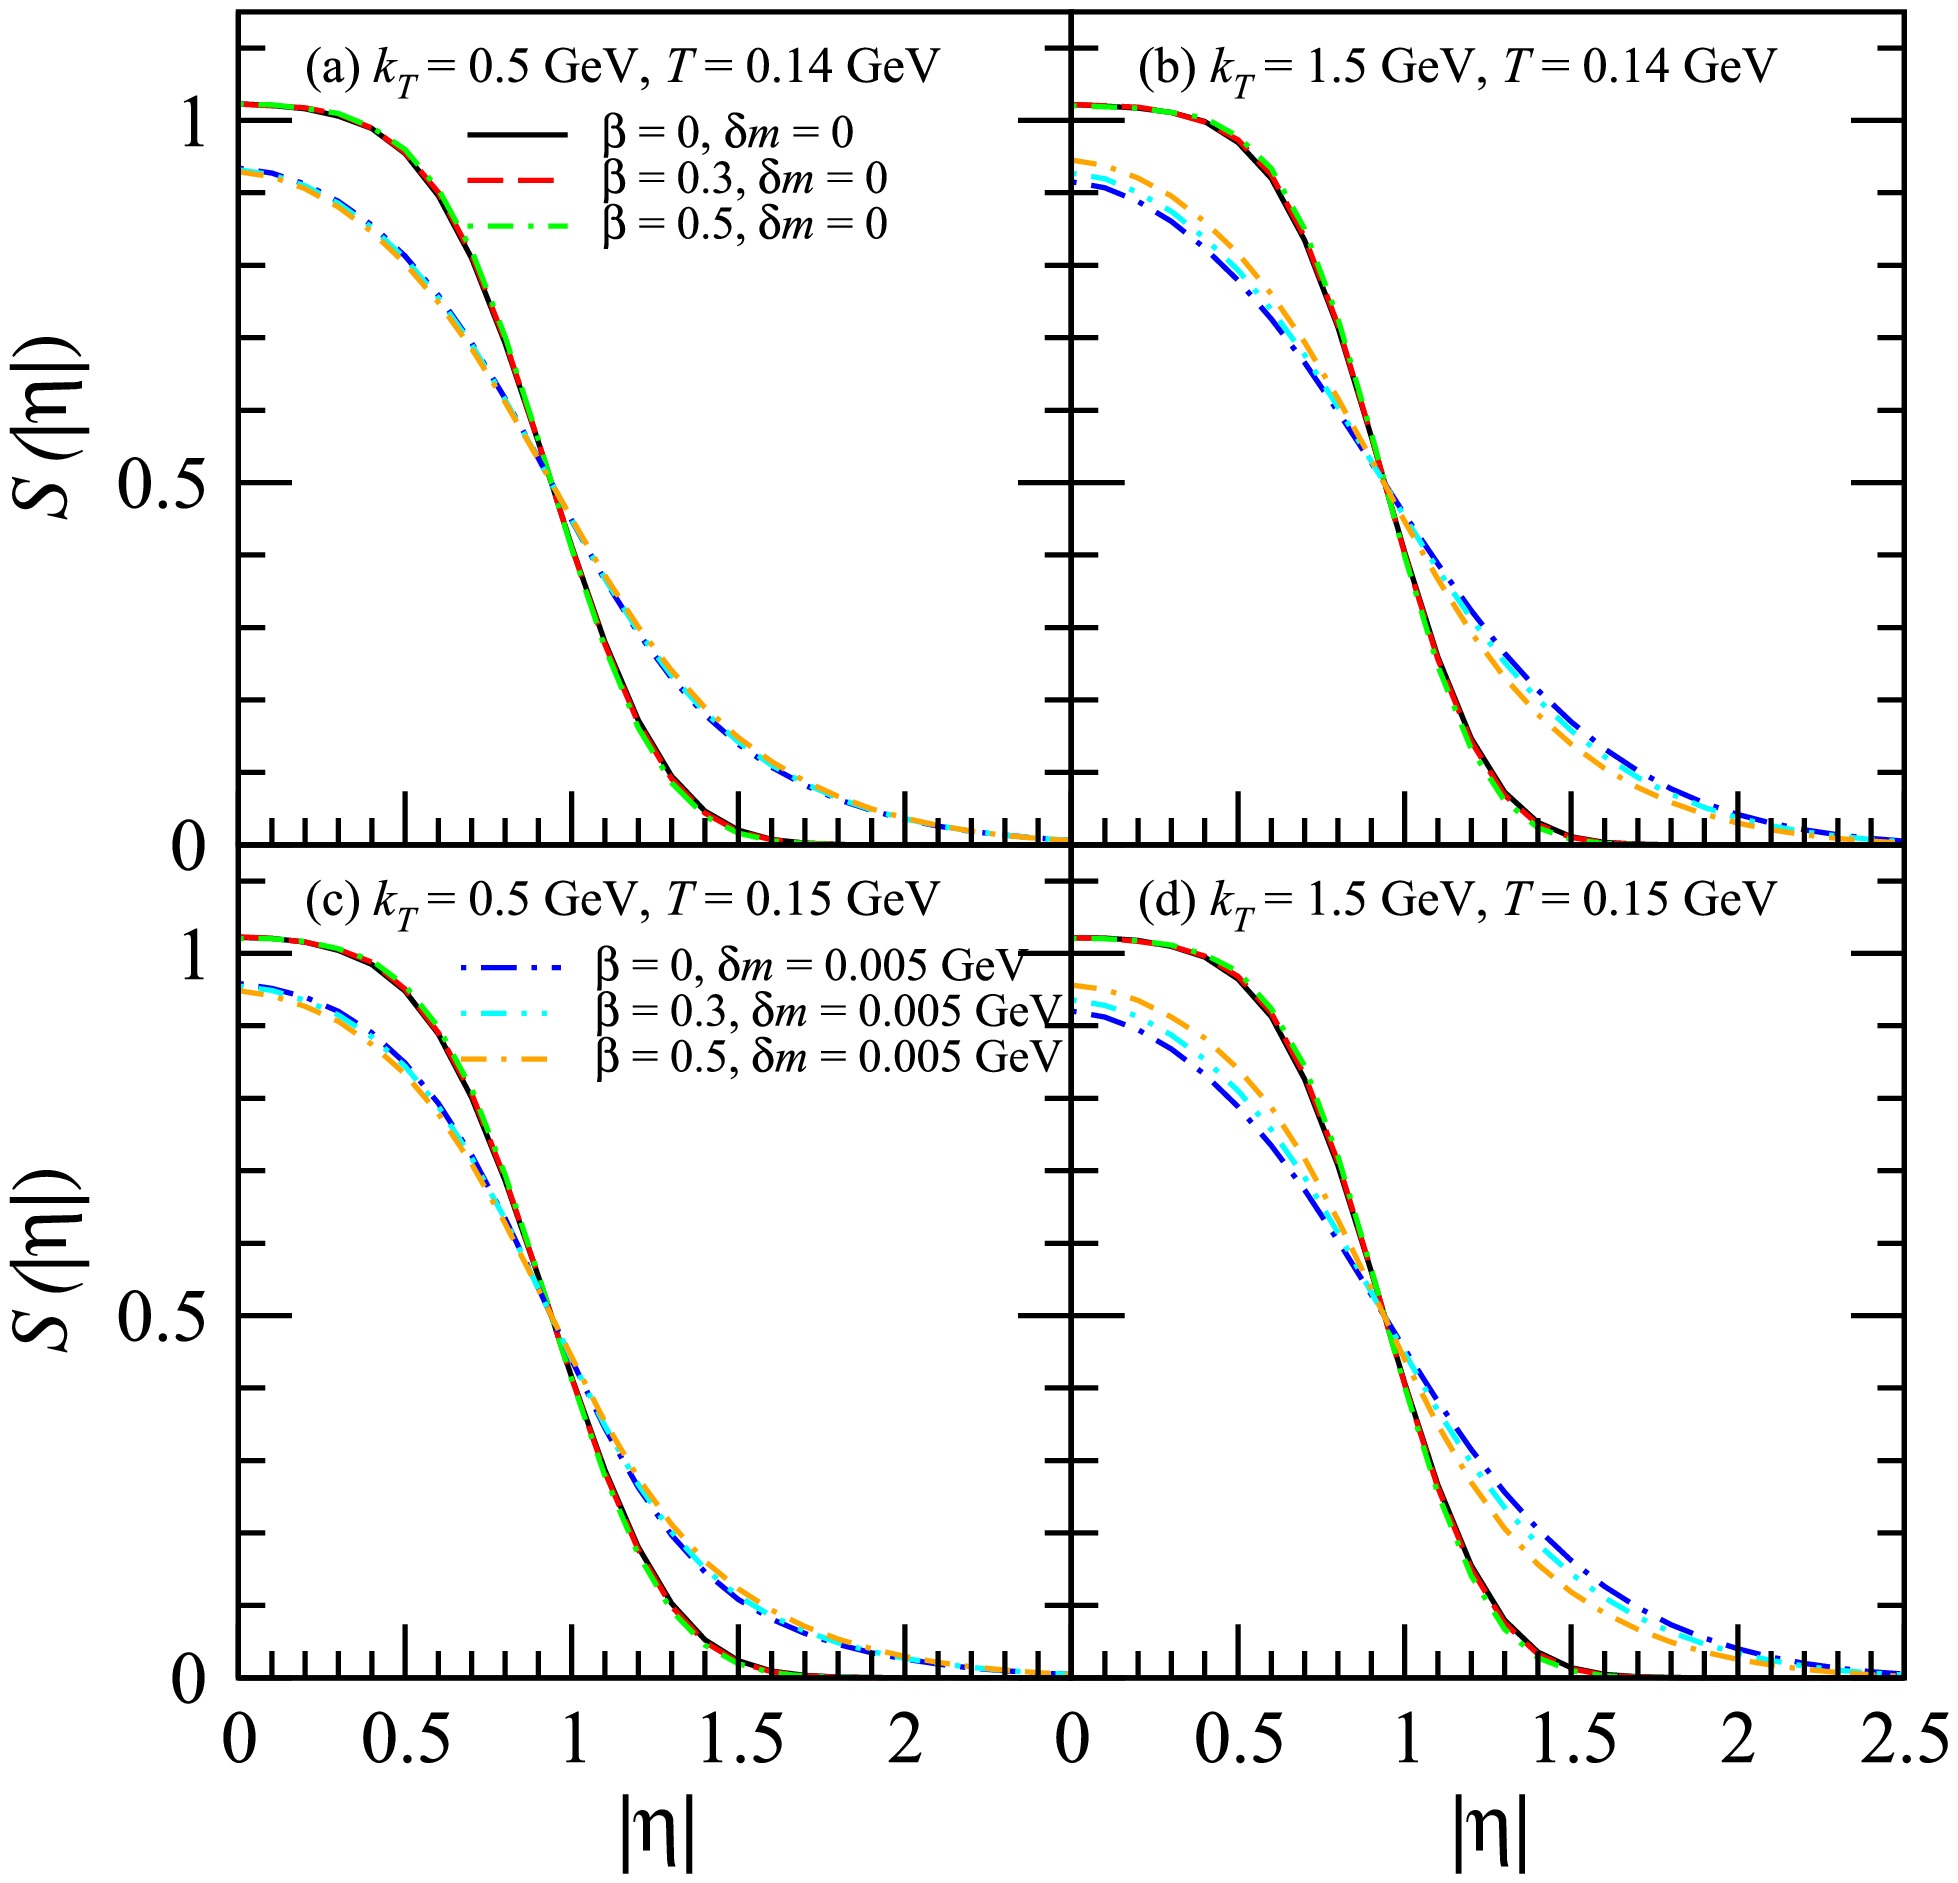
Figure 6. (color online) Normalized distributions of
$ |\eta| $ of the$ D^0 $ emission sources for$ k_T $ = 0.5 GeV and 1.5 GeV.Figure 6 shows the normalized distributions of
$ |\eta| $ of the$ D^0 $ emission sources for$ k_T $ = 0.5 GeV and 1.5 GeV. The squeezing effect results in the widening of the distribution of$ |\eta| $ of the$ D^0 $ emission sources, which is more pronounced for$ k_T $ = 1.5 GeV. This phenomenon is slightly more pronounced for T = 0.14 GeV.Figure 7 shows the HBT radii
$ R_o $ ,$ R_s $ , and$ R_l $ of$ D^0 $ $ D^0 $ with respect to the transverse pair momentum$ K_T $ . The lines represent the results for Y within the range$ (-1,1) $ , while the symbols denote the results calculated in the LCMS. In this paragraph, the results for Y in the range$ (-1,1) $ are discussed first, followed by a discussion of the differences between these results and those obtained in the LCMS. The squeezing effect leads to an increase in$ R_o $ , which is more pronounced at high$ K_T $ values. This is due to the impact of the squeezing effect on the source distribution. For$ \beta = 0 $ , the squeezing effect does not affect the transverse source distribution. The value of$ R_s $ solely depends on the transverse spatial distribution of the source. Hence, at$ \beta = 0 $ , the squeezing effect has no bearing on the value of$ R_s $ . For$ \beta > 0 $ , the squeezing effect leads to an increase in$ R_s $ , which is slightly more pronounced at high$ K_T $ values. The squeezing effect results in a significant increase in$ R_l $ . This is because the squeezing effect causes a significant widening of the source space-time rapidity distribution, leading to an expansion of both the temporal and longitudinal distributions of the source. The squeezing effect has a slightly greater impact on the$ R_o $ ,$ R_s $ , and$ R_l $ of$ D^0 $ $ D^0 $ at$ T=0.14 $ GeV than at$ T=0.15 $ GeV. The value of$ R_o $ calculated in the LCMS is slightly lower than that calculated for Y within the range$ (-1,1) $ , while the value of$ R_l $ calculated in the LCMS exceeds that calculated for Y in the range$ (-1,1) $ . When considering the squeezing effect, this difference becomes more pronounced compared to when it is not considered. In contrast, the value of$ R_s $ calculated in the LCMS is identical to that calculated for Y in the range$ (-1,1) $ . The influence of the squeezing effect on the HBT radii of$ D^0 $ $ D^0 $ in the LCMS closely resembles its influence on the HBT radii of$ D^0 $ $ D^0 $ for Y in the range$ (-1,1) $ .Figure 8 presents the HBT radii
$ R_o $ ,$ R_s $ , and$ R_l $ of$ D^0 $ $ D^0 $ with respect to$ \delta m $ for$ K_T $ = 0.5 GeV and 1.5 GeV. When$ \beta = 0 $ , the squeezing effect has no impact on$ R_s $ , which remains steady as$ \delta m $ increases. However, in other instances, as$ \delta m $ increases, the values of$ R_o $ ,$ R_s $ , and$ R_l $ initially increase before leveling off, presenting a decreasing slope in the relationship between$ R_o $ ,$ R_s $ , and$ R_l $ and$ \delta m $ . Eventually,$ R_o $ ,$ R_s $ , and$ R_l $ stabilize with no changes as$ \delta m $ increases further.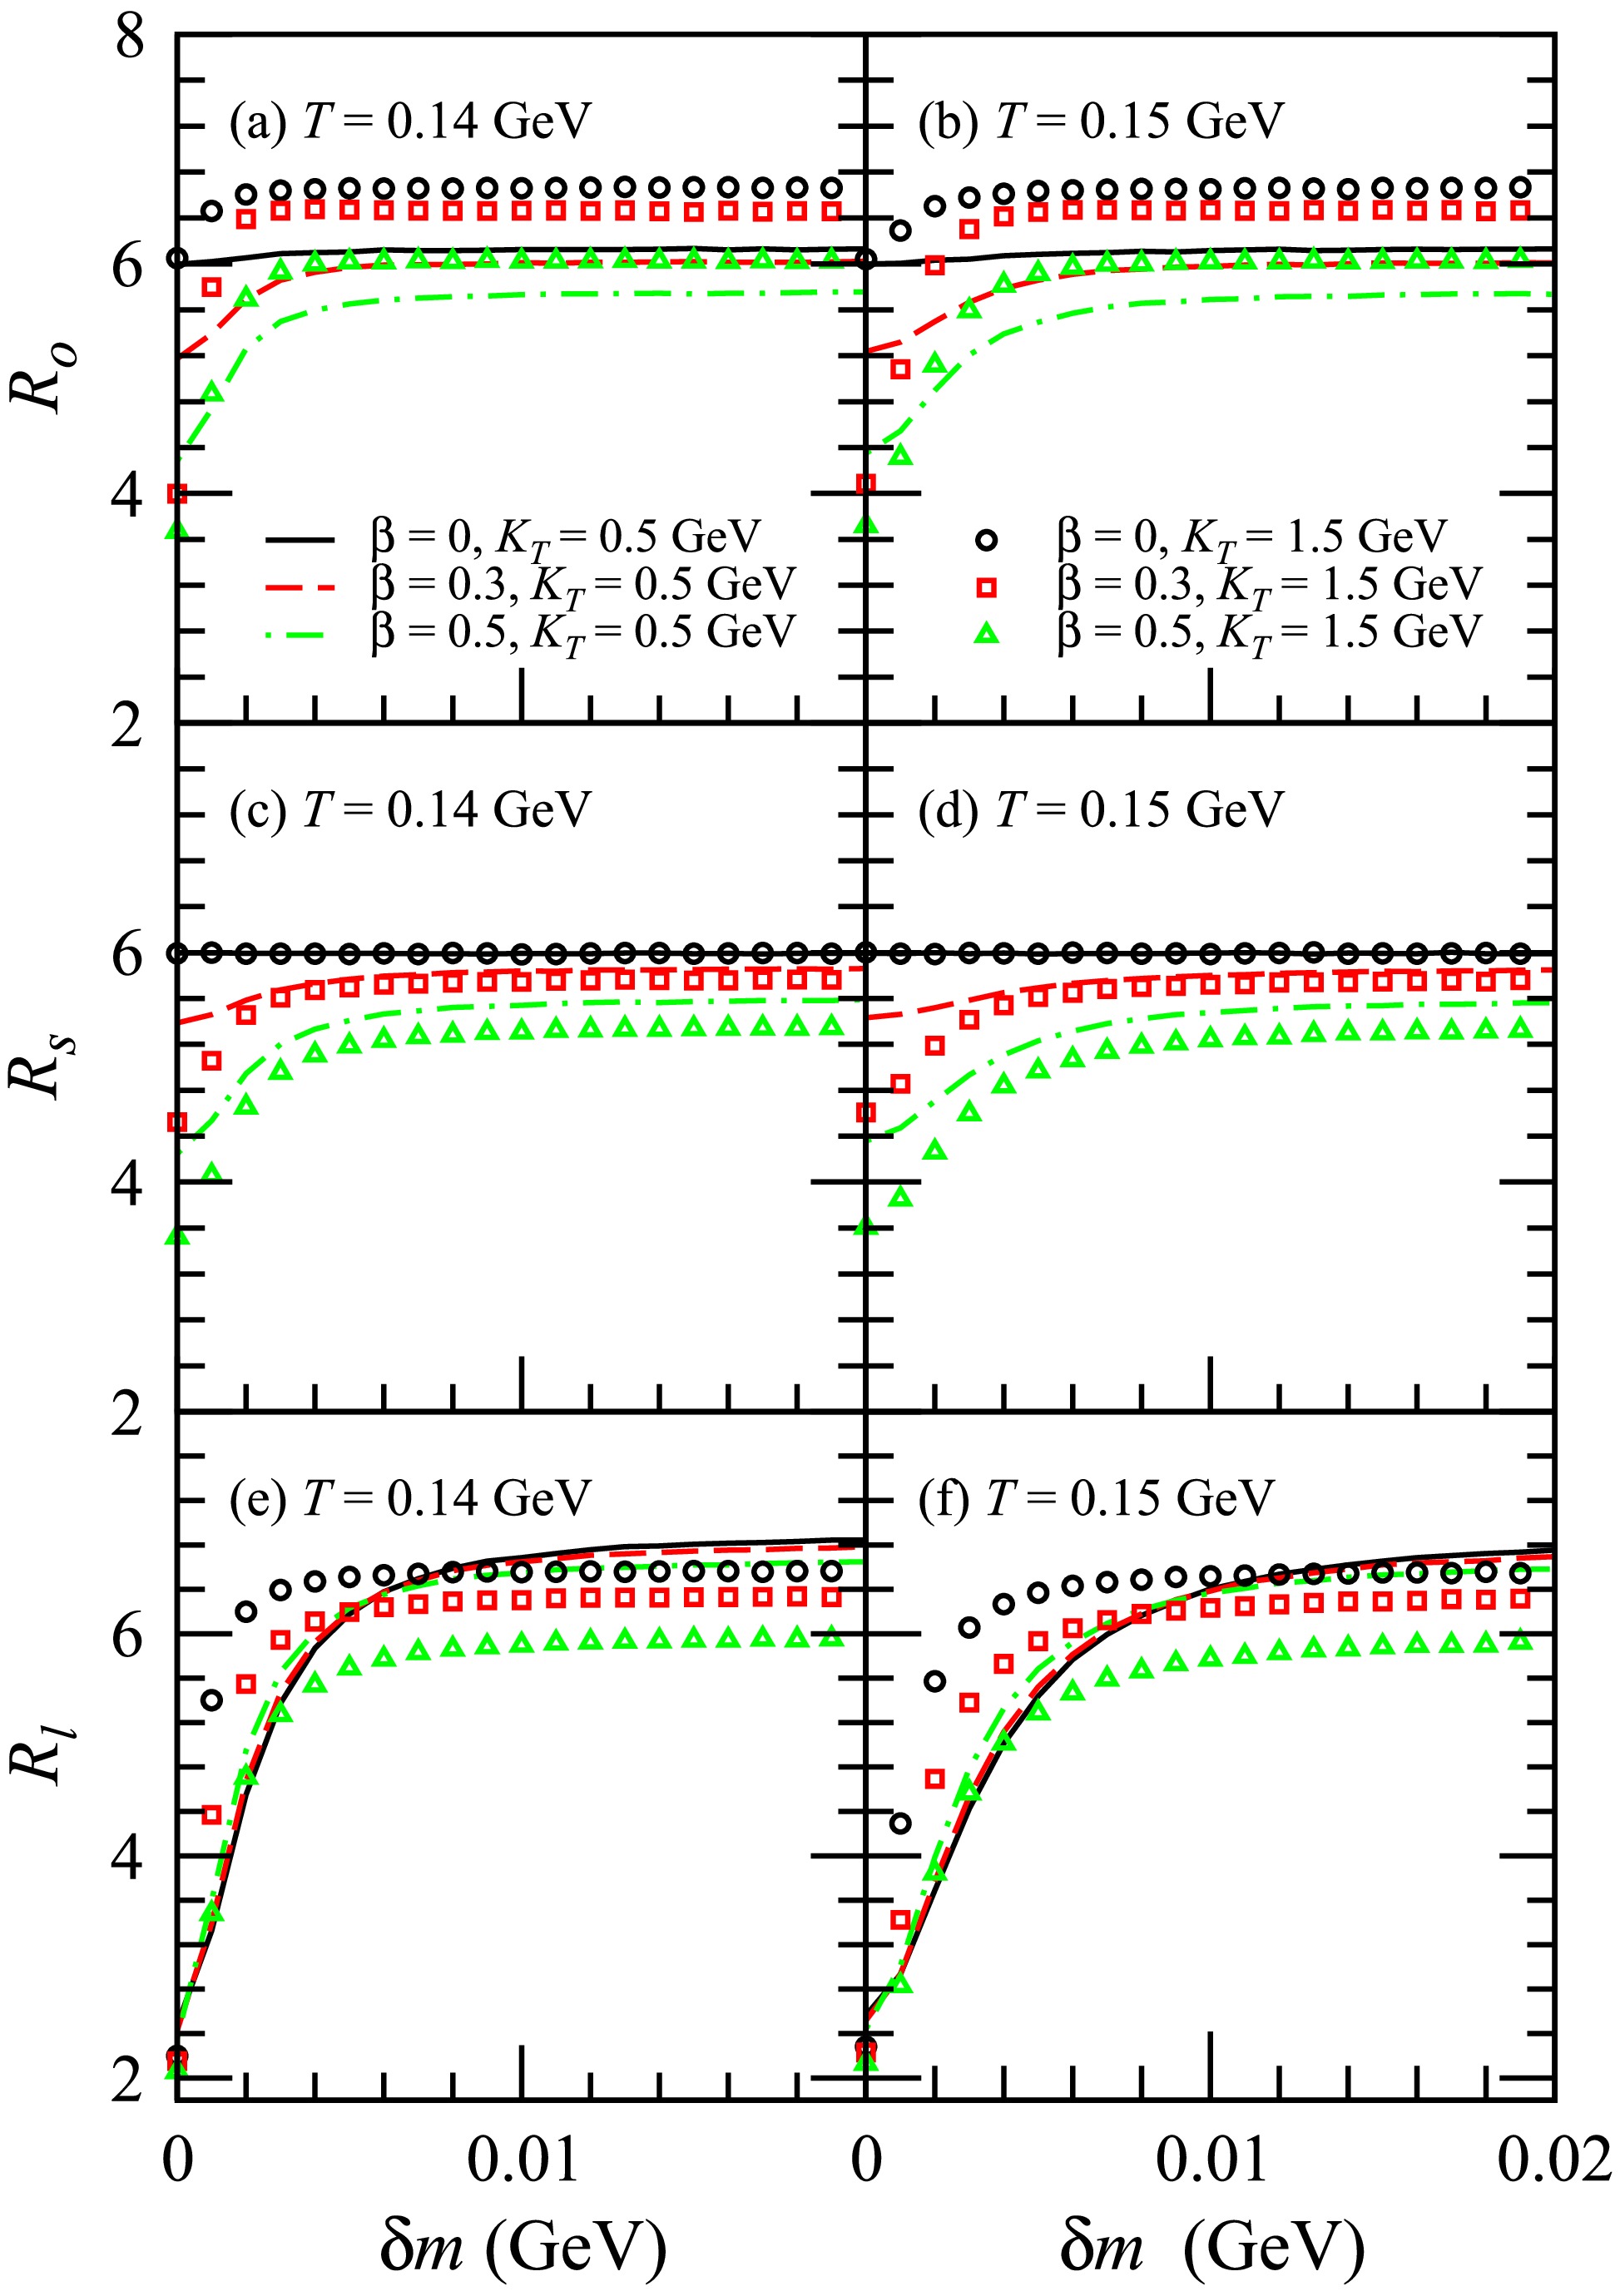
Figure 8. (color online) HBT radii
$ R_o $ ,$ R_s $ , and$ R_l $ of$ D^0 $ $ D^0 $ with respect to$ \delta m $ for$ K_T $ = 0.5 GeV and 1.5 GeV. The plots illustrate the results of$ R_o $ in (a) and (b),$ R_s $ in (c) and (d), and$ R_l $ in (e) and (f).The squeezing effect exerts a greater influence on the values of
$ R_o $ ,$ R_s $ , and$ R_l $ of$ D^0 $ $ D^0 $ compared to ϕϕ because the mass of$ D^0 $ is greater than that of ϕ. The squeezing effect significantly influences the three-dimensional HBT radii, particularly$ R_o $ and$ R_l $ , for cylinder expansion sources compared to the one-dimensional HBT radii for spherically symmetric sources. This is due to the notable impact of this effect on the source space-time rapidity distribution in cylinder expansion sources. -
Figure 9 shows the normalized distributions of the transverse coordinate of the
$ K^+ $ emission sources for$ k_T $ = 0.5 GeV and 1.5 GeV. In the figure, T = 0.14 GeV in (a) and (b) and T = 0.15 GeV in (c) and (d). For$ \beta = 0 $ , it indicates the absence of any velocity expansion in the transverse plane, with the transverse source distributions for$ k_T $ = 1.5 GeV being identical to those for$ k_T $ = 0.5 GeV. When the squeezing effect is not considered ($ \delta m = 0 $ ), the transverse flow has a slight influence on the transverse source distributions at$ k_T $ = 0.5 GeV. For$ \beta = 0.3 $ , the transverse flow induces a slight shift in these distributions toward larger transverse coordinates$ r_T $ at$ k_T $ = 0.5 GeV. Conversely, at$ \beta = 0.5 $ , the transverse flow causes a slight shift in the transverse source distributions toward a smaller transverse coordinate$ r_T $ for$ k_T $ = 0.5 GeV. This occurs because, at$ \beta = 0.3 $ , the transverse flow within regions of small transverse coordinates$ r_T $ is low, resulting in less$ K^+ $ particle production with$ k_T $ = 0.5 GeV. The transverse flow induces a shift in the transverse source distributions toward larger transverse coordinates$ r_T $ at$ k_T $ = 1.5 GeV. As the transverse flow increases, this phenomenon becomes more pronounced. At T = 0.14 GeV, this phenomenon is slightly more significant than at T = 0.15 GeV. The mass of Kaon is expected to be reduced by approximately 0.01 GeV in the pionic medium [70]. When considering the squeezing effect, the$ \delta m $ for$ K^+ $ is taken as 0.01 GeV, as in Figs. 9−11. For$ \beta = 0 $ , the squeezing effect does not impact the transverse source distribution. However, for$ \beta > 0 $ , the squeezing effect slightly decreases the influence of transverse flow on the transverse source distribution at$ k_T $ = 1.5 GeV while having no impact at$ k_T $ = 0.5 GeV. This phenomenon is more pronounced for T = 0.14 GeV.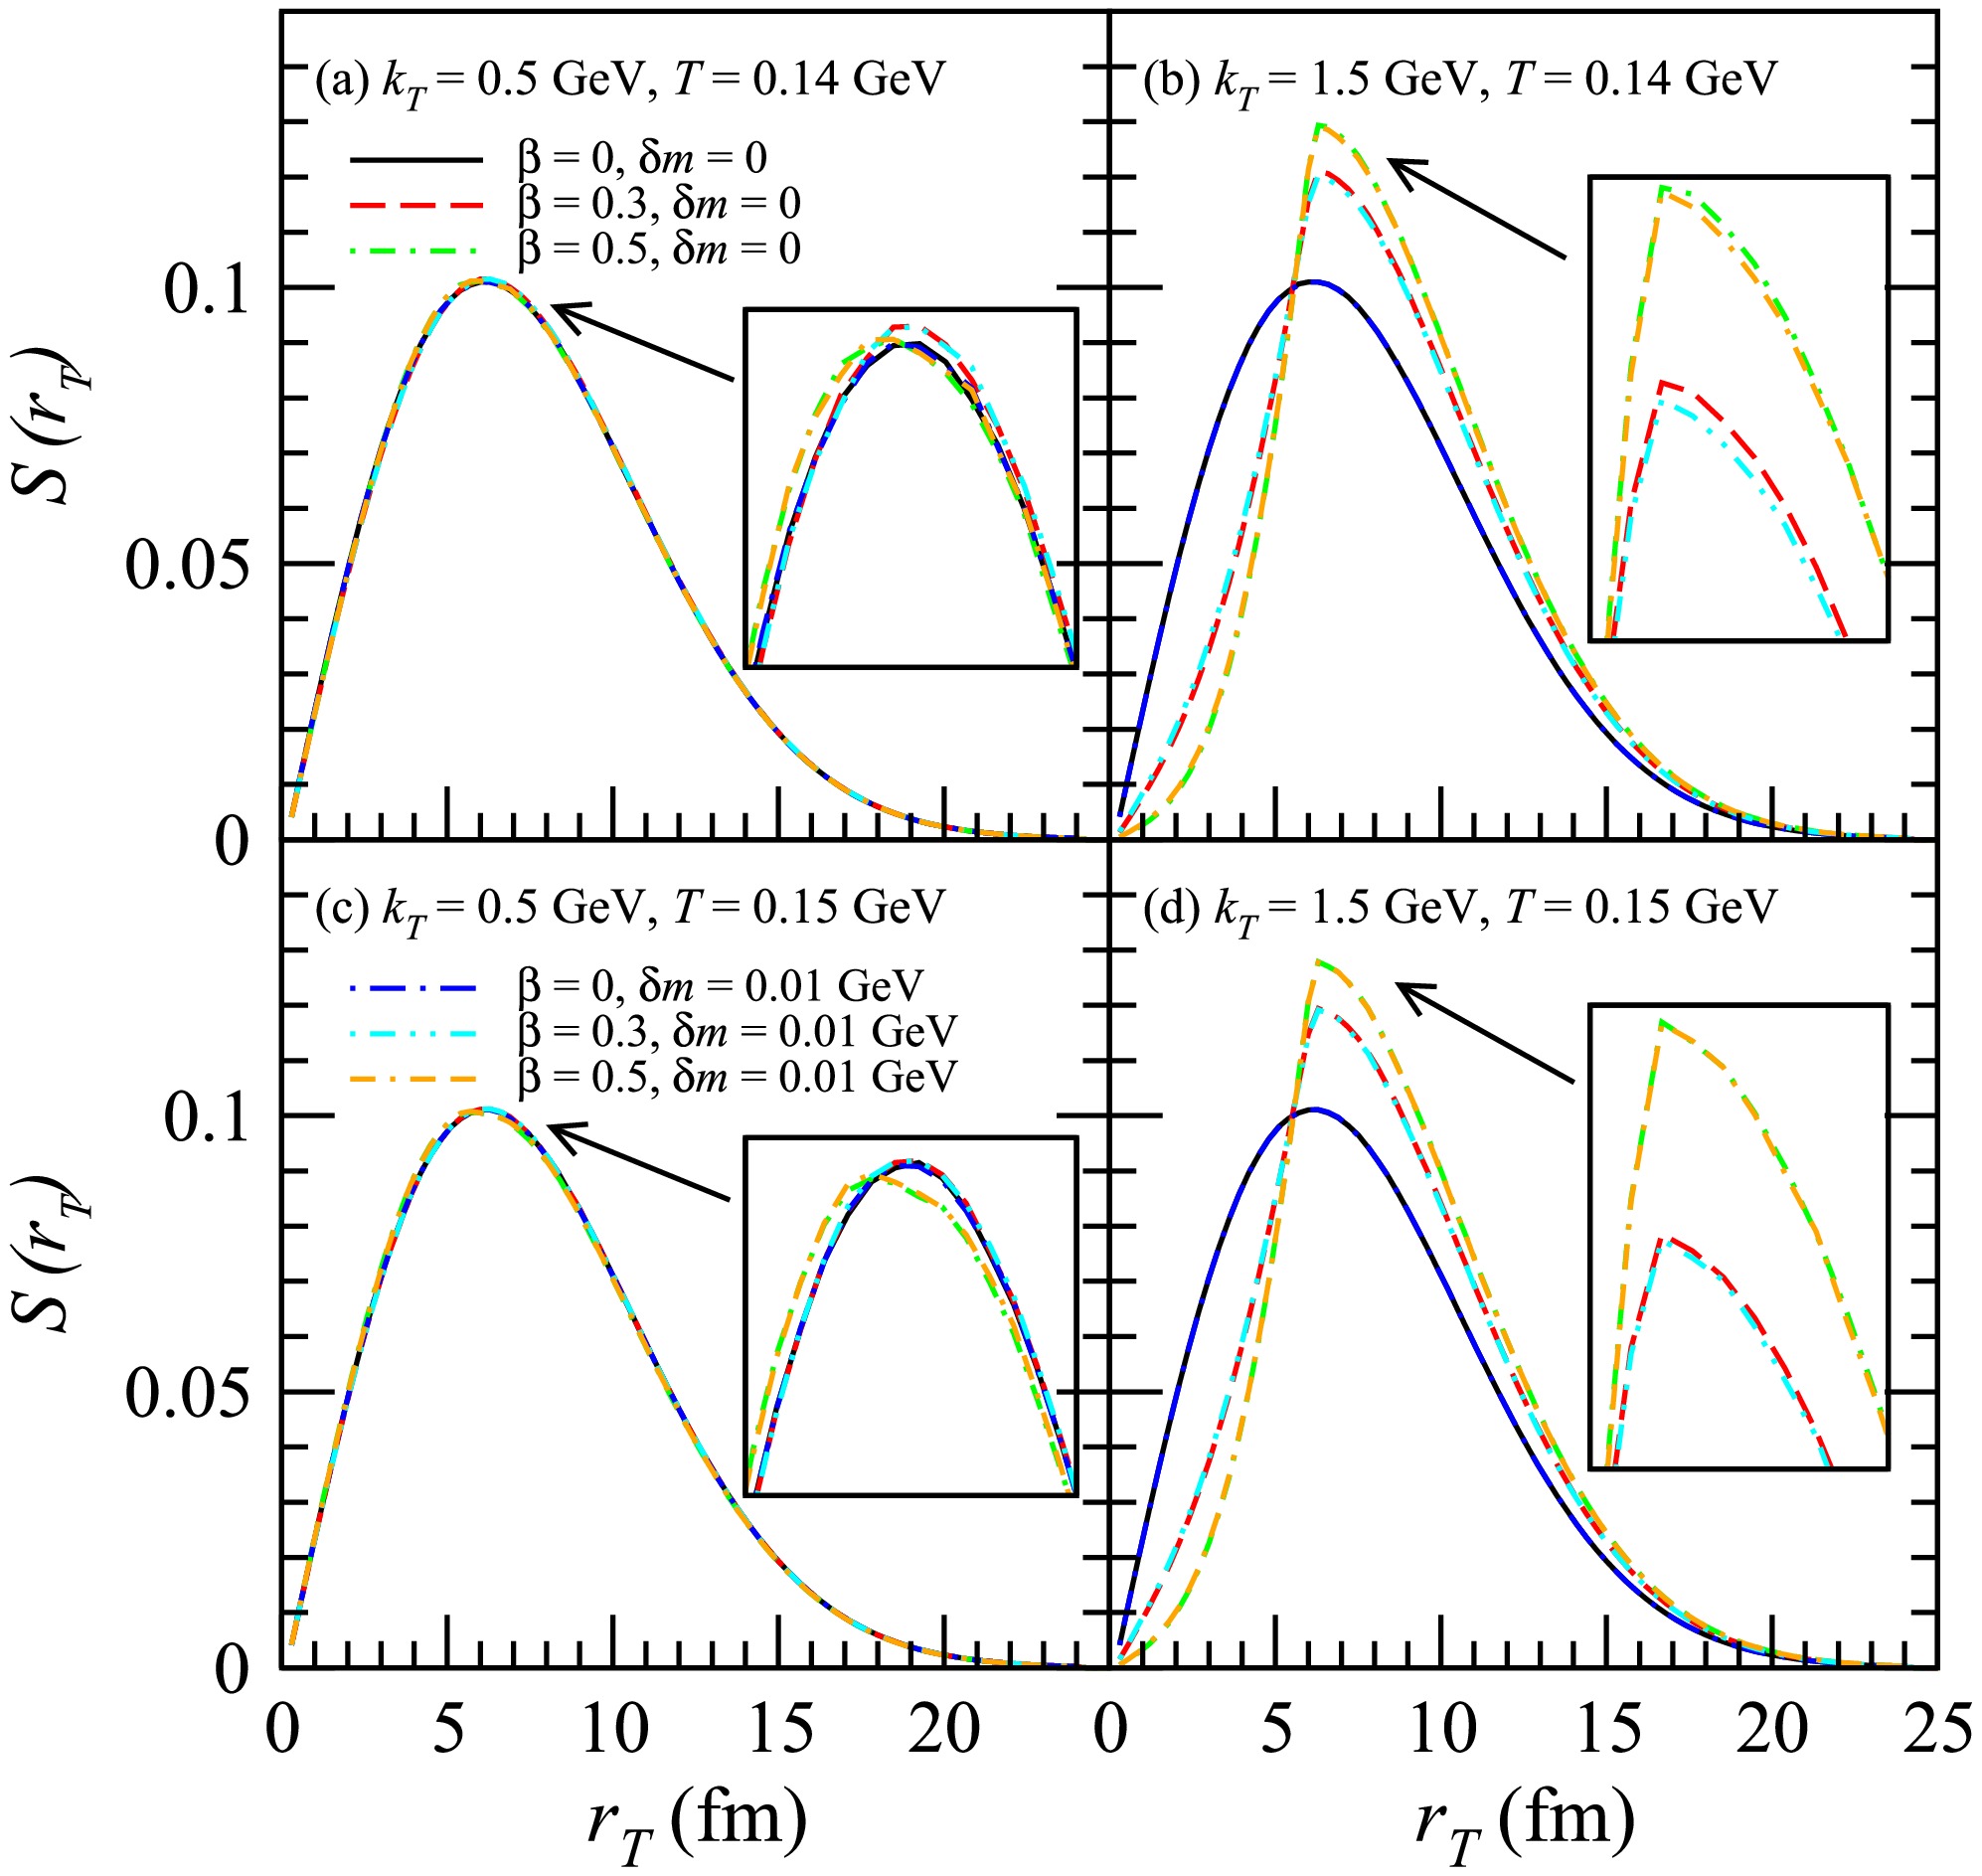
Figure 9. (color online) Normalized distributions of the transverse coordinate of the
$ K^+ $ emission sources for$ k_T $ = 0.5 GeV and 1.5 GeV. Here, T = 0.14 GeV in (a) and (b) and T = 0.15 GeV in (c) and (d).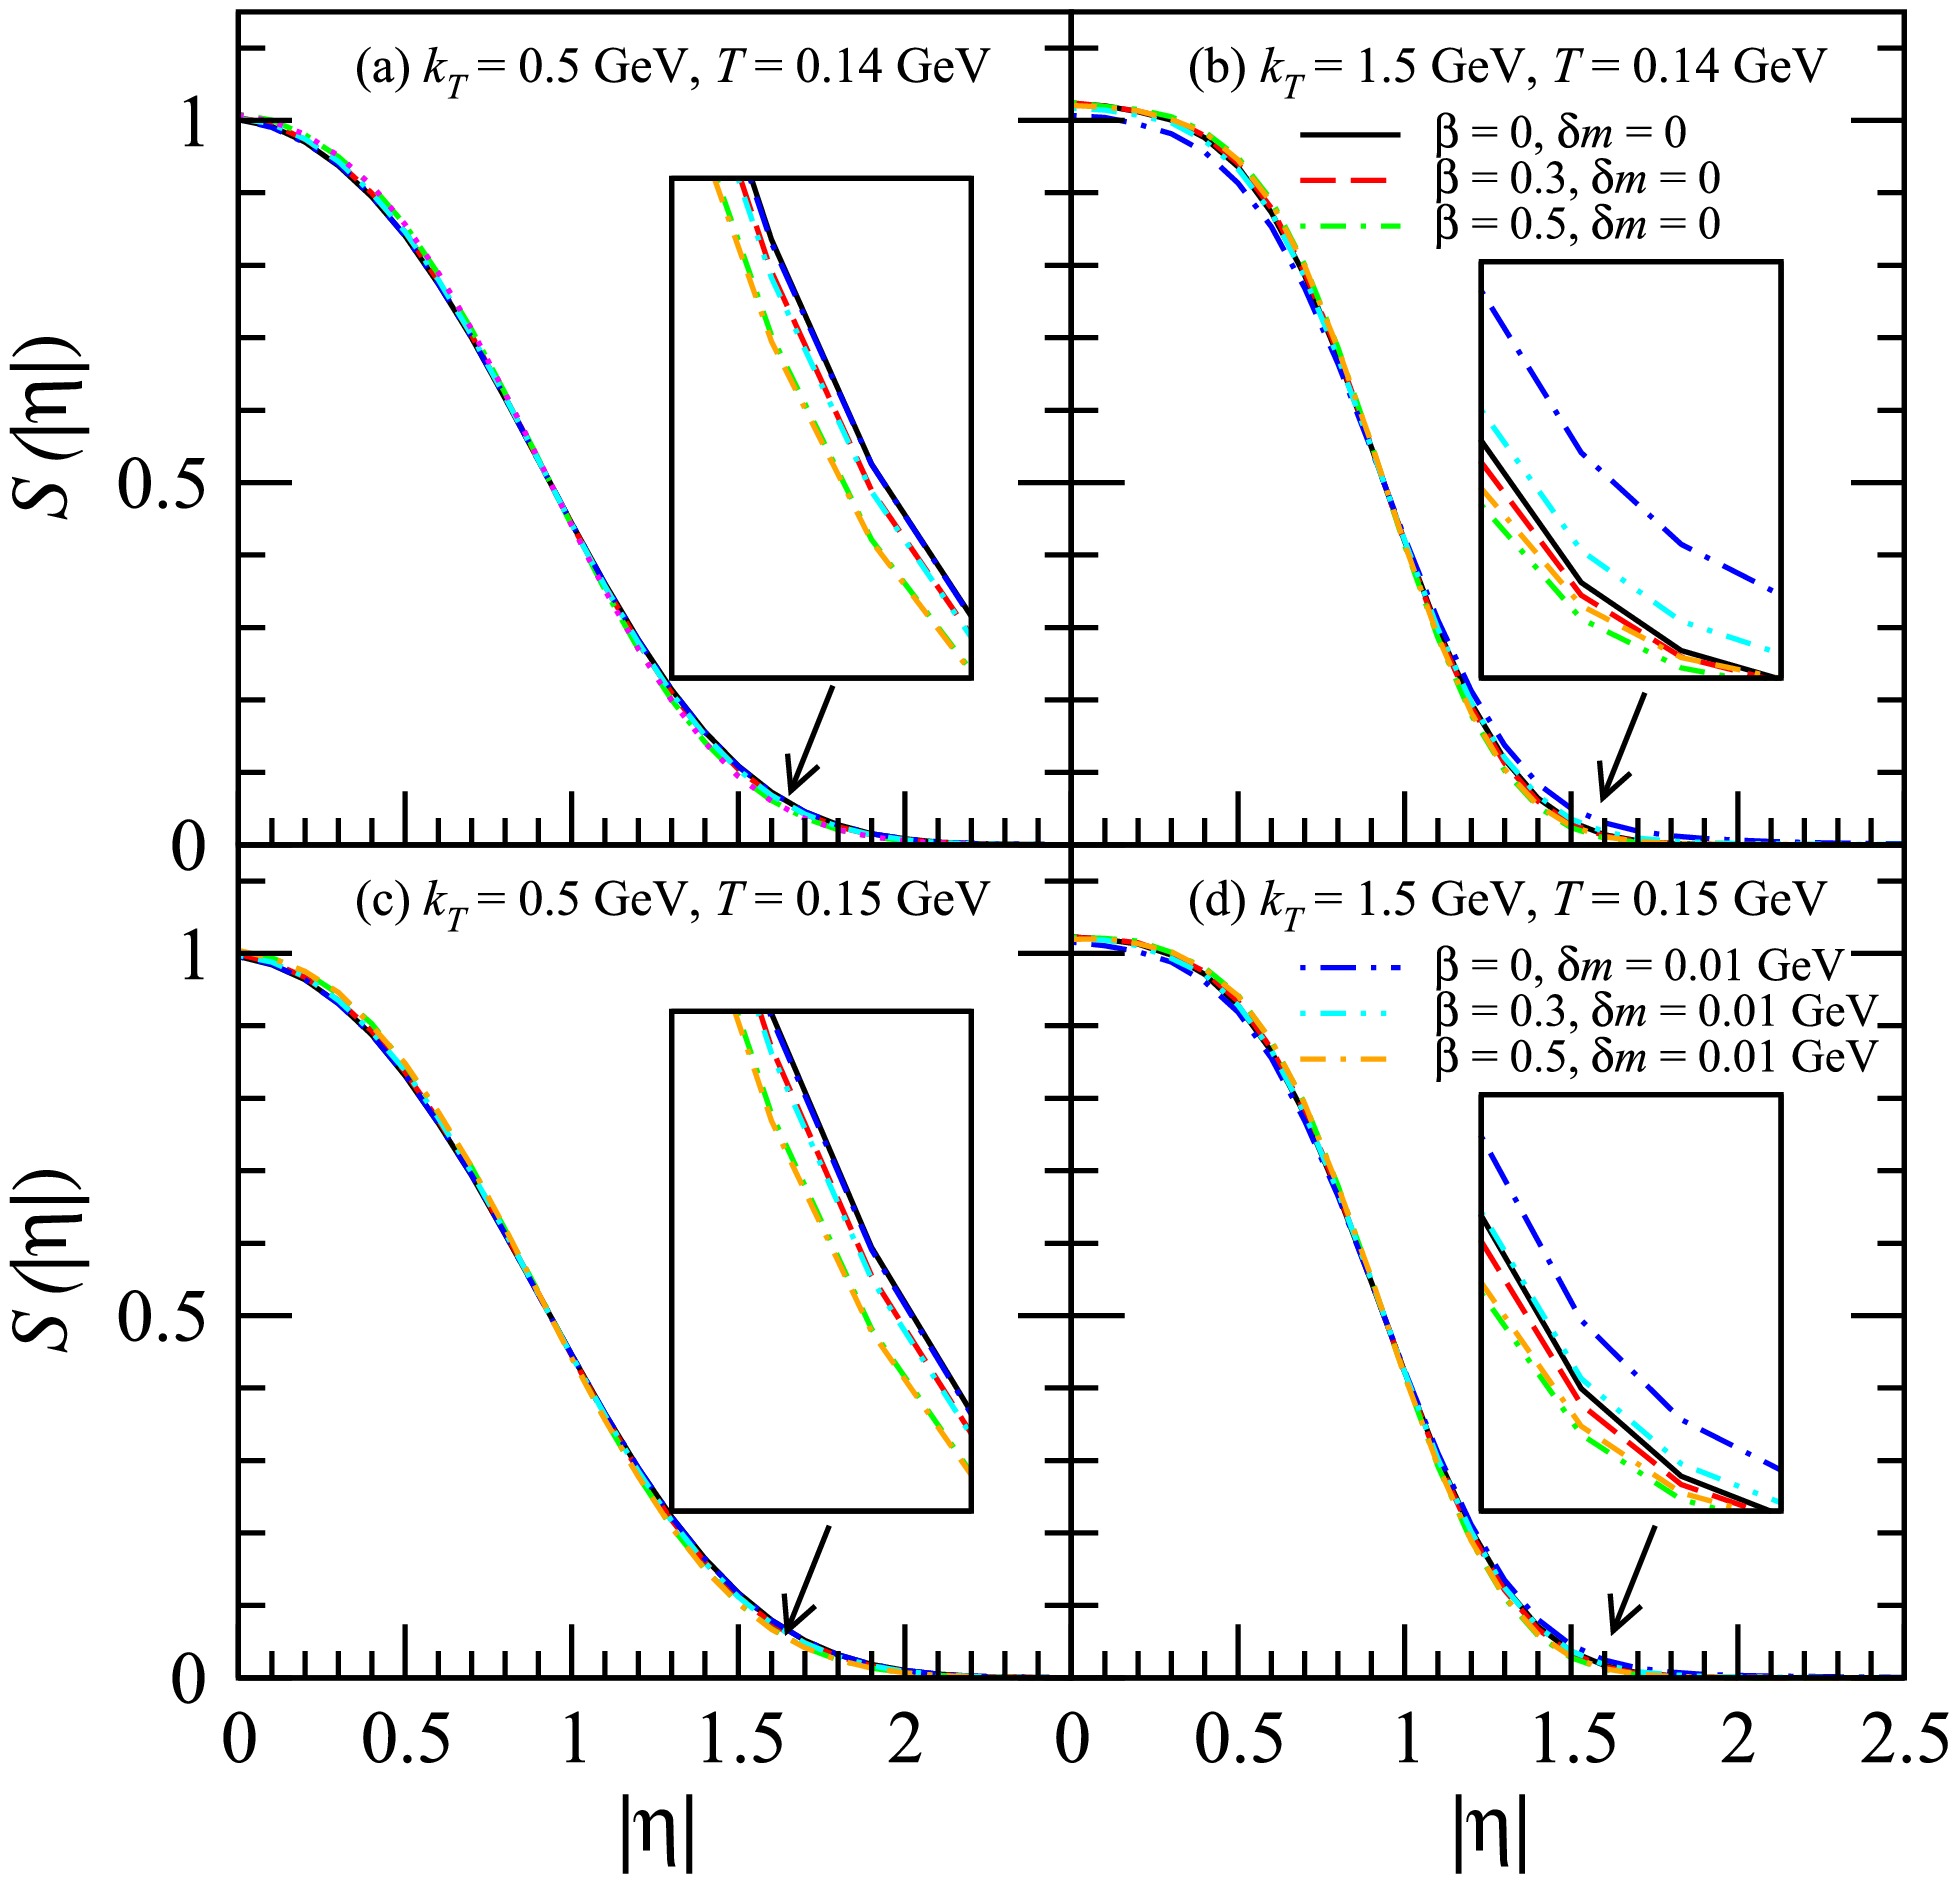
Figure 10. (color online) Normalized distributions of
$ |\eta| $ of the$ K^+ $ emission sources for$ k_T $ = 0.5 GeV and 1.5 GeV.Figure 10 shows the normalized distributions of
$ |\eta| $ for the$ K^+ $ emission sources for$ k_T $ = 0.5 GeV and 1.5 GeV. For$ \delta m = 0 $ , the transverse flow slightly reduces the effect on the space-time rapidity distribution of the sources. At$ k_T $ = 0.5 GeV, the squeezing effect does not influence the source's space-time rapidity distribution. However, at$ k_T $ = 1.5 GeV, the squeezing effect causes a slight expansion of the source's space-time rapidity distribution. This phenomenon is more pronounced with lower transverse flow and smaller freeze-out temperatures.Figure 11 shows the HBT radii
$ R_o $ ,$ R_s $ , and$ R_l $ of$ K^+ $ $ K^+ $ with respect to the transverse pair momentum$ K_T $ . Here, the lines represent the results for Y within the range$ (-1,1) $ , while the symbols denote the results calculated in the LCMS. At high values of$ K_T $ , the squeezing effect results in an increase in both$ R_o $ and$ R_l $ . The increase in$ R_l $ is more significant than that in$ R_o $ . This phenomenon is more obvious for larger$ K_T $ , as well as for lower transverse flow and freeze-out temperatures. This is due to the influences of the squeezing effect on the source distribution. For$ \beta = 0 $ , the squeezing effect does not affect the transverse source distribution; hence, it also has no impact on$ R_s $ . For$ \beta > 0 $ , the squeezing effect leads to a slight increase in$ R_s $ at high$ K_T $ . The$ R_s $ calculated in the LCMS is identical to that calculated for Y in the range$ (-1,1) $ . The$ R_o $ calculated in the LCMS is slightly lower than that calculated for Y in the range$ (-1,1) $ , while the$ R_l $ calculated in the LCMS is greater than that calculated for Y in the range$ (-1,1) $ . The squeezing effect's impact on the HBT radii of$ K^+ $ $ K^+ $ in the LCMS is similar to the effect observed by Y in the range$ (-1,1) $ . For a small in-medium mass modification, the squeezing effect exerts a weaker influence on the HBT radii of$ K^+ $ $ K^+ $ compared to ϕϕ and$ D^0 $ $ D^0 $ , which can be attributed to the lower mass of$ K^+ $ relative to ϕ and$ D^0 $ .Figure 12 shows the HBT radii
$ R_o $ ,$ R_s $ , and$ R_l $ of$ K^+ $ $ K^+ $ with respect to$ \delta m $ for$ K_T $ = 0.5 GeV and 1.5 GeV. For$ \beta = 0 $ , the squeezing effect does not influence$ R_s $ , which remains constant as$ \delta m $ increases. For$ \beta > 0 $ , as$ \delta m $ increases,$ R_s $ undergoes minimal changes when$ K_T $ = 0.5 GeV. However, in other instances, as$ \delta m $ increases,$ R_o $ ,$ R_s $ , and$ R_l $ first increase monotonically before saturating, showing a decay in the slope of their correlation with$ \delta m $ . Ultimately, further increases in$ \delta m $ result in no significant changes to$ R_o $ ,$ R_s $ , and$ R_l $ .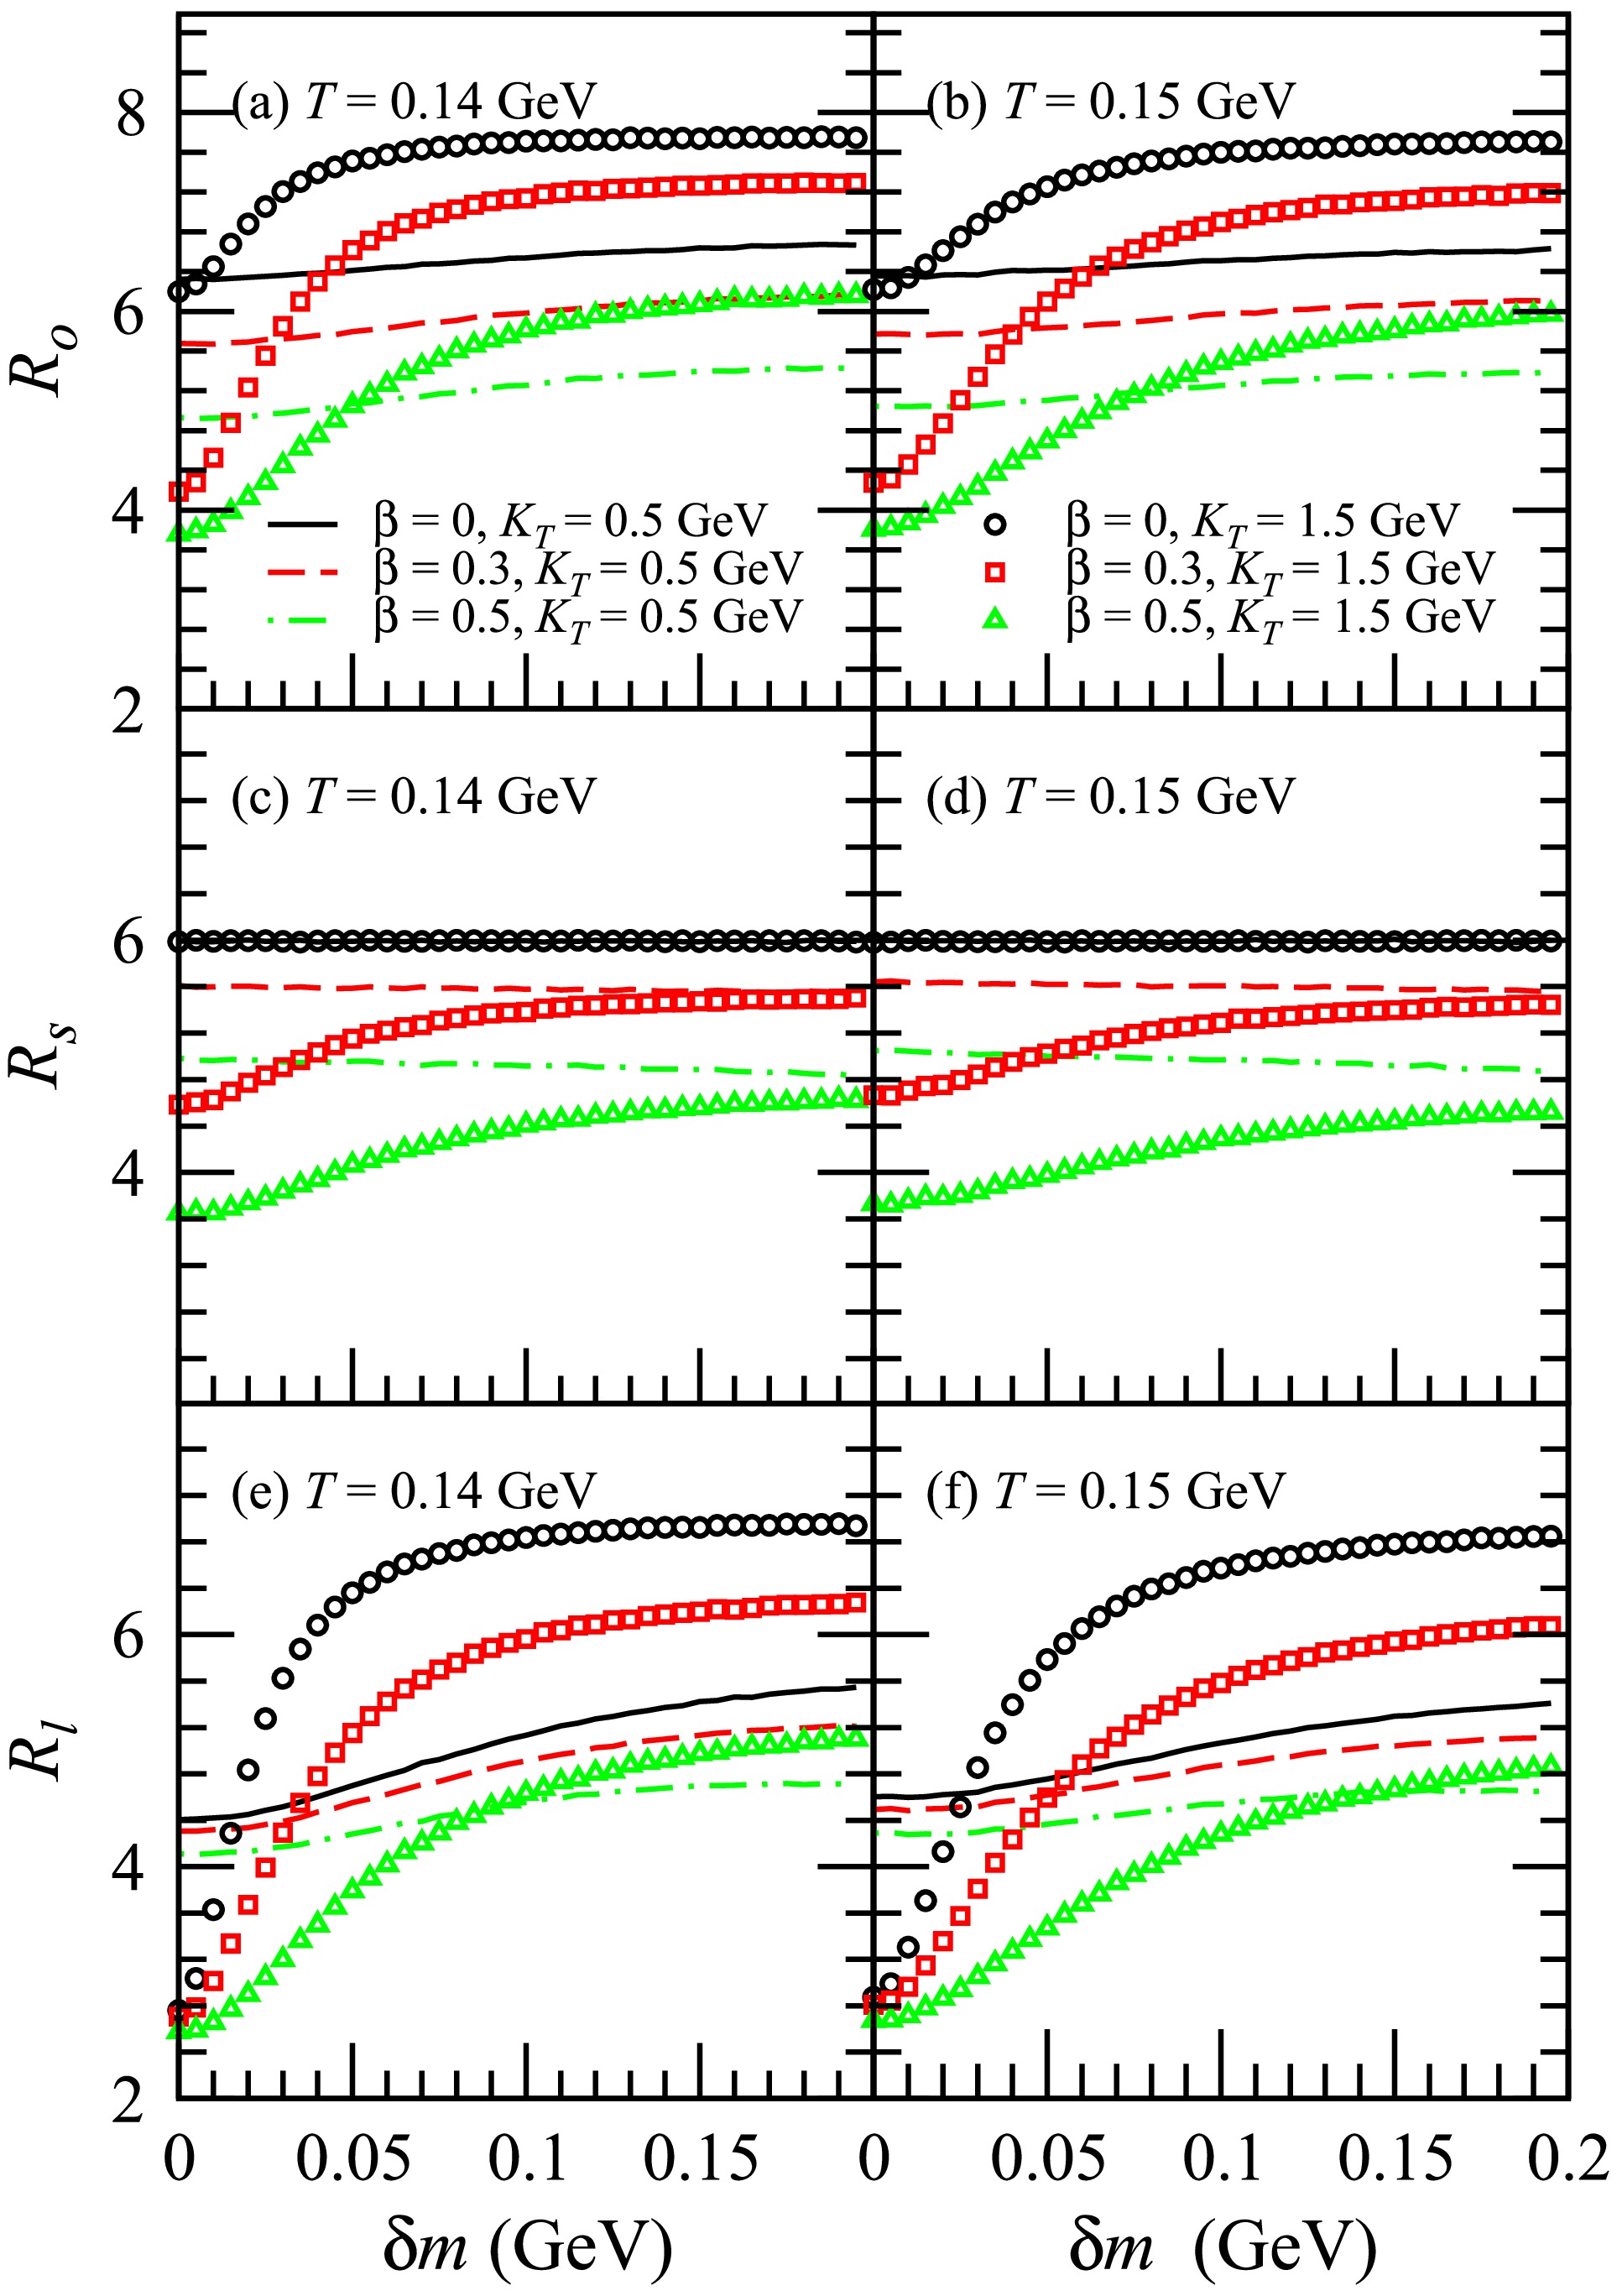
Figure 12. (color online) HBT radii
$ R_o $ ,$ R_s $ , and$ R_l $ of$ K^+ $ $ K^+ $ with respect to$ \delta m $ for$ K_T $ = 0.5 GeV and 1.5 GeV. The plots illustrate the results of$ R_o $ in (a) and (b),$ R_s $ in (c) and (d), and$ R_l $ in (e) and (f). -
Boson interactions with source media result in a shift in the masses of the bosons, inducing a squeezing effect. In this study, the impact of the squeezing effect on the three-dimensional HBT radii is analyzed based on cylinder expansion sources.
The impact of the squeezing effect on the three-dimensional HBT radii of ϕϕ,
$ D^0 $ $ D^0 $ , and$ K^+ $ $ K^+ $ is analyzed. The squeezing effect suppresses the impact of transverse flow on the transverse source distribution and broadens the space-time rapidity distribution of the source, increasing the HBT radii, particularly in the out and longitudinal directions. This phenomenon is more pronounced for a larger transverse pair momentum$ K_T $ . Consequently, the HBT radii do not monotonically decrease with increasing$ K_T $ . This phenomenon is referred to as the non-flow behavior of the HBT radii. The squeezing effect has a slightly greater impact on$ R_o $ ,$ R_s $ , and$ R_l $ at$ T=0.14 $ GeV than at$ T=0.15 $ GeV, and it exerts a greater influence on the values of$ R_o $ ,$ R_s $ , and$ R_l $ of$ D^0 $ $ D^0 $ than those of ϕϕ. Additionally, the squeezing effect is more significant for ϕϕ than for$ K^+ $ $ K^+ $ . The squeezing effect has a greater impact on the three-dimensional radii of the HBT, particularly$ R_o $ and$ R_l $ , for cylinder expansion sources than for one-dimensional radii for spherically symmetric sources.The non-flow behavior of
$ R_o $ and$ R_l $ for$ D^0 $ $ D^0 $ and ϕϕ can be better manifested in the small transverse momentum region than that of$ K^+ $ $ K^+ $ . The non-flow behavior of$ R_o $ and$ R_l $ for$ D^0 $ $ D^0 $ and ϕϕ may be more likely to be measured experimentally than that of$ K^+ $ $ K^+ $ . For small transverse flow, the squeezing effect has a more pronounced influence on the$ R_o $ and$ R_l $ of$ K^+ $ $ K^+ $ than it does for large transverse flow. The non-flow behavior of$ R_o $ and$ R_l $ for$ K^+ $ $ K^+ $ may be observed in the large transverse momentum region for small transverse flow. However, the current transverse momentum range used for measuring the HBT radii of$ K^+ $ $ K^+ $ has not yet reached the region where this non-flow behavior occurs [25−30]. It should be emphasized that the effects demonstrated in this study manifest only when particles undergo in-medium mass modifications. In the absence of such mass modifications, the non-flow behavior signals of the HBT radii will be entirely absent.In this study, the Gaussian form is used in the analysis of the three-dimensional HBT radii. Due to the squeezing effect, the distribution of the source may deviate from a Gaussian form. Studying the effects of the squeezing effect on the source's shape is valuable. For instance, this can be achieved by employing a L
$ \acute{e} $ vy-type form [77−80] to study how the squeezing effect influences both the three-dimensional HBT radii and the source's shape.The cylinder expansion source used in this study is more reasonable compared to the previously utilized spherically symmetric source [16]. The independent transverse spatial distribution and temporal distribution of the cylinder expansion source differs from phyisical conditions. Investigating the influence of the squeezing effect on three-dimensional HBT radii through the utilization of more realistic sources, such as hydrodynamical sources, presents an interesting direction for further exploration.
Squeezing effect on three-dimensional Hanbury Brown-Twiss radii
- Received Date: 2025-03-22
- Available Online: 2025-11-15
Abstract: This study examines the impact of the squeezing effect caused by the in-medium mass modification of particles on the three-dimensional Hanbury Brown-Twiss (HBT) radii. An analysis is conducted on how the squeezing effect impacts the three-dimensional HBT radii of


 DownLoad: