


 Abstract
 HTML
HTML Reference
 Related
 PDF
PDF


-
The rapid neutron-capture process (r-process) is a fundamental mechanism in astrophysical nucleosynthesis that is responsible for producing approximately half of the elements that are heavier than iron. This process occurs in extreme astrophysical environments with high neutron fluxes, enabling nuclei to undergo successive neutron captures before decaying back to stability [1]. Observations of metal-poor stars and meteorites have revealed the characteristic abundance patterns of the r-process, highlighting its crucial role in cosmic chemical evolution [2]. However, despite decades of research, the exact astrophysical sites that are responsible for the r-process remain uncertain.
To unravel the origin of r-process elements, theoretical simulations of the nucleosynthesis process are necessary and rely on two essential input components: astrophysical conditions and nuclear properties. Both aspects introduce significant uncertainties. The astrophysical conditions, such as the neutron flux, expansion timescale, temperature, and density evolution, all affect the nucleosynthesis outcomes [3, 4]. Meanwhile, the nuclear properties of neutron-rich isotopes, such as masses, β-decay rates, neutron capture rates, fission rates, and fission yields, remain largely unmeasured and must be inferred from theoretical models, but these predictions often diverge [5−10]. These uncertainties hinder precise modeling of the r-process and complicate the interpretation of observed abundance patterns.
One unresolved question in r-process nucleosynthesis is the formation mechanism of the rare-earth peak around mass number
$ A \sim 165 $ . Unlike the second and third r-process peaks, which are associated with closed neutron shells, the rare-earth peak is believed to originate from other nuclear structure effects [1, 11, 12]. The rare-earth peak could serve as a diagnostic tool for constraining astrophysical conditions of the r-process if its formation was well understood [13]. However, owing to the large uncertainties in nuclear physics inputs, the abundance patterns obtained from r-process simulations exhibit large variance bands that exceed the peak itself, making it difficult to distinguish the abundance patterns produced by different astrophysical environments [6, 14−16]. To improve the reliability of such constraints, reducing the uncertainties in nuclear physics inputs is necessary.As it is challenging to measure the nuclear properties of a large number of neutron-rich nuclei experimentally, sensitivity studies provide an effective approach to pinpoint the key nuclei that have a significant impact on r-process abundances [6, 14−23]. Previous sensitivity studies have primarily focused on the global effects on the abundance distributions caused by mass variations, whereas the specific nuclei that affect the rare-earth peak formation remain unclear. Hence, we performed sensitivity studies specifically targeting the rare-earth peak formation by individually modifying the nuclear masses in the relevant region. We found that the nuclei that have the most significant influence on the rare-earth peak are mainly distributed in two regions, as previously reported in Ref. [24]. However, in astrophysical scenarios in which a large number of fission events occur, the high sensitivity of nuclei lying along the r-process freeze-out path is diminished.
The present paper accompanies Ref. [24]. In this study, we extended our analysis by focusing on the role of fission in studying the sensitivity of r-process abundances to nuclear masses. We analyzed the reasons for the different distribution patterns of nuclei with high sensitivity under different astrophysical scenarios in detail. Our results highlight the impact of fission in shaping the rare-earth peak abundances and enhance the understanding of the rare-earth peak formation mechanism as well as improve its effectiveness as a diagnostic for the r-process site.
-
The rapid neutron-capture process (r-process) is a fundamental mechanism in astrophysical nucleosynthesis, responsible for producing approximately half of the elements heavier than iron. This process occurs in extreme astrophysical environments with high neutron fluxes, enabling nuclei to undergo successive neutron captures before decaying back to stability [1]. Observations of metal-poor stars and meteorites reveal the characteristic abundance patterns of the r-process, highlighting its crucial role in cosmic chemical evolution [2]. However, despite decades of research, the exact astrophysical sites responsible for the r-process remain uncertain.
To unravel the origin of r-process elements, theoretical simulations of the nucleosynthesis process are necessary and rely on two essential input components: astrophysical conditions and nuclear properties. Both aspects introduce significant uncertainties. The astrophysical conditions, such as neutron flux, expansion timescale, temperature, and density evolution, all affect nucleosynthesis outcomes [3, 4]. Meanwhile, the nuclear properties of neutron-rich isotopes, such as masses, β-decay rates, neutron capture rates, fission rates, and fission yields, remain largely unmeasured and must be inferred from theoretical models, but these predictions often diverge [5−10]. These uncertainties hinder precise modeling of the r-process and complicate the interpretation of observed abundance patterns.
One of the unresolved questions in r-process nucleosynthesis is the formation mechanism of the rare-earth peak around mass number
$ A \sim 165 $ . Unlike the second and third r-process peaks, which are associated with closed neutron shells, the rare-earth peak is thought to originate from other nuclear structure effects [1, 11, 12]. The rare-earth peak could serve as a diagnostic tool for constraining astrophysical conditions of the r-process if its formation were well understood [13]. However, due to the large uncertainties in nuclear physics inputs, the abundance patterns obtained from r-process simulations exhibit large variance bands that exceed the peak itself, making it difficult to distinguish the abundance patterns produced by different astrophysical environments [6, 14−16]. To improve the reliability of such constraints, it is necessary to reduce uncertainties in nuclear physics inputs.Since it is challenging to experimentally measure the nuclear properties of a large number of neutron-rich nuclei, sensitivity studies provide an effective approach to pinpoint the key nuclei that have a significant impact on r-process abundances [6, 14−23]. The previous sensitivity studies have primarily focused on the global effects on the abundance distributions caused by mass variations, while the specific nuclei that affect the rare-earth peak formation remain unclear. So we performed sensitivity studies specifically targeting the rare-earth peak formation by individually modifying nuclear masses in the relevant region. We find the nuclei that have the most significant influence on the rare-earth peak are mainly distributed in two regions, as previously reported in Ref. [24]. However, in the astrophysical scenarios where a large number of fission events occur, the high sensitivity of nuclei lying along the r-process freeze-out path is diminished.
The present paper goes together with Ref. [24]. In this work, we have extended our analysis focusing on the role of fission in the sensitivity study of r-process abundances to nuclear masses. We analyzed in detail the reasons for the different distribution patterns of nuclei with high sensitivity under different astrophysical scenarios. Our results highlight the impact of fission in shaping the rare-earth peak abundances and help to enhance the understanding of the rare-earth peak formation mechanism as well as improve its effectiveness as a diagnostic for the r-process site.
-
The nuclear network NucNet [25] was used to simulate r-process nucleosynthesis. This network includes over 6000 isotopes, covering nuclei with atomic numbers
$ Z\leq102 $ . We obtained the nuclear masses from the finite-range droplet model [26]. The neutron-capture rates were calculated using the publicly available statistical model code TALYS [27]. The β-decay rates were obtained from the JINA REACLIB database [28]. Fission was included as in Ref. [29].The r-process calculations were performed using a parameterized trajectory, as implemented in Refs. [12, 13], in which the density as a function of time is given by
$ \rho(t)=\rho_1\text{exp}(-t/\tau)+\rho_2\left(\frac{\Delta}{\Delta+t}\right)^n, $
(1) where
$ \rho_1+\rho_2 $ is the density at time$ t = 0 $ , τ is the expansion timescale, and ∆ is a constant real number. The parameter n sets the thermodynamic behavior of the evolution at the late stage of the r-process. For this work, we selected three distinct astrophysical scenarios: (1) a hot wind r-process with entropy 150$ k_B $ ,$ Y_e = 0.3 $ ,$ \tau = 20 $ ms, and$ n = 2 $ ; (2) a hot wind r-process with entropy 233$ k_B $ ,$ Y_e = 0.1 $ ,$ \tau = 35 $ ms, and$ n = 2 $ ; and (3) a cold wind r-process with entropy 150$ k_B $ ,$ Y_e = 0.2 $ ,$ \tau = 20 $ ms, and$ n = 6 $ . In all scenarios, nucleosynthesis calculations started at an initial temperature$ T = 10 $ GK. We labeled these three trajectories as hot1, hot2, and cold, respectively.In the hot1 scenario, fission played a negligible role in nucleosynthesis owing to fewer neutrons in the environment, which prevented significant production of fissioning nuclei. In contrast, both the hot2 and cold scenarios enabled the formation of a substantial number of fissioning nuclei, leading to the deposition of numerous fission fragments in the
$ A=110 \sim 170 $ region. This is based on the GEF fission fragment distribution model [30], which predicts that fission yields in the neutron-rich regions exhibit both symmetric and asymmetric components [29, 31]. To isolate the effects of fission without direct contributions from fission fragments to the rare-earth peak, we conducted an additional set of simulations under the cold scenario. In these simulations, we imposed a simple symmetric split for fission product distributions, ensuring that the fission fragments mainly populated the$ A \sim 130 $ peak region instead of the rare-earth peak. This specific set of simulations is referred to as the cold-sym trajectory in the following discussion.Following previous sensitivity studies [14, 18], we varied the mass of a single nucleus by
$ \pm1 $ MeV for 414 nuclei relevant to rare-earth peak formation [12]. For each variation, an abundance pattern was calculated and compared with the baseline using the sensitivity measure F:$ F=100\sum\limits_{A=150}^{178}\frac{\mid Y_{+1}(A)-Y_{\rm{o}ri.}(A)\mid+\mid Y_{-1}(A)-Y_{\rm{o}ri.}(A)\mid}{Y_{\rm{o}ri.}(A)}, $
(2) where
$ Y_{\rm ori.}(A) $ is the baseline abundance, and$ Y_{+1}(A) $ and$ Y_{-1}(A) $ are the abundances of the simulations in which a single nuclear mass is increased or decreased by 1 MeV, respectively. When$ Y_{\rm ori.}(A) $ ,$ Y_{+1}(A) $ , and$ Y_{-1}(A) $ are considered as the final abundances, the corresponding F-values can be found in Ref. [24]. In the present study, we further computed the sensitivity measure$ F_{\rm freeze-out} $ of the abundance distribution at freeze-out with respect to nuclear mass variations, where$ Y_{\rm ori.}(A) $ ,$ Y_{+1}(A) $ , and$ Y_{-1}(A) $ refer to the abundances at the time of the r-process freeze-out. This allowed us to better understand how nuclear mass variations influence the abundance evolution prior to the onset of decay back to stability. -
The nuclear network NucNet [25] was used to simulate r-process nucleosynthesis. This network includes over 6000 isotopes, covering nuclei with atomic numbers
$ Z\leq102 $ . We obtained the nuclear masses from the finite-range droplet model [26]. The neutron-capture rates were calculated using the publicly available statistical model code TALYS [27]. The β-decay rates were obtained from the JINA REACLIB database [28]. Fission was included as in Ref. [29].The r-process calculations were performed using a parameterized trajectory, as implemented in Refs. [12, 13], in which the density as a function of time is given by
$ \rho(t)=\rho_1\text{exp}(-t/\tau)+\rho_2\left(\frac{\Delta}{\Delta+t}\right)^n, $

(1) where
$ \rho_1+\rho_2 $ is the density at time$ t = 0 $ , τ is the expansion timescale, and ∆ is a constant real number. The parameter n sets the thermodynamic behavior of the evolution at the late stage of the r-process. For this work, we selected three distinct astrophysical scenarios: (1) a hot wind r-process with entropy 150$ k_B $ ,$ Y_e = 0.3 $ ,$ \tau = 20 $ ms, and$ n = 2 $ ; (2) a hot wind r-process with entropy 233$ k_B $ ,$ Y_e = 0.1 $ ,$ \tau = 35 $ ms, and$ n = 2 $ ; and (3) a cold wind r-process with entropy 150$ k_B $ ,$ Y_e = 0.2 $ ,$ \tau = 20 $ ms, and$ n = 6 $ . In all scenarios, nucleosynthesis calculations started at an initial temperature$ T = 10 $ GK. We labeled these three trajectories as hot1, hot2, and cold, respectively.In the hot1 scenario, fission played a negligible role in nucleosynthesis owing to fewer neutrons in the environment, which prevented significant production of fissioning nuclei. In contrast, both the hot2 and cold scenarios enabled the formation of a substantial number of fissioning nuclei, leading to the deposition of numerous fission fragments in the
$ A=110 \sim 170 $ region. This is based on the GEF fission fragment distribution model [30], which predicts that fission yields in the neutron-rich regions exhibit both symmetric and asymmetric components [29, 31]. To isolate the effects of fission without direct contributions from fission fragments to the rare-earth peak, we conducted an additional set of simulations under the cold scenario. In these simulations, we imposed a simple symmetric split for fission product distributions, ensuring that the fission fragments mainly populated the$ A \sim 130 $ peak region instead of the rare-earth peak. This specific set of simulations is referred to as the cold-sym trajectory in the following discussion.Following previous sensitivity studies [14, 18], we varied the mass of a single nucleus by
$ \pm1 $ MeV for 414 nuclei relevant to rare-earth peak formation [12]. For each variation, an abundance pattern was calculated and compared with the baseline using the sensitivity measure F:$ F=100\sum\limits_{A=150}^{178}\frac{\mid Y_{+1}(A)-Y_{\rm{o}ri.}(A)\mid+\mid Y_{-1}(A)-Y_{\rm{o}ri.}(A)\mid}{Y_{\rm{o}ri.}(A)}, $

(2) where
$ Y_{\rm ori.}(A) $ is the baseline abundance, and$ Y_{+1}(A) $ and$ Y_{-1}(A) $ are the abundances of the simulations in which a single nuclear mass is increased or decreased by 1 MeV, respectively. When$ Y_{\rm ori.}(A) $ ,$ Y_{+1}(A) $ , and$ Y_{-1}(A) $ are considered as the final abundances, the corresponding F-values can be found in Ref. [24]. In the present study, we further computed the sensitivity measure$ F_{\rm freeze-out} $ of the abundance distribution at freeze-out with respect to nuclear mass variations, where$ Y_{\rm ori.}(A) $ ,$ Y_{+1}(A) $ , and$ Y_{-1}(A) $ refer to the abundances at the time of the r-process freeze-out. This allowed us to better understand how nuclear mass variations influence the abundance evolution prior to the onset of decay back to stability. -
The nuclear network NucNet [25] was used to simulate r-process nucleosynthesis. This network includes over 6000 isotopes, covering nuclei with atomic numbers
$ Z\leq102 $ . We obtained the nuclear masses from the finite-range droplet model [26]. The neutron-capture rates were calculated using the publicly available statistical model code TALYS [27]. The β-decay rates were obtained from the JINA REACLIB database [28]. Fission was included as in Ref. [29].The r-process calculations were performed using a parameterized trajectory, as implemented in Refs. [12, 13], in which the density as a function of time is given by
$ \rho(t)=\rho_1\text{exp}(-t/\tau)+\rho_2\left(\frac{\Delta}{\Delta+t}\right)^n, $
(1) where
$ \rho_1+\rho_2 $ is the density at time$ t = 0 $ , τ is the expansion timescale, and ∆ is a constant real number. The parameter n sets the thermodynamic behavior of the evolution at the late stage of the r-process. For this work, we selected three distinct astrophysical scenarios: (1) a hot wind r-process with entropy 150$ k_B $ ,$ Y_e = 0.3 $ ,$ \tau = 20 $ ms, and$ n = 2 $ ; (2) a hot wind r-process with entropy 233$ k_B $ ,$ Y_e = 0.1 $ ,$ \tau = 35 $ ms, and$ n = 2 $ ; and (3) a cold wind r-process with entropy 150$ k_B $ ,$ Y_e = 0.2 $ ,$ \tau = 20 $ ms, and$ n = 6 $ . In all scenarios, nucleosynthesis calculations started at an initial temperature$ T = 10 $ GK. We labeled these three trajectories as hot1, hot2, and cold, respectively.In the hot1 scenario, fission played a negligible role in nucleosynthesis owing to fewer neutrons in the environment, which prevented significant production of fissioning nuclei. In contrast, both the hot2 and cold scenarios enabled the formation of a substantial number of fissioning nuclei, leading to the deposition of numerous fission fragments in the
$ A=110 \sim 170 $ region. This is based on the GEF fission fragment distribution model [30], which predicts that fission yields in the neutron-rich regions exhibit both symmetric and asymmetric components [29, 31]. To isolate the effects of fission without direct contributions from fission fragments to the rare-earth peak, we conducted an additional set of simulations under the cold scenario. In these simulations, we imposed a simple symmetric split for fission product distributions, ensuring that the fission fragments mainly populated the$ A \sim 130 $ peak region instead of the rare-earth peak. This specific set of simulations is referred to as the cold-sym trajectory in the following discussion.Following previous sensitivity studies [14, 18], we varied the mass of a single nucleus by
$ \pm1 $ MeV for 414 nuclei relevant to rare-earth peak formation [12]. For each variation, an abundance pattern was calculated and compared with the baseline using the sensitivity measure F:$ F=100\sum\limits_{A=150}^{178}\frac{\mid Y_{+1}(A)-Y_{\rm{o}ri.}(A)\mid+\mid Y_{-1}(A)-Y_{\rm{o}ri.}(A)\mid}{Y_{\rm{o}ri.}(A)}, $
(2) where
$ Y_{\rm ori.}(A) $ is the baseline abundance, and$ Y_{+1}(A) $ and$ Y_{-1}(A) $ are the abundances of the simulations in which a single nuclear mass is increased or decreased by 1 MeV, respectively. When$ Y_{\rm ori.}(A) $ ,$ Y_{+1}(A) $ , and$ Y_{-1}(A) $ are considered as the final abundances, the corresponding F-values can be found in Ref. [24]. In the present study, we further computed the sensitivity measure$ F_{\rm freeze-out} $ of the abundance distribution at freeze-out with respect to nuclear mass variations, where$ Y_{\rm ori.}(A) $ ,$ Y_{+1}(A) $ , and$ Y_{-1}(A) $ refer to the abundances at the time of the r-process freeze-out. This allowed us to better understand how nuclear mass variations influence the abundance evolution prior to the onset of decay back to stability. -
The nuclear network NucNet [25] was used to simulate r-process nucleosynthesis. This network includes more than 6000 isotopes, covering nuclei with atomic number
$ Z\leq102 $ . We take nuclear masses from the finite-range droplet model (FRDM) [26]. The neutron-capture rates are calculated with the publicly available statistical model code TALYS [27]. The β-decay rates are taken from the JINA REACLIB database [28]. Fission is included as in Ref. [29].The r-process calculations were performed using a parameterized trajectory as implemented in Refs. [12, 13], where the density as a function of time is given by:
$ \rho(t)=\rho_1\text{exp}(-t/\tau)+\rho_2\left(\frac{\Delta}{\Delta+t}\right)^n $
(1) where
$ \rho_1+\rho_2 $ is the density at time$ t = 0 $ , τ is the expansion timescale, and ∆ is a constant real number. The parameter n sets the thermodynamic behavior of the evolution at the late time of the r-process. For this work, we chose three distinct astrophysical scenarios: (1) a hot wind r-process with entropy 150$ k_B $ ,$ Y_e = 0.3 $ ,$ \tau = 20 $ ms, and$ n = 2 $ , (2) a hot wind r-process with entropy 233$ k_B $ ,$ Y_e = 0.1 $ ,$ \tau = 35 $ ms, and$ n = 2 $ , and (3) a cold wind r-process with entropy 150$ k_B $ ,$ Y_e = 0.2 $ ,$ \tau = 20 $ ms, and$ n = 6 $ . In all scenarios, nucleosynthesis calculations start at an initial temperature$ T = 10 $ GK. We label these three trajectories as hot1, hot2, and cold, respectively.In the hot1 scenario, fission plays a negligible role in nucleosynthesis due to fewer neutrons in the environment, which prevents significant production of fissioning nuclei. In contrast, both the hot2 and cold scenarios enable the formation of a substantial number of fissioning nuclei, leading to the deposition of numerous fission fragments in the
$ A=110 \sim 170 $ region. This is based on the GEF fission fragment distribution model [30], which predicts that fission yields in the neutron-rich regions exhibit both symmetric and asymmetric components [29, 31]. To isolate the effects of fission without direct contributions from fission fragments to the rare-earth peak, we conducted an additional set of simulations under the cold scenario. In these simulations, we imposed a simple symmetric split for fission product distributions, ensuring that the fission fragments mainly populate the$ A \sim 130 $ peak region instead of the rare-earth peak. This specific set of simulations is referred to as the cold-sym trajectory in the following discussion.Following previous sensitivity studies [14, 18], we vary the mass of a single nucleus by
$ \pm1 $ MeV for 414 nuclei relevant to rare-earth peak formation [12]. For each variation, an abundance pattern is calculated and compared to the baseline using the sensitivity measure F,$ F=100\sum \limits_{A=150}^{178}\frac{\mid Y_{+1}(A)-Y_{ori.}(A)\mid+\mid Y_{-1}(A)-Y_{ori.}(A)\mid}{Y_{ori.}(A)}. $
(2) $ Y_{ori.}(A) $ is the baseline abundance, and$ Y_{+1}(A) $ and$ Y_{-1}(A) $ are the abundances of the simulations where a single nuclear mass is increased or decreased by 1 MeV, respectively. When$ Y_{ori.}(A) $ ,$ Y_{+1}(A) $ , and$ Y_{-1}(A) $ are taken as the final abundances, the corresponding F-values can be found in Ref. [24]. In the present work, we further compute the sensitivity measure$ F_{freeze-out} $ of the abundance distribution at freeze-out with respect to nuclear mass variations, where$ Y_{ori.}(A) $ ,$ Y_{+1}(A) $ , and$ Y_{-1}(A) $ refer to the abundances at the time of r-process freeze-out. This allows us to better understand how nuclear mass variations influence the abundance evolution prior to the onset of decay back to stability. -
The nuclear network NucNet [25] was used to simulate r-process nucleosynthesis. This network includes over 6000 isotopes, covering nuclei with atomic numbers
$ Z\leq102 $ . We obtained the nuclear masses from the finite-range droplet model [26]. The neutron-capture rates were calculated using the publicly available statistical model code TALYS [27]. The β-decay rates were obtained from the JINA REACLIB database [28]. Fission was included as in Ref. [29].The r-process calculations were performed using a parameterized trajectory, as implemented in Refs. [12, 13], in which the density as a function of time is given by
$ \rho(t)=\rho_1\text{exp}(-t/\tau)+\rho_2\left(\frac{\Delta}{\Delta+t}\right)^n, $
(1) where
$ \rho_1+\rho_2 $ is the density at time$ t = 0 $ , τ is the expansion timescale, and ∆ is a constant real number. The parameter n sets the thermodynamic behavior of the evolution at the late stage of the r-process. For this work, we selected three distinct astrophysical scenarios: (1) a hot wind r-process with entropy 150$ k_B $ ,$ Y_e = 0.3 $ ,$ \tau = 20 $ ms, and$ n = 2 $ ; (2) a hot wind r-process with entropy 233$ k_B $ ,$ Y_e = 0.1 $ ,$ \tau = 35 $ ms, and$ n = 2 $ ; and (3) a cold wind r-process with entropy 150$ k_B $ ,$ Y_e = 0.2 $ ,$ \tau = 20 $ ms, and$ n = 6 $ . In all scenarios, nucleosynthesis calculations started at an initial temperature$ T = 10 $ GK. We labeled these three trajectories as hot1, hot2, and cold, respectively.In the hot1 scenario, fission played a negligible role in nucleosynthesis owing to fewer neutrons in the environment, which prevented significant production of fissioning nuclei. In contrast, both the hot2 and cold scenarios enabled the formation of a substantial number of fissioning nuclei, leading to the deposition of numerous fission fragments in the
$ A=110 \sim 170 $ region. This is based on the GEF fission fragment distribution model [30], which predicts that fission yields in the neutron-rich regions exhibit both symmetric and asymmetric components [29, 31]. To isolate the effects of fission without direct contributions from fission fragments to the rare-earth peak, we conducted an additional set of simulations under the cold scenario. In these simulations, we imposed a simple symmetric split for fission product distributions, ensuring that the fission fragments mainly populated the$ A \sim 130 $ peak region instead of the rare-earth peak. This specific set of simulations is referred to as the cold-sym trajectory in the following discussion.Following previous sensitivity studies [14, 18], we varied the mass of a single nucleus by
$ \pm1 $ MeV for 414 nuclei relevant to rare-earth peak formation [12]. For each variation, an abundance pattern was calculated and compared with the baseline using the sensitivity measure F:$ F=100\sum\limits_{A=150}^{178}\frac{\mid Y_{+1}(A)-Y_{\rm{o}ri.}(A)\mid+\mid Y_{-1}(A)-Y_{\rm{o}ri.}(A)\mid}{Y_{\rm{o}ri.}(A)}, $
(2) where
$ Y_{\rm ori.}(A) $ is the baseline abundance, and$ Y_{+1}(A) $ and$ Y_{-1}(A) $ are the abundances of the simulations in which a single nuclear mass is increased or decreased by 1 MeV, respectively. When$ Y_{\rm ori.}(A) $ ,$ Y_{+1}(A) $ , and$ Y_{-1}(A) $ are considered as the final abundances, the corresponding F-values can be found in Ref. [24]. In the present study, we further computed the sensitivity measure$ F_{\rm freeze-out} $ of the abundance distribution at freeze-out with respect to nuclear mass variations, where$ Y_{\rm ori.}(A) $ ,$ Y_{+1}(A) $ , and$ Y_{-1}(A) $ refer to the abundances at the time of the r-process freeze-out. This allowed us to better understand how nuclear mass variations influence the abundance evolution prior to the onset of decay back to stability. -
Previous studies [11, 12] have suggested that the formation of the rare-earth peak occurs during the decay back to stability after the r-process freeze-out. In our earlier work [24], we further clarified that the rare-earth peak forms within the time interval between the r-process freeze-out and the point when the neutron capture timescale (
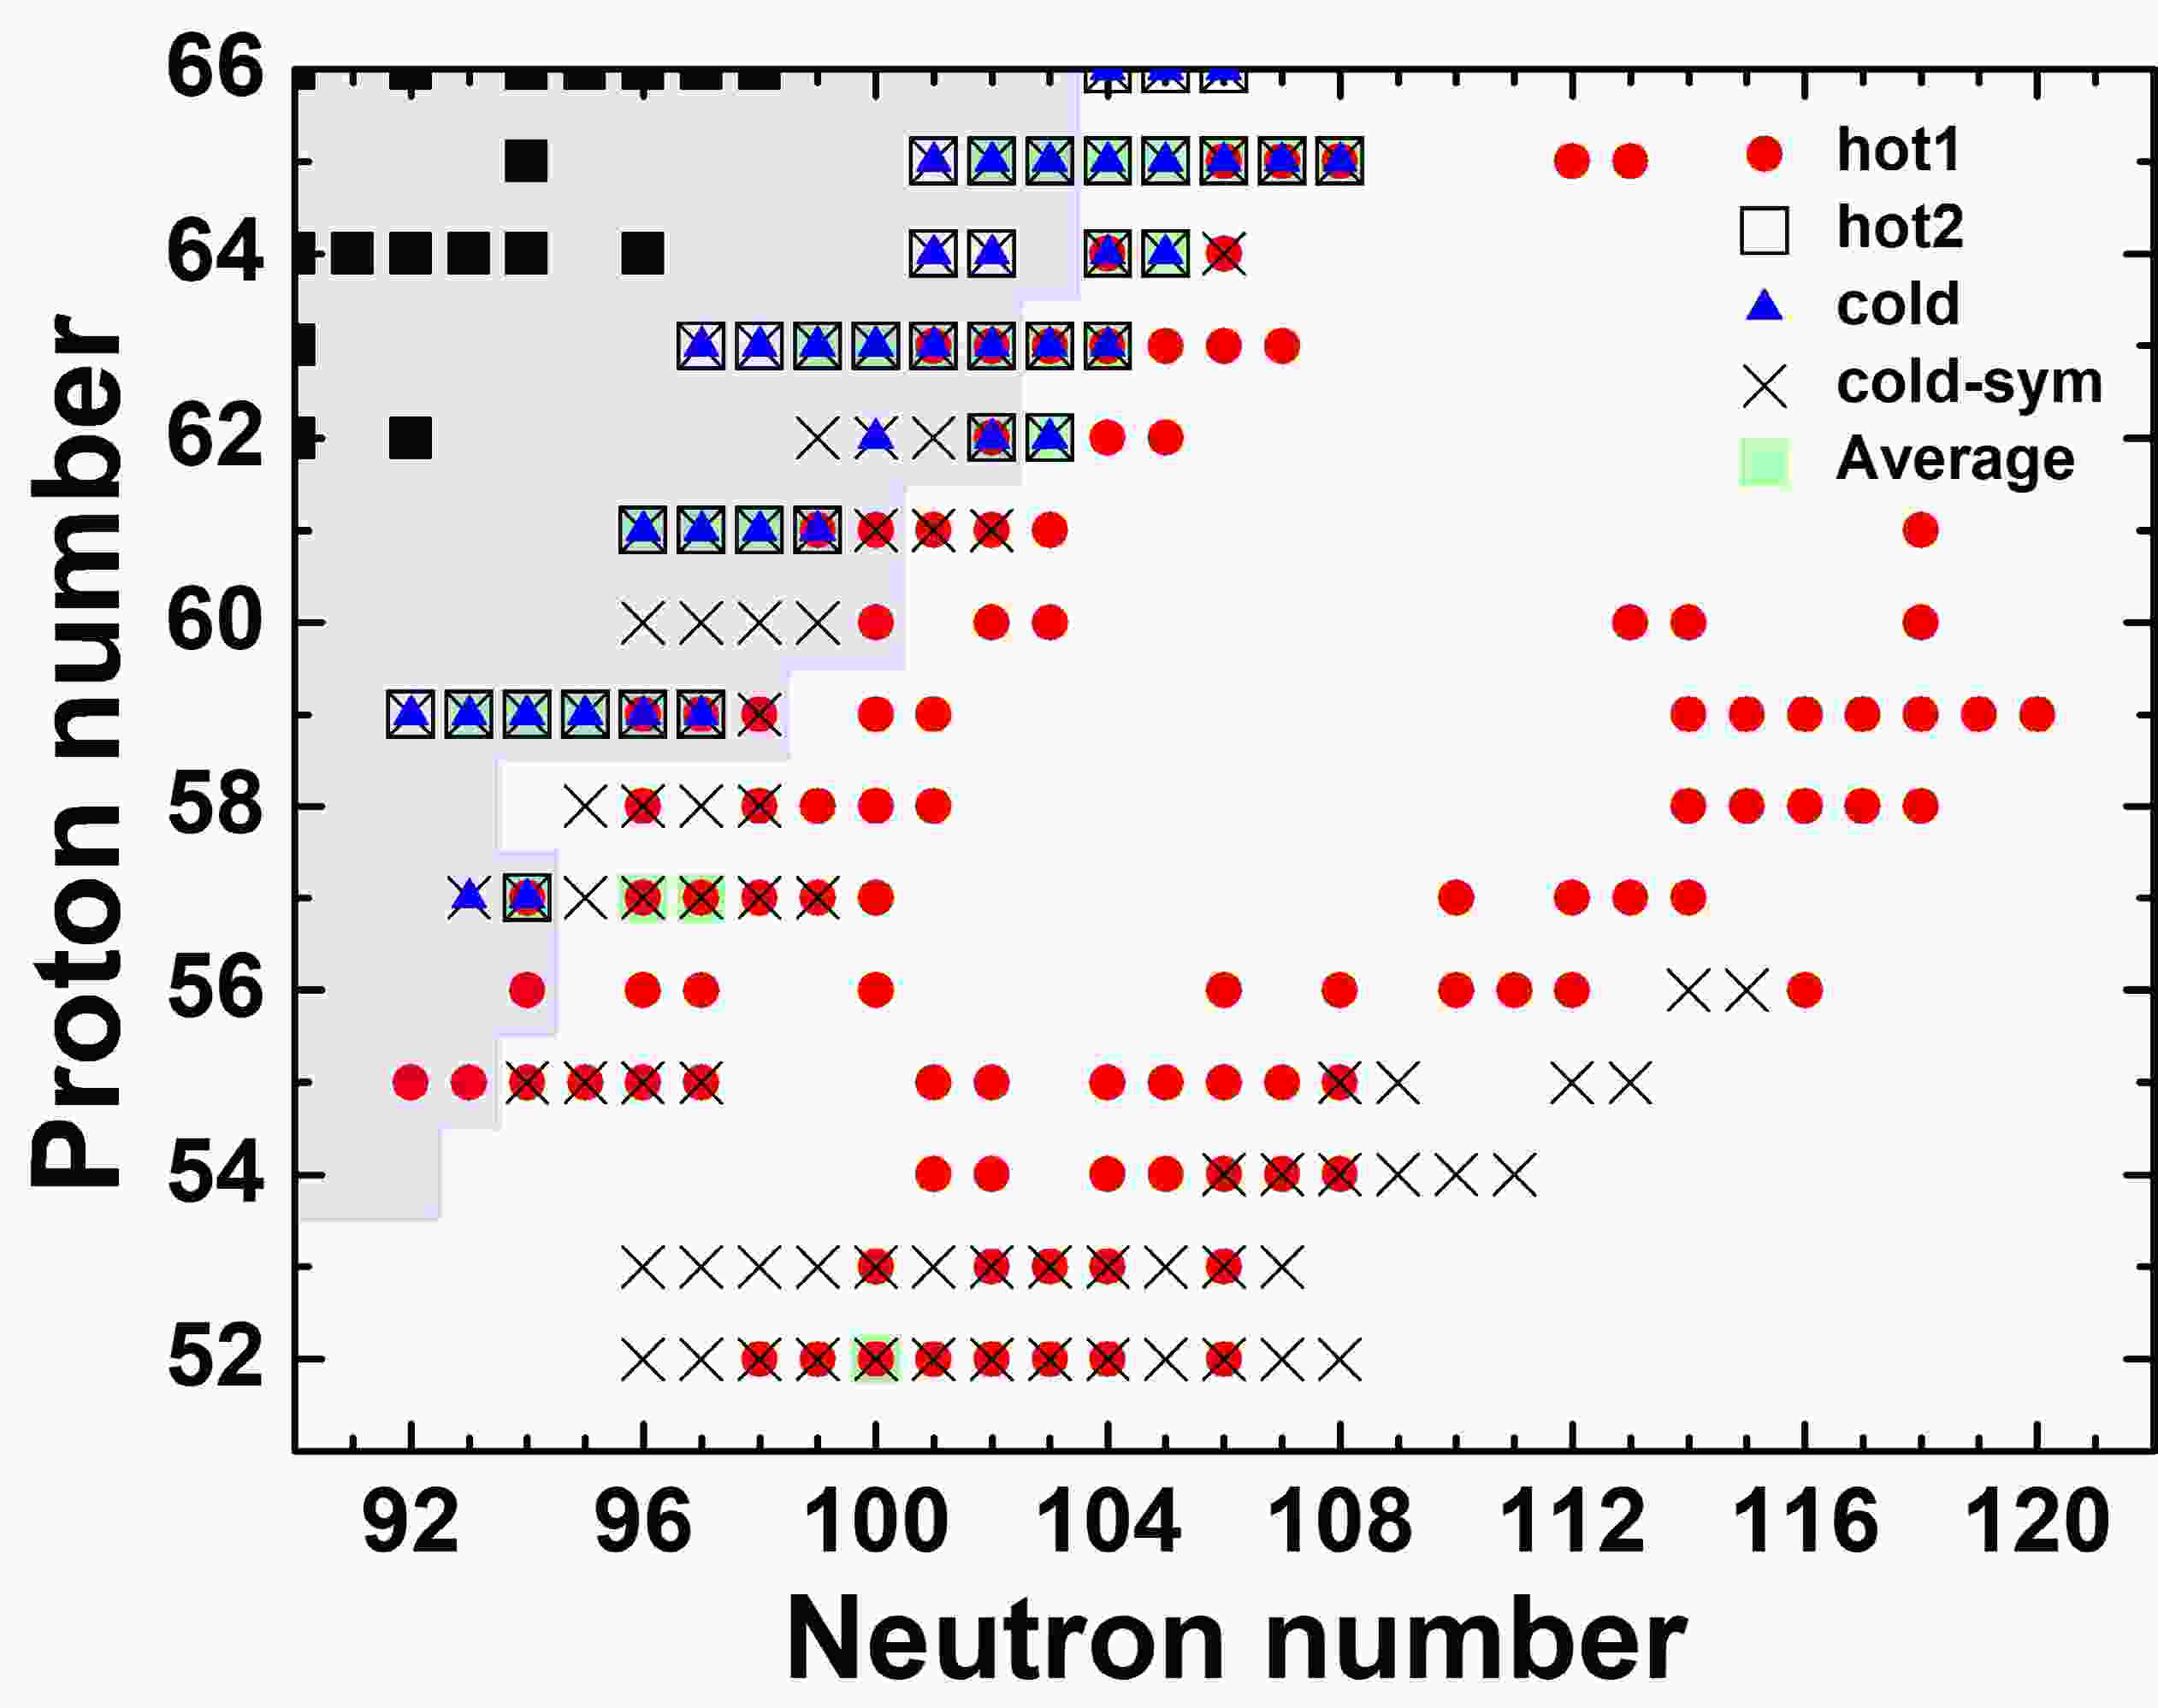
$ \tau_{n\gamma} $ ) becomes approximately three times longer than the β-decay timescale ($ \tau_\beta $ ). At this moment, when$ \tau_{n\gamma} \approx 3\tau_\beta $ , the rare-earth peak abundances are already close to their final values, indicating that the peak has essentially formed. The nuclei that have the most significant influence on the rare-earth peak are mainly distributed in two regions. Region I, located 20−30 neutrons away from stability, corresponds to the position of the nuclear flow at the r-process freeze-out. Region II, 7−15 neutrons away from stability, aligns with the r-process path at the point of$ \tau_{n\gamma} \approx 3\tau_\beta $ .Figure 1 shows the distribution of nuclei with high sensitivity measure F under different astrophysical scenarios, with the sensitivity data in four different scenarios obtained from Ref. [24]. As a supplement to this analysis, we further calculated the average sensitivity measure F across the hot1, hot2, and cold scenarios. The top 30 nuclei with the largest averaged sensitivity F values are listed in Table 1 and indicated by light green shaded squares in Fig. 1. It is evident that the nuclei with the highest averaged sensitivity values were primarily located in region II, because these nuclei exhibited consistently high sensitivity across multiple astrophysical scenarios. In contrast, region I contained only one nucleus,
$ ^{152} {\rm{Te}}$ , with a relatively high averaged sensitivity. Although the sensitivity measure F of$ ^{152} {\rm{Te}}$ was low under the hot2 and cold scenarios, its exceptionally high sensitivity under the hot1 scenario resulted in a large average F value.
Figure 1. (color online) Distribution of nuclei with a sensitivity measure F greater than 200 in the hot1, hot2, cold, and cold-sym scenarios. The region of measured nuclear masses from AME2020 [32] is overlaid with a pink color and the solid black squares are stable isotopes. The data of the sensitivity measure F in four different scenarios were obtained from Ref. [24]. The top 30 nuclei with the largest averaged sensitivity F values across the hot1, hot2, and cold scenarios are indicated by light green shaded squares.
Average Z A F Z A F Z A F Z A F Z A F 64 168 412.73 63 165 348.09* 65 168 301.85* 63 163 273.11* 65 167 233.27* 63 166 396.32 61 159 317.41* 57 153 301.48 59 156 268.38* 52 152 232.14 65 170 386.57 62 164 315.41* 59 155 296.77* 59 154 265.96* 59 152 229.16* 63 164 377.39* 65 172 312.50 65 171 295.67 63 162 259.27* 59 153 222.69* 65 169 376.35 61 158 306.86* 65 173 282.38 57 151 245.65* 62 165 220.96 63 167 349.18 64 169 306.86 57 154 273.65 61 160 240.01* 61 157 220.32* Table 1. The 30 most important nuclei with the highest averaged sensitivity measures F were obtained by averaging the F values across the hot1, hot2, and cold scenarios. An asterisk denotes a nucleus with experimental mass data in the AME2020 mass table [32]. A detailed list of the nuclei with the highest sensitivity under each astrophysical scenario is available in Ref. [24].
In the scenarios considered in this study, the equilibrium phases were maintained at the time of the r-process freeze-out. Thus, the final abundances were expected to be sensitive to changes in the masses of nuclei located along the r-process freeze-out path, as explained in detail in our previous work [24]. However, in the hot2 and cold scenarios, the nuclei in region I exhibited lower F values, indicating that mass variations in this region had little or no impact on the final abundance distribution.
Nevertheless, we found that mass variations of certain nuclei in region I could lead to significant differences in the abundance pattern at the time of the r-process freeze-out, as shown in Fig. 2. We selected two nuclei from region I as examples. In the hot1 scenario, the mass variation of
$ ^{152} {\rm{Te}}$ resulted in a noticeable difference in the abundance distribution at the freeze-out time. In the cold scenario, the mass variation of$ ^{172} {\rm{Ba}}$ also led to significant differences at freeze-out. However, compared with the hot1 case, the overall abundance in the rare-earth peak region was much lower. The situation in the hot2 scenario was similar to that in the cold scenario. To quantify the sensitivity of the abundance distribution at freeze-out time to nuclear masses, we calculated the sensitivity measure$ F_{\rm freeze-out} $ , which reflects how mass variations influence the abundance pattern at freeze-out. The results are presented in Figs. 3 and 4, where the left panels display the sensitivity measures and the right panels present the corresponding abundance distributions at the r-process freeze-out. The results indicate that, in the four considered scenarios, region I corresponded to the region through which the nuclear flow passed at freeze-out. In the cold scenario, the nuclear flow extended farther from stability compared with the hot r-process conditions. It can be clearly observed that nuclei with high sensitivity were distributed along the r-process freeze-out path, implying that mass variations of nuclei in this region strongly impacted the abundance distribution at freeze-out across all four scenarios.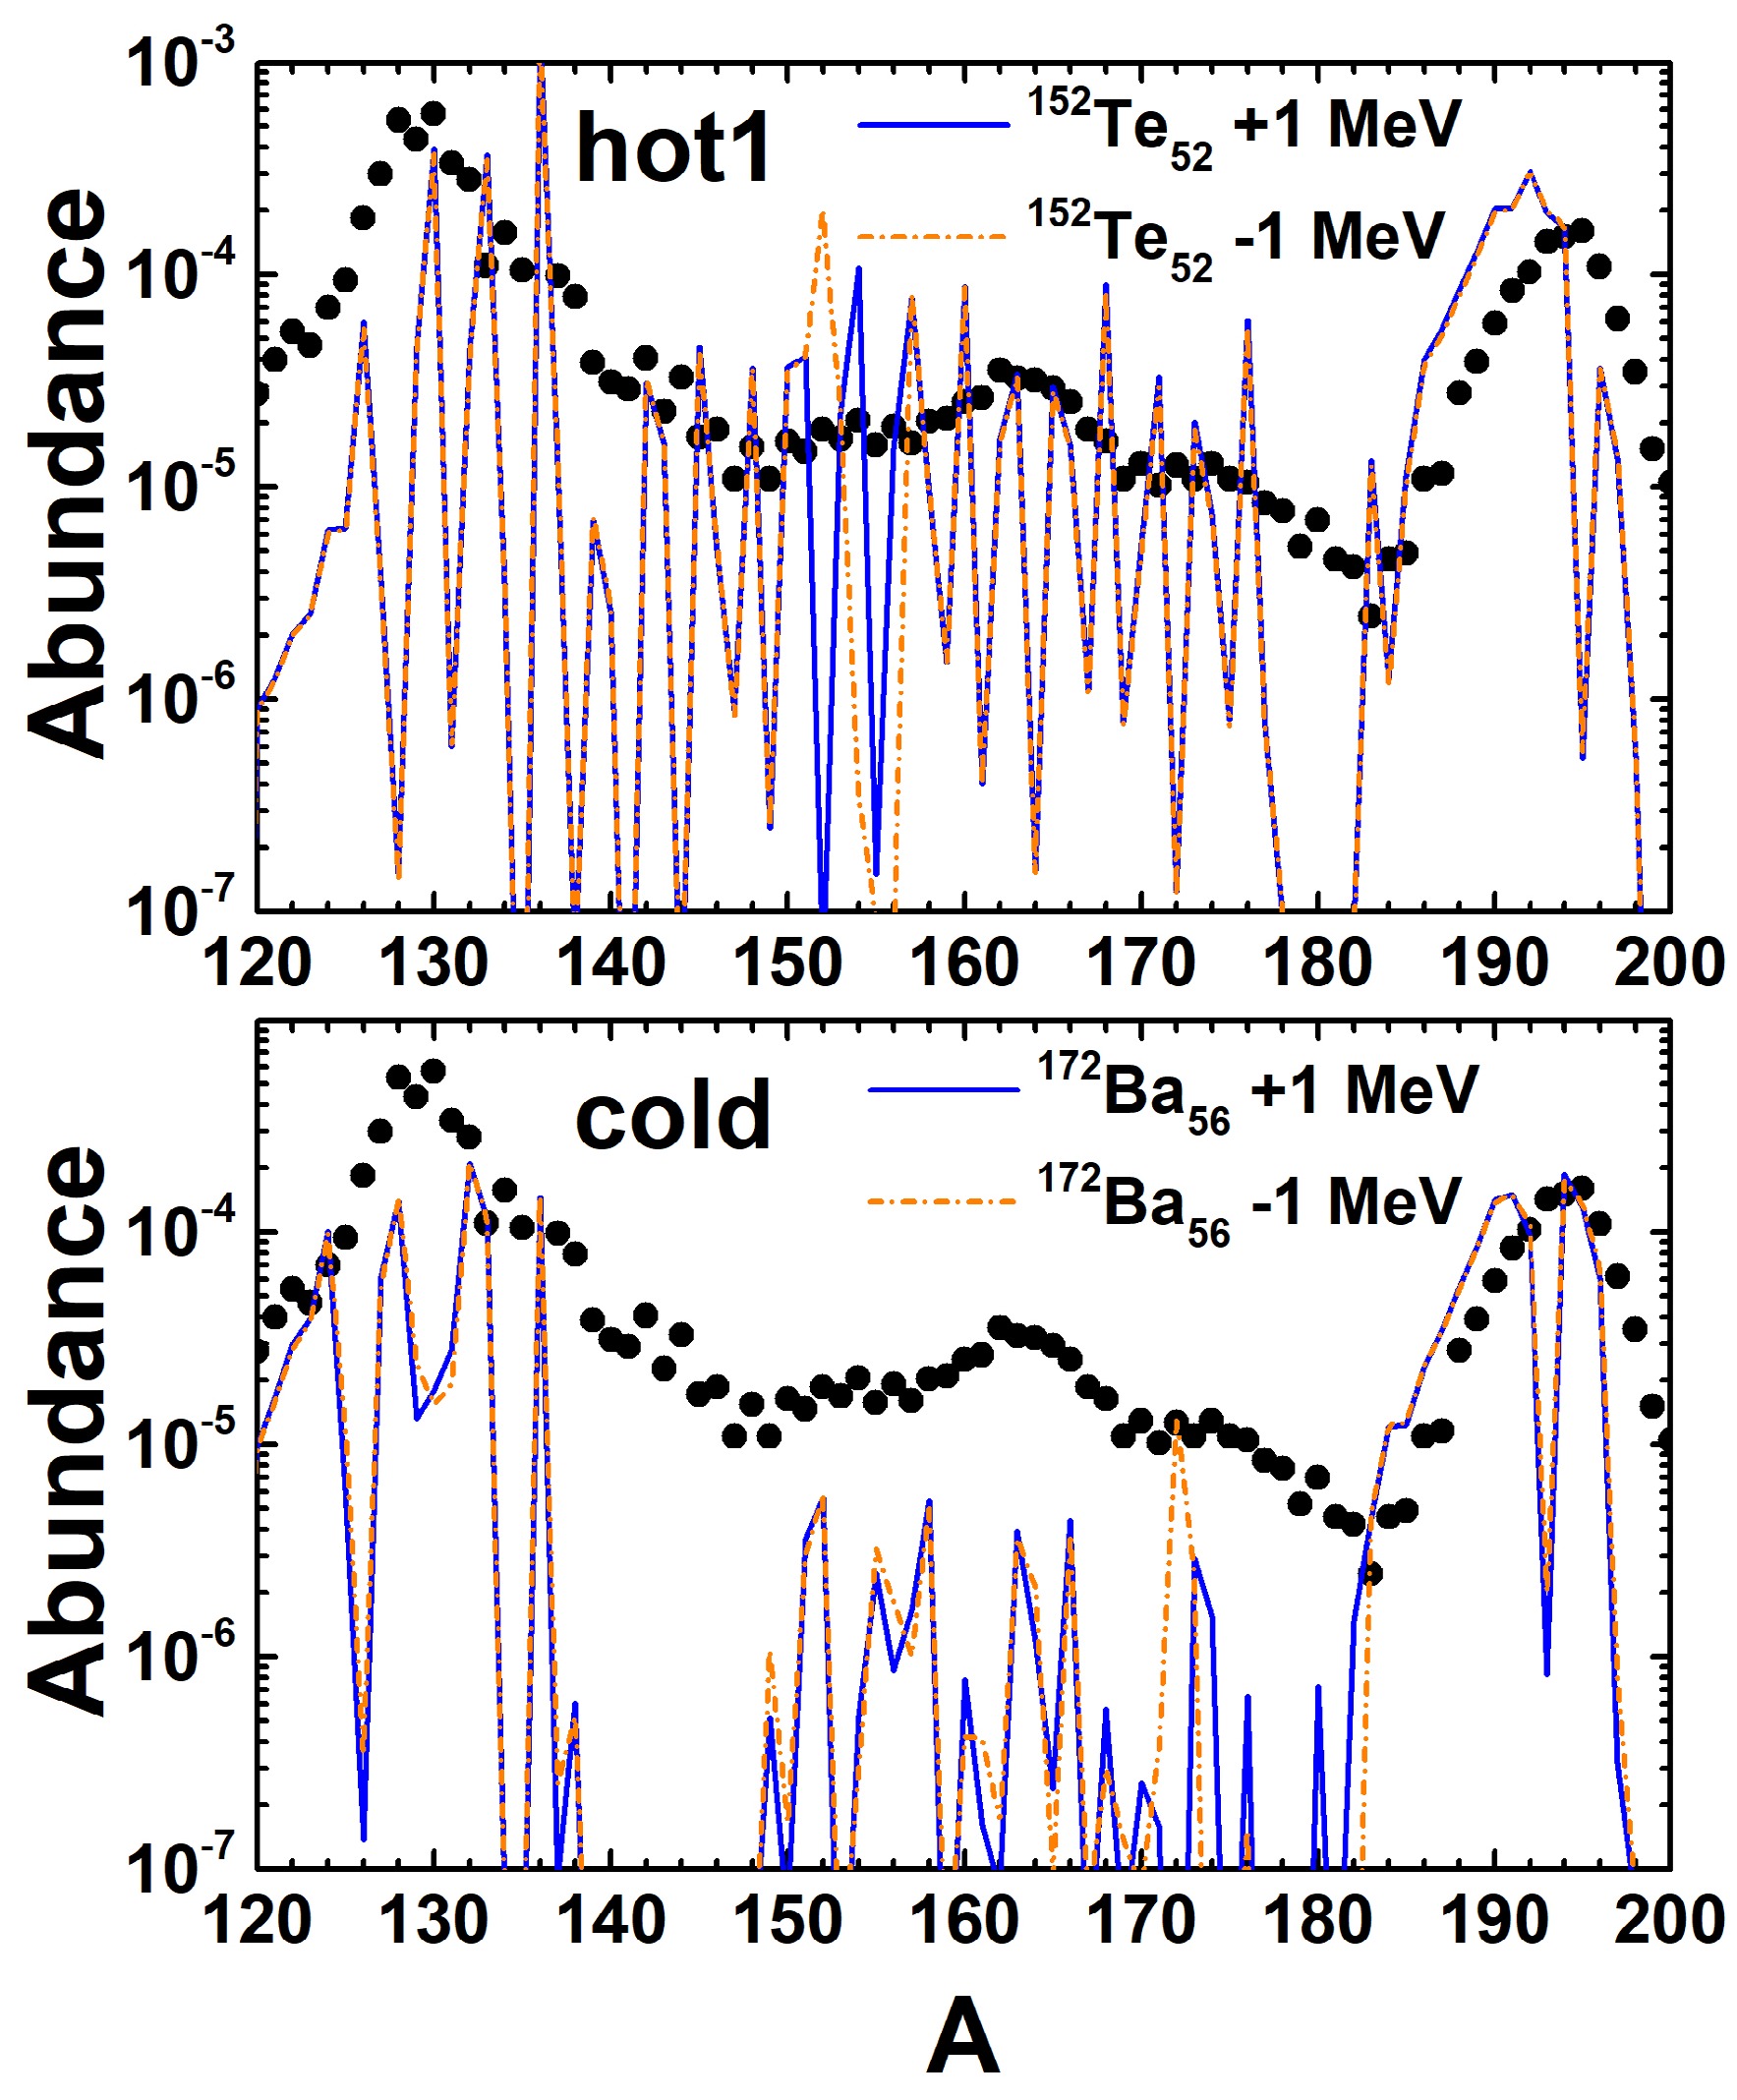
Figure 2. (color online) Abundance distributions at the time of the r-process freeze-out following nuclear mass variation in the hot1 and cold scenarios. The solid blue line represents the abundance distribution resulting from a mass increase of 1 MeV, while the dotted orange line corresponds to the abundance distribution resulting from a mass decrease of 1 MeV. The dots represent the solar r-process abundance pattern [33].
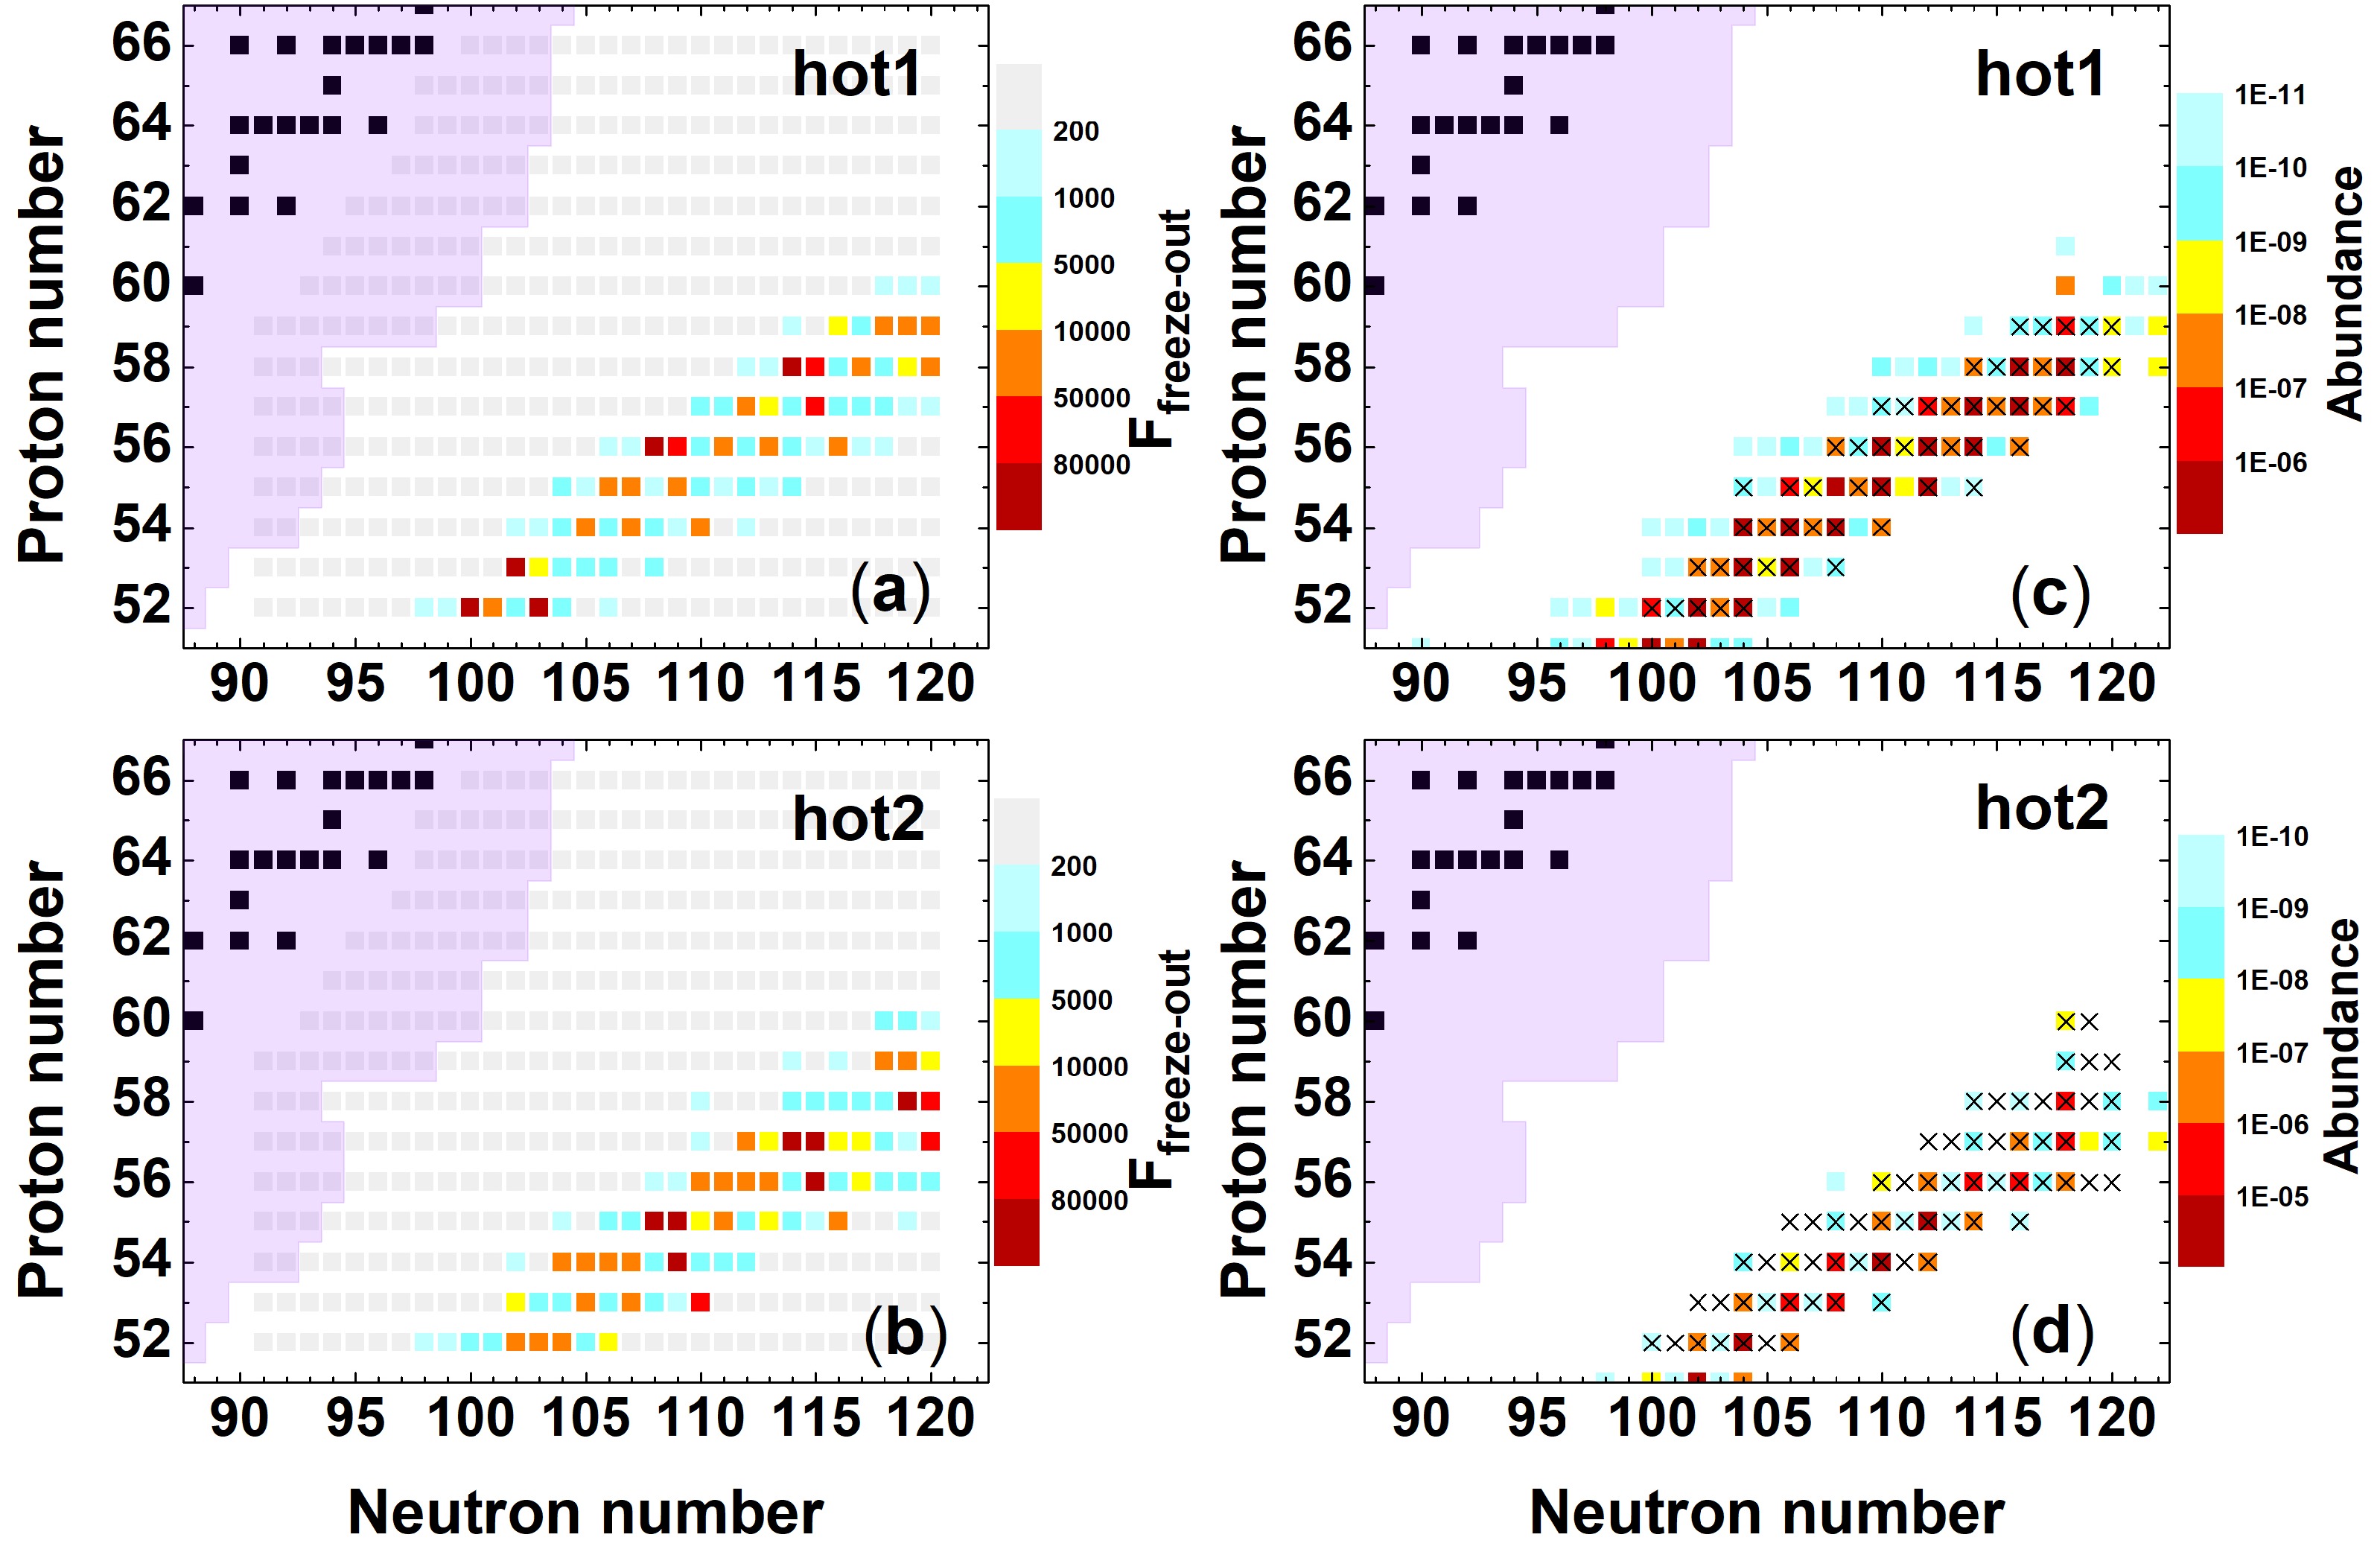
Figure 3. (color online) In the hot1 and hot2 scenarios, panels (a) and (b) correspond to the sensitivity measure
$ F_{\rm freeze-out} $ of the abundance distribution at the r-process freeze-out to nuclear masses, whereas panels (c) and (d) correspond to the abundance distribution patterns at freeze-out. Nuclei with$ F_{\rm freeze-out} $ values greater than 1000 are represented by a cross in panels (c) and (d).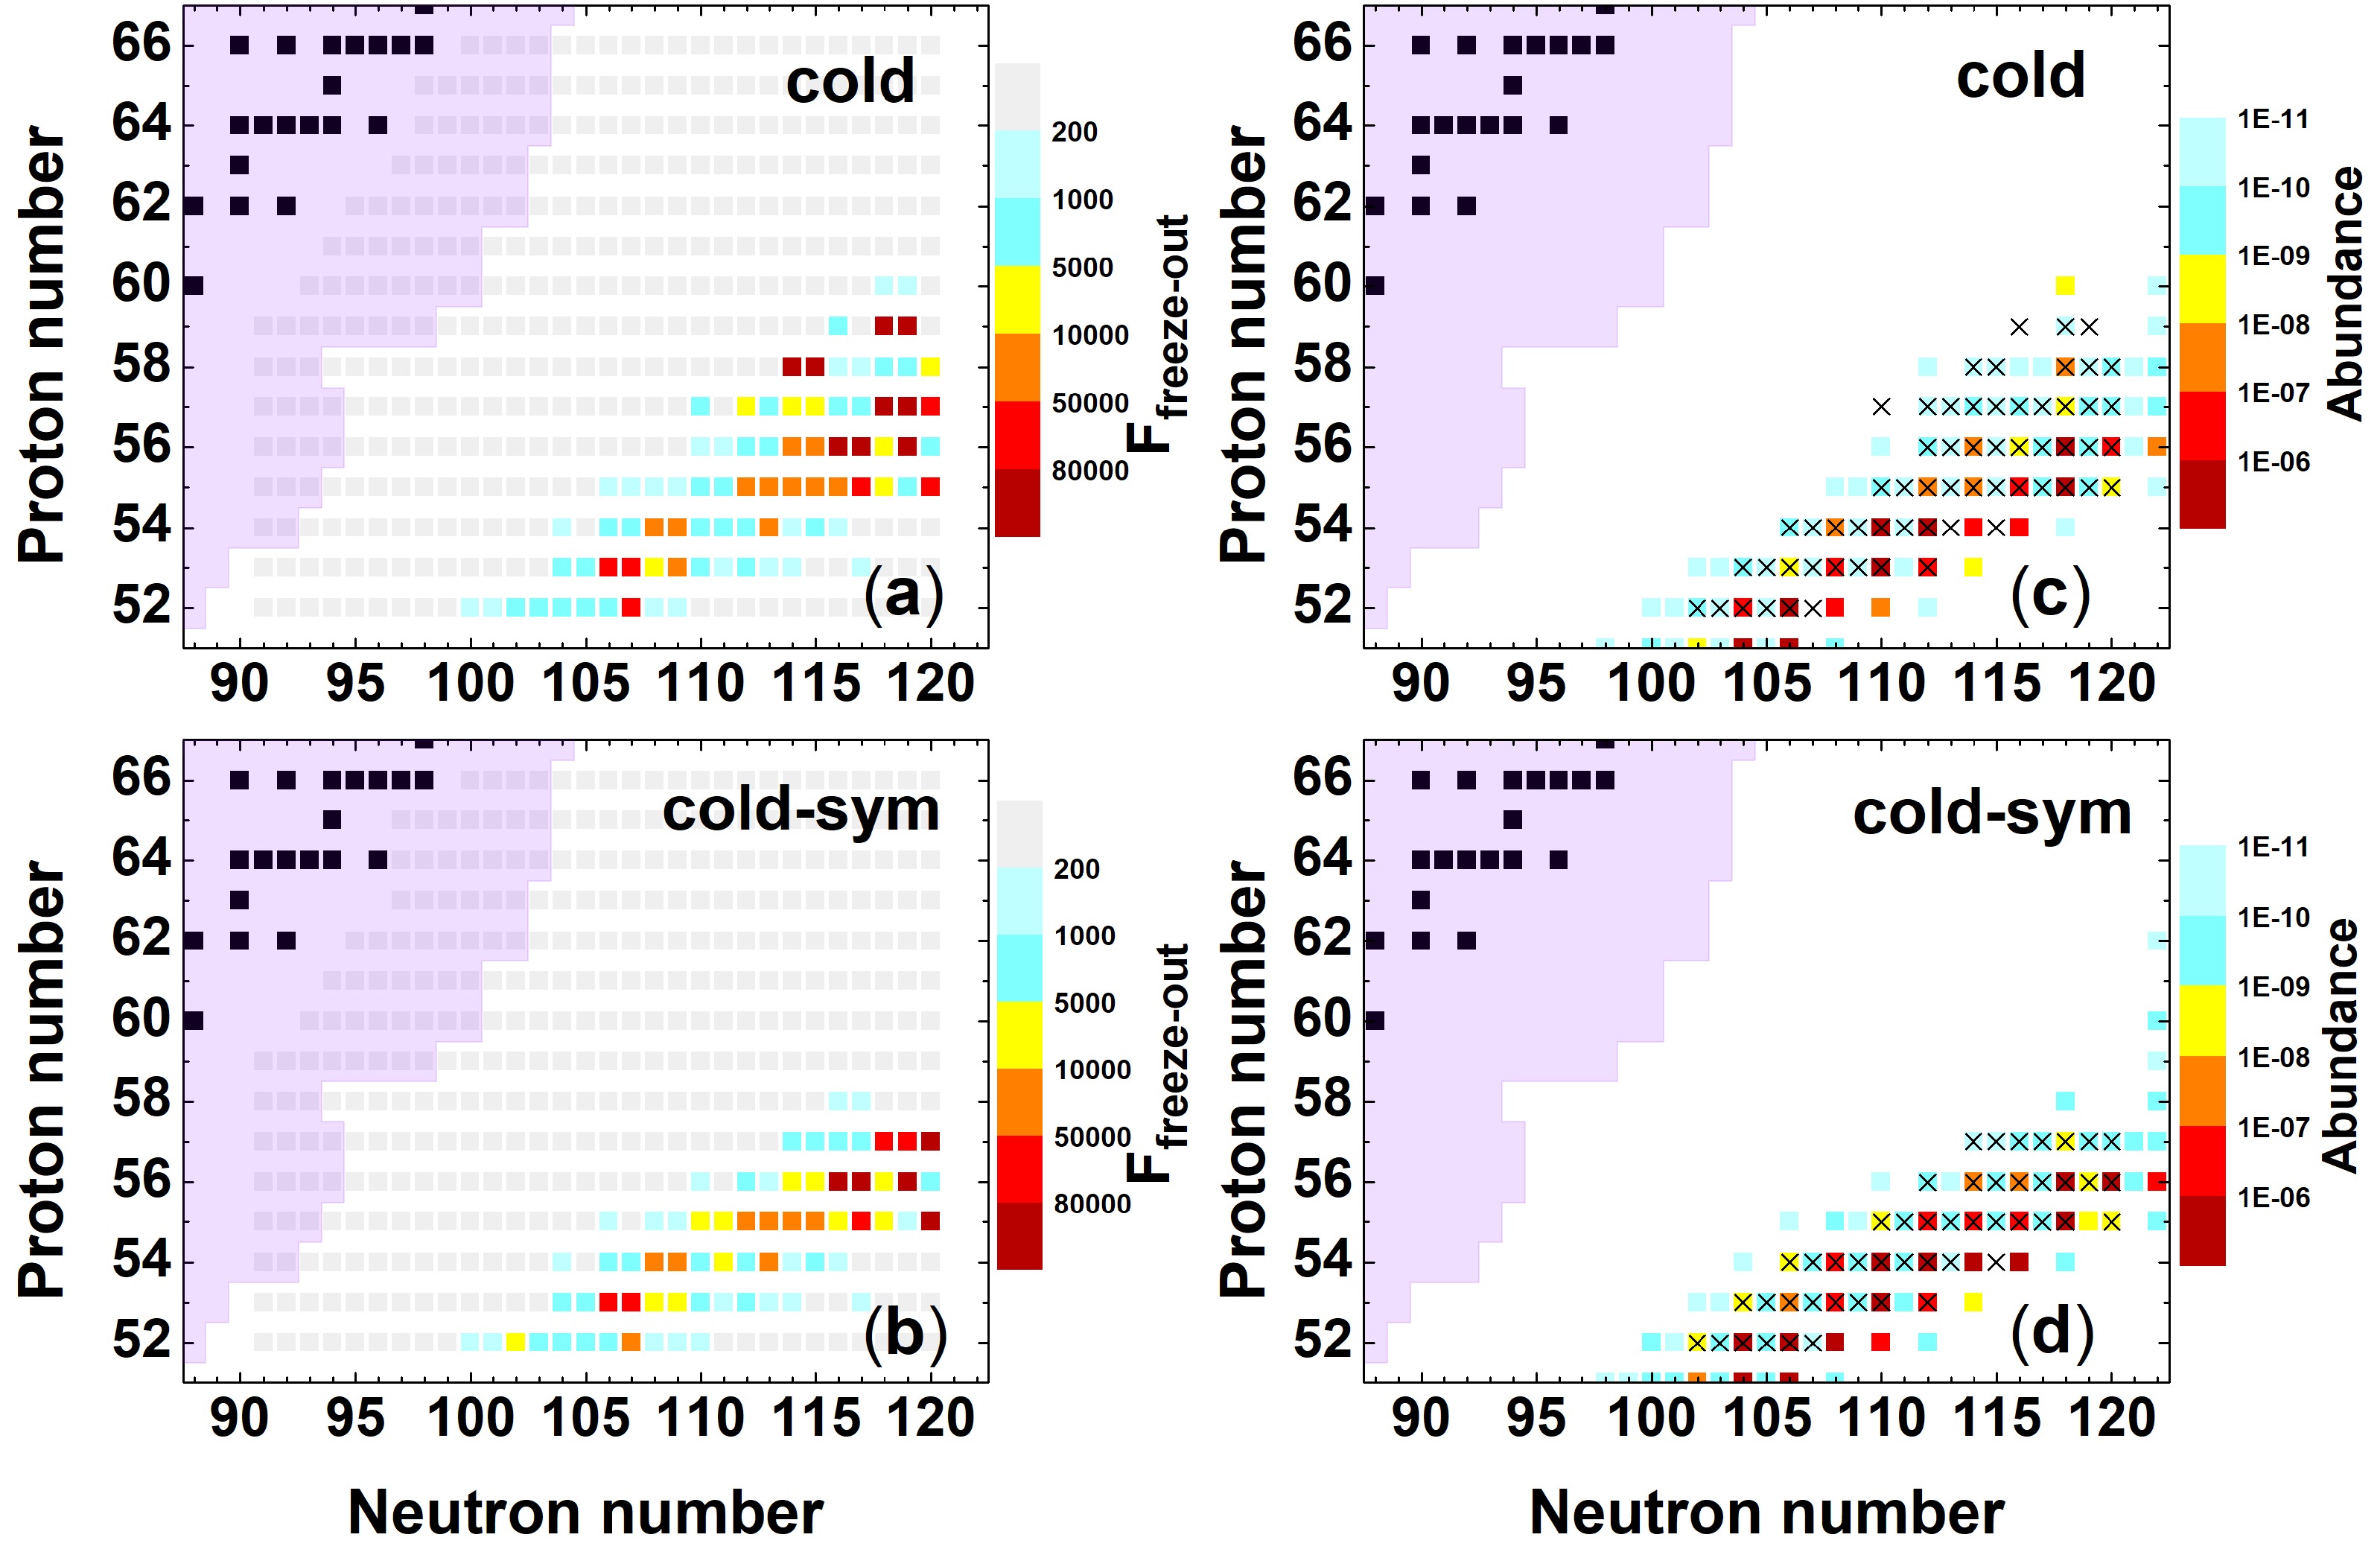
Figure 4. (color online) As in Fig. 3, but with results for the cold and cold-sym scenarios.
In the hot1 scenario, differences in the abundance distribution at freeze-out propagated through the later stage of nucleosynthesis, leading to significant variations in the final abundance pattern. However, in the hot2 and cold scenarios, even though mass variations of certain nuclei in region I caused considerable differences in the abundance distribution at freeze-out, their impact on the final abundance pattern was minimal or negligible. This is primarily owing to the influence of fission fragments, which play an important role in shaping the rare-earth peak abundances. We calculated the contribution of fission products to the abundance in the cold scenario as an example to prove this point, as follows:
$ \Delta Y_{\rm Fragment} (A)= \sum\limits_{n}\sum\limits_{i} f_{i}^{(n)}\times w_i(A). $
(3) We took the integrated fission flow
$ f_{i}^{(n)} $ of a parent nucleus n, multiplied it by the fission yield$ w_i (A) $ of the corresponding fission product with mass number A, and then summed the contributions from all fissioning nuclei, where i refers to a certain fission channel.$ \Delta Y_{\rm Fragment} $ represents the increase in the abundance of nuclei with mass number A owing to fission deposition. Details of the relevant physical quantities can be found in Ref. [29]. The calculated contribution of the fission fragments to the abundance is shown in Fig. 5. The results indicate that when using the GEF model, a significant number of fission fragments were distributed within the rare-earth peak mass region. In the hot2 and cold scenarios, the overall abundance in the rare-earth peak region was very low at freeze-out. However, as nucleosynthesis progresses, a substantial amount of fission fragments was deposited in this region, gradually increasing abundance in the rare-earth region. The contribution of fission fragments diminished the variations in the rare-earth peak abundance distribution that were initially caused by nuclear mass changes. As a result, the impact of mass variations in region I was masked by the distribution of fission fragments, leading to a generally lower sensitivity measure F for nuclei in this region. In contrast, in the cold-sym scenario, where symmetric fission treatment was applied, fission fragments were only deposited near the second r-process peak, as indicated by the blue squares in Fig. 5. In the absence of a direct contribution of fission fragments to the rare-earth region, the differences in the abundance at freeze-out caused by mass variations in region I persisted and ultimately influenced the final rare-earth peak abundance distribution. Thus, the sensitivity of region I increased again. However, the solar rare-earth peak abundance cannot be reproduced using the symmetric fission treatment.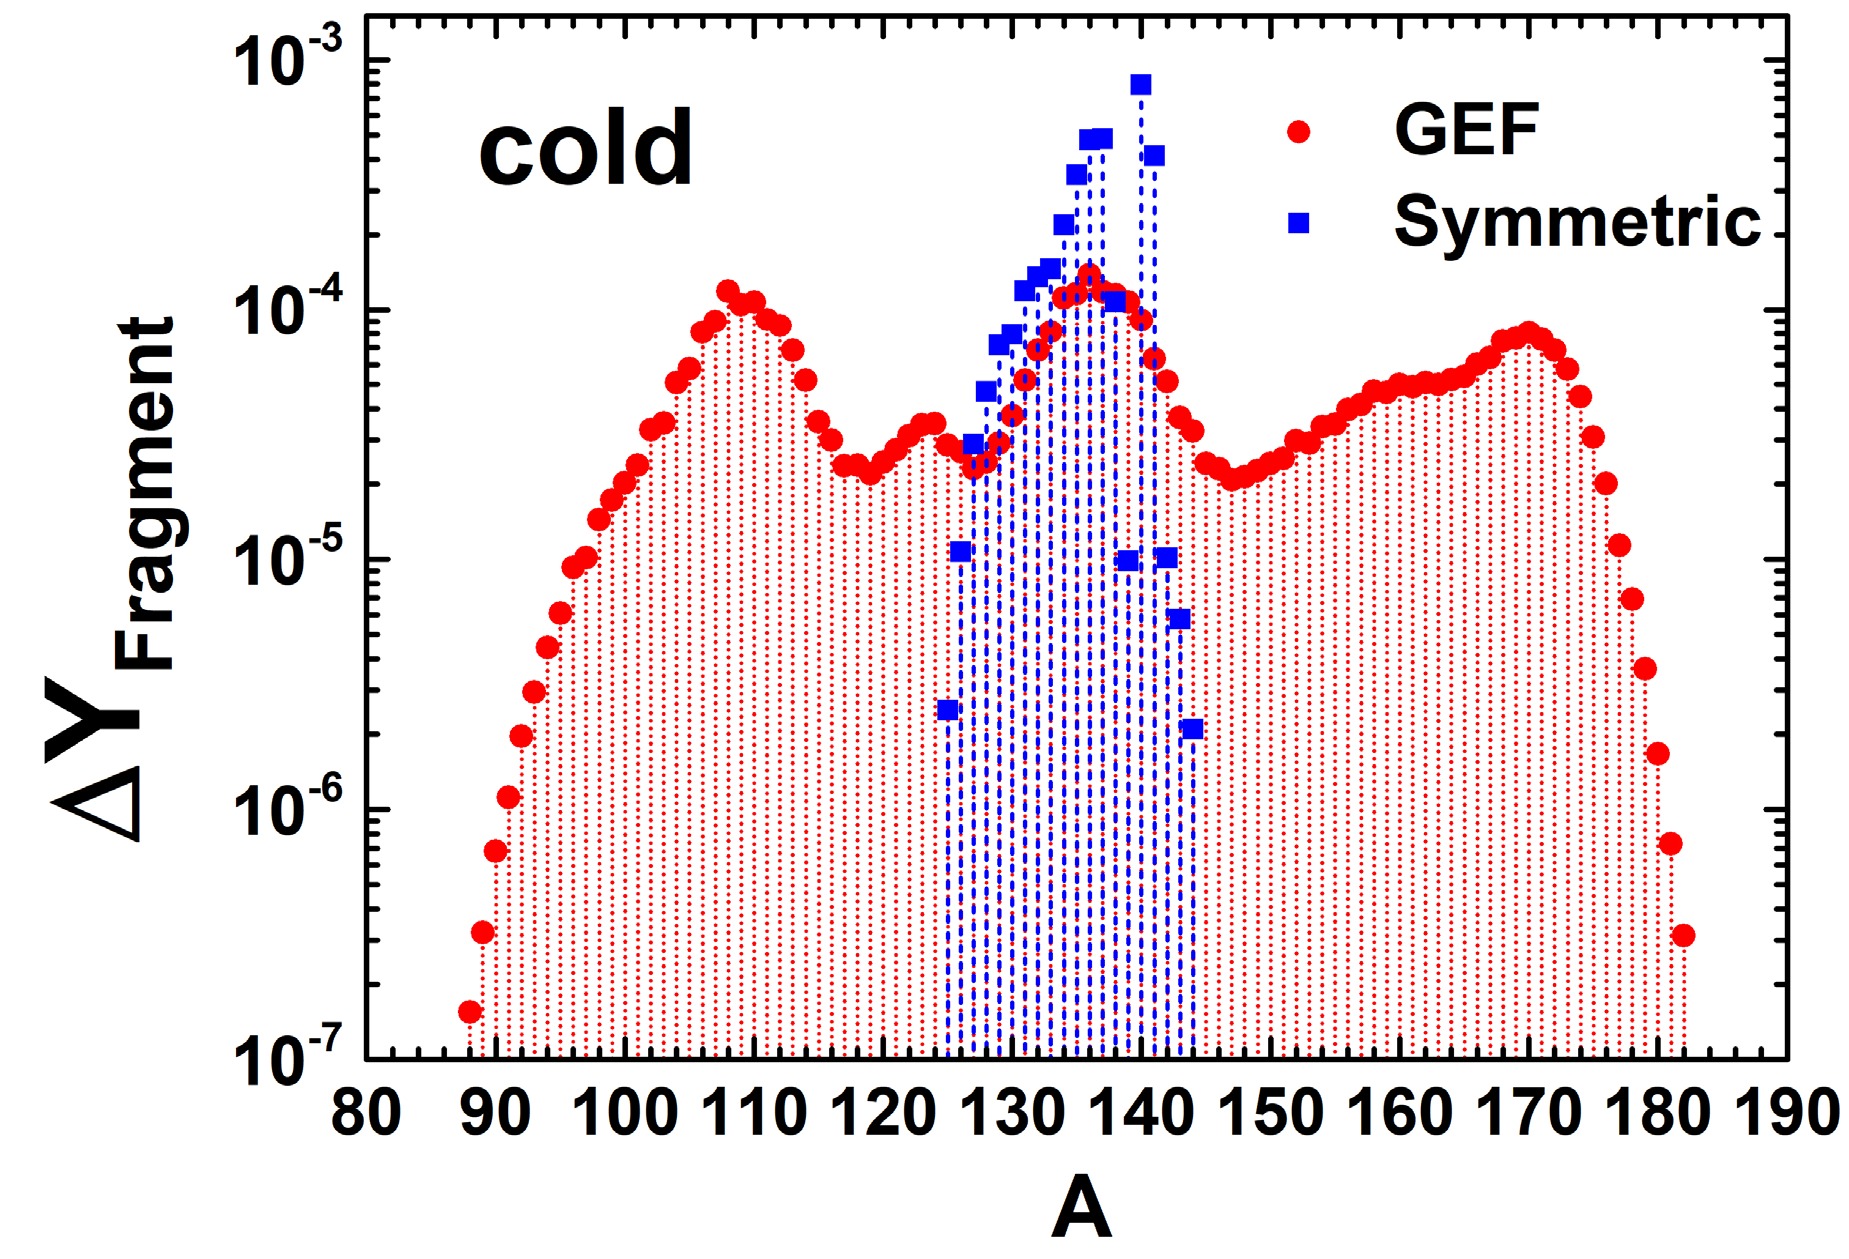
Figure 5. (color online) Contribution of fission fragments to the abundance distribution in the cold scenario. The red dots represent the increase in abundance due to fission deposition when using the GEF fission fragment distribution model, while the blue squares represent the contribution of fission fragments under the simple symmetric fission treatment.
When the r-process nuclear flow reached region II, the rare-earth peak was essentially fully formed, and its shape was highly sensitive to mass variations of nuclei in this region, which were located along the r-process path when
$ \tau_{n\gamma}\approx 3\tau_\beta $ . As mentioned previously, in the hot2 and cold scenarios, the contribution of fission products eliminated the high sensitivity of nuclei along the early r-process path (region I). However, in the process of nuclear flow decay back to stability, the fission flow will gradually decrease over time, which means that the contribution of fission fragments to the rare-earth peak abundance will gradually decrease. We calculated the contribution of fission products to rare-earth peak abundances over time in the cold scenario, as shown in Fig. 6.$ \Delta \mathrm{Y}_{F}(t) $ is defined as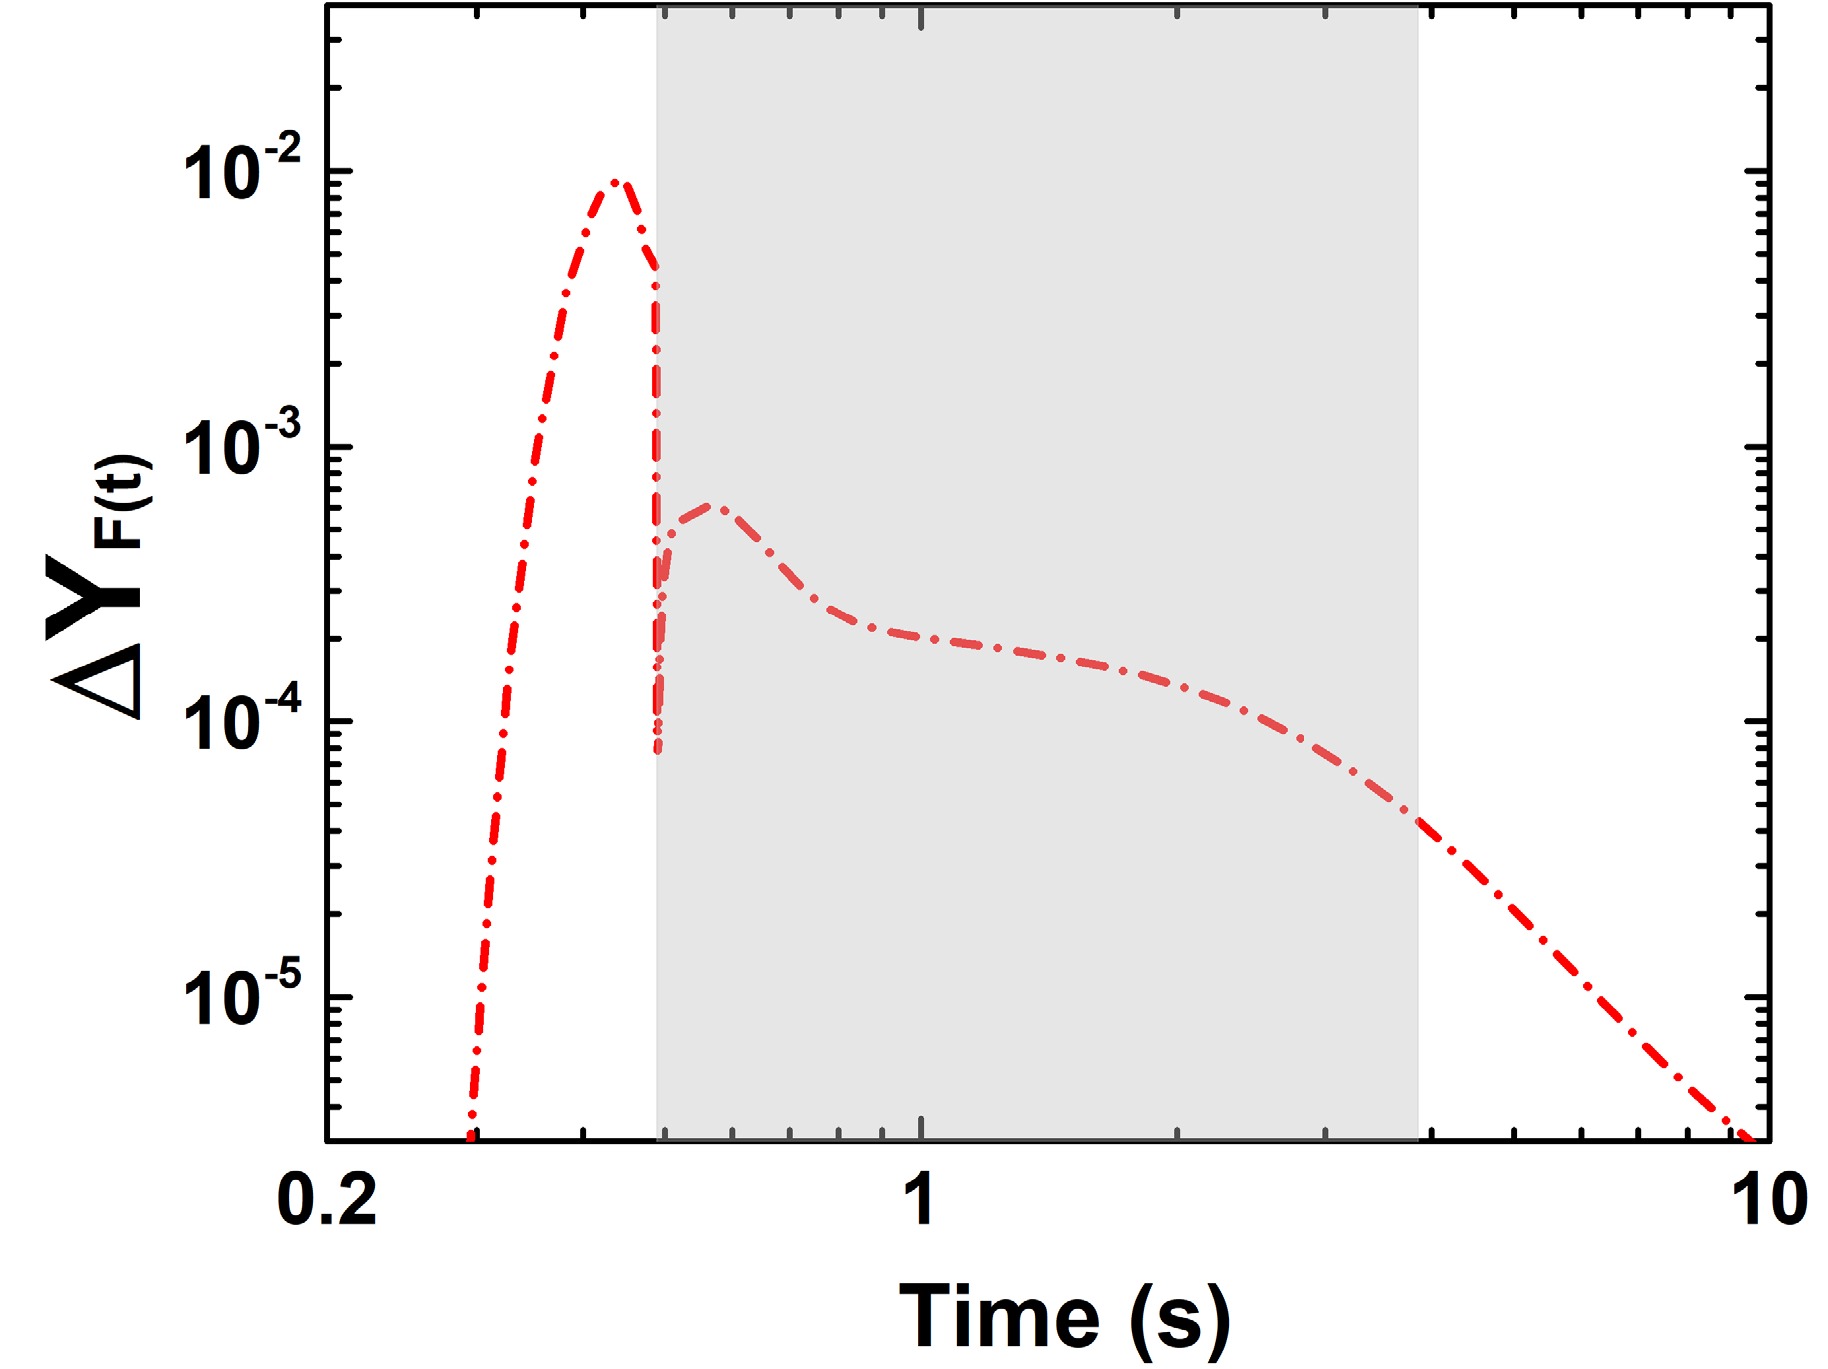
Figure 6. (color online) Evolution of the contribution of fission fragments to the rare-earth peak abundances over time in the cold scenario. The shaded area represents the time interval for the formation of the rare-earth peak, from the time of the r-process freeze-out to the time when the neutron capture timescale
$ \tau_{n\gamma}$ was approximately equal to three times the β-decay timescale$ \tau_\beta$ .$ \Delta \mathrm{Y}_{F}(t)=\sum\limits_{A=150}^{178} \sum\limits_n \sum\limits_i F_i^{(n)}(t) \times w_i(A), $
(4) where
$ F_i^{(n)}(t) $ is the fission flow of a parent nucleus n at a certain moment t, and$ w_i(A) $ is the fission yield. We summed the contributions from all fissioning nuclei to the rare-earth mass region$ A=150-178 $ .$ \Delta \mathrm{Y}_{F}(t) $ represents the increase in the abundance of nuclei with$ A=150-178 $ owing to fission deposition. The results show that, following the r-process freeze-out, the contribution of fission to the rare-earth peak gradually decreased. For nuclei in region I, which were produced around the time of the r-process freeze-out, the strong deposition of fission products started to take effect at this stage and eventually erased the mass sensitivities. However, as the nuclear flow reached region II at a later time, the contribution of fission gradually decreased, and hence, the weakening effect of fission fragments on the difference of the abundance distribution weakened. Therefore, the nuclei in region II still had larger F values. In addition, we note a distinct spike in the contribution of fission fragments at approximately 0.5 s in Fig. 6. This evolution closely follows the time-dependent behavior of the fission flow$ F_i^{(n)}(t) $ , and the observed feature resulted from two combined effects. First, the neutron-to-seed ratio decreased rapidly and fell below 1.0 around the time of the r-process freeze-out ($ \sim $ 0.48 s). The sudden reduction in the free neutron population led to a sharp decline in neutron-induced fission. Following freeze-out, β-delayed neutron emission provided additional free neutrons, reviving the neutron-induced fission flow and contributing to the subsequent increase in the total fission flow. Second, β-delayed fission primarily occurred following freeze-out. As the relevant nuclei decayed and underwent β-delayed fission, their contribution to the total fission flow became significant [29]. These two effects together led to the second hump observed at approximately 0.5 s in both the total fission flow and the contribution of fission fragments to the rare-earth peak abundances. -
Previous studies [11, 12] have suggested that the formation of the rare-earth peak occurs during the decay back to stability after the r-process freeze-out. In our earlier work [24], we further clarified that the rare-earth peak forms within the time interval between the r-process freeze-out and the point when the neutron capture timescale (
$ \tau_{n\gamma} $ ) becomes approximately three times longer than the β-decay timescale ($ \tau_\beta $ ). At this moment, when$ \tau_{n\gamma} \approx 3\tau_\beta $ , the rare-earth peak abundances are already close to their final values, indicating that the peak has essentially formed by then. The nuclei that have the most significant influence on the rare-earth peak are mainly distributed in two regions. Region I, located 20-30 neutrons away from stability, corresponds to the position of the nuclear flow at r-process freeze-out. Region II, 7-15 neutrons away from stability, aligns with the r-process path at the point of$ \tau_{n\gamma} \approx 3\tau_\beta $ .Fig. 1 shows the distribution of nuclei with high sensitivity measure F under different astrophysical scenarios, with the sensitivity data in four different scenarios taken from Ref. [24]. As a supplement to this analysis, we further calculate the average sensitivity measure F across the hot1, hot2, and cold scenarios. The top 30 nuclei with the largest averaged sensitivity F values are listed in Table 1 and are also indicated by light green shaded squares in Fig. 1. It is evident that the nuclei with the highest averaged sensitivity values are primarily located in region II, because these nuclei exhibit consistently high sensitivity across multiple astrophysical scenarios. In contrast, region I contains only one nucleus,
$ ^{152} {\rm{Te}}$ , with a relatively high averaged sensitivity. Although the sensitivity measure F of$ ^{152} {\rm{Te}}$ is low under the hot2 and cold scenarios, its exceptionally high sensitivity under the hot1 scenario results in a large average F value.
Figure 1. (Color Online) Distribution of nuclei with sensitivity measure F greater than 200 in the hot1, hot2, cold, and cold-sym scenarios. The region of measured nuclear masses from AME2020 [32] is overlaid with pink color and solid black squares are stable isotopes. The data of sensitivity measure F in four different scenarios are taken from Ref. [24]. The top 30 nuclei with the largest averaged sensitivity F values across the hot1, hot2, and cold scenarios are indicated by light green shaded squares.
Average Z A F Z A F Z A F Z A F Z A F 64 168 412.73 63 165 348.09* 65 168 301.85* 63 163 273.11* 65 167 233.27* 63 166 396.32 61 159 317.41* 57 153 301.48 59 156 268.38* 52 152 232.14 65 170 386.57 62 164 315.41* 59 155 296.77* 59 154 265.96* 59 152 229.16* 63 164 377.39* 65 172 312.50 65 171 295.67 63 162 259.27* 59 153 222.69* 65 169 376.35 61 158 306.86* 65 173 282.38 57 151 245.65* 62 165 220.96 63 167 349.18 64 169 306.86 57 154 273.65 61 160 240.01* 61 157 220.32* Table 1. The 30 most important nuclei with the highest averaged sensitivity measures F were obtained by averaging the F values across the hot1, hot2, and cold scenarios. An asterisk denotes a nucleus with experimental mass data in the AME2020 mass table [32]. A detailed list of the nuclei with the highest sensitivity under each astrophysical scenario is available in Ref. [24].
In the scenarios considered here, the equilibrium phases are maintained at the time of r-process freeze-out. Thus, the final abundances are expected to be sensitive to changes in the masses of nuclei located along the r-process freeze-out path, as has been explained in detail in our previous work [24]. However, in the hot2 and cold scenarios, the nuclei in region I exhibit lower F values, indicating that mass variations in this region have little or no impact on the final abundance distribution.
Nevertheless, we found that mass variations of certain nuclei in region I can lead to significant differences in the abundance pattern at the time of r-process freeze-out, as shown in Fig. 2. We selected two nuclei from region I as examples. In the hot1 scenario, the mass variation of
$ ^{152} {\rm{Te}}$ results in a noticeable difference in the abundance distribution at the freeze-out time. In the cold scenario, the mass variation of$ ^{172} {\rm{Ba}}$ also leads to significant differences at freeze-out. However, compared to the hot1 case, the overall abundance in the rare-earth peak region is much lower. The situation in the hot2 scenario is similar to the cold scenario. To quantify the sensitivity of the abundance distribution at freeze-out time to nuclear masses, we calculated the sensitivity measure$ F_{freeze-out} $ , which reflects how mass variations influence the abundance pattern at freeze-out. The results are presented in Fig. 3 and 4, where the left panels display the sensitivity measures, and the right panels present the corresponding abundance distributions at r-process freeze-out. The results indicate that, in the four scenarios considered here, region I corresponds to the region through which the nuclear flow passes at freeze-out. In the cold scenario, the nuclear flow extends farther from stability compared to the hot r-process conditions. It can be clearly seen that nuclei with high sensitivity are distributed along the r-process freeze-out path, implying that mass variations of nuclei in this region strongly impact the abundance distribution at freeze-out across all four scenarios.
Figure 2. (Color Online) Abundance distributions at the time of r-process freeze-out after nuclear mass variation in the hot1 and cold scenarios. The solid blue line represents the abundance distribution resulting from a mass increase of 1 MeV, while the dotted orange line corresponds to the abundance distribution resulting from a mass decrease of 1 MeV. The dots represent the solar r-process abundance pattern [33].
Figure 3. (Color Online) In the hot1 and hot2 scenarios, panels (a) and (b) correspond to the sensitivity measure
$ F_{freeze-out} $ of the abundance distribution at r-process freeze-out to nuclear masses, and panels (c) and (d) correspond to the abundance distribution patterns at freeze-out. Nuclei with$ F_{freeze-out} $ values greater than 1000 are represented by a cross in panels (c) and (d).
Figure 4. (Color Online) Same as Fig. 3, but with results in the cold and cold-sym scenarios.
In the hot1 scenario, differences in the abundance distribution at freeze-out propagate through the later stage of nucleosynthesis, leading to significant variations in the final abundance pattern. However, in the hot2 and cold scenarios, even though mass variations of certain nuclei in region I cause considerable differences in the abundance distribution at freeze-out, their impact on the final abundance pattern is minimal or negligible. This is primarily due to the influence of fission fragments, which play an important role in shaping the rare-earth peak abundances. We calculated the contribution of fission products to the abundance in the cold scenario as an example to prove this point, which is defined as
$ \Delta Y_{Fragment} (A)= \sum\limits_{n}\sum\limits_{i} f_{i}^{(n)}\times w_i(A). $

(3) Here, we take the integrated fission flow
$ f_{i}^{(n)} $ of a parent nucleus n, multiply it by the fission yield$ w_i (A) $ of the corresponding fission product with mass number A, and then sum the contributions from all fissioning nuclei, where i refers to a certain fission channel. The$ \Delta Y_{Fragment} $ represents the increase in the abundance of nuclei with mass number A due to fission deposition. Details of the relevant physical quantities can be found in Ref. [29]. The calculated contribution of fission fragments to abundance is shown in Fig. 5. The results indicate that when using the GEF model, a significant number of fission fragments are distributed within the rare-earth peak mass region. In the hot2 and cold scenarios, the overall abundance in the rare-earth peak region is very low at freeze-out. However, as nucleosynthesis progresses, a substantial amount of fission fragments is deposited in this region, gradually increasing abundance in the rare-earth region. The contribution of fission fragments diminishes the variations in the rare-earth peak abundance distribution that were initially caused by nuclear mass changes. As a result, the impact of mass variations in region I is masked by the distribution of fission fragments, leading to a generally lower sensitivity measure F for nuclei in this region. In contrast, under the cold-sym scenario, where a symmetric fission treatment is applied, fission fragments are only deposited near the second r-process peak, as indicated by the blue squares in Fig. 5. In the absence of a direct contribution of fission fragments to the rare-earth region, the differences in the abundance at freeze-out caused by mass variations in region I persist and ultimately influence the final rare-earth peak abundance distribution. So, the sensitivity of region I is increased again. However, the solar rare-earth peak abundance cannot be reproduced by using the symmetric fission treatment.
Figure 5. (Color Online) Contribution of fission fragments to the abundance distribution in the cold scenario. The red dots represent the increase in abundance due to fission deposition when using the GEF fission fragment distribution model, while the blue squares represent the contribution of fission fragments under the simple symmetric fission treatment.
When the r-process nuclear flow reaches region II, the rare-earth peak is essentially fully formed, and its shape is highly sensitive to mass variations of nuclei in this region, which are located along the r-process path at the time when
$ \tau_{n\gamma}\approx 3\tau_\beta $ . As mentioned above, in the hot2 and cold scenarios, the contribution of fission products eliminates the high sensitivity of nuclei along the early r-process path (region I). However, in the process of nuclear flow decay back to stability, the fission flow will gradually decrease over time, which means that the contribution of fission fragments to the rare-earth peak abundance will gradually decrease. We calculated the contribution of fission products to rare-earth peak abundances over time in the cold scenario, as shown in Fig. 6.$ \Delta \mathrm{Y}_{F}(t) $ is defined as
Figure 6. (Color Online)Evolution of the contribution of fission fragments to the rare-earth peak abundances over time in the cold scenario. The shaded area represents the time interval for the formation of the rare-earth peak, from the time of r-process freeze-out to the time when the neutron capture timescale
$ \tau_{n\gamma}$ is approximately equal to 3 times the β-decay timescale$ \tau_\beta$ .$ \Delta \mathrm{Y}_{F}(t)=\sum\limits_{A=150}^{178} \sum\limits_n \sum\limits_i F_i^{(n)}(t) \times w_i(A), $

(4) where
$ F_i^{(n)}(t) $ is the fission flow of a parent nucleus n at a certain moment t, and$ w_i(A) $ is the fission yield. We sum the contributions from all fissioning nuclei to the rare-earth mass region$ A=150-178 $ . The$ \Delta \mathrm{Y}_{F}(t) $ represents the increase in the abundance of nuclei with$ A=150-178 $ due to fission deposition. The results show that after the r-process freeze-out, the contribution of fission to the rare-earth peak gradually decreases. For nuclei in region I, which are produced around the time of r-process freeze-out, the strong deposition of fission products begins to take effect at this stage and eventually erases the mass sensitivities. However, as the nuclear flow reaches region II at a later time, the contribution of fission gradually decreases, and hence the weakening effect of fission fragments on the difference of abundance distribution becomes weaker. Therefore, nuclei in region II still have larger F values. In addition, we note a distinct spike in the contribution of fission fragments at around 0.5 s in Fig. 6. This evolution closely follows the time-dependent behavior of the fission flow$ F_i^{(n)}(t) $ , and the observed feature results from two combined effects. First, the neutron-to-seed ratio drops rapidly and falls below 1.0 around the time of r-process freeze-out ($ \sim $ 0.48 s). The sudden reduction in the free neutron population leads to a sharp decline in neutron-induced fission. After freeze-out, β-delayed neutron emission provides additional free neutrons, reviving the neutron-induced fission flow and contributing to the subsequent increase in the total fission flow. Second, β-delayed fission primarily occurs after freeze-out. As the relevant nuclei decay and undergo β-delayed fission, their contribution to the total fission flow becomes significant [29]. These two effects together lead to the second hump observed around 0.5 s in both the total fission flow and the contribution of fission fragments to the rare-earth peak abundances. -
Previous studies [11, 12] have suggested that the formation of the rare-earth peak occurs during the decay back to stability after the r-process freeze-out. In our earlier work [24], we further clarified that the rare-earth peak forms within the time interval between the r-process freeze-out and the point when the neutron capture timescale (
$ \tau_{n\gamma} $ ) becomes approximately three times longer than the β-decay timescale ($ \tau_\beta $ ). At this moment, when$ \tau_{n\gamma} \approx 3\tau_\beta $ , the rare-earth peak abundances are already close to their final values, indicating that the peak has essentially formed. The nuclei that have the most significant influence on the rare-earth peak are mainly distributed in two regions. Region I, located 20−30 neutrons away from stability, corresponds to the position of the nuclear flow at the r-process freeze-out. Region II, 7−15 neutrons away from stability, aligns with the r-process path at the point of$ \tau_{n\gamma} \approx 3\tau_\beta $ .Figure 1 shows the distribution of nuclei with high sensitivity measure F under different astrophysical scenarios, with the sensitivity data in four different scenarios obtained from Ref. [24]. As a supplement to this analysis, we further calculated the average sensitivity measure F across the hot1, hot2, and cold scenarios. The top 30 nuclei with the largest averaged sensitivity F values are listed in Table 1 and indicated by light green shaded squares in Fig. 1. It is evident that the nuclei with the highest averaged sensitivity values were primarily located in region II, because these nuclei exhibited consistently high sensitivity across multiple astrophysical scenarios. In contrast, region I contained only one nucleus,
$ ^{152} {\rm{Te}}$ , with a relatively high averaged sensitivity. Although the sensitivity measure F of$ ^{152} {\rm{Te}}$ was low under the hot2 and cold scenarios, its exceptionally high sensitivity under the hot1 scenario resulted in a large average F value.
Figure 1. (color online) Distribution of nuclei with a sensitivity measure F greater than 200 in the hot1, hot2, cold, and cold-sym scenarios. The region of measured nuclear masses from AME2020 [32] is overlaid with a pink color and the solid black squares are stable isotopes. The data of the sensitivity measure F in four different scenarios were obtained from Ref. [24]. The top 30 nuclei with the largest averaged sensitivity F values across the hot1, hot2, and cold scenarios are indicated by light green shaded squares.
Average Z A F Z A F Z A F Z A F Z A F 64 168 412.73 63 165 348.09* 65 168 301.85* 63 163 273.11* 65 167 233.27* 63 166 396.32 61 159 317.41* 57 153 301.48 59 156 268.38* 52 152 232.14 65 170 386.57 62 164 315.41* 59 155 296.77* 59 154 265.96* 59 152 229.16* 63 164 377.39* 65 172 312.50 65 171 295.67 63 162 259.27* 59 153 222.69* 65 169 376.35 61 158 306.86* 65 173 282.38 57 151 245.65* 62 165 220.96 63 167 349.18 64 169 306.86 57 154 273.65 61 160 240.01* 61 157 220.32* Table 1. The 30 most important nuclei with the highest averaged sensitivity measures F were obtained by averaging the F values across the hot1, hot2, and cold scenarios. An asterisk denotes a nucleus with experimental mass data in the AME2020 mass table [32]. A detailed list of the nuclei with the highest sensitivity under each astrophysical scenario is available in Ref. [24].
In the scenarios considered in this study, the equilibrium phases were maintained at the time of the r-process freeze-out. Thus, the final abundances were expected to be sensitive to changes in the masses of nuclei located along the r-process freeze-out path, as explained in detail in our previous work [24]. However, in the hot2 and cold scenarios, the nuclei in region I exhibited lower F values, indicating that mass variations in this region had little or no impact on the final abundance distribution.
Nevertheless, we found that mass variations of certain nuclei in region I could lead to significant differences in the abundance pattern at the time of the r-process freeze-out, as shown in Fig. 2. We selected two nuclei from region I as examples. In the hot1 scenario, the mass variation of
$ ^{152} {\rm{Te}}$ resulted in a noticeable difference in the abundance distribution at the freeze-out time. In the cold scenario, the mass variation of$ ^{172} {\rm{Ba}}$ also led to significant differences at freeze-out. However, compared with the hot1 case, the overall abundance in the rare-earth peak region was much lower. The situation in the hot2 scenario was similar to that in the cold scenario. To quantify the sensitivity of the abundance distribution at freeze-out time to nuclear masses, we calculated the sensitivity measure$ F_{\rm freeze-out} $ , which reflects how mass variations influence the abundance pattern at freeze-out. The results are presented in Figs. 3 and 4, where the left panels display the sensitivity measures and the right panels present the corresponding abundance distributions at the r-process freeze-out. The results indicate that, in the four considered scenarios, region I corresponded to the region through which the nuclear flow passed at freeze-out. In the cold scenario, the nuclear flow extended farther from stability compared with the hot r-process conditions. It can be clearly observed that nuclei with high sensitivity were distributed along the r-process freeze-out path, implying that mass variations of nuclei in this region strongly impacted the abundance distribution at freeze-out across all four scenarios.
Figure 2. (color online) Abundance distributions at the time of the r-process freeze-out following nuclear mass variation in the hot1 and cold scenarios. The solid blue line represents the abundance distribution resulting from a mass increase of 1 MeV, while the dotted orange line corresponds to the abundance distribution resulting from a mass decrease of 1 MeV. The dots represent the solar r-process abundance pattern [33].
Figure 3. (color online) In the hot1 and hot2 scenarios, panels (a) and (b) correspond to the sensitivity measure
$ F_{\rm freeze-out} $ of the abundance distribution at the r-process freeze-out to nuclear masses, whereas panels (c) and (d) correspond to the abundance distribution patterns at freeze-out. Nuclei with$ F_{\rm freeze-out} $ values greater than 1000 are represented by a cross in panels (c) and (d).
Figure 4. (color online) As in Fig. 3, but with results for the cold and cold-sym scenarios.
In the hot1 scenario, differences in the abundance distribution at freeze-out propagated through the later stage of nucleosynthesis, leading to significant variations in the final abundance pattern. However, in the hot2 and cold scenarios, even though mass variations of certain nuclei in region I caused considerable differences in the abundance distribution at freeze-out, their impact on the final abundance pattern was minimal or negligible. This is primarily owing to the influence of fission fragments, which play an important role in shaping the rare-earth peak abundances. We calculated the contribution of fission products to the abundance in the cold scenario as an example to prove this point, as follows:
$ \Delta Y_{\rm Fragment} (A)= \sum\limits_{n}\sum\limits_{i} f_{i}^{(n)}\times w_i(A). $
(3) We took the integrated fission flow
$ f_{i}^{(n)} $ of a parent nucleus n, multiplied it by the fission yield$ w_i (A) $ of the corresponding fission product with mass number A, and then summed the contributions from all fissioning nuclei, where i refers to a certain fission channel.$ \Delta Y_{\rm Fragment} $ represents the increase in the abundance of nuclei with mass number A owing to fission deposition. Details of the relevant physical quantities can be found in Ref. [29]. The calculated contribution of the fission fragments to the abundance is shown in Fig. 5. The results indicate that when using the GEF model, a significant number of fission fragments were distributed within the rare-earth peak mass region. In the hot2 and cold scenarios, the overall abundance in the rare-earth peak region was very low at freeze-out. However, as nucleosynthesis progresses, a substantial amount of fission fragments was deposited in this region, gradually increasing abundance in the rare-earth region. The contribution of fission fragments diminished the variations in the rare-earth peak abundance distribution that were initially caused by nuclear mass changes. As a result, the impact of mass variations in region I was masked by the distribution of fission fragments, leading to a generally lower sensitivity measure F for nuclei in this region. In contrast, in the cold-sym scenario, where symmetric fission treatment was applied, fission fragments were only deposited near the second r-process peak, as indicated by the blue squares in Fig. 5. In the absence of a direct contribution of fission fragments to the rare-earth region, the differences in the abundance at freeze-out caused by mass variations in region I persisted and ultimately influenced the final rare-earth peak abundance distribution. Thus, the sensitivity of region I increased again. However, the solar rare-earth peak abundance cannot be reproduced using the symmetric fission treatment.
Figure 5. (color online) Contribution of fission fragments to the abundance distribution in the cold scenario. The red dots represent the increase in abundance due to fission deposition when using the GEF fission fragment distribution model, while the blue squares represent the contribution of fission fragments under the simple symmetric fission treatment.
When the r-process nuclear flow reached region II, the rare-earth peak was essentially fully formed, and its shape was highly sensitive to mass variations of nuclei in this region, which were located along the r-process path when
$ \tau_{n\gamma}\approx 3\tau_\beta $ . As mentioned previously, in the hot2 and cold scenarios, the contribution of fission products eliminated the high sensitivity of nuclei along the early r-process path (region I). However, in the process of nuclear flow decay back to stability, the fission flow will gradually decrease over time, which means that the contribution of fission fragments to the rare-earth peak abundance will gradually decrease. We calculated the contribution of fission products to rare-earth peak abundances over time in the cold scenario, as shown in Fig. 6.$ \Delta \mathrm{Y}_{F}(t) $ is defined as
Figure 6. (color online) Evolution of the contribution of fission fragments to the rare-earth peak abundances over time in the cold scenario. The shaded area represents the time interval for the formation of the rare-earth peak, from the time of the r-process freeze-out to the time when the neutron capture timescale
$ \tau_{n\gamma}$ was approximately equal to three times the β-decay timescale$ \tau_\beta$ .$ \Delta \mathrm{Y}_{F}(t)=\sum\limits_{A=150}^{178} \sum\limits_n \sum\limits_i F_i^{(n)}(t) \times w_i(A), $
(4) where
$ F_i^{(n)}(t) $ is the fission flow of a parent nucleus n at a certain moment t, and$ w_i(A) $ is the fission yield. We summed the contributions from all fissioning nuclei to the rare-earth mass region$ A=150-178 $ .$ \Delta \mathrm{Y}_{F}(t) $ represents the increase in the abundance of nuclei with$ A=150-178 $ owing to fission deposition. The results show that, following the r-process freeze-out, the contribution of fission to the rare-earth peak gradually decreased. For nuclei in region I, which were produced around the time of the r-process freeze-out, the strong deposition of fission products started to take effect at this stage and eventually erased the mass sensitivities. However, as the nuclear flow reached region II at a later time, the contribution of fission gradually decreased, and hence, the weakening effect of fission fragments on the difference of the abundance distribution weakened. Therefore, the nuclei in region II still had larger F values. In addition, we note a distinct spike in the contribution of fission fragments at approximately 0.5 s in Fig. 6. This evolution closely follows the time-dependent behavior of the fission flow$ F_i^{(n)}(t) $ , and the observed feature resulted from two combined effects. First, the neutron-to-seed ratio decreased rapidly and fell below 1.0 around the time of the r-process freeze-out ($ \sim $ 0.48 s). The sudden reduction in the free neutron population led to a sharp decline in neutron-induced fission. Following freeze-out, β-delayed neutron emission provided additional free neutrons, reviving the neutron-induced fission flow and contributing to the subsequent increase in the total fission flow. Second, β-delayed fission primarily occurred following freeze-out. As the relevant nuclei decayed and underwent β-delayed fission, their contribution to the total fission flow became significant [29]. These two effects together led to the second hump observed at approximately 0.5 s in both the total fission flow and the contribution of fission fragments to the rare-earth peak abundances. -
Previous studies [11, 12] have suggested that the formation of the rare-earth peak occurs during the decay back to stability after the r-process freeze-out. In our earlier work [24], we further clarified that the rare-earth peak forms within the time interval between the r-process freeze-out and the point when the neutron capture timescale (
$ \tau_{n\gamma} $ ) becomes approximately three times longer than the β-decay timescale ($ \tau_\beta $ ). At this moment, when$ \tau_{n\gamma} \approx 3\tau_\beta $ , the rare-earth peak abundances are already close to their final values, indicating that the peak has essentially formed. The nuclei that have the most significant influence on the rare-earth peak are mainly distributed in two regions. Region I, located 20−30 neutrons away from stability, corresponds to the position of the nuclear flow at the r-process freeze-out. Region II, 7−15 neutrons away from stability, aligns with the r-process path at the point of$ \tau_{n\gamma} \approx 3\tau_\beta $ .Figure 1 shows the distribution of nuclei with high sensitivity measure F under different astrophysical scenarios, with the sensitivity data in four different scenarios obtained from Ref. [24]. As a supplement to this analysis, we further calculated the average sensitivity measure F across the hot1, hot2, and cold scenarios. The top 30 nuclei with the largest averaged sensitivity F values are listed in Table 1 and indicated by light green shaded squares in Fig. 1. It is evident that the nuclei with the highest averaged sensitivity values were primarily located in region II, because these nuclei exhibited consistently high sensitivity across multiple astrophysical scenarios. In contrast, region I contained only one nucleus,
$ ^{152} {\rm{Te}}$ , with a relatively high averaged sensitivity. Although the sensitivity measure F of$ ^{152} {\rm{Te}}$ was low under the hot2 and cold scenarios, its exceptionally high sensitivity under the hot1 scenario resulted in a large average F value.
Figure 1. (color online) Distribution of nuclei with a sensitivity measure F greater than 200 in the hot1, hot2, cold, and cold-sym scenarios. The region of measured nuclear masses from AME2020 [32] is overlaid with a pink color and the solid black squares are stable isotopes. The data of the sensitivity measure F in four different scenarios were obtained from Ref. [24]. The top 30 nuclei with the largest averaged sensitivity F values across the hot1, hot2, and cold scenarios are indicated by light green shaded squares.
Average Z A F Z A F Z A F Z A F Z A F 64 168 412.73 63 165 348.09* 65 168 301.85* 63 163 273.11* 65 167 233.27* 63 166 396.32 61 159 317.41* 57 153 301.48 59 156 268.38* 52 152 232.14 65 170 386.57 62 164 315.41* 59 155 296.77* 59 154 265.96* 59 152 229.16* 63 164 377.39* 65 172 312.50 65 171 295.67 63 162 259.27* 59 153 222.69* 65 169 376.35 61 158 306.86* 65 173 282.38 57 151 245.65* 62 165 220.96 63 167 349.18 64 169 306.86 57 154 273.65 61 160 240.01* 61 157 220.32* Table 1. The 30 most important nuclei with the highest averaged sensitivity measures F were obtained by averaging the F values across the hot1, hot2, and cold scenarios. An asterisk denotes a nucleus with experimental mass data in the AME2020 mass table [32]. A detailed list of the nuclei with the highest sensitivity under each astrophysical scenario is available in Ref. [24].
In the scenarios considered in this study, the equilibrium phases were maintained at the time of the r-process freeze-out. Thus, the final abundances were expected to be sensitive to changes in the masses of nuclei located along the r-process freeze-out path, as explained in detail in our previous work [24]. However, in the hot2 and cold scenarios, the nuclei in region I exhibited lower F values, indicating that mass variations in this region had little or no impact on the final abundance distribution.
Nevertheless, we found that mass variations of certain nuclei in region I could lead to significant differences in the abundance pattern at the time of the r-process freeze-out, as shown in Fig. 2. We selected two nuclei from region I as examples. In the hot1 scenario, the mass variation of
$ ^{152} {\rm{Te}}$ resulted in a noticeable difference in the abundance distribution at the freeze-out time. In the cold scenario, the mass variation of$ ^{172} {\rm{Ba}}$ also led to significant differences at freeze-out. However, compared with the hot1 case, the overall abundance in the rare-earth peak region was much lower. The situation in the hot2 scenario was similar to that in the cold scenario. To quantify the sensitivity of the abundance distribution at freeze-out time to nuclear masses, we calculated the sensitivity measure$ F_{\rm freeze-out} $ , which reflects how mass variations influence the abundance pattern at freeze-out. The results are presented in Figs. 3 and 4, where the left panels display the sensitivity measures and the right panels present the corresponding abundance distributions at the r-process freeze-out. The results indicate that, in the four considered scenarios, region I corresponded to the region through which the nuclear flow passed at freeze-out. In the cold scenario, the nuclear flow extended farther from stability compared with the hot r-process conditions. It can be clearly observed that nuclei with high sensitivity were distributed along the r-process freeze-out path, implying that mass variations of nuclei in this region strongly impacted the abundance distribution at freeze-out across all four scenarios.
Figure 2. (color online) Abundance distributions at the time of the r-process freeze-out following nuclear mass variation in the hot1 and cold scenarios. The solid blue line represents the abundance distribution resulting from a mass increase of 1 MeV, while the dotted orange line corresponds to the abundance distribution resulting from a mass decrease of 1 MeV. The dots represent the solar r-process abundance pattern [33].
Figure 3. (color online) In the hot1 and hot2 scenarios, panels (a) and (b) correspond to the sensitivity measure
$ F_{\rm freeze-out} $ of the abundance distribution at the r-process freeze-out to nuclear masses, whereas panels (c) and (d) correspond to the abundance distribution patterns at freeze-out. Nuclei with$ F_{\rm freeze-out} $ values greater than 1000 are represented by a cross in panels (c) and (d).
Figure 4. (color online) As in Fig. 3, but with results for the cold and cold-sym scenarios.
In the hot1 scenario, differences in the abundance distribution at freeze-out propagated through the later stage of nucleosynthesis, leading to significant variations in the final abundance pattern. However, in the hot2 and cold scenarios, even though mass variations of certain nuclei in region I caused considerable differences in the abundance distribution at freeze-out, their impact on the final abundance pattern was minimal or negligible. This is primarily owing to the influence of fission fragments, which play an important role in shaping the rare-earth peak abundances. We calculated the contribution of fission products to the abundance in the cold scenario as an example to prove this point, as follows:
$ \Delta Y_{\rm Fragment} (A)= \sum\limits_{n}\sum\limits_{i} f_{i}^{(n)}\times w_i(A). $
(3) We took the integrated fission flow
$ f_{i}^{(n)} $ of a parent nucleus n, multiplied it by the fission yield$ w_i (A) $ of the corresponding fission product with mass number A, and then summed the contributions from all fissioning nuclei, where i refers to a certain fission channel.$ \Delta Y_{\rm Fragment} $ represents the increase in the abundance of nuclei with mass number A owing to fission deposition. Details of the relevant physical quantities can be found in Ref. [29]. The calculated contribution of the fission fragments to the abundance is shown in Fig. 5. The results indicate that when using the GEF model, a significant number of fission fragments were distributed within the rare-earth peak mass region. In the hot2 and cold scenarios, the overall abundance in the rare-earth peak region was very low at freeze-out. However, as nucleosynthesis progresses, a substantial amount of fission fragments was deposited in this region, gradually increasing abundance in the rare-earth region. The contribution of fission fragments diminished the variations in the rare-earth peak abundance distribution that were initially caused by nuclear mass changes. As a result, the impact of mass variations in region I was masked by the distribution of fission fragments, leading to a generally lower sensitivity measure F for nuclei in this region. In contrast, in the cold-sym scenario, where symmetric fission treatment was applied, fission fragments were only deposited near the second r-process peak, as indicated by the blue squares in Fig. 5. In the absence of a direct contribution of fission fragments to the rare-earth region, the differences in the abundance at freeze-out caused by mass variations in region I persisted and ultimately influenced the final rare-earth peak abundance distribution. Thus, the sensitivity of region I increased again. However, the solar rare-earth peak abundance cannot be reproduced using the symmetric fission treatment.
Figure 5. (color online) Contribution of fission fragments to the abundance distribution in the cold scenario. The red dots represent the increase in abundance due to fission deposition when using the GEF fission fragment distribution model, while the blue squares represent the contribution of fission fragments under the simple symmetric fission treatment.
When the r-process nuclear flow reached region II, the rare-earth peak was essentially fully formed, and its shape was highly sensitive to mass variations of nuclei in this region, which were located along the r-process path when
$ \tau_{n\gamma}\approx 3\tau_\beta $ . As mentioned previously, in the hot2 and cold scenarios, the contribution of fission products eliminated the high sensitivity of nuclei along the early r-process path (region I). However, in the process of nuclear flow decay back to stability, the fission flow will gradually decrease over time, which means that the contribution of fission fragments to the rare-earth peak abundance will gradually decrease. We calculated the contribution of fission products to rare-earth peak abundances over time in the cold scenario, as shown in Fig. 6.$ \Delta \mathrm{Y}_{F}(t) $ is defined as
Figure 6. (color online) Evolution of the contribution of fission fragments to the rare-earth peak abundances over time in the cold scenario. The shaded area represents the time interval for the formation of the rare-earth peak, from the time of the r-process freeze-out to the time when the neutron capture timescale
$ \tau_{n\gamma}$ was approximately equal to three times the β-decay timescale$ \tau_\beta$ .$ \Delta \mathrm{Y}_{F}(t)=\sum\limits_{A=150}^{178} \sum\limits_n \sum\limits_i F_i^{(n)}(t) \times w_i(A), $
(4) where
$ F_i^{(n)}(t) $ is the fission flow of a parent nucleus n at a certain moment t, and$ w_i(A) $ is the fission yield. We summed the contributions from all fissioning nuclei to the rare-earth mass region$ A=150-178 $ .$ \Delta \mathrm{Y}_{F}(t) $ represents the increase in the abundance of nuclei with$ A=150-178 $ owing to fission deposition. The results show that, following the r-process freeze-out, the contribution of fission to the rare-earth peak gradually decreased. For nuclei in region I, which were produced around the time of the r-process freeze-out, the strong deposition of fission products started to take effect at this stage and eventually erased the mass sensitivities. However, as the nuclear flow reached region II at a later time, the contribution of fission gradually decreased, and hence, the weakening effect of fission fragments on the difference of the abundance distribution weakened. Therefore, the nuclei in region II still had larger F values. In addition, we note a distinct spike in the contribution of fission fragments at approximately 0.5 s in Fig. 6. This evolution closely follows the time-dependent behavior of the fission flow$ F_i^{(n)}(t) $ , and the observed feature resulted from two combined effects. First, the neutron-to-seed ratio decreased rapidly and fell below 1.0 around the time of the r-process freeze-out ($ \sim $ 0.48 s). The sudden reduction in the free neutron population led to a sharp decline in neutron-induced fission. Following freeze-out, β-delayed neutron emission provided additional free neutrons, reviving the neutron-induced fission flow and contributing to the subsequent increase in the total fission flow. Second, β-delayed fission primarily occurred following freeze-out. As the relevant nuclei decayed and underwent β-delayed fission, their contribution to the total fission flow became significant [29]. These two effects together led to the second hump observed at approximately 0.5 s in both the total fission flow and the contribution of fission fragments to the rare-earth peak abundances. -
Based on the results of sensitivity studies in our previous work [24], we further analyzed the underlying reasons for the different distribution patterns of high-sensitivity nuclei across various astrophysical scenarios. The results showed that the mass variations of nuclei in region I (20−30 neutrons away from stability) had a significant impact on the abundance distribution at the r-process freeze-out across all four scenarios, highlighting the universality of their influence at this stage. However, in scenarios with extensive fission activity, the subsequent deposition of fission products into the rare-earth region started to take effect following freeze-out. Fission deposition effectively reset the local abundances in this region and suppressed the sensitivity to nuclear masses along the r-process freeze-out path. This process significantly reduced the uncertainty in the rare-earth peak abundances caused by mass variations in region I, producing a more robust r-process abundance distribution.
With time evolution, the fission flow in the r-process nucleosynthesis gradually declined, leading to a reduced contribution from fission deposition. As the r-process path moved towards stability at a later time, the weakening effect of fission fragments on the difference in the abundance distribution weakened. Consequently, the sensitivity of nuclear masses in region II (7−15 neutrons away from stability) remained less affected by fission fragments, allowing nuclei in this region to retain relatively high sensitivity. This study highlights the impact of fission on the sensitivity of r-process abundances to nuclear masses, contributing to a better understanding of rare-earth peak formation and improving its effectiveness as a diagnostic for the r-process site.
-
Based on the results of sensitivity studies in our previous work [24], we further analyzed the underlying reasons for the different distribution patterns of high-sensitivity nuclei across various astrophysical scenarios. The results show that mass variations of nuclei in region I (20-30 neutrons away from stability) have a significant impact on the abundance distribution at r-process freeze-out across all four scenarios, highlighting the universality of their influence at this stage. However, in scenarios with extensive fission activity, the subsequent deposition of fission products into the rare-earth region begins to take effect after freeze-out. Fission deposition effectively resets the local abundances in this region and suppresses the sensitivity to nuclear masses along the r-process freeze-out path. This process significantly reduces the uncertainty in the rare-earth peak abundances caused by mass variations in region I, producing a more robust r-process abundance distribution.
With time evolution, the fission flow in r-process nucleosynthesis gradually declines, leading to a reduced contribution from fission deposition. As the r-process path moves toward stability at a later time, the weakening effect of fission fragments on the difference in abundance distribution becomes weaker. Consequently, the sensitivity of nuclear masses in region II (7-15 neutrons away from stability) remains less affected by fission fragments, allowing nuclei in this region to retain relatively high sensitivity. This study highlights the impact of fission on the sensitivity of r-process abundances to nuclear masses, contributing to a better understanding of rare-earth peak formation and improving its effectiveness as a diagnostic for the r-process site.
-
Based on the results of sensitivity studies in our previous work [24], we further analyzed the underlying reasons for the different distribution patterns of high-sensitivity nuclei across various astrophysical scenarios. The results showed that the mass variations of nuclei in region I (20−30 neutrons away from stability) had a significant impact on the abundance distribution at the r-process freeze-out across all four scenarios, highlighting the universality of their influence at this stage. However, in scenarios with extensive fission activity, the subsequent deposition of fission products into the rare-earth region started to take effect following freeze-out. Fission deposition effectively reset the local abundances in this region and suppressed the sensitivity to nuclear masses along the r-process freeze-out path. This process significantly reduced the uncertainty in the rare-earth peak abundances caused by mass variations in region I, producing a more robust r-process abundance distribution.
With time evolution, the fission flow in the r-process nucleosynthesis gradually declined, leading to a reduced contribution from fission deposition. As the r-process path moved towards stability at a later time, the weakening effect of fission fragments on the difference in the abundance distribution weakened. Consequently, the sensitivity of nuclear masses in region II (7−15 neutrons away from stability) remained less affected by fission fragments, allowing nuclei in this region to retain relatively high sensitivity. This study highlights the impact of fission on the sensitivity of r-process abundances to nuclear masses, contributing to a better understanding of rare-earth peak formation and improving its effectiveness as a diagnostic for the r-process site.
-
The authors also want to thank the fruitful discussions with Prof. F. Q. Chen and Dr. W. L. Lv.
-
The authors also want to thank the fruitful discussions with Prof. F. Q. Chen and Dr. W. L. Lv.
-
The authors also want to thank the fruitful discussions with Prof. F. Q. Chen and Dr. W. L. Lv.
-
The authors also want to thank the fruitful discussions with Prof. F. Q. Chen and Dr. W. L. Lv.
The role of fission in mass sensitivity study of the r-process
- Received Date: 2025-03-31
- Available Online: 2026-01-15
Abstract: A sensitivity study was performed to investigate the impact of individual nuclear masses on r-process rare-earth peak abundances in different astrophysical scenarios. The most impactful nuclei are primarily distributed in two regions on the nuclear chart: one located 20-30 neutrons away from stability (defined as region I) and another 7-15 neutrons away from stability (defined as region II), as previously reported in Phys. Lett. B 844, 138092 (2023). In this study, we extend our analysis by focusing on the role of fission in the mass sensitivity study. The results show that, in astrophysical scenarios involving fission, the sensitivity of nuclei in region I is diminished owing to the deposition of a large number of fission fragments in the rare-earth mass region. However, nuclei in region II retain high sensitivity because the contribution of fission decreases in the later stages of nucleosynthesis. This study highlights the impact of fission on the sensitivity of r-process abundances to nuclear masses and enhances the understanding of the rare-earth peak formation mechanism.


 DownLoad: