


 Abstract
 HTML
HTML Reference
 Related
 PDF
PDF


-
$ \alpha $ decay is the dominating decay mode in the nuclear chart near the proton drip line when Z$ > $ 82. It is challenging to investigate the decay properties and nuclear structure of nuclei close to the N = 126 neutron shell owing to their short half-lives and low production rates. Owing to the shell effect, the half-lives of N = 128 isotones decrease to dozens of nanoseconds as Z becomes closer to 92. When synthesizing them by heavy-ion induced fusion reactions, the fission of compound nuclei dominates the main channel, which competes with the evaporation residues.In a previous study, the known decay properties of
$ ^{222} $ Pa ranged from the ground state to the excited states of$ ^{218} $ Ac [1, 2]. The data obtained from the atomic mass evaluation were deduced from the interpolation method [3]. Prior to this study, a testing experiment was conducted in which an expansion of the fine structure of$ \alpha $ decay in$ ^{222} $ Pa was observed. This motivated the formal experiment in the present study, in which the updated fine structure of$ ^{222} $ Pa is reported. -
The experiment was performed at the Spectrometer for Heavy Atoms and Nuclear Structure (SHANS) [4] in Institute of Modern Physics (IMP), Lanzhou, China. The
$ ^{222} $ Pa nuclei were produced via the fusion-evaporation reaction$ ^{40} $ Ar +$ ^{186} $ W. A beam of$ ^{40} $ Ar with an energy of 198.7 MeV and an intensity of 300$pnA$ was provided by the Sector-Focusing Cyclotron (SFC) of the Heavy Ion Research Facility in Lanzhou (HIRFL). The$ ^{186} $ W target, with an average thickness of 200 µg/cm2, was evaporated on 50 µg/cm2 of carbon and covered with 10 µg/cm2 of carbon layer. The evaporation residues (ERs) were filtered by the separator of SHANS and implanted into three 300-µm-thick position-sensitive strip detectors (PSSDs), each with an active area of 50$ \times $ 50 mm2. The front surface of each PSSD was divided into 16 strips along the perpendicular direction, thereby achieving a horizontal position resolution of 3 mm. A total of 8 non-position-sensitive side silicon detectors (SSDs) were mounted upstream from the PSSDs, which formed into a box geometry configuration. The total detection efficiency for the$ \alpha $ particles emitted from the surface of PSSDs was measured to be$ \sim $ 72%. To distinguish the$ \alpha $ events from the implanting events, two multi-wire proportional counters (MWPCs) were mounted 15 cm and 25 cm upstream from the PSSDs. Three additional SSDs featuring the same size as the PSSDs were installed side by side after the PSSDs to provide the veto signals from the light particles passing through the PSSDs. Near the Si-box detection system, two High Purity Germanium (HPGe) and one clover detectors were mounted at the right side, downward and downstream, respectively. Signals from all the detectors were recorded directly by a digital data acquisition system comprising 16 waveform digitizers V1724 from CAEN S.p.A [5]. Every event from the PSSDs and SSDs was recorded in 30$\mu\rm s$ -long trace at a sampling rate of 100 MHz. More details about the detection system can be found in the Refs. [6-8].The energy calibration for the charged particles was performed using
$ ^{175} $ Lu target with the same beam. With the help of an alcohol circulation cooling system, the energy resolution for single traces was approximately 40 keV (FWHM) for 6.5-10 MeV$ \alpha $ particles, and the vertical position resolution was approximately 1.5 mm (FWHM). For signals followed by another event within 0.5-1$\mu\rm s$ , the energy resolution worsened, taking a value of 70 keV. When time difference was less than 100 ns, the deduced$ \alpha $ particle energy from the pileup trace became unreliable. -
According to the beam energy used in this experiment, ERs with mass A
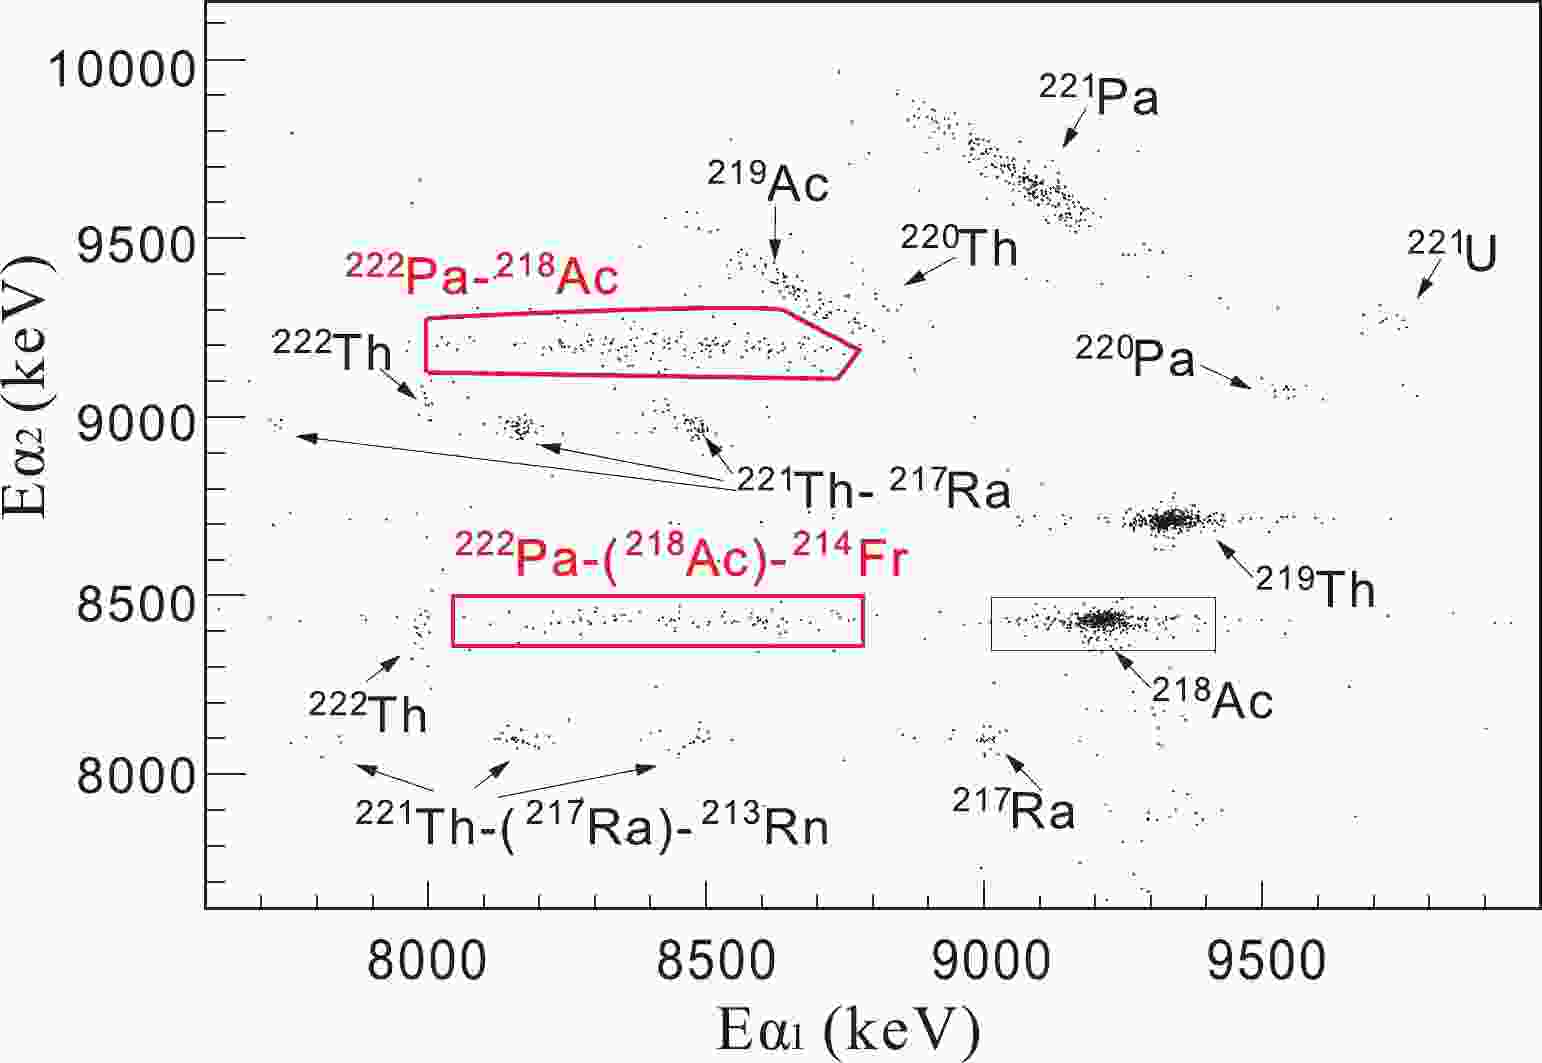
$ \sim $ 222 will exhibit a 1.2 µs flight time through SHANS. Consequently, ERs with half-lives longer than 0.4$\mu\rm s$ could be collected in the PSSDs. The initial approach to identify the correlations was to search$ \alpha $ -decay chains fired at one specific position. On account of the half-lives of nuclei close to$ ^{222} $ Pa and their daughter nuclei, as well as their granddaughter nuclei, the searching time windows were set to 30 ms for ER-$ \alpha_{1} $ pairs and 50 ms for$ \alpha_{1} $ -$ \alpha_{2} $ pairs. A two-dimensional plot of the correlated events ER-$ \alpha_{1} $ -$ \alpha_{2} $ is shown in Fig. 1. Note that$ \alpha_{1} $ decays were the detected$ \alpha $ decays following the implanting residues, which could be either from the mother nuclei or the daughter nuclei in case the mother$ \alpha $ escaped. The escaped$ \alpha $ particle is labeled in parentheses. Note that$ \alpha_{2} $ followed along$ \alpha_{1} $ , decaying from either the daughter or the granddaughter nuclei correspondingly.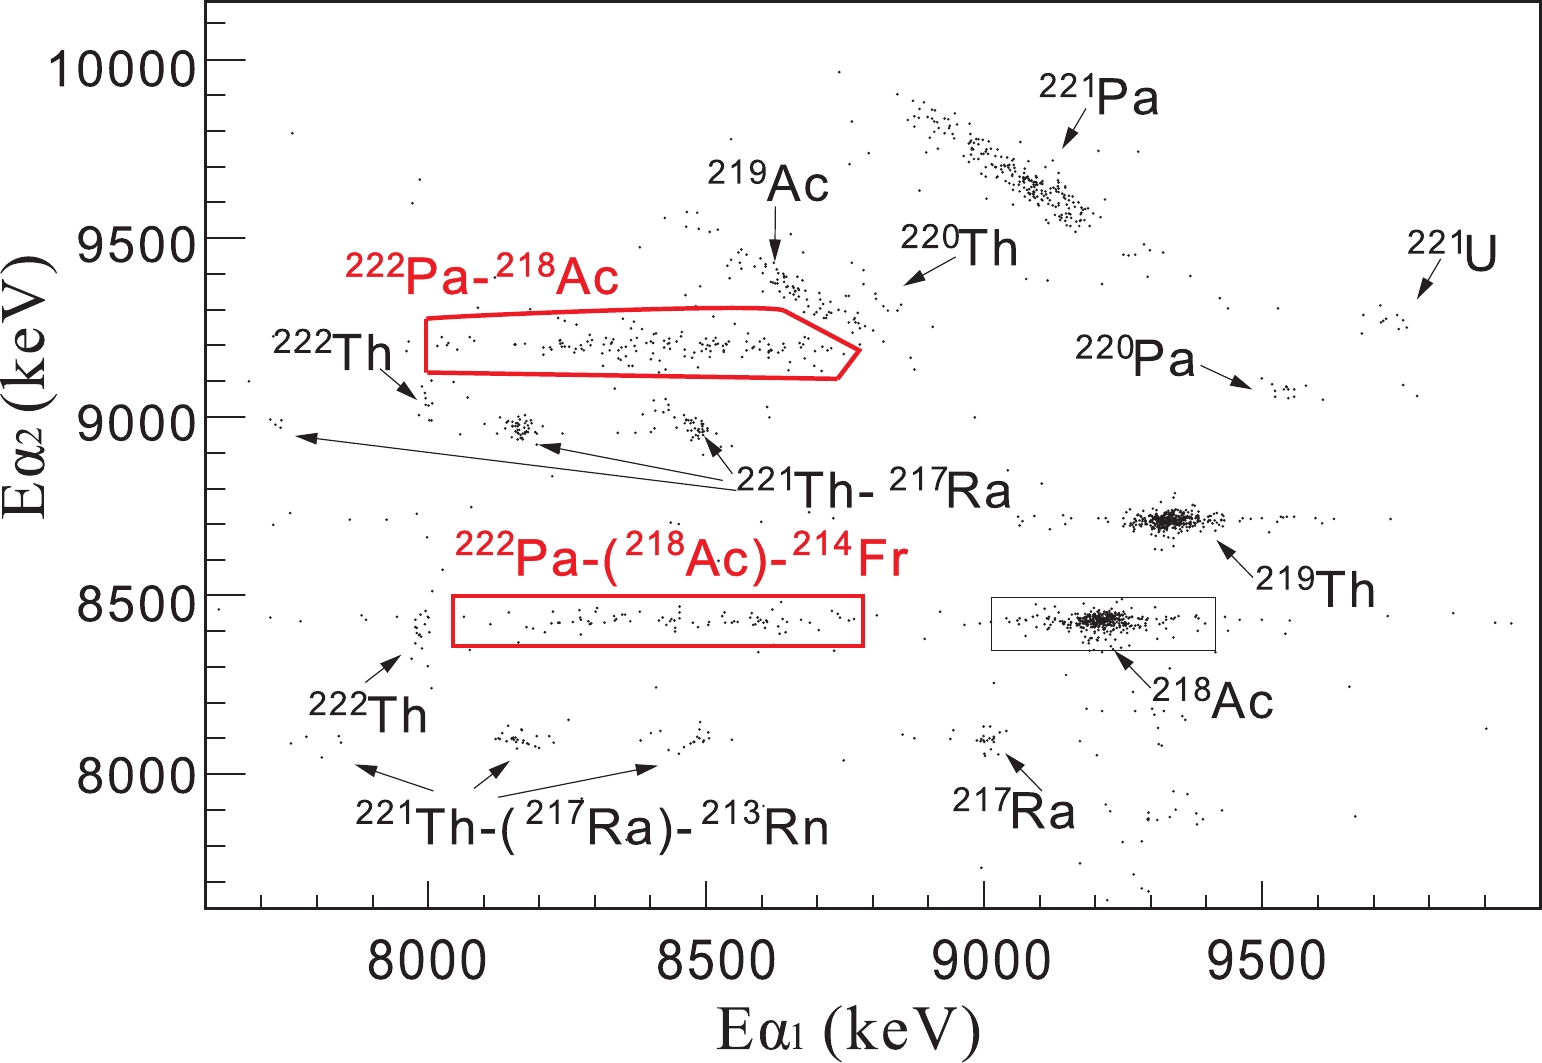
Figure 1. (color online) Two-dimensional scatter plot of
$ \alpha $ -particle energies for correlated ER-$ \alpha_{1} $ -$ \alpha_{2} $ events measured in the PSSDs. The searching time was 30 ms for the ER-$ \alpha_{1} $ pair and 50 ms for the$ \alpha_{1} $ -$ \alpha_{2} $ pair.Based on the tabulated
$ \alpha $ -decay properties [9], the U, Pa, Th, and Ac isotopes were clearly identified. In the clusters of$ ^{222} $ Pa-$ ^{218} $ Ac and$ ^{222} $ Pa-($ ^{218} $ Ac)-$ ^{214} $ Fr, the energy distribution of$ ^{222} $ Pa was broader than that in the previous results [1, 2], shown in Fig. 2(a). The peaks at 8250, 8338, and 8525 keV (marked in black) are the known branches signed with 8.16-8.18-8.21, 8.33 MeV, and 8.54 MeV in a previous study [1]. Besides these three branches, three new components emerged; they are marked with green arrows. To identify the new branches, all the ER-$ \alpha _{1} $ -$ \alpha_{2} $ -$ \alpha_{3} $ events were checked (they are listed in Table 1). All of the 34 chains came from the$ ^{222} $ Pa-$ ^{218} $ Ac cluster; this is consistent with the signature of$ ^{222} $ Pa-($ ^{218} $ Ac)-$ ^{214} $ Fr whose granddaughter nuclei$ ^{210} $ At live too long to be detected.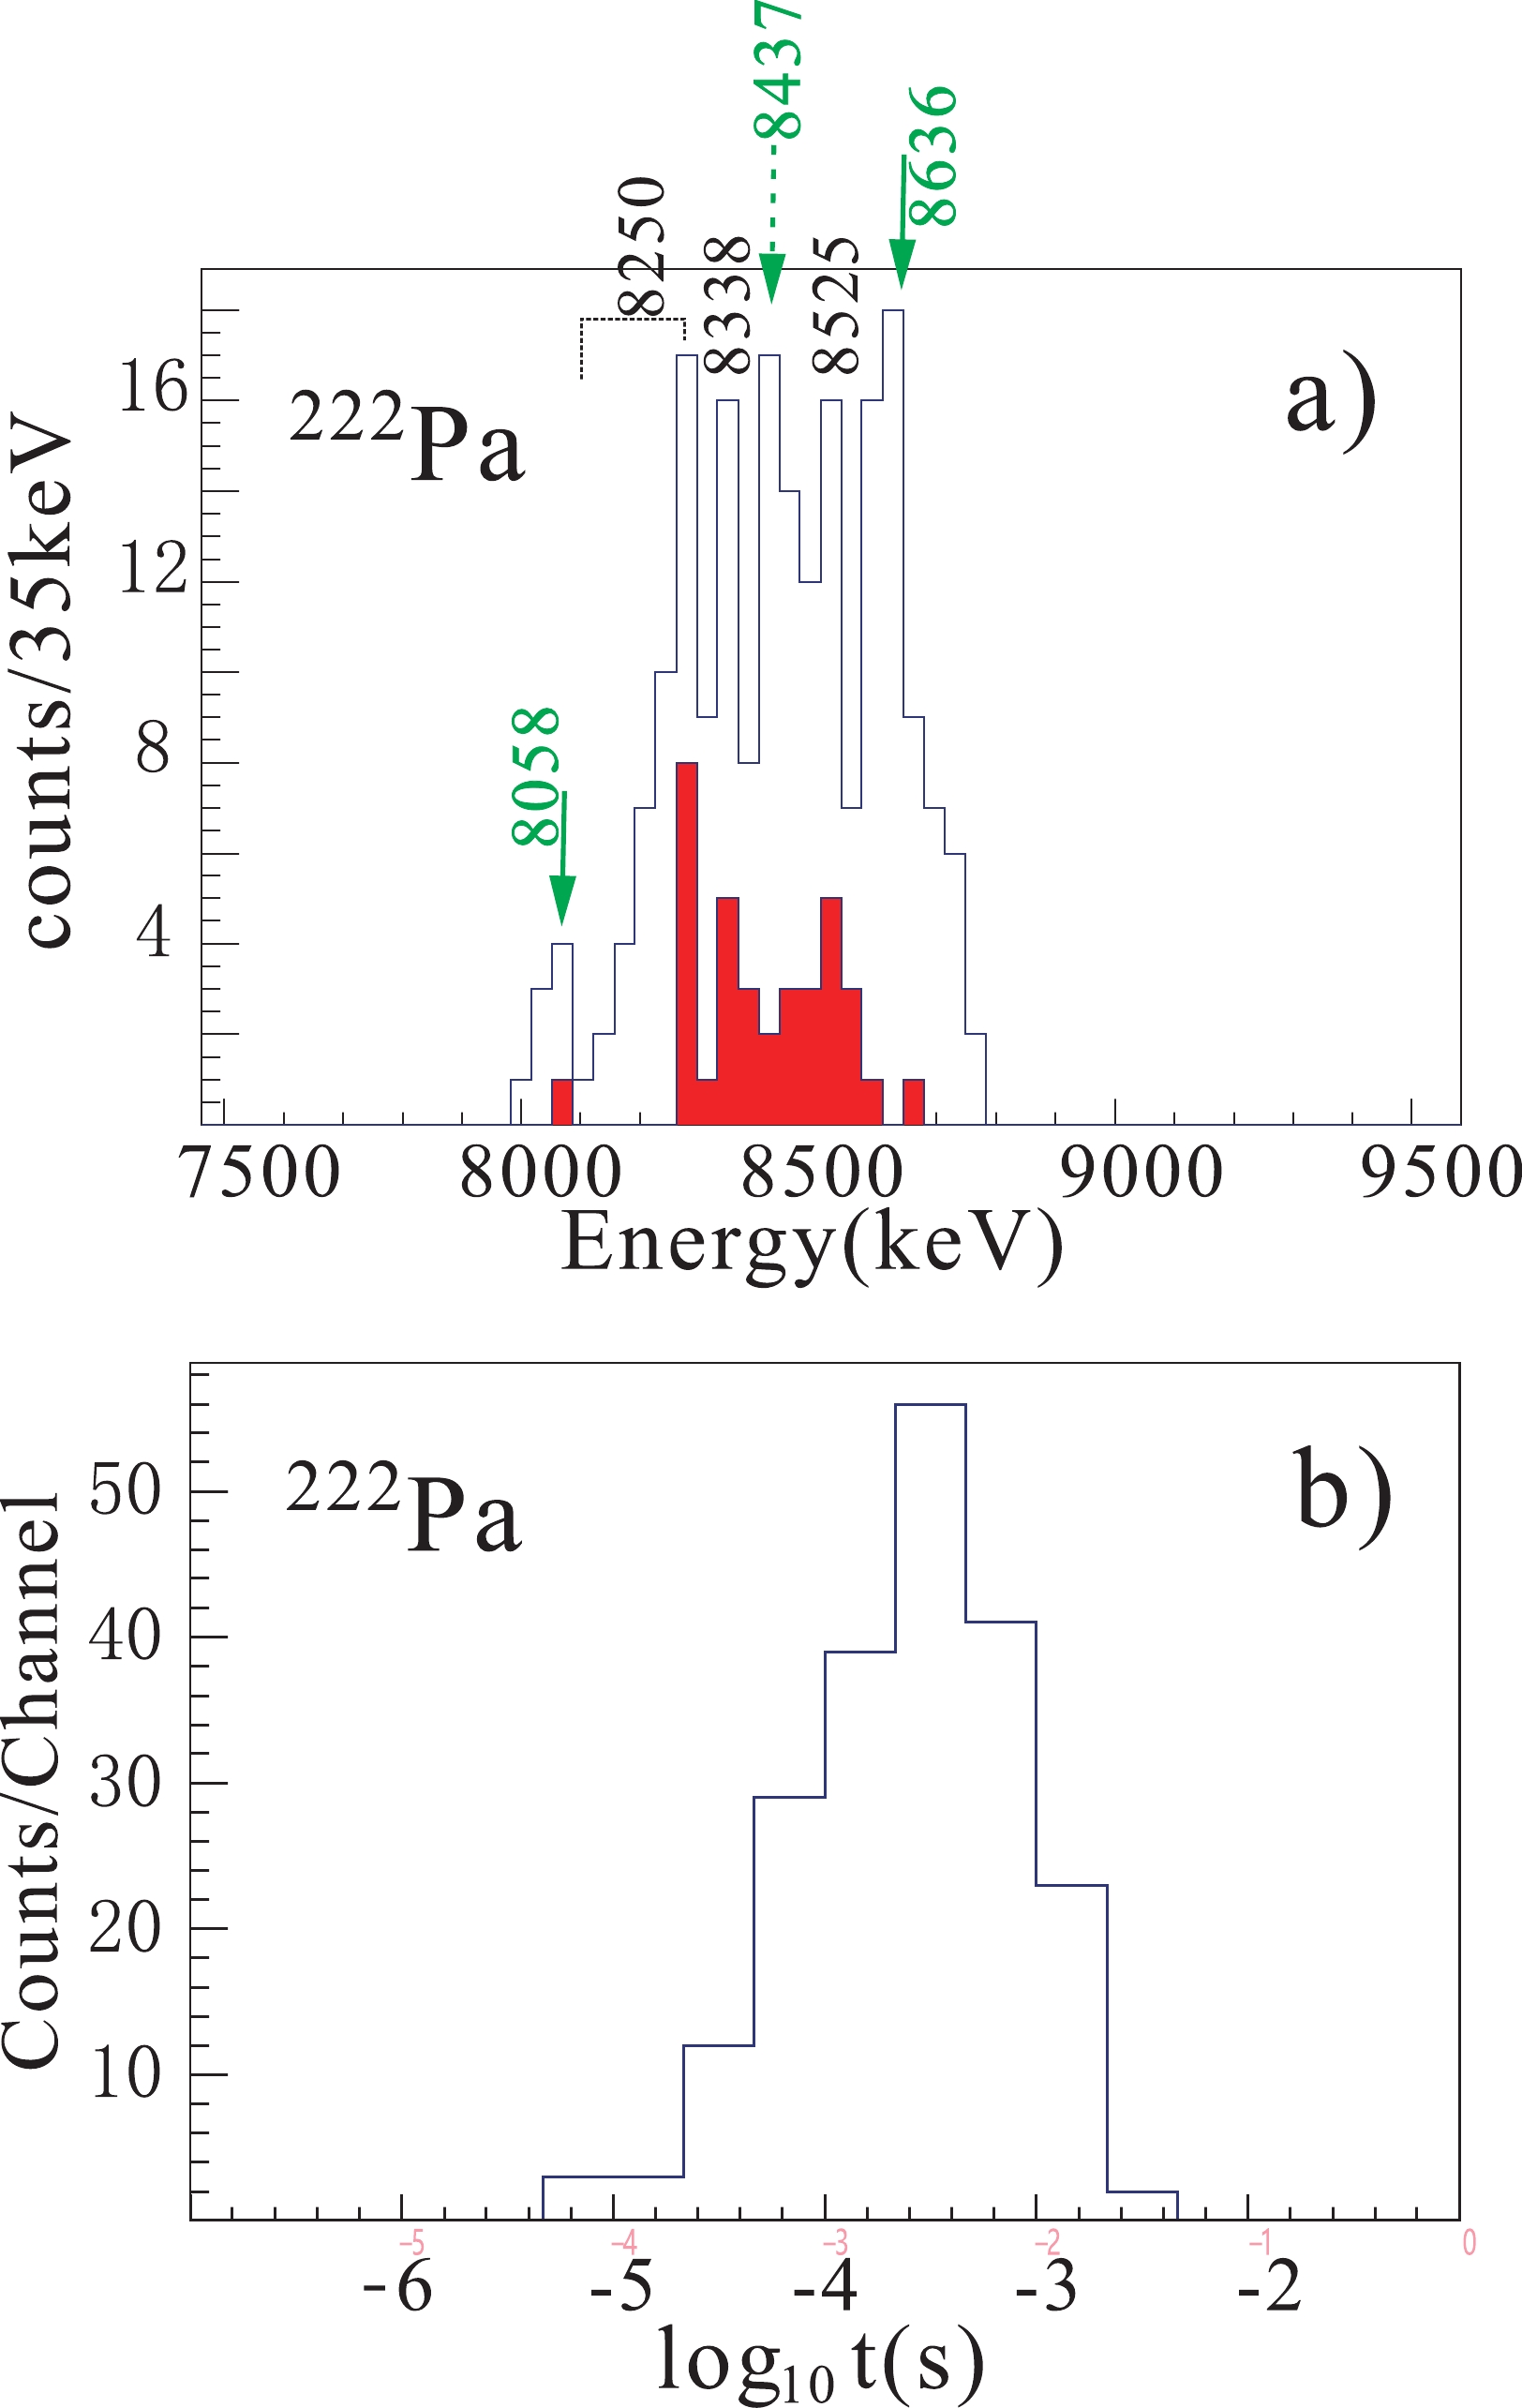
Figure 2. (color online) a) Total projected
$ \alpha $ spectrum of$ ^{222} $ Pa. The energy value of each peak was obtained in this study. The red parts are the$ \alpha $ decays correlated with$ ^{218} $ Ac X rays. New observed branches are marked by green arrows, with the uncertain one marked with a dashed arrow. The corresponding decay-time distribution is shown in part b.Chain No. $E_{\rm ER}$ /keV

$E_{\alpha_1}$ /keV

$\vartriangle t_{\alpha_1}$ /ms

$E_{ \alpha_2}$ /keV

$\vartriangle t_{ \alpha_2}$ /

$\mu$ s

$E_{\alpha_3}$ /keV

$\vartriangle t_{ \alpha_3}$ /ms

1 11655 8025 2.43 9223 0.87 8429 0.22 2 13488 8017 1.34 9199 4.63 8433 7.40 3 13624 8083 4.54 9212 2.20 8431 8.12 4 14279 8434 2.33 9218 1.09 8373 3.96 5 11404 8456 0.54 9237 0.77 8430 8.94 6 12452 8405 0.57 9178 1.22 8424 7.62 7 13270 8433 7.46 9207 0.89 8442 2.80 8 14858 8385 7.46 9246 0.26 8386 3.76 9 13596 8393 2.19 9207 0.89 8437 4.50 10 9354 8417 1.95 9157 0.16 8412 8.71 11 17285 8375 0.26 9221 1.21 8415 6.70 12 11373 8400 5.01 9162 1.46 8447 15.77 13 10887 8424 3.18 9213 1.81 8426 16.08 14 12992 8425 2.12 9195 0.43 8445 7.34 15 13675 8410 2.18 9234 0.26 8455 24.08 16 11763 8575 11.36 9234 0.24 8459 10.99 17 12928 8613 0.67 9166 2.47 8420 5.21 18 13875 8583 0.51 9192 1.03 8443 11.30 19 11868 8629 3.60 9181 0.29 8430 3.48 20 12377 8586 2.49 9197 0.74 8420 6.51 21 11655 8613 0.87 9184 4.67 8420 4.44 22 9481 8612 2.33 9185 2.45 8430 7.61 23 11661 8695 12.15 9184 2.10 8389 2.68 24 10832 8637 1.85 9186 1.96 8403 16.75 25 12649 8649 4.79 9131 0.19 8417 1.62 26 14256 8725 8.91 9193 2.59 8427 4.18 27 12151 8695 4.69 9143 0.27 8451 16.91 28 11469 8708 3.46 9129 0.11 8445 0.21 29 12952 8684 1.05 9219 7.80 8413 13.3 30 11868 8629 3.60 9181 0.29 8430 3.48 31 11347 8650 3.61 9154 0.77 8437 11.32 32 11998 8747 2.29 9176 2.29 8422 4.27 33 9726 8677 13.83 9164 2.25 8415 1.29 34 11282 8671 1.40 9195 2.45 8424 1.12 Table 1. Measured
$\alpha $ -decay chains ER-$ \alpha_1 $ -$ \alpha_2 $ -$ \alpha_3 $ for the three new observed components.$E_{\rm ER}$ ,$E_{\alpha 1}$ ,$ E_{\alpha 2} $ , and$E_{\alpha 3}$ are the energies of the evaporation residue, mother nuclide, daughter nuclide, and granddaughter nuclide respectively;$\vartriangle t$ is the decay time of the chain members.The listed information of
$ \alpha_{2} $ and$ \alpha_{3} $ energies are in good agreement with the$ \alpha $ decay from the ground states of$ ^{218} $ Ac and$ ^{214} $ Fr at 9204 keV (1.06$\mu\rm s$ ) and 8426 keV (5.0 ms) [10, 11, 12], respectively, leading to sign$ \alpha_{1} $ originating from$ ^{222} $ Pa without ambiguity.Multi-Gause fitting was applied to obtain the results listed in Table 2. The branch at 8058 keV is clearly separated from the right components. Its
$ \sigma $ value helped to set the parameters when fitting the overlapping peaks. The known 8.16-8.18-8.21 MeV branch is the peak at 8250 keV here, which does not have a better resolution in this study. The 8338 keV branch is overlaying on the 8250 keV part. The ratio between these two branches is 3:4 in our study, which is close to a previously reported result, 3:5 [1]. The 8437 keV branch was not reported in the previous study [1], because a mix occurred within the$ ^{214g} $ Fr decay at 8426 keV. Using the rational$ \sigma $ deduced by the 8058-keV peak, together with the associated correlation relationship, we postulate that the peak at 8437 keV could be a possible new branch in the refined$ \alpha $ decay structure of$ ^{222} $ Pa. Given that it is squashed between the two known peaks, we marked it with the dashed arrow; its energy value is marked with brackets in Table 2. Note that the 8525 keV branch was also observed in our experiments but with the new suggested intensity ratio. The highest-energy component at 8636 keV is another new branch observed in this study. The 8525 keV part could not give rise to this evident peak in this energy region, even if the tailing effect is taken into account by summing the energy from the internal conversion electrons. Note that, in the experimental results published by A. K. Mistry [13], two new branches were observed at 8.47 and 8.63 keV, but no assignments or conclusions were provided in that study, in which the energies were extracted using a pulse-shape analysis in the form of a trapezoidal filter [14]; the typical energy error was 40 keV for the$ \alpha $ peaks of$ ^{222} $ Pa [13]. In our study, a better energy resolution was obtained, because the energy was extracted by exponential fitting of the signal trace, taking the sloping baseline into consideration [8]. The results deduced in our study are expected to be more accurate to demonstrate the experimental data. The$ Q_\alpha $ value deduced from this energy, corrected for the recoil energy and the screening effect of the atomic electrons, is 8830(15) keV. The interpolated value published in the latest atomic mass evaluation is 8886(50) keV [3]. Therefore, it might be regarded as the ground state to ground state (g.s.-g.s.) transitions. To the best of our knowledge, this is the first experimental determination of the g.s-g.s decay energy of$ ^{222} $ Pa.Isotope $E_{\alpha}$ /keV

Intensity(%) $T_{1/2}$ 

Previous studies $E_{\alpha}$ (Int.)

Previous studies $T_{1/2}$ 

8058(18) 5.7 8250(16) 19.2 8.16-8.18-8.21 MeV (50%) [1] $ ^{222} $ Pa

8338(16) 14.4 2.76 $ {^{+0.43}_{-0.33}}$ ms

8.33 MeV (30%) [1] 5.7 $\pm$ 0.5 ms [1]

(8437(16)) (19.9) 8525(16) 15.9 8.54 MeV (20%)[ 1] 8636(15) 24.9 $ ^{218} $ Ac

9197(15) 100 0.87 ${^{+0.18}_{-0.07} } \;\mu{\rm s}$ 

9204(15) keV (100%) [10] 1.06(9) µs [10] $ ^{214} $ Fr

8429(15) 5.51 $ {^{+1.65}_{-1.03}} $ ms

8426(5) keV(93%) [12] 5.0 $\pm$ 0.2 ms [12]

Table 2. Measured results in this study compared with values reported in previous studies.
A further verification to support the tentative assignment is to check the spectrum coincident with the X-ray, filled in red in Fig. 2. The
$ E_{\alpha 1} $ -$ \gamma $ plot extracted from these data is shown in Fig. 4. The three peaks in the projected spectrum correspond to the characteristic$ K_{\alpha 1} $ ,$ K_{\alpha 2} $ , and$ K_{\beta 1} $ X-ray of$ ^{218} $ Ac at 87.7-, 90.9-, and 102.8-keV, respectively. The first 4 branches are all followed by X-ray of$ ^{218} $ Ac, because they populate the excited states of$ ^{218} $ Ac. Meanwhile, no X-ray peaks (only one event) accumulate at a range larger than 8600 keV. In consideration of the largest intensity ratio of the 8636 keV branch, having the same order as those of other known branches, the X-ray-correlated events should exhibit the same order of magnitude as others if they possess the same ground-excited characteristic. Under general analysis, we suggest that the$ \alpha $ decay at 8636 keV is a g.s.-g.s. transition. The measured results deduced from Fig. 2 and Fig. 3 are compiled in Table 2. The low intensity branches of$ ^{214} $ Fr observed in a previous study cannot be clarified here, because of the low statistics obtained.
Figure 4. (color online)
$$ (EX)-$ E_{\alpha 1} $ plot extracted from the events in the cluster$ ^{222} $ Pa-$ ^{218} $ Ac (below). The projected spectrum of the X-ray is presented above.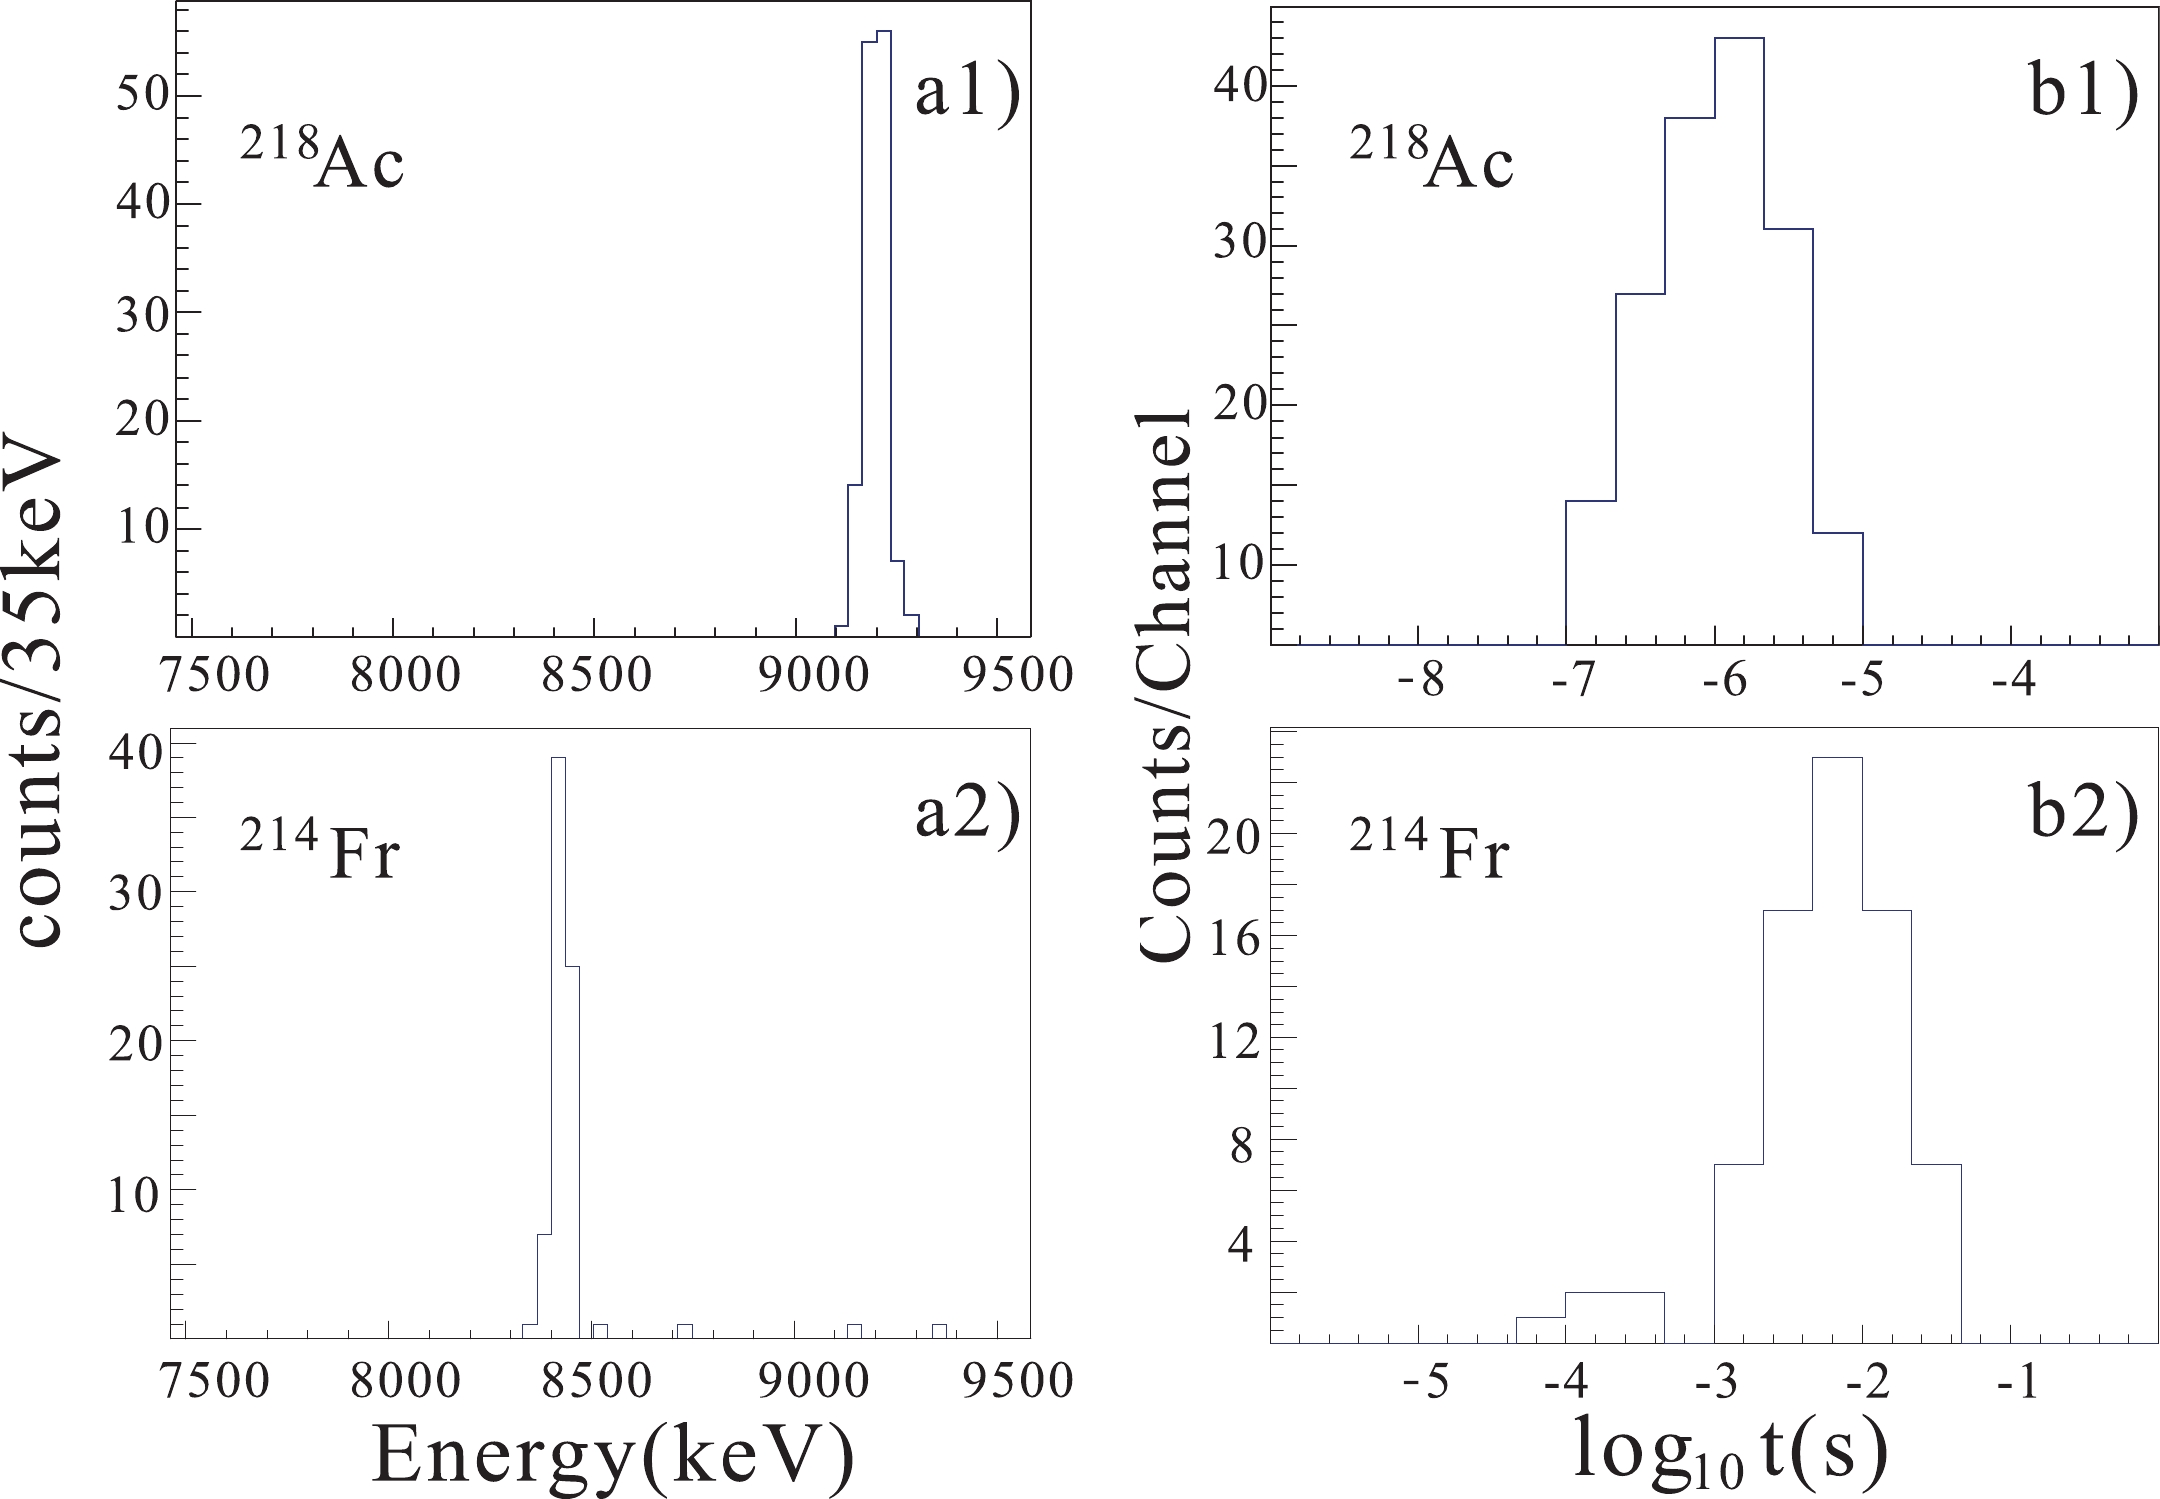
Figure 3. (color online) a)
$ \alpha $ spectra of$ ^{218} $ Ac and$ ^{214} $ Fr derived from the cluster$ ^{222} $ Pa-$ ^{218} $ Ac and$ ^{222} $ Pa-($ ^{218} $ Ac)-$ ^{214} $ Fr. b) Corresponding decay-time distribution. -
To date, we could complete the experiment plots of
$ Q_{\alpha} $ for Pa, Th, and Ac isotopes; they are shown in Fig. 5. The data in this study with relative high yields, that is,$ ^{220,222} $ Pa,$ ^{219} $ Th, and$ ^{216,218} $ Ac, are marked with red symbols. The hollow ones are data points extracted from previous studies [3], among which the$ ^{222} $ Pa value was estimated by the interpolation method. The decay energy values of$ ^{220} $ Pa-9756(18) keV,$ ^{219} $ Th-9541(16) keV, and$ ^{216,218} $ Ac-9270(17), 9417(15) keV are consistent with previous experimental data within the error margin [9, 15]. The new$ Q_{\alpha} $ ($ ^{222} $ Pa) value matches very well with the systematical estimated value, that is, 8886(50) keV.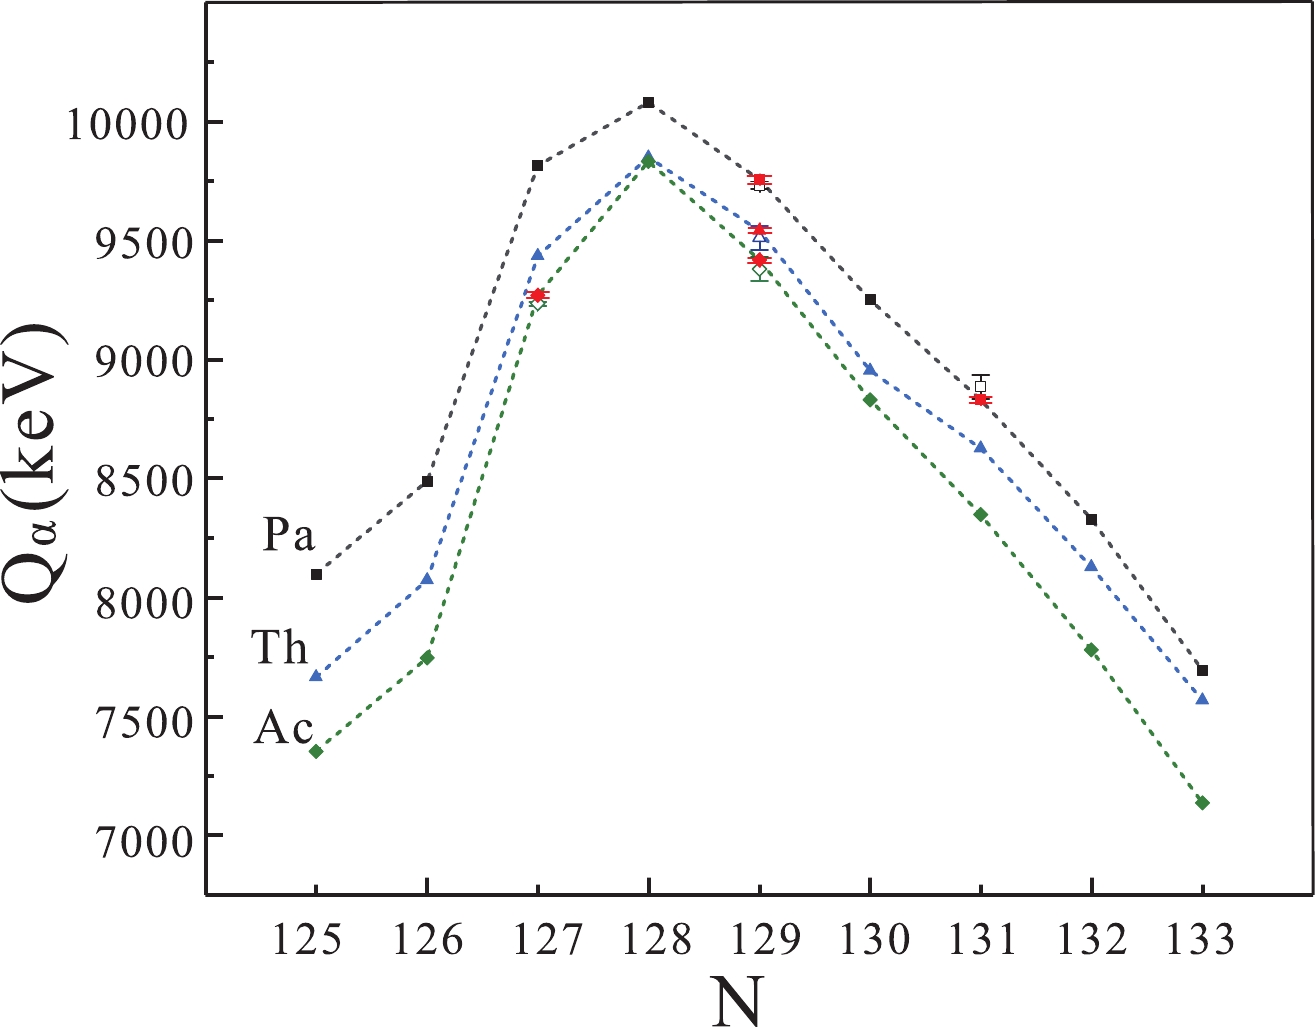
Figure 5. (color online)
$ Q_{\alpha}$ for Pa, Th, and Ac isotopes close to N = 126 shell. The data obtained in this study are marked with red solid symbols, while the corresponding hollow ones are the latest values reported in previous studies.The proton Fermi surface of
$ Z\approx $ 92 nuclide is close to$ h_{9/2} $ and$ f_{7/2} $ orbitals. The large-scale shell-model calculations with KSHELL code [16] and KHPE interaction[17] suggest that$ \pi h_{9/2} $ is the dominating proton configuration. All ground states of odd-Z nuclides in N = 128,130 isotones are 9/2$ ^+ $ [9]. The ground state of the adjacent isotone$ ^{221} $ Th is assigned to be 7/2$ ^+ $ , originating from an$ i_{11/2} $ -like decoupled band [18]. For$ ^{220} $ Ac, the odd-Z N = 131 isotone next to$ ^{222} $ Pa exhibits a ground state assigned as 3$ ^- $ and dominated by the$ \pi h_{9/2}\nu i_{11/2} $ configuration [19]. Therefore, a temporary assumptive spin-parity 3$ ^- $ and configuration$ \pi h_{9/2}\nu i_{11/2} $ were assigned to the ground state of$ ^{222} $ Pa in this study. The$ \alpha $ -decay reduced width$ \delta^2 $ [20], taking into account the angular momentum of the emitted$ \alpha $ particles ($ \Delta l $ ), is widely used as an effective variable to analyze the nuclear structure information. For the ground states of the daughter nuclides of N = 131 isotones, all are 1$ ^- $ . We employed$ \Delta l $ = 2 and the measured$ E_{\alpha} $ and$ T_{1/2} $ to deduce the$ \delta^2 $ value of$ ^{222} $ Pa, i.e., 6.45$ ^{+1.01}_{-0.07} $ keV. A deep valley appears from Z = 88 to Z = 91. Their$ \delta^2 $ values are lower than the higher ones by a factor of 10 at least. This strengthened hindrance may be due to the different neutron configuration of the initial and final states, in which the valence neutron of$ ^{218} $ Ac occupies the$ g_{9/2} $ orbital. Furthermore, the staggering pattern is strengthened in N = 131 isotones, compared with N = 129 and N = 133 ones, as shown in Fig. 6. This peculiar phenomenon deserves further investigation in both experimental and theoretical studies in future.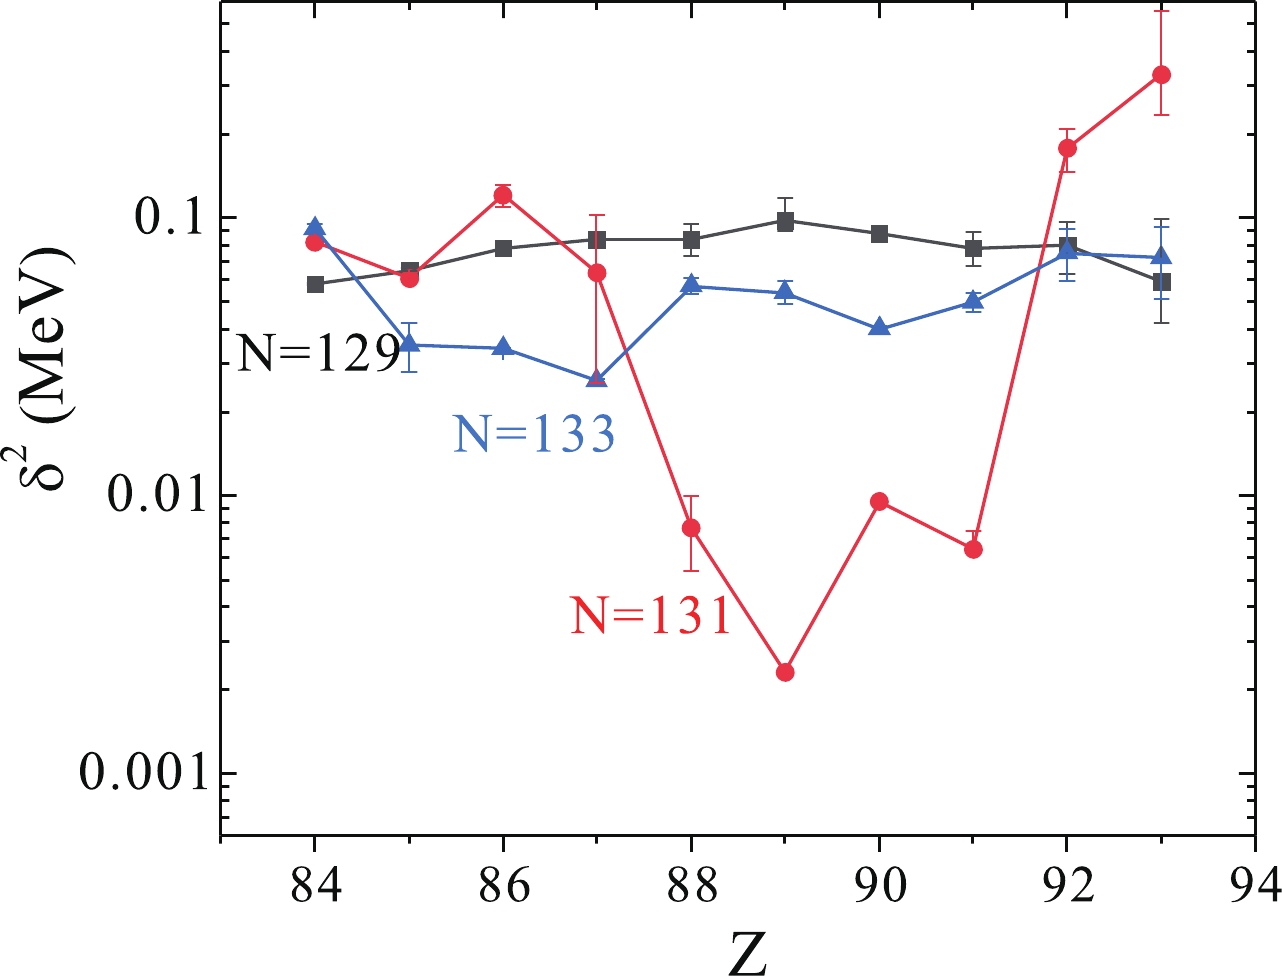
Figure 6. (color online)
$ \delta^2$ plots of N = 129, 131, 133 isotones. -
The
$ \alpha $ -decay fine structure of$ ^{222} $ Pa was updated in this study. Three new$ \alpha $ branches at 8058(18), 8437(16), and 8636(15) keV were added in the decay manner. Because of the low$ \gamma $ statistics, we could not specify the low-energy excited level scheme of the daughter nuclide$ ^{218} $ Ac, but the X-ray spectra helped us to examine the$ \alpha $ decay manner. The corresponding decay energy$ Q_\alpha $ of the branch at 8636(15) keV was 8830(15) keV, which is consistent with the predicted ground state to ground state decay value, 8890(50) keV, within the error bar. The$ \alpha $ -decay reduced width$ \delta^2 $ of N = 131 isotones from Ra to Pa staggered drastically and were lowered typically by a factor of 10 relative to the neighboring nuclide. This indicated an enhanced structural hindrance. -
The authors would like to thank the colleagues of the SHANS group and the accelerator group at the Institute of Modern Physics, Chinese Academy of Sciences, who provided great support in the experiments.
Fine structure of α decay in 222Pa
- Received Date: 2020-09-15
- Accepted Date: 2020-11-26
- Available Online: 2021-04-15
Abstract: With the help of the gas-filled recoil spectrometer SHANS and a digital data acquisition system, the fine structure of the


 DownLoad: