


 Abstract
 HTML
HTML Reference
 Related
 PDF
PDF


-
Cluster radioactivity was first theoretically predicted by S
$ \check{a} $ ndulescu, Poenaru, and Greiner in 1980 [1]. It refers to the nuclei's ability to spontaneously emit clusters heavier than the α particle and lighter than fission fragments. Four years after this theoretical prediction, Rose and Jones observed the 14C cluster emitted by 223Ra in experiments for the first time [2]. Many cluster radioactivities have been observed in experiments, such as the clusters 14C, 15N, 20O, 23F, 22,24-26Ne, 28,30Mg, and 32,34Si emitted from 221Fr to 242Cm [3–11]. Interestingly, all the daughter nuclei of cluster radioactivity are nuclei around 208Pb, such as 207Bi, 207,209-212Pb, 206-208Hg, and 207Tl, because 208Pb is more stable than others and leads to a larger energy value of cluster radioactivity.Cluster radioactivity has been a hot topic in nuclear physics over the past few decades. Several models suggest that cluster radioactivity has a similar theory of barrier penetration to α decay, based on Gamow's picture [12, 13], which assumes that the cluster is preformed in the parent nucleus with a certain probability of cluster formation before emission. For instance, the density-dependent cluster model (DDCM) [14–17] and preformed cluster model (PCM) [18–20]. In addition, there are theoretical models that treat cluster radioactivity as fission processes, such as the effective liquid drop model (ELDM) [21] and Coulomb and proximity potential model (CPPM) [22, 23]. Furthermore, several analytical formulae have been proposed to study cluster radioactivity, including the universal decay law (UDL) [24], unified formula [25], universal curve [7], and new Geiger-Nuttall law for cluster radioactivity half-lives [26].
One of the main challenges in cluster radioactivity is calculating the cluster preformation factor
$ P_c $ . Currently, the most common method is to extract the cluster preformation factor from the experimental data of the cluster radioactivity half-life [20, 27–30]. In 1988, Blendowske and Walliser considered the extracted cluster preformation factor$ P_c(A_c) $ to depend on the α preformation factor$ P_{\alpha} $ and proposed the preformation law of cluster radioactivity$ P_c(A_c)= P_{\alpha}^{(A_c-1)/3} $ , where$ A_c $ is the mass number of the emitted cluster [27]. Recently, it was found that when the mass number of the emitted cluster$ A_c\leq28 $ , the extracted cluster preformation factor is exponentially proportional to the α preformation factor. However, this relationship breaks down when$ A_c\geq 28 $ [20]. In the PCM, the value of$ P_c $ is determined by solving the stationary Schr$ \ddot{{\rm{o}}} $ dinger equation for the dynamical flow of mass and charge [18–20]. In the redefined PCM (RPCM) [7, 31–33], the total potential barrier is divided into external and internal barriers, and the preformation factor of an α particle or cluster is equal to the quantum penetrability of the internal potential barrier. Similarly, the penetration probability is equivalent to the quantum penetrability of the external barrier.Recently, Qi et al. showed that
$ \log_{10}P_c $ , the logarithms of the cluster preformation factor, obtained using two different approaches are linearly dependent on$ N_p N_n $ for the parent nuclei, where$ N_p $ and$ N_n $ denote the number of valence protons and valence neutrons around the proton$ Z=82 $ and neutron$ N=126 $ shell closures, respectively [30]. In the first approach,$ P_c $ is calculated using the preformation law of cluster radioactivity [27]$ P_c=P_{\alpha}^{(A_c-1)/3} $ for$ A_c\leq28 $ , in which the α decay preformation factor$ P_{\alpha} $ is obtained using the cluster formation model (CFM) with the binding energy differences of α decaying nuclei and their neighboring ones [34–36]. For$ A_c\geq 28 $ ,$ P_c $ is determined using the analytic formula [14]. In the second approach,$ P_c $ is extracted through the ratios of the calculated cluster radioactivity half-lives employed in the unified fission model (UFM) to the experimental data [29], where in the UFM, the total interaction between the emitted cluster and daughter nucleus consists of the Coulomb, nuclear proximity, and centrifugal potentials [29]. The generalized liquid drop model (GLDM) differs from the CFM [34–36] and UFM [29] in its treatment of cluster radioactivity. The GLDM introduces the quasimolecular shape mechanism, which can describe the complex deformation process from the continuous transition of the parent nucleus to the appearance of a deep and narrow neck, and finally to two tangential fragments [37, 38]. The GLDM also introduces the proximity energy, including a precise radius and mass asymmetry, to account for the effects of nuclear forces between the close surfaces of the separated fragments [28, 39–41]. In this study, the GLDM is further improved by introducing the shape-dependent shell correction and pairing energies, as well as the cluster preformation factor obtained from the penetrability of the internal potential barrier.The proton-neutron (
$ p-n $ ) interaction and shell effect play essential roles in understanding the properties of nuclei. The$ N_p N_n $ scheme allows a unified description of structure evolution for a variety of observables and highlights the importance of the valence$ p-n $ interaction [42]. To explore the shell effect and valence$ p-n $ interaction on cluster radioactivity, it is important to examine whether the linear relationship between$ \log_{10}P_c $ and$ N_p N_n $ is model-dependent or model-independent. Therefore, in this study, based on the GLDM, two types of cluster preformations are studied in terms of the$ N_p N_n $ scheme, in which the cluster preformation factors are extracted from the experimental data or calculated using the quantum penetrability of the internal potential barrier [7, 31–33]. The results indicate that both types of$ \log_{10}{P_c} $ are proportional to$ N_p N_n $ . This is consistent with the recent study by Qi et al. [30] and indicates that the$ \log_{10}{P_c} $ of nuclei around the$ Z=82 $ and$ N=126 $ shell closures is linearly dependent on$ N_p N_n $ in a model-independent manner, and the shell effect and valence$ p-n $ interaction play essential roles in cluster radioactivity.This article is organized as follows. In Sec. II, theoretical frameworks of the GLDM and cluster radioactivity half-life are briefly presented. The detailed calculations and discussion are given in Sec. III. Finally, Sec. IV offers a brief summary.
-
In the GLDM, the macroscopic energy
$ E_{{\rm{mac}}} $ consists of the volume energy$ E_V $ , surface energy$ E_S $ , Coulomb energy$ E_c $ , proximity energy$ E_{{\rm{Prox}}} $ , and centrifugal potential$ E_l $ [37].$ E_{{\rm{mac}}}=E_V+E_S+E_C+E_{{\rm{Prox}}}+E_l . $

(1) For one-body shapes, the volume, surface, and Coulomb energies are given as
$ E_V=-15.494(1-1.8I^2)A , $

(2) $ E_S=17.9439(1-2.6I^2)A^{2/3}(S/4{\pi}R_0^2) , $

(3) $ E_C=0.6e^2(Z^2/R_0)\times 0.5\int(V(\theta)/V_0)(R(\theta)/R_0)^3\sin\theta{{\rm d}\theta} , $

(4) where S is the surface of a one-body deformed nucleus, I denotes the relative neutron excess,
$ V(\theta) $ is the electrostatic potential at the surface, and$ V_0 $ represents the surface potential of the sphere.For two separate fragments, the volume, surface, and Coulomb energies are expressed as
$ E_V=-15.494[(1-1.8I_1^2)A_1+(1-1.8I_2^2)A_2] , $

(5) $ E_S=17.9439[(1-2.6I_1^2)A_1^{2/3}+(1-2.6I_2^2)A_2^{2/3}] , $

(6) $ E_C=0.6{\rm e}^2Z_1^2/R_1+0.6{\rm e}^2Z_2^2/R_2+{\rm e}^2Z_1Z_2/r , $

(7) where
$ A_i $ ,$ Z_i $ ,$ R_i $ , and$ I_i $ ($ i=1, 2 $ ) are the mass numbers, proton numbers, radii, and relative neutron excesses of the emitted cluster and daughter nucleus, respectively.The proximity energy considers the effects of the nuclear forces between a neck or gap, which occur in one-body forms, or between separated fragments [37, 43]. It is expressed as
$ E_{\rm{Prox}}(r)=2\gamma\int_{h_{\rm{min}}}^{h_{\rm{max}}}\Phi[D(r,h)/b]2\pi{h}{\rm d}h , $

(8) where the surface parameter γ is defined as the geometric mean between the surface parameters of the two fragments.
$ \gamma=0.9517\sqrt{(1-2.6I_1^2)(1-2.6I_2^2)} , $

(9) where h is the distance varying from the neck radius or zero to the height of the neck border, D is the distance between the surfaces considered,
$ b=0.99 $ fm is the surface width, and Φ expresses the proximity function.The centrifugal barrier
$ E_l(r) $ can be obtained using$ E_l(r)=\frac{{\hbar}^2l(l+1)}{2{\mu}r^2} , $

(10) where l, the angular momentum carried by the emitted cluster, is obtained from the conservation laws of angular momentum and parity.
-
The GLDM microscopic energy
$ E_{{\rm{mic}}} $ includes the shape-dependent shell correction energy and shape-dependent pairing energy, which is expressed as$ E_{{\rm{mic}}}=E_{\rm{shell}}+E_{\rm{pair}} . $

(11) -
The shape-dependent shell correction energy can be obtained within the droplet model expressions [44]:
$ E_{\rm{shell}}=E^{\rm{sphere}}_{\rm{shell}}(1-2.6\alpha^2){\rm e}^{-\alpha^2} , $

(12) where
$ \alpha^2=({\delta}R)^2/a^2 $ is the Myers-Swiatecki measure for the deformation of the nucleus. The range a is$ 0.34r_0 $ . The distortion is the root-mean-square value of the deviation of the radius vector$ R(\theta, \phi) $ , specifying the nuclear surface,$ ({\delta}R)^2=\frac{{\displaystyle\iint}(R-R_0)^2{\rm d}{\Omega}}{{\displaystyle\iint}{\rm d}{\Omega}} . $

(13) ${\rm e}^{-\alpha^2}$ , the attenuating factor, determines that the shell correction energy decreases as the nuclear distortion increases.The microscopic shell correction energy for a spherical nucleus
$ E^{\rm{sphere}}_{\rm{shell}} $ can be obtained via$ E^{\rm{sphere}}_{\rm{shell}}=cE_{\rm{sh}} , $

(14) which is obtained using the traditional Strutinsky method by setting the smoothing parameter
$ \gamma=1.15\omega_0 $ and the order$ p= 6 $ of the Gauss-Hermite polynomials, where$ \omega_0= 41A^{-1/3} $ MeV denotes the mean distance between the gross shells [45], the sum of the shell energies of protons and neutrons. In addition, the scale factor$ c=0.72 $ is introduced to calculate the shell correction. The single-particle levels with an axially deformed Woods-Saxon potential are calculated and then the Strutinsky method is performed to calculate the shell correction energy. The single-particle Hamiltonian is expressed as$ H=T+V+V_{{\rm{S.O.}}} , $

(15) where the spin-orbit potential
$ V_{{\rm{S.O.}}} $ is given by$ V_{{\rm{S.O.}}}=\lambda\left(\frac{{\hbar}}{2Mc}\right)^2{\nabla}V\cdot(\vec{\sigma}\times \vec{p}) , $

(16) where M denotes the free nucleonic mass,
$ \vec{\sigma} $ represents the Pauli spin matrix,$ \vec{p} $ is the nucleon momentum, and λ is the strength of the spin-orbit potential.$ \lambda=\lambda_0(1+N_i/A) $ with$ N_i=Z $ for protons and$ N_i=N $ for neutrons and$ \lambda_0=26.3163 $ . V, the central potential, is obtained in an axially deformed Woods-Saxon form:$ V=\frac{V_q}{1+\exp\left[\dfrac{r-R(\theta)}{a}\right]} , $

(17) where
$ r-R(\theta) $ is the distance from a certain point r to the nuclear surface. The depth$ V_q $ of the central potential ($ q=n $ for neutrons and$ q=p $ for protons) can be given by$ V_q=V_0{\pm}V_SI , $

(18) with a minus sign for protons and a plus sign for neutrons.
$ V_0=47.4784 $ MeV is the depth of the central potential. The diffuseness parameter$ a=0.7842 $ fm.$ V_S $ and I denote the isospin-asymmetric part of the potential depth and the relative neutron excess, respectively. They can be obtained via$ V_S=c_{{\rm{sym}}}\left[1-\frac{\kappa}{A^{1/3}}+\frac{2-{\left|{I}\right|}}{2+{\left|{I}\right|}A}\right] , $

(19) with
$ c_{{\rm{sym}}}=29.2876 $ and$ \kappa=1.4492 $ [46].The result of the shell correction energy within the Strutinsky method is expressed as
$ E_{\rm{sh}}=\sum_ {i=1}^{N,Z}{\varepsilon}_i-\int_{-\infty}^{\tilde{\lambda}}{{\varepsilon}\tilde{g}({\varepsilon}){\rm d}{\varepsilon}} , $

(20) where
$ {\varepsilon}_i $ represents the single-particle energies of deformed nuclei [47]. The single-particle density$g({\varepsilon})= \sum{\varepsilon}_i\delta({\varepsilon}-{\varepsilon}_i)$ .$ \tilde{\lambda} $ denotes the Fermi energy related to the smoothed distribution of$ \tilde{g}({\varepsilon}) $ . -
To account for the odd-even staggering effects of the unpaired nucleon, the shape-dependent pairing energy of the finite-range droplet mode is introduced [48], which is expressed as
$ E_{{\rm{pair}}}=\left\{\begin{array}{*{20}{l}} {0,}&{{\rm{even}}\; Z -{\rm{even}}\; N \; {\rm{nuclei}},}\\ {\dfrac{4.8B_S}{N^{1/3}},}&{{\rm{even}}\; Z -{\rm{odd}} \; N \;{\rm{nuclei}},}\\ {\dfrac{4.8B_S}{Z^{1/3}},}&{{\rm{odd}}\; Z -{\rm{even}} \; N \; {\rm{nuclei}},}\\ {\dfrac{4.8B_S}{N^{1/3}}+\dfrac{4.8B_s}{Z^{1/3}}-\dfrac{6.6}{B_sA^{2/3}},}&{{\rm{odd}}\; Z -{\rm{odd}}\; N \; {\rm{nuclei}}, }\end{array}\right. $

(21) with the relative surface energy
$ B_S $ being the ratio of the surface area of the nucleus in its actual shape to the surface area of the spherical nucleus. This can be obtained using$ B_S= {{\displaystyle\int_{S}{\rm d}S}}\Big/{S_{\rm{sphere}}} . $

(22) -
The cluster radioactivity half-life can be obtained with the decay constant λ via
$ T_{1/2}=\frac{\ln{2}}{\lambda} . $

(23) where the decay constant of cluster radioactivity, λ, shares the same Gamow's theory as α decay [12, 13]. It can be obtained using the product of the cluster preformation factor
$ P_c $ , assault frequency$ {\cal{\nu}} $ , and barrier penetrating probability P:$ \lambda=P_{c}{\nu}P . $

(24) The assault frequency
$ {\cal{\nu}} $ is expressed as$ \nu=\frac{1}{2R_0}\sqrt{\frac{2E_c}{M_c}} , $

(25) where
$ E_{c} $ and$ M_c $ are the kinetic energy and mass of the emitted cluster, and$ R_0 $ denotes the radius of the parent nucleus, which can be calculated via$ R_{i}=1.28A_{i}^{1/3}-0.76+0.8A_{i}^{-1/3}(i=0,1,2) . $

(26) P, the barrier penetrating probability, is calculated using the Wentzel-Kramers-Brillouin (WKB) approximation as follow
$ P=\exp\bigg[-\frac{2}{\hbar}{\int_{r_{{\rm{cont}}}}^{r_{{\rm{out}}}} \sqrt{2B(r)(E-E({\rm{sphere}}))} {\rm d}r}\bigg] , $

(27) where r is the center of mass distance between the preformed cluster and the daughter nucleus,
$ r_{{\rm{cont}}}=R_1+R_2 $ and$ E(r_{{\rm{out}}}) =Q_{c} $ denote the classical turning points, and the mass inertia$ B(r) $ can be given by$ B(r)=\left\{\begin{array}{*{20}{l}} {\mu\left(1+1.3\sqrt{\dfrac{r_{{\rm{cont}}}-r}{r_{{\rm{cont}}}-r_{{\rm{in}}}}}\right),}&{r\leq{r_{{\rm{cont}}}},}\\ {\mu,}&{r\geq {r_{{\rm{cont}}}}, }\end{array}\right. $

(28) where μ denotes the reduced mass between the cluster and the daughter nucleus. The total GLDM interaction potential E between the cluster and daughter is composed of the macroscopic energy
$ E_{{\rm{mac}}} $ and microscopic energy$ E_{{\rm{mic}}} $ . It is expressed as$ E=E_{{\rm{mac}}}+E_{{\rm{mic}}} . $

(29) Based on the RPCM, the total potential barrier is the sum of the external and internal barriers [7, 31–33]. The cluster preformation factor
$ P_c $ can be obtained from the quantum penetrability of the internal potential barrier [7, 31–33]:$ P_c=\exp\bigg[-\frac{2}{\hbar}{\int_{r_{{\rm{in}}}}^{r_{{\rm{cont}}}} \sqrt{2B(r)(E-E({\rm{sphere}}))} {\rm d}r}\bigg] , $

(30) where
$ r_{{\rm{in}}} $ is the distance between the mass centers of the portions of the initial sphere separated by a plane perpendicular to the deformation axis to assume volume conservation of future fragments. -
The calculated cluster radioactivity half-lives and experimental data are listed in Table 1. In this table, the first column shows the cluster radioactivity including the parent nucleus, daughter nucleus, and emitted cluster. The second and third columns represent the experimental cluster radioactivity energy and the minimum angular momentum taken away by the emitted cluster, obtained using the basis of the conservation laws of angular momentum and parity. The spin and parity values are taken from the latest evaluated nuclear properties table NUBASE2020 [49]. The fourth column gives the experimental data of cluster radioactivity half-lives. The fifth column,
$ \log_{10}T^{{\rm{cal1}}}_{1/2} $ , lists the calculated cluster radioactivity half-lives using the GLDM macroscopic energy$ E=E_{{\rm{mac}}} $ considering the cluster preformation factors calculated with Eq. (30). The sixth column,$ \log_{10}T^{{\rm{cal2}}}_{1/2} $ , contains the calculations of cluster radioactivity half-lives by adopting the total GLDM interaction energy$E= E_{{\rm{mac}}}+E_{{\rm{mic}}}$ considering the cluster preformation factors calculated with Eq. (30). The last column shows the calculated cluster radioactivity half-lives using the UDL for comparison [24].cluster radioactivity $ Q_{c} $ 

$ l_{{\rm{min}}} $ 

$ \log_{10}T^{{\rm{exp}}}_{1/2} $ 

$ \log_{10}T^{{\rm{cal1}}}_{1/2} $ 

$ \log_{10}T^{{\rm{cal2}}}_{1/2} $ 

$ \log_{10}T^{{\rm{UDL}}}_{1/2} $ 

221Fr→207Tl+14C 31.29 3 14.52 12.81 13.32 13.31 221Ra→207Pb+14C 32.40 3 13.32 11.36 12.10 12.25 222Ra→208Pb+14C 33.05 0 11.05 9.78 10.91 11.07 223Ra→209Pb+14C 31.83 4 15.05 12.69 13.62 13.20 224Ra→210Pb+14C 30.53 0 15.89 15.53 16.21 15.59 225Ac→211Bi+14C 30.48 4 17.21 16.95 17.62 16.65 226Ra→212Pb+14C 28.20 0 21.29 21.42 21.87 20.33 228Th→208Pb+20O 44.72 0 20.73 20.55 21.84 21.56 230U→208Pb+22Ne 61.39 0 19.56 20.28 20.68 20.73 231Pa→208Pb+23F 51.88 1 26.02 23.13 24.61 24.23 230Th→206Hg+24Ne 57.76 0 24.61 24.34 25.00 24.74 231Pa→207Tl+24Ne 60.41 1 22.89 20.85 22.09 22.10 232U→208Pb+24Ne 62.31 0 20.39 18.87 20.53 20.68 233U→209Pb+24Ne 60.49 2 24.84 22.34 23.52 23.27 235U→210Pb+25Ne 57.68 3 27.44 28.14 28.97 28.22 234U→206Hg+28Mg 74.11 0 25.74 24.79 25.34 25.36 235U→207Hg+28Mg 72.43 1 27.44 27.75 27.99 27.64 236Pu→208Pb+28Mg 79.67 0 21.65 18.86 20.90 21.02 238Pu→206Hg+32Si 91.19 0 25.30 24.66 25.48 25.40 242Cm→208Pb+34Si 96.54 0 23.11 20.00 22.49 22.83 Table 1. Calculations of cluster radioactivity half-lives. Experimental cluster radioactivity half-lives are taken from the latest evaluated nuclear properties table NUBASE2020 [49]. The experimental cluster radioactivity energies are taken from the latest evaluated atomic mass table AME2020 [50, 51]. The cluster radioactivity energies and half-lives are in units of 'MeV' and 's', respectively.
As shown in Table 1 , the calculations
$ T^{{\rm{cal1}}}_{1/2} $ and$ T^{{\rm{cal2}}}_{1/2} $ can effectively reproduce the description of the experimental data. Furthermore,$ T^{{\rm{cal2}}}_{1/2} $ can reproduce the experimental data better than$ T^{{\rm{cal1}}}_{1/2} $ after considering the contributions of the shell correction and pairing energies. In addition,$ T^{{\rm{cal2}}}_{1/2} $ shows a consistent result with$ T^{{\rm{UDL}}}_{1/2} $ calculated via the UDL [24], further demonstrating the reliability of the calculations.To examine the precision of the calculated cluster radioactivity half-lives, the standard deviation σ, an indicator of agreement between the calculations and the experimental data, is determined using
$ \sigma=\sqrt{\frac{1}{n}\sum ({\log_{10}T_{1/2}^{{\rm{cal}}}-\log_{10}T_{1/2}^{{\rm{exp}}}})^2} . $

(31) The σ results are listed in Table 2. This table shows that when the contributions of the shell correction and pairing energies are considered in the GLDM, the σ values are reduced from 1.661 to 0.905, an improvement of
$({1.661-0.905})/{1.661}$ =45.5%. In addition, the σ caused by using the total GLDM interaction energy$ E=E_{{\rm{mac}}}+E_{{\rm{mic}}} $ while considering the cluster preformation factors also has a smaller value than the σ obtained when using the UDL. This demonstrates that the calculations of this study can effectively reproduce the experimental data.model $ E=E_{{\rm{mac}}} $ (

$ T^{{\rm{cal1}}}_{1/2} $ )

$ E=E_{{\rm{mac}}}+E_{{\rm{mic}}} $ (

$ T^{{\rm{cal2}}}_{1/2} $ )

UDL( $ T^{{\rm{UDL}}}_{1/2} $ )

σ 1.661 0.905 0.923 Table 2. Standard deviation σ between calculated cluster radioactivity half-lives and experimental data.
Comparisons of the logarithmic differences between the two types of calculated cluster radioactivity half-lives,
$ T^{{\rm{cal1}}}_{1/2} $ and$ T^{{\rm{cal2}}}_{1/2} $ , and the experimental data$ T^{{\rm{exp}}}_{1/2} $ are plotted in Fig. 1 (a). Fig. 1 (b) shows the logarithmic differences between the two types of calculations,$ T^{{\rm{cal2}}}_{1/2} $ and$ T^{{\rm{UDL}}}_{1/2} $ , and the experimental data$ T^{{\rm{exp}}}_{1/2} $ . In this figure, the red pentagons, blue circles, and orange stars denote the discrepancies caused by$ T^{{\rm{cal1}}}_{1/2} $ ,$ T^{{\rm{cal2}}}_{1/2} $ , and$ T^{{\rm{UDL}}}_{1/2} $ , respectively. As shown in Fig. 1 (a),$ T^{{\rm{cal1}}}_{1/2} $ deviates from the experimental data by$ 1\sim3 $ orders of magnitude. When the shell correction and pairing energies are included in the GLDM, the deviation caused by$ T^{{\rm{cal2}}}_{1/2} $ is smaller, around 1 order of magnitude, showing that the calculations$ T^{{\rm{cal2}}}_{1/2} $ offer good agreement with the experimental data. Fig. 1 (b) reveals that both$ T^{{\rm{cal2}}}_{1/2} $ and$ T^{{\rm{UDL}}}_{1/2} $ exhibit a consistent trend of change, and$ T^{{\rm{cal2}}}_{1/2} $ can reproduce the experimental data better than$ T^{{\rm{UDL}}}_{1/2} $ .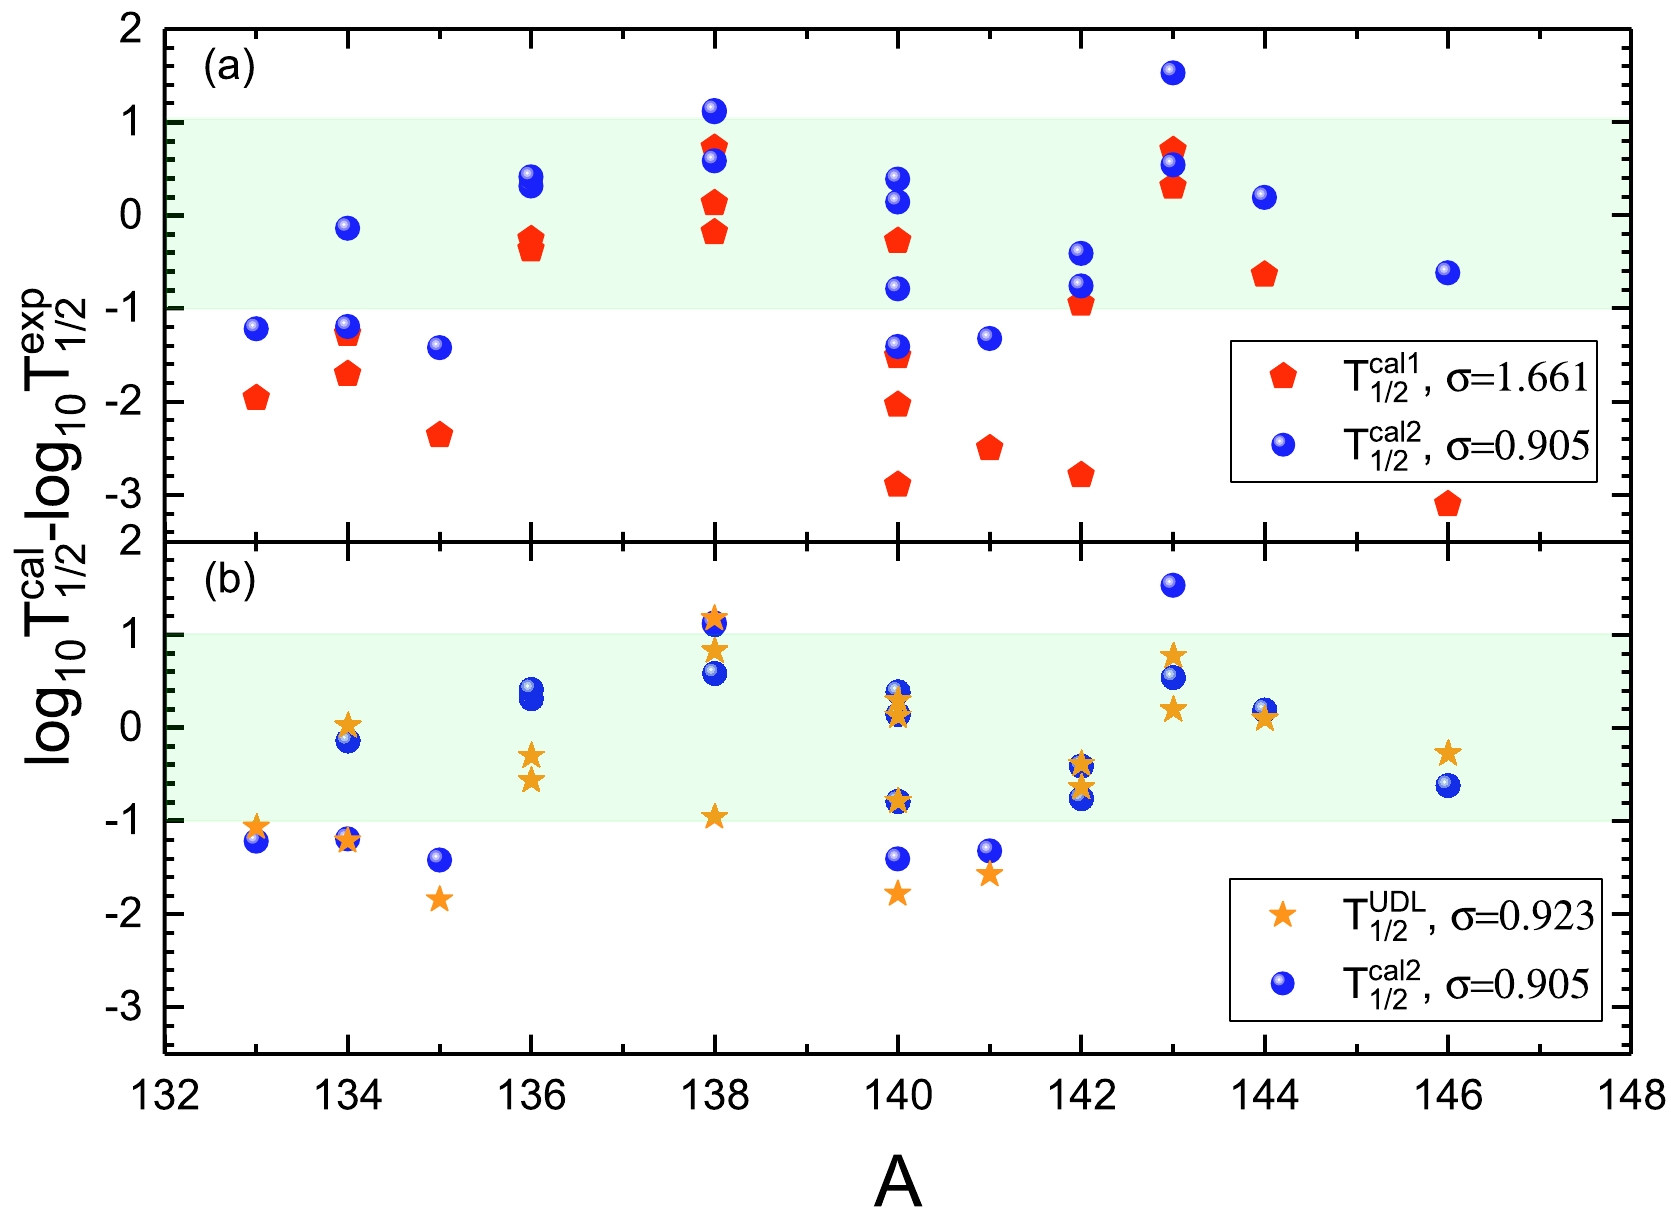
Figure 1. (color online) Logarithmic differences between three types of calculated cluster radioactivity half-lives and experimental data. The red pentagons, blue circles, and orange stars denote the differences caused by
$\log_{10}T^{{\rm{cal1}}}_{1/2}$ ,$\log_{10}T^{{\rm{cal2}}}_{1/2}$ , and$\log_{10}T^{{\rm{UDL}}}_{1/2}$ , respectively.The calculated cluster preformation factors
$ P_{c}^{{\rm{cal}}} $ using Eq. (30) and the extracted values$ P_{c}^{{\rm{ext}}} $ using Eq. (32) are listed in Table 3, where two types of cluster preformation factors are obtained by adopting the total GLDM interaction energy$ E=E_{{\rm{mac}}}+E_{{\rm{mic}}} $ .cluster radioactivity $ {\log_{10}P_{c}^{{\rm{cal}}}} $ 

$ {\log_{10}P_{c}^{{\rm{ext}}}} $ 

221Fr→207Tl+14C $ -5.47 $ 

$ -6.67 $ 

221Ra→207Pb+14C $ -5.39 $ 

$ -6.61 $ 

222Ra→208Pb+14C $ -5.49 $ 

$ -5.63 $ 

223Ra→209Pb+14C $ -5.81 $ 

$ -7.23 $ 

224Ra→210Pb+14C $ -6.11 $ 

$ -5.80 $ 

225Ac→211Bi+14C $ -6.57 $ 

$ -6.15 $ 

226Ra→212Pb+14C $ -7.10 $ 

$ -6.51 $ 

228Th→208Pb+20O $ -9.83 $ 

$ -8.71 $ 

230U→208Pb+22Ne $ -11.47 $ 

$ -10.35 $ 

231Pa→208Pb+23F $ -11.48 $ 

$ -12.89 $ 

230Th→206Hg+24Ne $ -12.53 $ 

$ -12.15 $ 

231Pa→207Tl+24Ne $ -12.20 $ 

$ -12.99 $ 

232U→208Pb+24Ne $ -12.05 $ 

$ -11.90 $ 

233U→209Pb+24Ne $ -12.48 $ 

$ -13.81 $ 

235U→210Pb+25Ne $ -13.63 $ 

$ -12.11 $ 

234U→206Hg+28Mg $ -14.81 $ 

$ -15.21 $ 

235U→207Hg+28Mg $ -15.26 $ 

$ -14.72 $ 

236Pu→208Pb+28Mg $ -14.47 $ 

$ -15.22 $ 

238Pu→206Hg+32Si $ -16.73 $ 

$ -16.54 $ 

242Cm→208Pb+34Si $ -16.74 $ 

$ -17.36 $ 

Table 3. Calculations of the cluster preformation factors of known nuclei.
$ P_{c}^{{\rm{ext}}}=\frac{T_{1/2}^{\rm{cal*}}}{T_{1/2}^{\rm{exp}}} . $

(32) where
$ T_{1/2}^{\rm{cal*}} $ denotes the calculated cluster radioactivity half-lives without considering the cluster preformation factor. As shown in Table 3 , the cluster preformation factors extracted using Eq. (32) are consistent with those calculated using Eq. (30). Both types of cluster preformation factors decrease as the mass number of the emitted clusters increases, indicating that the larger the emitted cluster, the less likely it is to form.The proton-neutron (
$ p-n $ ) interaction and shell effect, which govern the existence of nuclear systems, play a fundamental role in understanding the properties of cluster radioactivity. The$ N_p N_n $ scheme allows a unified description of structure evolution for a variety of observables and highlights the importance of the valence$ p-n $ interaction [42]. Here,$ N_p $ and$ N_n $ denote the numbers of valence protons and valence neutrons relative to the nearest shell closures:$ Z=82 $ for the proton and$ N=126 $ for the neutron. Therefore, the value of$ N_p N_n $ also represents the shell effect and the degree to which the nucleon number of the parent nucleus deviates from the magic number. In previous studies by co-author Deng et al. [36, 52, 53], it was found that the α preformation factor is linearly dependent on$ N_p N_n $ for nuclei around the$ Z=82 $ and$ N=126 $ closed-shells, indicating that the valence$ p-n $ interaction and shell effect play key roles in α particle preformation for nuclei around the$ Z=82 $ and$ N=126 $ shell closures. Cluster radioactivity has a similar theory of barrier penetration to α decay. It is interesting to study the cluster preformation factor in terms of the$ N_p N_n $ scheme to explore the shell effect and valence$ p-n $ interaction on cluster radioactivity.The calculated and extracted cluster preformation factors are plotted against
$ N_p N_n $ in Figs. 2 and 3, respectively. As shown in Figs. 2 and 3, both the calculated and extracted cluster preformation factors decrease with increasing$ N_p N_n $ . It is demonstrated that the larger the emitted cluster, the more difficult it is to preform because the parent nucleus is further away from the doubly magic nuclei 208Pb. In addition, it can be seen that the both two types of the logarithmic cluster preformation factors are linearly dependent on$ N_p N_n $ . It suggests that the valence proton-neutron interaction and the shell effect play key roles in the cluster preformation. Furthermore, the red dashed lines represent the fittings of the cluster preformation factors by the analytical formula proposed in this work, which is expressed as
Figure 2. (color online) Linear relationship between
$\log_{10}P_{c}^{{\rm{cal}}}$ (denoted as blue open squares) calculated using Eq. (30) and$N_p N_n$ .$N_p$ and$N_n$ denote the numbers of valence protons and neutrons relative to the nearest shell closures:$Z=82$ for the proton and$N=126$ for the neutron. The red dash line denotes the fitted cluster preformation factor using Eq. (33).
Figure 3. (color online) Same as Fig. 2, but it depicts the linear relationship between
$\log_{10}P_{c}^{{\rm{ext}}}$ (denoted as blue open squares) extracted using Eq. (32) and$N_p N_n$ .$ \log_{10}P_c^{{\rm{fit-cal, fit-ext}}}=aN_p N_n+b , $

(33) a and b are adjustable parameters extracted from the fittings of Figs. 2 and 3. For Fig. 2,
$ a=-0.059 $ and$ b= -3.603 $ . For Fig. 3,$ a=-0.057 $ and$b= -3.913$ . Eq. (33) can effectively describe the calculated and extracted cluster preformation factors. The corresponding standard deviations$ \sigma_{P_c^{{\rm{fit-cal, fit-ext}}}} $ are calculated with the following equation:$ \sigma_{P_c^{{\rm{fit-cal, fit-ext}}}}=\sqrt{\frac{1}{n}\sum ({\log_{10}P_{c}^{{\rm{cal, ext}}}-\log_{10}P_{c}^{{\rm{fit-cal, fit-ext}}}})^2} , $

(34) where
$ \sigma_{P_c^{{\rm{fit-cal}}}}=1.245 $ and$ \sigma_{P_c^{{\rm{fit-ext}}}}=1.351 $ show that the fitting cluster preformation factors from Eq. (33) can effectively reproduce the calculated and extracted values. The small standard deviations$ \sigma_{P_c^{{\rm{fit-cal}}}} $ and$ \sigma_{P_c^{{\rm{fit-ext}}}} $ also reveal that$ \log_{10}P_c $ has a good linear relationship with$ N_p N_n $ . Recently, Qi et al. calculated the cluster preformation factors using two different theoretical models and found that both types of$ \log_{10}P_c $ were linearly related to$ N_p N_n $ [30]. Combined with the work of Qi et al. [30], we confirm that the$ \log_{10}P_c $ of nuclei around the$ Z=82 $ and$ N=126 $ closed shells is linearly dependent on$ N_p N_n $ , and this linear relationship is model-independent. This also shows that the valence proton-neutron interaction and shell effect play key roles in cluster radioactivity.In 1988, Blendowske and Walliser proposed the preformation law of cluster radioactivity
$ P_c(A_c)= P_{\alpha}^{(A_c-1)/3} $ [27]. It was suggested that$ \log_{10}P_{c} $ is linearly dependent on the mass numbers of the emitted clusters,$ A_c $ . We must examine the results of cluster preformation factors via the preformation law of cluster radioactivity. The four types of cluster preformation factors, i.e.,$ \log_{10}P_{c}^{{\rm{cal}}} $ ,$ \log_{10}P_{c}^{{\rm{ext}}} $ ,$ \log_{10}P_{c}^{{\rm{fit-cal}}} $ , and$ \log_{10}P_{c}^{{\rm{fit-ext}}} $ , are plotted against$ A_c $ in Fig. 4 (a), (b), (c), and (d), respectively. As shown in Fig. 4, all four types of calculated cluster preformation factors are proportional to$ A_c $ , indicating that our four calculated types of cluster preformation factors satisfy the preformation law of cluster radioactivity.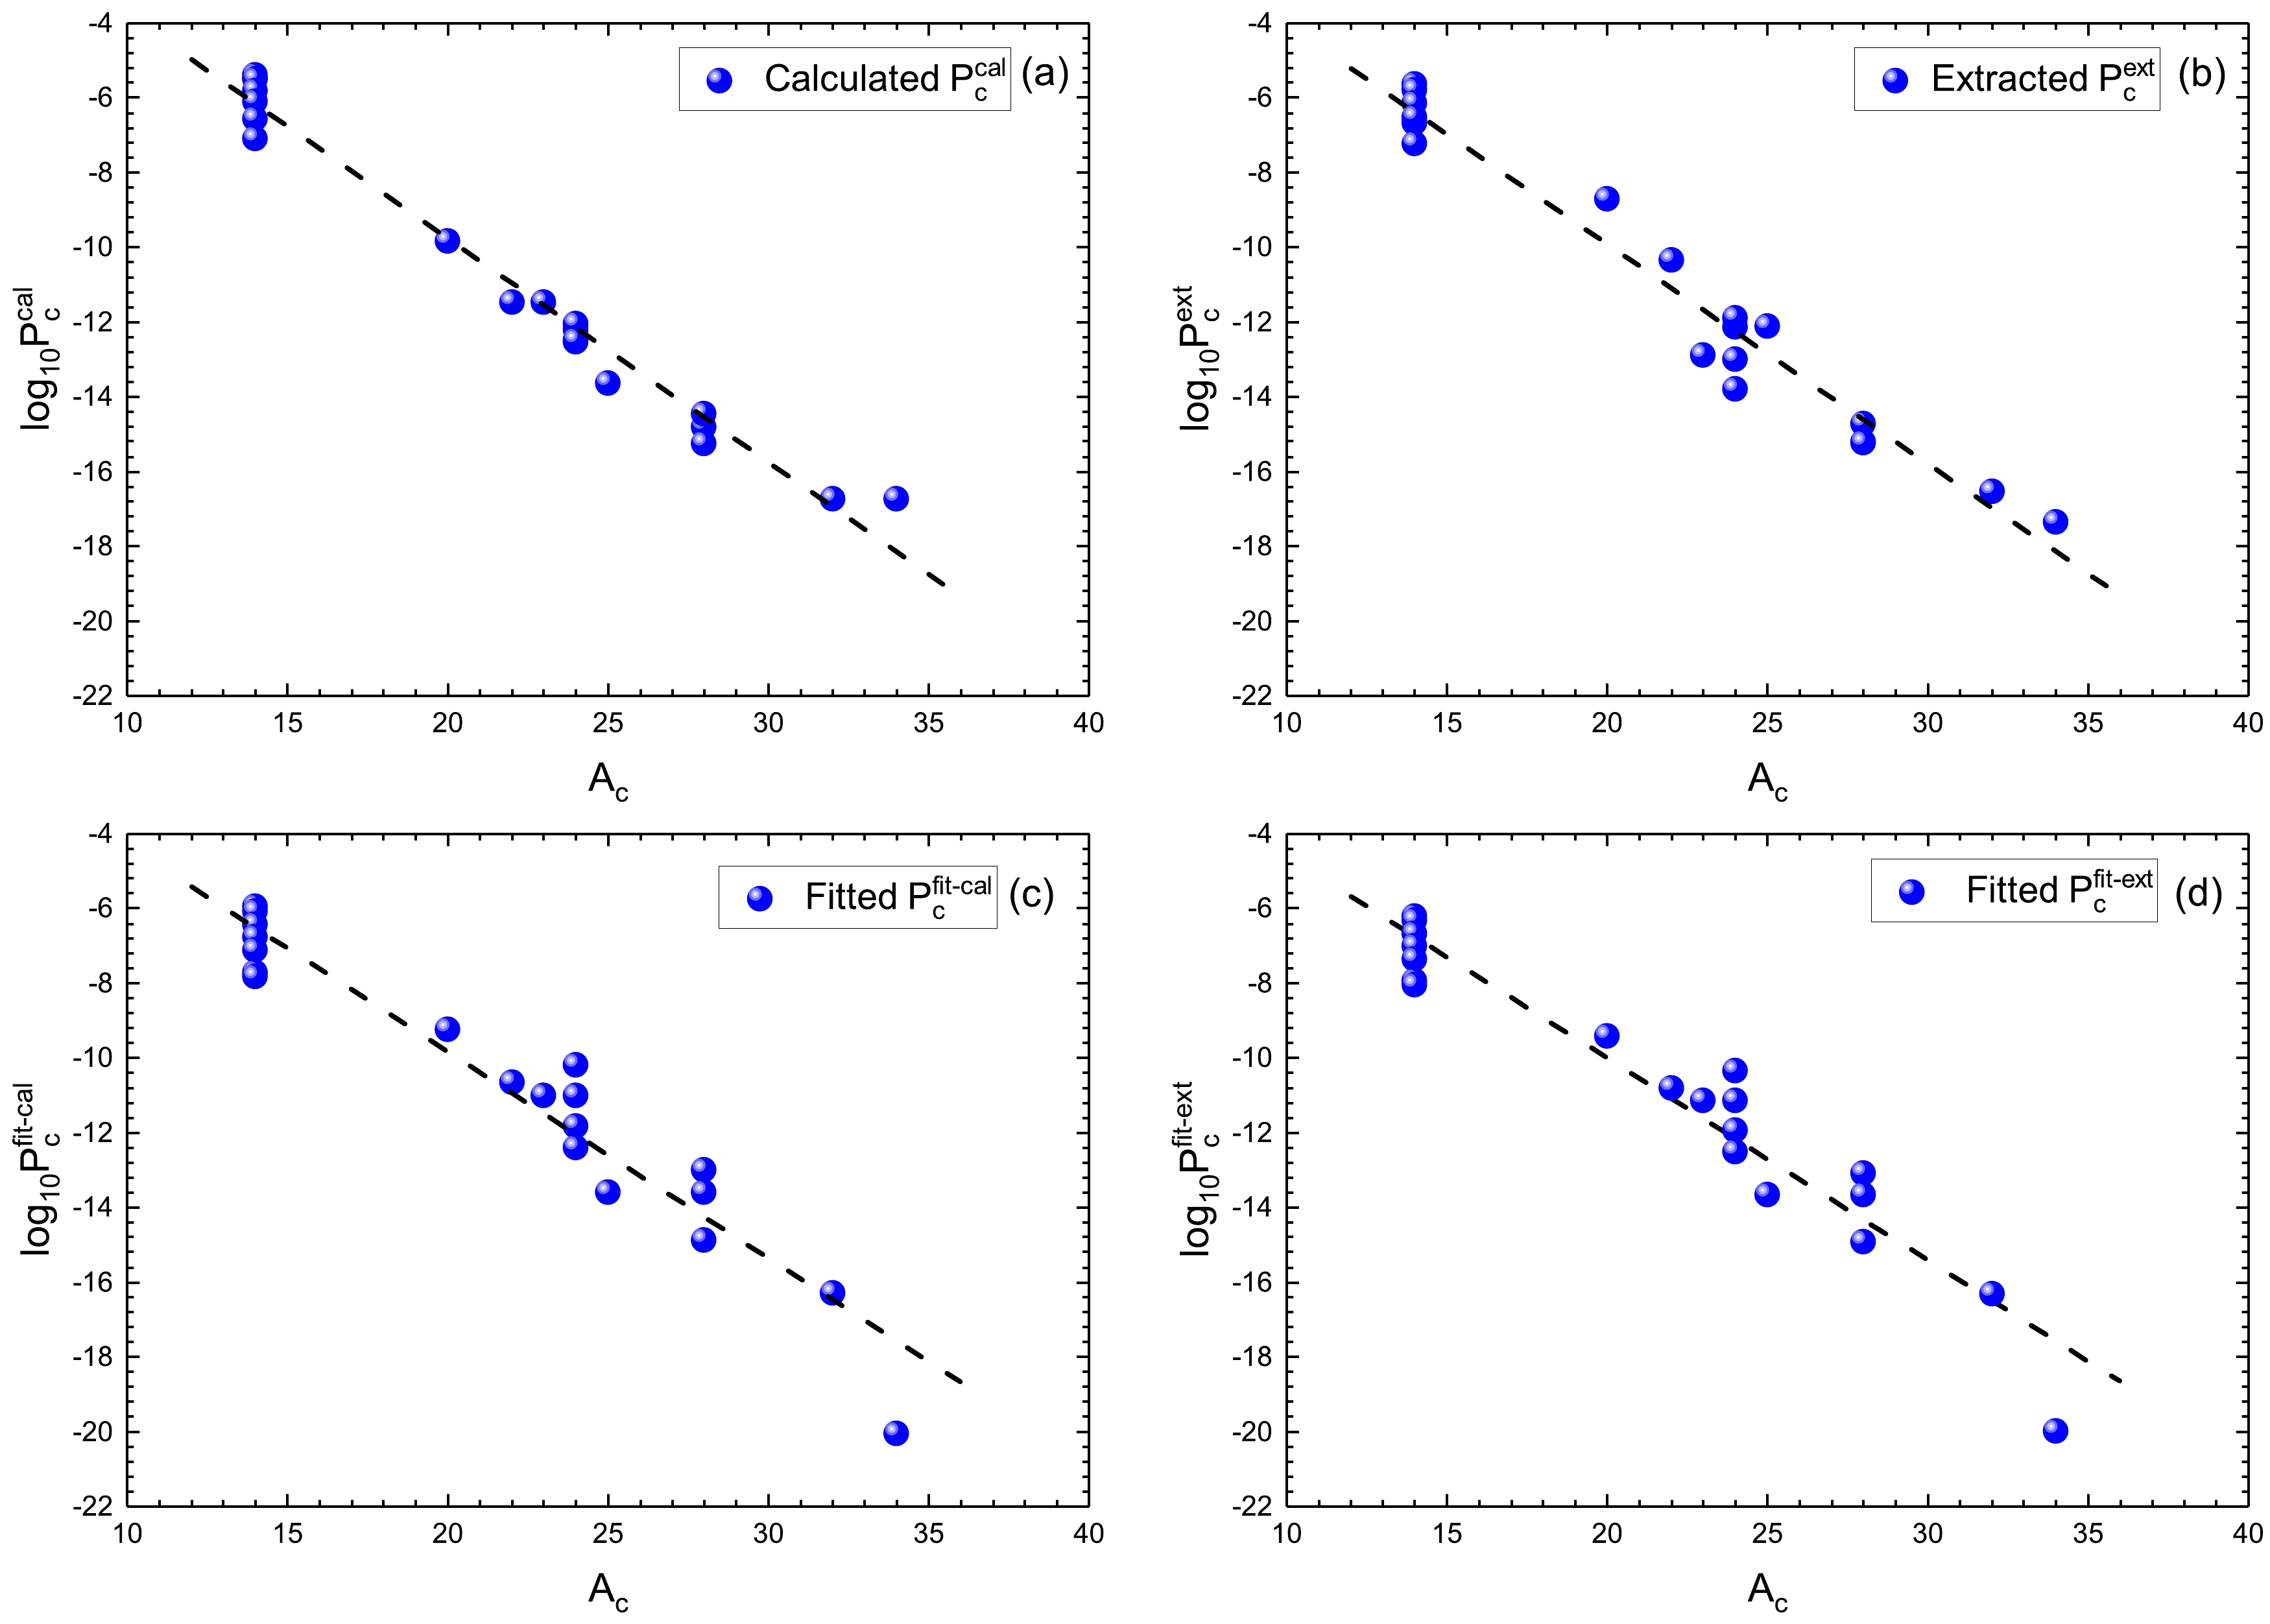
Figure 4. (color online) (a)
$ \log_{10}P_{c}^{{\rm{cal}}} $ calculated using Eq. (30) as a function of the cluster mass number$ A_c $ . The black dashed line denotes the fitting of the preformation law of cluster radioactivity$ P_c(A_c)= P_{\alpha}^{(A_c-1)/3} $ [27]. (b) Same as (a), but it depicts$ \log_{10}P_{c}^{{\rm{ext}}} $ extracted using Eq. (32) as a function of$ A_c $ . (c) Same as (a), but it depicts$ \log_{10}P_{c}^{{\rm{fit-cal}}} $ calculated using Eq. (33) as a function of$ A_c $ . (d) Same as (a), but it depicts$ \log_{10}P_{c}^{{\rm{fit-ext}}} $ calculated using Eq. (33) as a function of$ A_c $ .Encouraged by the high accuracy of the calculated cluster radioactivity half-lives for known nuclei, cluster radioactivity half-lives and cluster preformation factors are predicted for 24 heavy nuclei whose cluster radioactivity is energetically allowed or observed but not yet quantified in NUBASE2020 [49]. The predictions are listed in Table 4. In Table 4, the first column shows the cluster radioactivity including the parent nucleus, daughter nucleus, and emitted cluster. The second column represents the cluster radioactivity energy calculated using the atomic masses taken from AME2020 [50, 51]. The third column contains the minimum angular momentum taken away by the emitted cluster, adopting the spin and parity values taken from NUBASE2020 [49]. The fourth column gives the cluster preformation factors
$ \log_{10}P_{c}^{{\rm{cal}}} $ predicted using Eq. (30) within the total GLDM interaction energy$ E=E_{{\rm{mac}}}+E_{{\rm{mic}}} $ . The fifth column is the cluster preformation factors$ \log_{10}P_{c}^{{\rm{fit-ext}}} $ predicted using Eq. (33). The sixth and seventh columns contain the predicted cluster radioactivity half-lives by adopting the total GLDM interaction energy$ E=E_{{\rm{mac}}}+E_{{\rm{mic}}} $ with the cluster preformation factors$ \log_{10}P_{c}^{{\rm{cal}}} $ predicted using Eq. (30) and$ \log_{10}P_{c}^{{\rm{fit-ext}}} $ predicted using Eq. (33), respectively. The last column lists the predicted cluster radioactivity half-lives using the UDL for comparison [24]. As shown in Table 4, the predicted cluster formation factors$ \log_{10}P_{c}^{{\rm{cal}}} $ are consistent with$ \log_{10}P_{c}^{{\rm{fit-ext}}} $ both numerically and in trend. In addition, three types of predicted cluster radioactivity half-lives can be consistent with each other.cluster radioactivity $ Q_{c} $ 

$ l_{{\rm{min}}} $ 

$ {\log_{10}P_{c}^{{\rm{cal}}}} $ 

$ {\log_{10}P_{c}^{{\rm{fit-ext}}}} $ 

$ \log_{10}T^{{\rm{predict1}}}_{1/2} $ 

$ \log_{10}T^{{\rm{predict2}}}_{1/2} $ 

$ \log_{10}T^{{\rm{UDL}}}_{1/2} $ 

219Rn→205Hg+14C 28.10 3 $ -5.99 $ 

$ -5.51 $ 

19.47 18.99 18.73 220Rn→206Hg+14C 28.54 0 $ -5.94 $ 

$ -5.74 $ 

18.31 18.11 17.76 223Ac→208Pb+15N 39.47 3 $ -6.83 $ 

$ -7.11 $ 

13.71 13.98 13.62 226Th→208Pb+18O 45.73 0 $ -8.74 $ 

$ -8.47 $ 

18.15 17.88 18.23 227Th→209Pb+18O 44.20 4 $ -9.24 $ 

$ -8.93 $ 

21.27 20.95 20.67 227Pa→209Bi+18O 45.87 2 $ -8.90 $ 

$ -9.04 $ 

19.20 19.34 19.11 227Ac→207Tl+20O 43.09 1 $ -9.91 $ 

$ -8.70 $ 

23.66 22.44 23.24 229Th→209Pb+20O 43.40 2 $ -10.23 $ 

$ -9.84 $ 

24.59 24.20 23.83 230U→208Pb+22Ne 61.39 0 $ -11.47 $ 

$ -10.75 $ 

20.68 19.96 20.73 231Np→209Bi+22Ne 61.90 3 $ -11.69 $ 

$ -11.44 $ 

21.47 21.22 21.29 235U→211Pb+24Ne 57.36 1 $ -13.15 $ 

$ -13.60 $ 

28.81 29.27 27.98 233Np→209Bi+24Ne 62.16 3 $ -12.43 $ 

$ -12.69 $ 

22.40 22.66 22.20 235U→210Pb+25Ne 57.68 3 $ -13.63 $ 

$ -13.60 $ 

28.97 28.94 28.22 236U→210Pb+26Ne 56.69 0 $ -13.92 $ 

$ -14.17 $ 

31.37 31.62 30.55 235Np→207Tl+28Mg 77.10 2 $ -14.54 $ 

$ -13.95 $ 

22.73 22.14 22.86 237Pu→209Pb+28Mg 77.73 1 $ -14.88 $ 

$ -15.54 $ 

23.61 24.27 23.45 237Am→209Bi+28Mg 79.85 2 $ -14.79 $ 

$ -15.77 $ 

22.33 23.32 22.24 237Pu→208Pb+29Mg 77.45 3 $ -14.97 $ 

$ -15.54 $ 

24.44 25.01 24.34 238U→208Hg+30Mg 69.46 0 $ -16.54 $ 

$ -15.31 $ 

33.81 32.58 33.10 237Np→207Tl+30Mg 74.79 2 $ -15.65 $ 

$ -15.20 $ 

27.00 26.54 26.94 239Pu→209Pb+30Mg 75.08 4 $ -16.00 $ 

$ -16.91 $ 

28.41 29.32 28.02 237Pu→205Hg+32Si 91.46 4 $ -16.66 $ 

$ -15.54 $ 

25.22 24.10 25.13 239Am→207Tl+32Si 94.50 3 $ -16.82 $ 

$ -17.25 $ 

22.91 23.34 23.00 239Pu→205Hg+34Si 90.87 1 $ -17.31 $ 

$ -16.91 $ 

26.49 26.09 26.61 Table 4. Predictions of the cluster radioactivity half-lives of heavy nuclei whose cluster radioactivity is energetically allowed or observed but not yet quantified in NUBASE2020 [49]. The cluster radioactivity energies are calculated using the atomic masses taken from AME2020 [50, 51]. The cluster radioactivity energies and half-lives are in units of 'MeV' and 's', respectively.
To examine the reliability of the two predicted types of cluster preformation factors from the perspective of
$ N_p N_n $ ,$ \log_{10}P_{c}^{{\rm{cal}}} $ (denoted as blue squares) and$ \log_{10}P_{c}^{{\rm{fit-ext}}} $ (denoted as blue circles) are plotted against$ N_p N_n $ in Fig. 5 (a) and (b), respectively. Moreover, to test the credibility of the two predicted types of cluster preformation factors from the perspective of the cluster preformation law [27],$ \log_{10}P_{c}^{{\rm{cal}}} $ and$ \log_{10}P_{c}^{{\rm{fit-ext}}} $ are plotted against the mass numbers of the emitted clusters,$ A_c $ , in Fig. 5 (c) and (d), respectively. As shown in Fig. 5 (a) and (b), both$ \log_{10}P_{c}^{{\rm{cal}}} $ and$ \log_{10}P_{c}^{{\rm{fit-ext}}} $ decrease as$ N_p N_n $ increases, and both$ \log_{10}P_{c}^{{\rm{cal}}} $ and$ \log_{10}P_{c}^{{\rm{fit-ext}}} $ are linearly dependent on$ N_p N_n $ , demonstrating that the shell effect plays a key role in cluster preformation factors. In Fig. 5 (c) and (d), we find that both$ \log_{10}P_{c}^{{\rm{cal}}} $ and$ \log_{10}P_{c}^{{\rm{fit-ext}}} $ decrease as$ A_c $ increases, and both$ \log_{10}P_{c}^{{\rm{cal}}} $ and$ \log_{10}P_{c}^{{\rm{fit-ext}}} $ are linearly dependent on$ A_c $ , showing that the heavier the cluster, the more difficult it is to form. The good linear relationships shown in Fig. 5 also indicate that the predicted cluster preformation factors$ \log_{10}P_{c}^{{\rm{cal}}} $ and$ \log_{10}P_{c}^{{\rm{fit-ext}}} $ are credible.
Figure 5. (color online) (a)
$ \log_{10}P_{c}^{{\rm{cal}}} $ predicted using Eq. (30) as a function of$ N_p N_n $ . The red dash line denotes the fitting of Eq. (33). (b) Same as (a), but it depicts$ \log_{10}P_{c}^{{\rm{fit-ext}}} $ predicted using Eq. (33) as a function of$ N_p N_n $ . (c)$ \log_{10}P_{c}^{{\rm{cal}}} $ predicted using Eq. (30) as a function of$ A_c $ . The black dash line denotes the fitting of the preformation law of cluster radioactivity$ P_c(A_c)= P_{\alpha}^{(A_c-1)/3} $ [27]. (d) Same as (c), but it depicts$ \log_{10}P_{c}^{{\rm{fit-ext}}} $ predicted using Eq. (33) as a function of$ A_c $ . The blue squares and circles denote$ \log_{10}P_{c}^{{\rm{cal}}} $ and$ \log_{10}P_{c}^{{\rm{fit-ext}}} $ , respectively.Intuitively, the three types of predicted cluster radioactivity half-lives are shown in Fig. 6. As shown in this figure, the two types of predictions
$ \log_{10}T^{{\rm{predict1}}}_{1/2} $ (denoted as red circles) and$ \log_{10}T^{{\rm{predict2}}}_{1/2} $ (denoted as blue pentagons) obtained using the total GLDM interaction energy$ E=E_{{\rm{mac}}}+E_{{\rm{mic}}} $ with the predicted cluster preformation factors$ \log_{10}P_{c}^{{\rm{cal}}} $ and$ \log_{10}P_{c}^{{\rm{fit-ext}}} $ are highly consistent with each other. In addition, both$ \log_{10}T^{{\rm{predict1}}}_{1/2} $ and$ \log_{10}T^{{\rm{predict2}}}_{1/2} $ are in agreement with the predictions$ \log_{10}T^{{\rm{UDL}}}_{1/2} $ (denoted as purple stars) by adopting the UDL [24]. The predictions of cluster radioactivity half-lives and cluster preformation factors in this study can provide a reference for future experiments.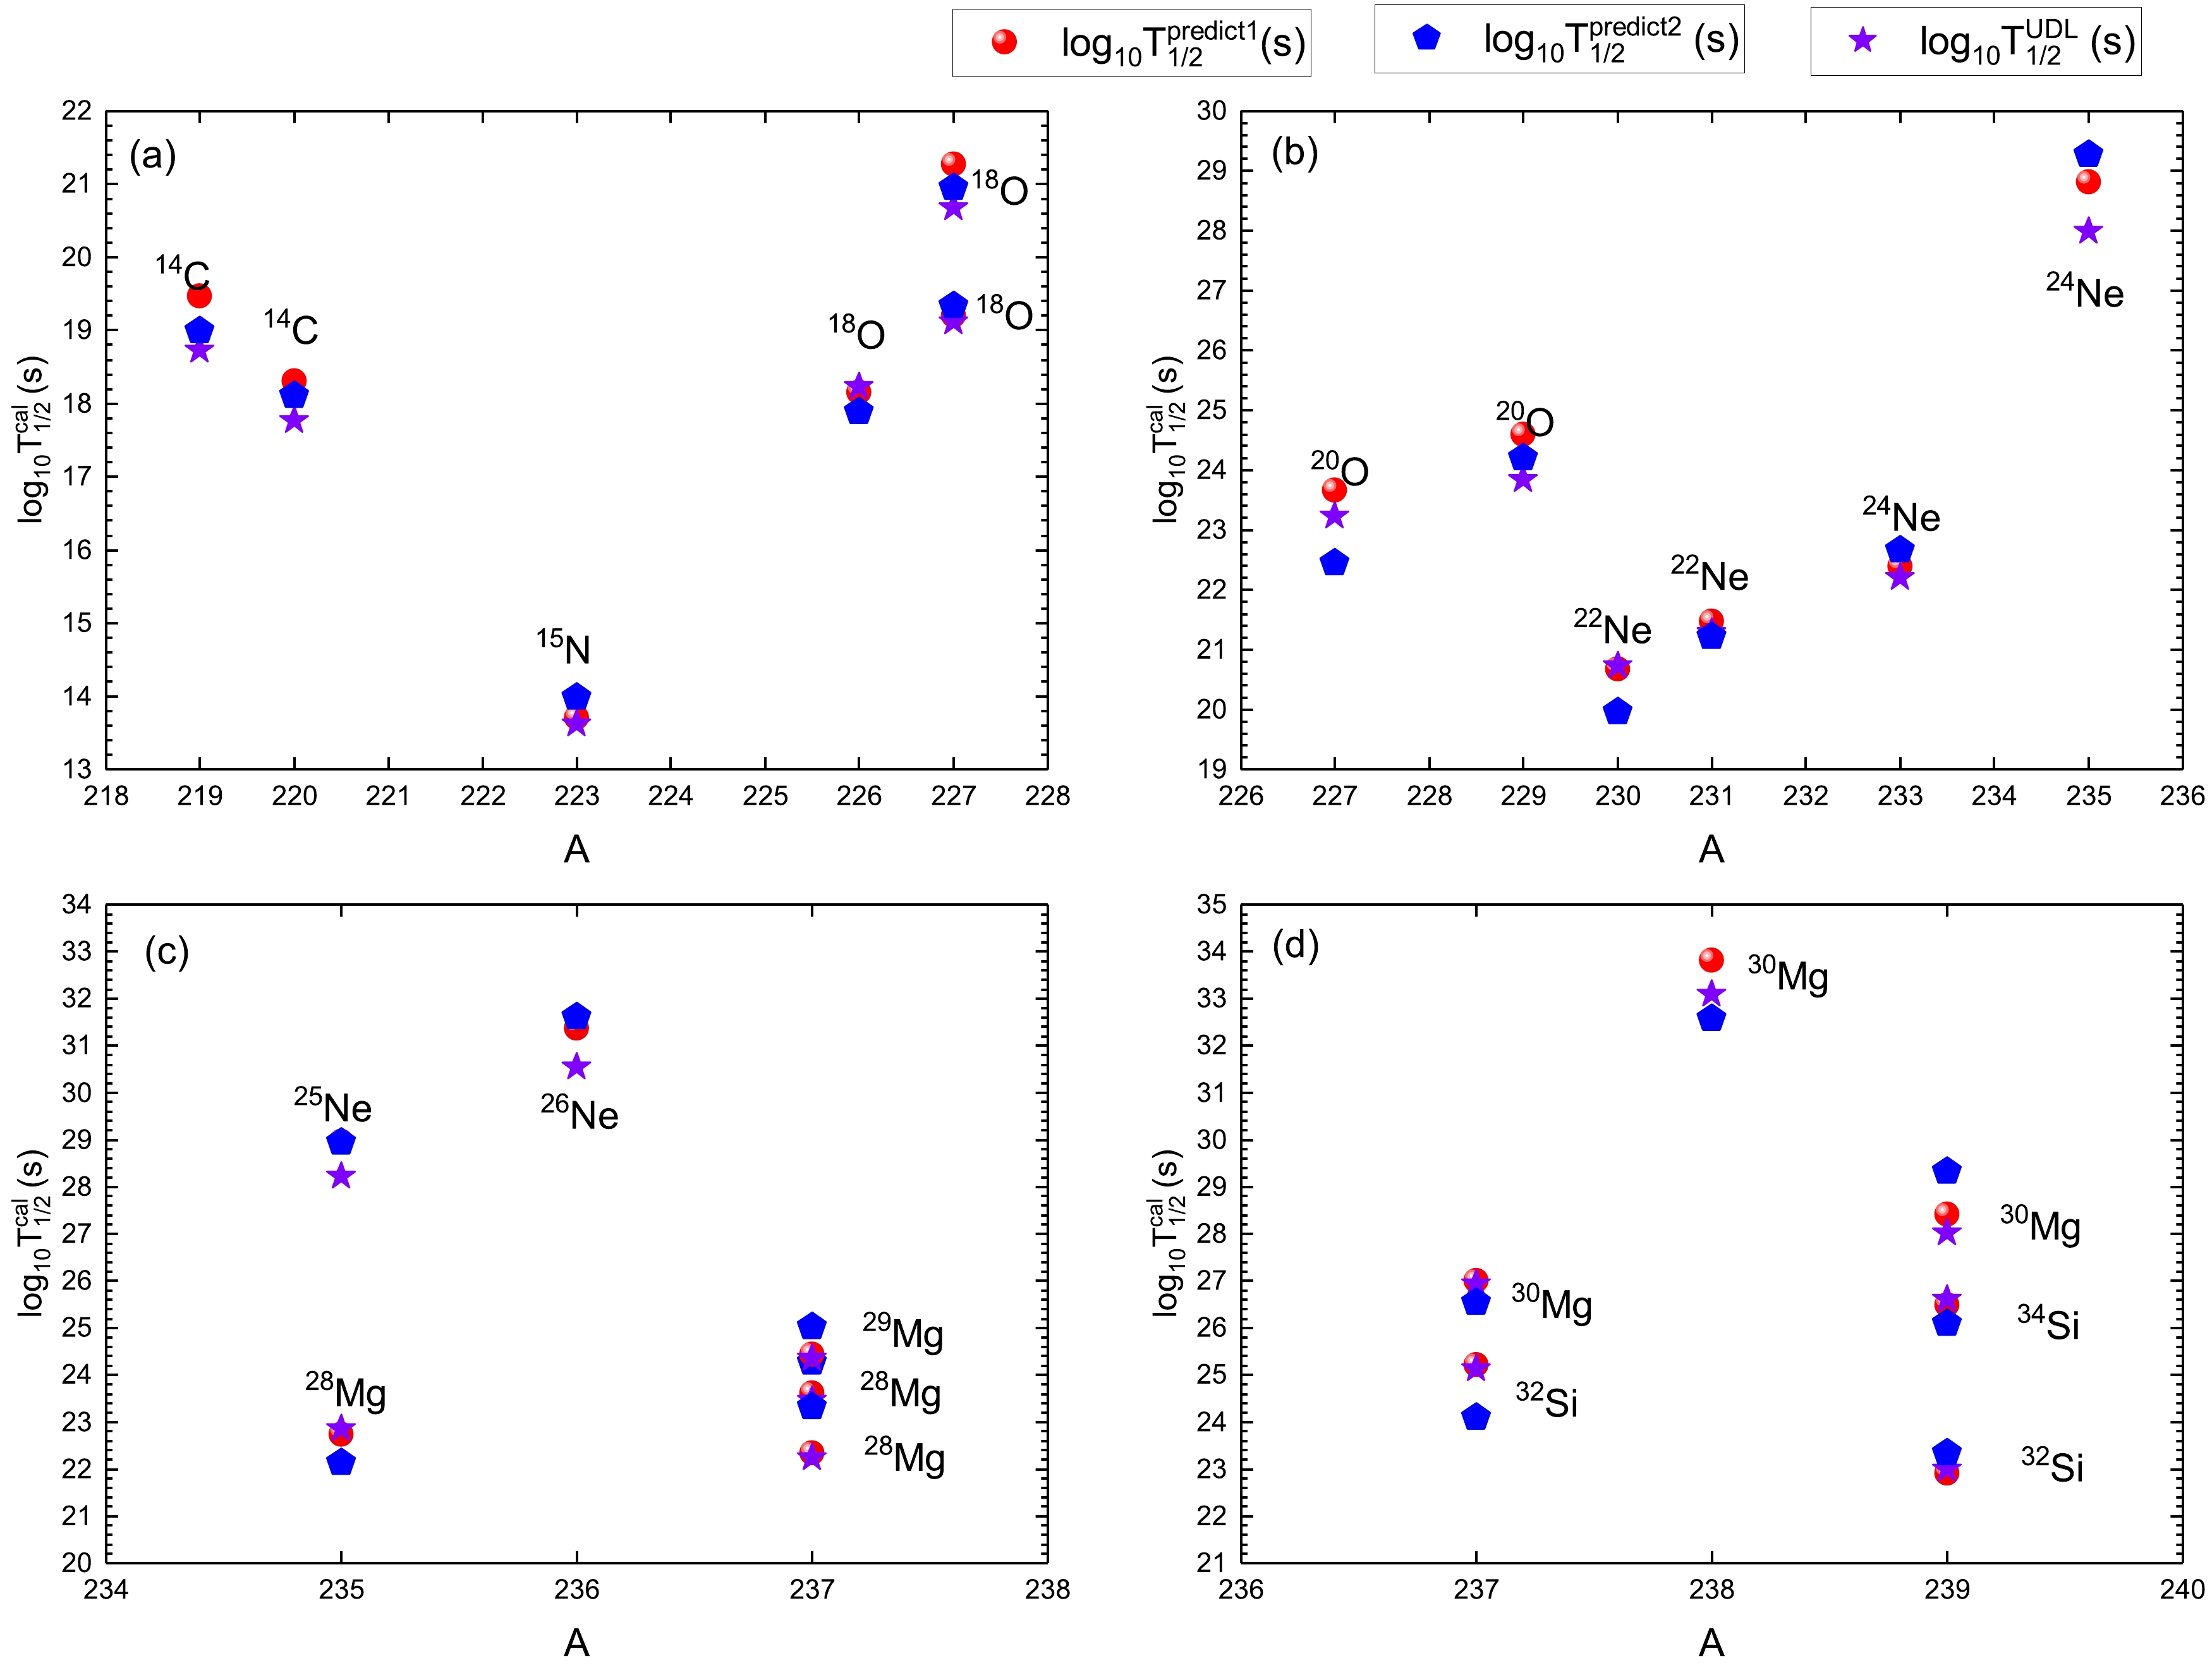
Figure 6. (color online) Logarithmic differences between three types of predicted cluster radioactivity half-lives. The red circles, blue pentagons, and purple stars denote
$ \log_{10}T^{{\rm{predict1}}}_{1/2} $ ,$ \log_{10}T^{{\rm{predict2}}}_{1/2} $ , and$ \log_{10}T^{{\rm{UDL}}}_{1/2} $ , respectively. -
In summary, we systematically study the cluster radioactivity by adopting the GLDM. The calculations of cluster radioactivity half-lives have important improvements and can effectively reproduce the experimental data after considering the shell correction energy, pairing energy, and cluster preformation factor in the theoretical model. In addition, we study the systematic trends of the cluster preformation factors
$ P_c $ in terms of the$ N_p N_n $ scheme to investigate the influence of the valence proton-neutron interaction and shell effect on cluster radioactivity. We find that$ \log_{10}{P_c} $ is linearly dependent on$ N_p N_n $ , indicating that the shell effect and valence proton-neutron interaction play essential roles in cluster radioactivity. Furthermore, we put forward an analytic formula for calculating the cluster preformation factor. The cluster preformation factors and cluster radioactivity half-lives of some heavy nuclei are predicted, which can provide a reference for future experiments. -
We thank Dr. Kang Wei for valuable discussions.
Systematic study of cluster radioactivity within the generalized liquid drop model
- Received Date: 2024-01-14
- Available Online: 2024-06-15
Abstract: Cluster radioactivity is studied within the generalized liquid drop model (GLDM), in which the shell correction energy, pairing energy, and cluster preformation factor are considered. The calculations show significant improvements and can reproduce the experimental data within a factor of 8.04 after considering these physical effects. In addition, the systematic trend of the cluster preformation factors


 DownLoad: