


 Abstract
 HTML
HTML Reference
 Related
 PDF
PDF


-
Recently, the CDF collaboration released their latest high-precision measurement of the W boson mass using 8.8 fb
$ ^{-1} $ of proton-antiproton collision data recorded at a center-of-mass energy of 1.96 TeV at the Tevatron [1]. The reported result is$ \begin{equation} M_W=80,433.5\pm6.4_{\rm stat}\pm6.9_{\rm syst}\; {\rm{MeV}}, \end{equation} $

(1) which deviates from the standard model electroweak precision fit value
$ M_W=80,357\pm6\; {\rm{MeV}} $ [2, 3]① by seven standard deviations. This new measurement has triggered a number of discussions regarding possible new physics effects (see Refs. [5–91] for examples), standard model effective theory implications [92–95], and evaluations of various theoretical uncertainties [96–100]. Direct measurements have previously been obtained at the 7 TeV LHC by the ATLAS collaboration ($ M_W=80,370\pm7_{\rm stat}\pm 18_{\rm syst} $ MeV) [101], the 13 TeV LHC by the LHCb collaboration ($ M_W=80,354\pm23_{\rm stat}\pm22_{\rm syst} $ MeV) [102], and earlier at the Tevatron [103] and LEP [104]. Although there are discussions regarding disagreements between the new CDF measurement and previous values, in this study, we focus on the impact of parton distribution functions (PDFs) on the extracted W boson mass. In the CDF, ATLAS, and LHCb measurements mentioned above, PDF uncertainties of approximately 3.9, 8, and 9 MeV were reported, respectively, which are the dominant theoretical uncertainties in all cases. Note that the three collaborations used very different inputs for the evaluation of the PDF uncertainties. For example, the quoted PDF uncertainty by the CDF is purely based on NNPDF3.1 PDFs [105], despite the impact of different PDFs having been investigated. For the ATLAS measurement, the quoted PDF uncertainty includes those estimated from CT10 PDFs [106] added in quadrature to differences observed using PDFs from several groups. In the LHCb measurement, they took the arithmetic average of the PDF uncertainties predicted by CT18 [107], NNPDF3.1 [105], and MSHT20 [108] PDFs. The LHCb also reported a spread of the central values of the extracted W boson mass from the three PDFs, which was as large as 11 MeV and was not counted in the final uncertainty.The method in which PDFs change the modeling of the kinematics of decayed leptons in W boson production can be understood as described below. The fully differential cross sections of the decayed leptons can be written as
$ \begin{aligned}[b] \; \frac{{\rm{d}}^2\sigma}{{\rm{d}} p_1{\rm{d}} p_2}=&\left[\frac{{\rm{d}}\sigma(m)}{{\rm{d}} m}\right]\left[\frac{{\rm{d}}\sigma(y)}{{\rm{d}} y}\right] \left[\frac{{\rm{d}}^2\sigma(p_T,y)}{{\rm{d}} p_T{\rm{d}} y}\left(\frac{{\rm{d}}\sigma(y)}{{\rm{d}} y}\right)^{-1}\right]\\ & \times \left[(1+\cos^2\theta) +\sum_{i=0}^7 A_i(p_T,y)P_i(\cos\theta,\phi)\right], \end{aligned} $

(2) where
$ p_{1(2)} $ is the lepton (anti-lepton) momentum; m,$ p_T $ , and y are the invariant mass, transverse momentum, and rapidity of the dilepton system, respectively; θ and ϕ are the polar angle and azimuth of$ p_1 $ in the rest frame of the dilepton system, respectively;$ A_i $ are angular coefficients; and$ P_i $ are spherical harmonics. The cross sections are factorized in this way because each component on the right-hand side of Eq. (2) is modeled or corrected separately using different MC programs during experimental analyses [101]. The impact of PDF uncertainties on each individual component can be understood. For example, the effects of PDF variations on the angular coefficients and invariant mass distribution are found to be small in W boson mass measurements. Most of the PDF uncertainties in the extracted W boson mass originate from the impact on the rapidity distribution of the W boson. PDF variations, especially those from the gluon PDF, will also affect the W boson transverse momentum distribution at large-$ p_T $ . A complication of the$ p_T $ distribution is that the CDF analysis used a data-driven method to model the measured transverse momentum distribution of the Z boson, which was then applied to the W boson to reduce theoretical uncertainties. Thus, for the component of the$ p_T $ distribution, only the theoretical uncertainties on the ratio of the$ p_T $ spectrum of the W boson and Z boson should, in principle, be included.In this study, we perform a comprehensive comparison of the kinematic distribution of decayed leptons using a variety of up-to-date PDFs, focusing on the CDF and ATLAS measurements. Previous studies have also been conducted on the PDF uncertainties in W boson mass measurements [109–113]. We reveal variations in the shape of the transverse mass distribution from different PDF groups and different generations within the same group and estimate the possible shift in the extracted W boson mass. Furthermore, using Lagrange multiplier (LM) scans, we evaluate the constraints on the prescribed distribution as imposed by different experimental data sets in the CT18 global analysis of PDFs. Other theoretical uncertainties, including factorization and renormalization scales, the strong coupling constant, and the W-boson decay width, are also examined in the CDF scenario. Note that we include the full PDF uncertainty in the modeling of the
$ p_T $ of the W boson for results calculated at next-to-leading order (NLO) in QCD, unlike the prescription used in the experimental analyses mentioned above. However, we also show results calculated at leading order (LO) for comparison, where the PDF uncertainty in the modeling of$ p_T $ is completely removed. In this study, we aim to understand the PDF uncertainties in the W boson mass measurements, especially using the most up-to-date PDFs, rather than reproducing the exact PDF dependence in actual experimental analyses.The rest of this paper is organized as follows. In Sec. II, we present the results of the kinematic distribution and extracted W boson mass. In Sec. III, we show the results of PDF sensitivities and our understanding of constraints within the CT18 analysis using the LM method. Finally, our summary and conclusions are presented in Sec. IV.
-
In this section, we show the dependence of the transverse mass distribution of charged leptons and the missing energy on PDFs and the change in the W boson mass under the setups of both the CDF and 7 TeV ATLAS measurements. Note that in both the CDF and ATLAS measurements, the PDF uncertainties are fully correlated to the results using three different kinematic variables and are almost the same. We calculate the mean value of the transverse mass to quantify the impact of different PDFs on the shape of the kinematic distribution. We further propose a simplified prescription to identify the PDF impact on the extracted W boson mass and validate it against a method with a log-likelihood
$ \chi^2 $ fit. -
The event selection criterion follows that of the CDF Run II measurement [1]
$ \begin{equation} 30<p_T^{\ell,\nu}<55\; {\rm{GeV}},\; u_T<15\; {\rm{GeV}},\; 60<M_T<100\; {\rm{GeV}}, \end{equation} $

(3) where
$ u_T=|\vec{p}_T^\ell+\vec{p}_T^\nu| $ is the transverse momentum of the W boson. The transverse mass of the W boson is defined as$ M_T=\sqrt{2(p_T^{\ell}p_T^{\nu}-\vec{p}_T^{\ell}\cdot\vec{p}_T^{\nu})} $ . The charged lepton is also required to be in the central pseudo-rapidity region$ \begin{equation} |\eta|<1. \end{equation} $

(4) The transverse mass distribution of the charged lepton and missing energy are calculated using the program MCFM-6.8 [114, 115] with the above selections at either LO or NLO in QCD and with the APPLgrid interface [116] for fast interpolations with arbitrary PDFs. We do not consider QCD resummation effects on the transverse momentum of the W boson because they should be less pronounced for the
$ M_T $ distribution and because of the constraints of repeating calculations for a large number of PDF sets with sufficient numerical accuracy. For the same reasons, we do not included next-to-next-to-leading order (NNLO) QCD corrections, which we expect will not significantly change our conclusions on PDF dependence. The factorization and renormalization scales are chosen to be the invariant mass of the charged lepton and neutrino pair,$ \mu_F=\mu_R=M_{\ell\nu} $ . We apply Gaussian smearing on the distributions from theoretical calculations, assuming a detector resolution of 7% for$ M_T $ , which is consistent with the resolution on hadronic recoils reported in the CDF paper [1]. We check that the prescribed smearing effects can effectively reproduce the shape of the experimental distribution, especially in the region close to the peak. In principle, one can apply more sophisticated detector effects with energy-dependent resolution for individual objects. We do not expect a large difference, especially because we are focusing on the mean value of the kinematic distribution, which is less affected by smearing effects.In Fig. 1, we show the predicted normalized
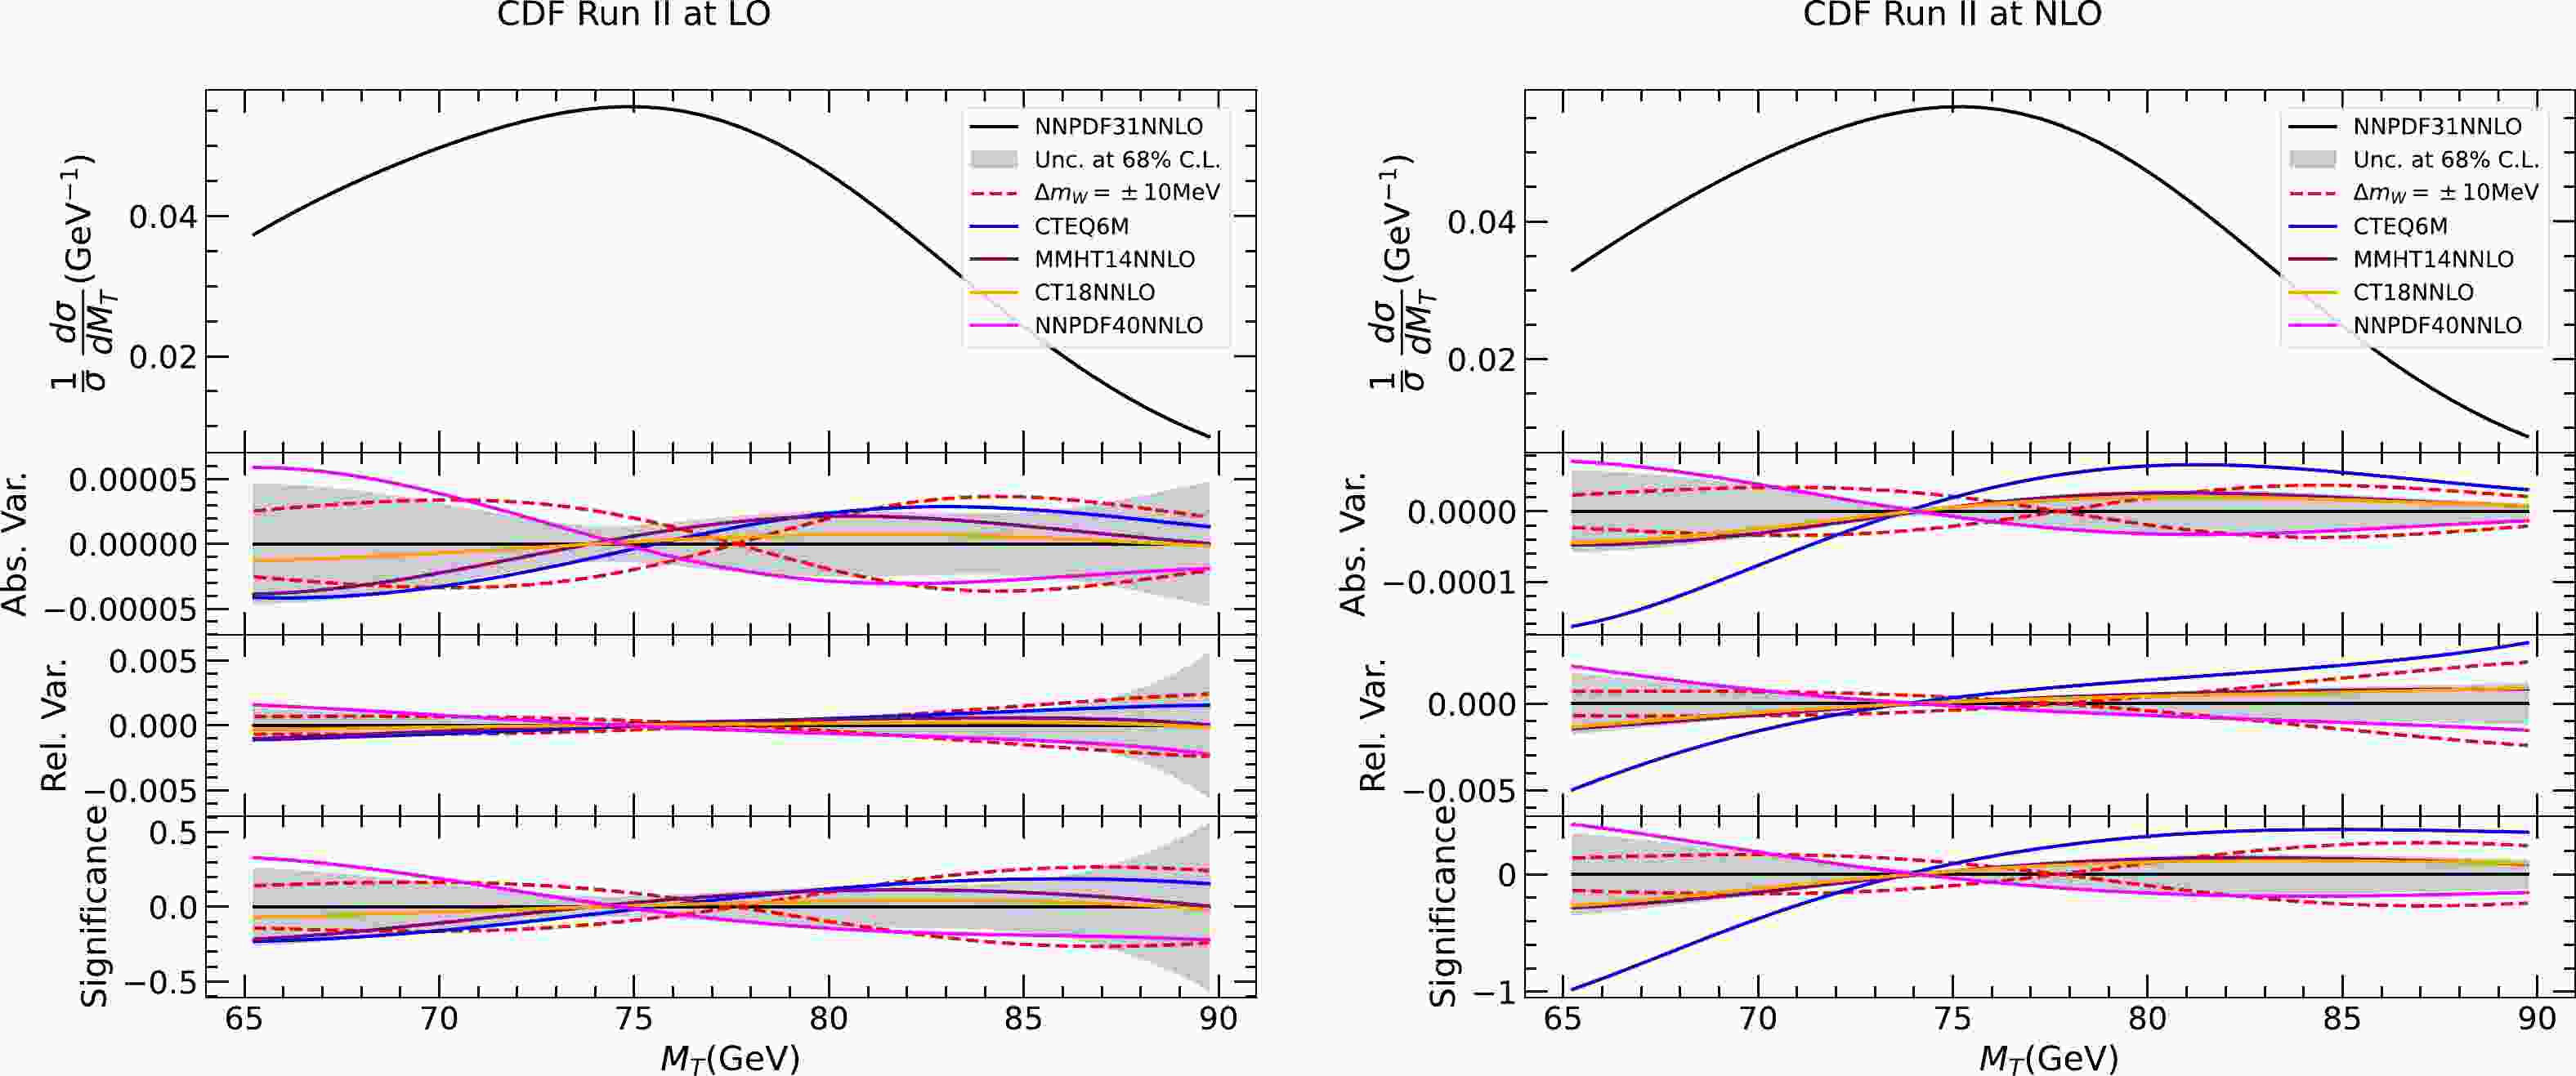
$ M_T $ distribution at LO and NLO for several choices of PDFs and different values of the W boson mass. From top to bottom, the figure shows the normalized distribution, and the absolute and relative variations compared to a common reference calculated with the central set of NNPDF3.1 NNLO PDFs [105]. The red dashed lines represent the variation due to a W boson mass change of$ \pm $ 10 MeV, and the gray band indicates the PDF uncertainties at a 68% confidence level (C.L.) for NNPDF3.1. The different PDFs under consideration include CTEQ6M [117] NLO PDFs, and CT18 [107], MMHT14 [118], and NNPDF4.0 [119] NNLO PDFs. PDF uncertainties are calculated using the respective prescription, as summarized in Ref. [120]. In the lower panel of each figure, the variations are divided by the statistical uncertainty in each bin to show the significance. We choose a bin width of 0.5 GeV and normalize the total number of events to the number of muon events in the CDF measurement for the calculation of the statistical uncertainty.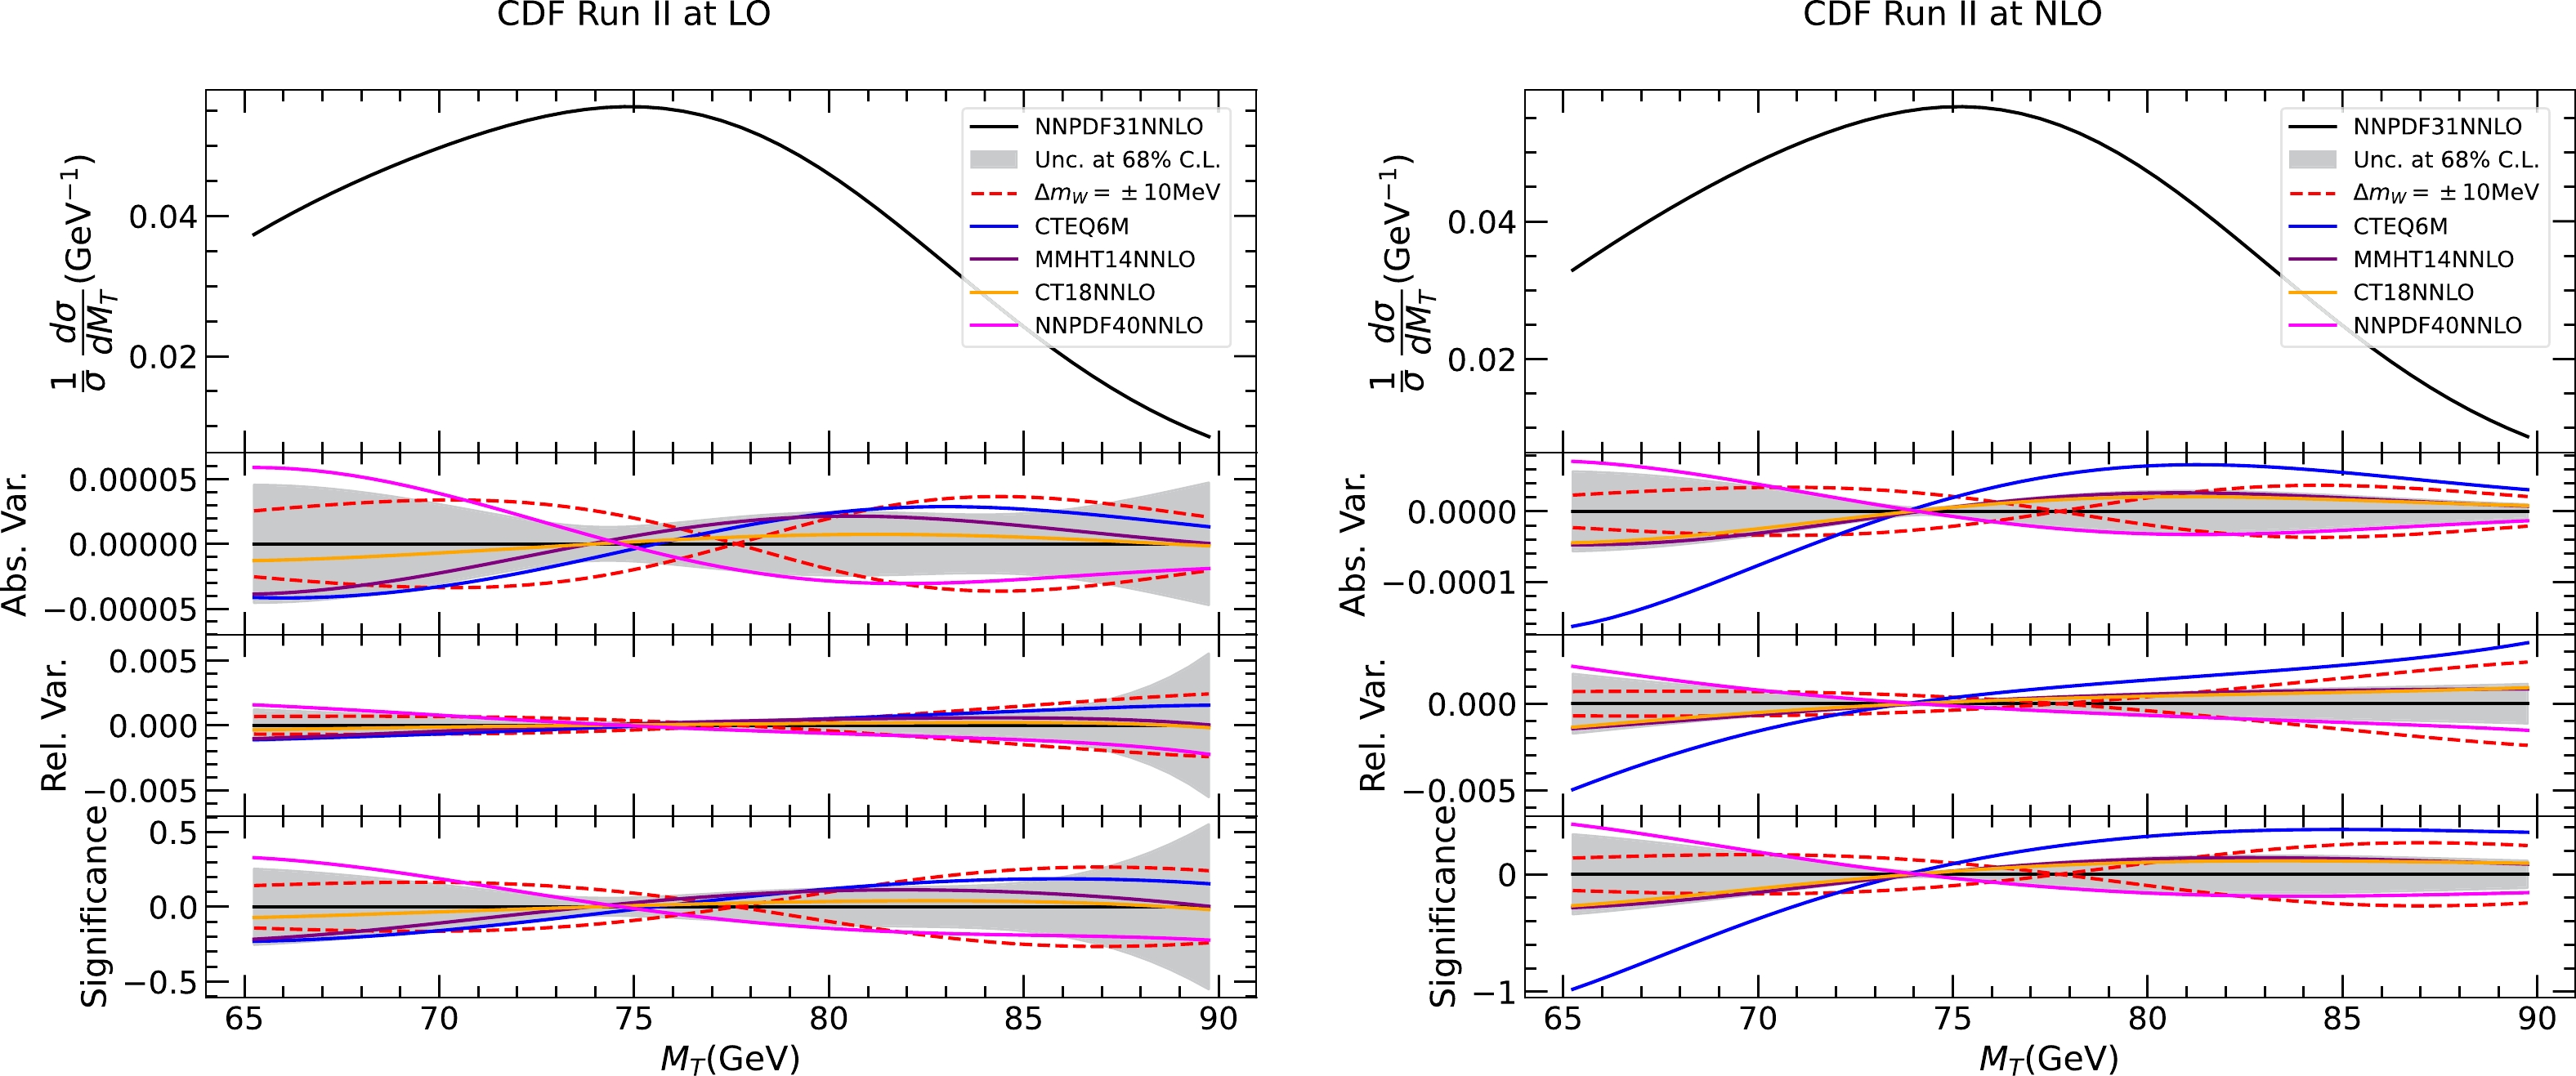
Figure 1. (color online) Transverse mass distribution of the charged lepton and missing energy in the scenario of the CDF measurement calculated at LO and NLO with various PDFs and different values of the W boson mass (increased or decreased by 10 MeV). From top to bottom are the normalized distribution, and absolute and relative changes with respect to a common reference of the prediction obtained using NNPDF3.1 NNLO PDFs and the nominal W boson mass. The lowest panel shows the changes normalized to the experimental statistical uncertainties.
Several interesting observations were made. First, we find that there can be a significant difference in the PDF dependence between LO and NLO, whereas the W boson mass dependence is significantly more stable. This may be due to the gluon contributions at NLO, which boost the W boson in the transverse direction. The gluon PDF is considerably different in CTEQ6M compared with recent NNLO PDFs, which leads to the large differences observed in the NLO plot. This can be traced back to the fact that the CTEQ6M analysis uses a zero-mass scheme for heavy-quark effects in DIS rather than variable flavor number schemes [121]. However, we stress that in the experimental analyses, because data on the Z boson
$ p_T $ spectrum are used to model the W boson$ p_T $ spectrum, only PDF uncertainties in the ratio of the W and Z boson$ p_T $ spectra should be considered for$ p_T $ modeling, unlike the rapidity distribution of the W boson. We focus on the predictions calculated at NLO unless specified. We find that the PDF uncertainty of NNPDF3.1 tends to be similar in size compared to the impact of varying$ M_W $ by 5 MeV, and CT18 and MMHT14 prefer a harder spectrum within the uncertainty of NNPDF3.1. This is in qualitative agreement with the CDF results regarding PDF uncertainty and dependence. The PDF variations of NNPDF4.0 are opposite to those of CT18 and MMHT14 and are close to the boundaries of the uncertainty of NNPDF3.1.We construct a principle variable to describe the impact of different PDFs on the shape of the
$ M_T $ distribution. This is the mean value of$ M_T $ within a select window of [70, 90] GeV, denoted as$ \langle M_T\rangle $ . A similar shape parameter proposed by Kotwal in Ref. [122] plays the same role. We choose this window in accordance with the CDF analysis because kinematic bins in this range exhibit the largest significance when varying$ M_W $ . In Fig. 2, we plot various predictions on$ \langle M_T\rangle $ at NLO and LO, including PDF uncertainties at a 68% C.L., by normalizing to a common reference of the central prediction of NNPDF3.1. Here, we further include the CT10 [106], CT14 [123], CT18Z [107], MSTW2008 [124], NNPDF2.3 [125], MSHT20 [108], ABMP16 [126], HERAPDF2.0 [127], ATLASepWZVjet20 [128], and CJ15 [129] PDFs for comparison. We also present the range of$ \langle M_T\rangle $ when varying$ M_W $ by$ \pm 5 $ MeV. In general, the predictions from all of the NNLO PDFs agree within uncertainties. The spread of their central values at NLO can be as large as the shift in$ M_W $ of 15 MeV if those from HERA and ATLAS PDFs are not considered. This number is smaller at approximately 10 MeV for LO predictions. The size of the PDF uncertainties is consistent among NNLO PDFs, with CT18 being one of the largest at approximately twice that of NNPDF3.1. Moreover, when comparing the results from up-to-date PDFs with previous values of the same PDF group, we find that the PDF uncertainties can even increase in many cases. NLO PDFs predict larger$ \langle M_T\rangle $ in general compared to NNLO PDFs.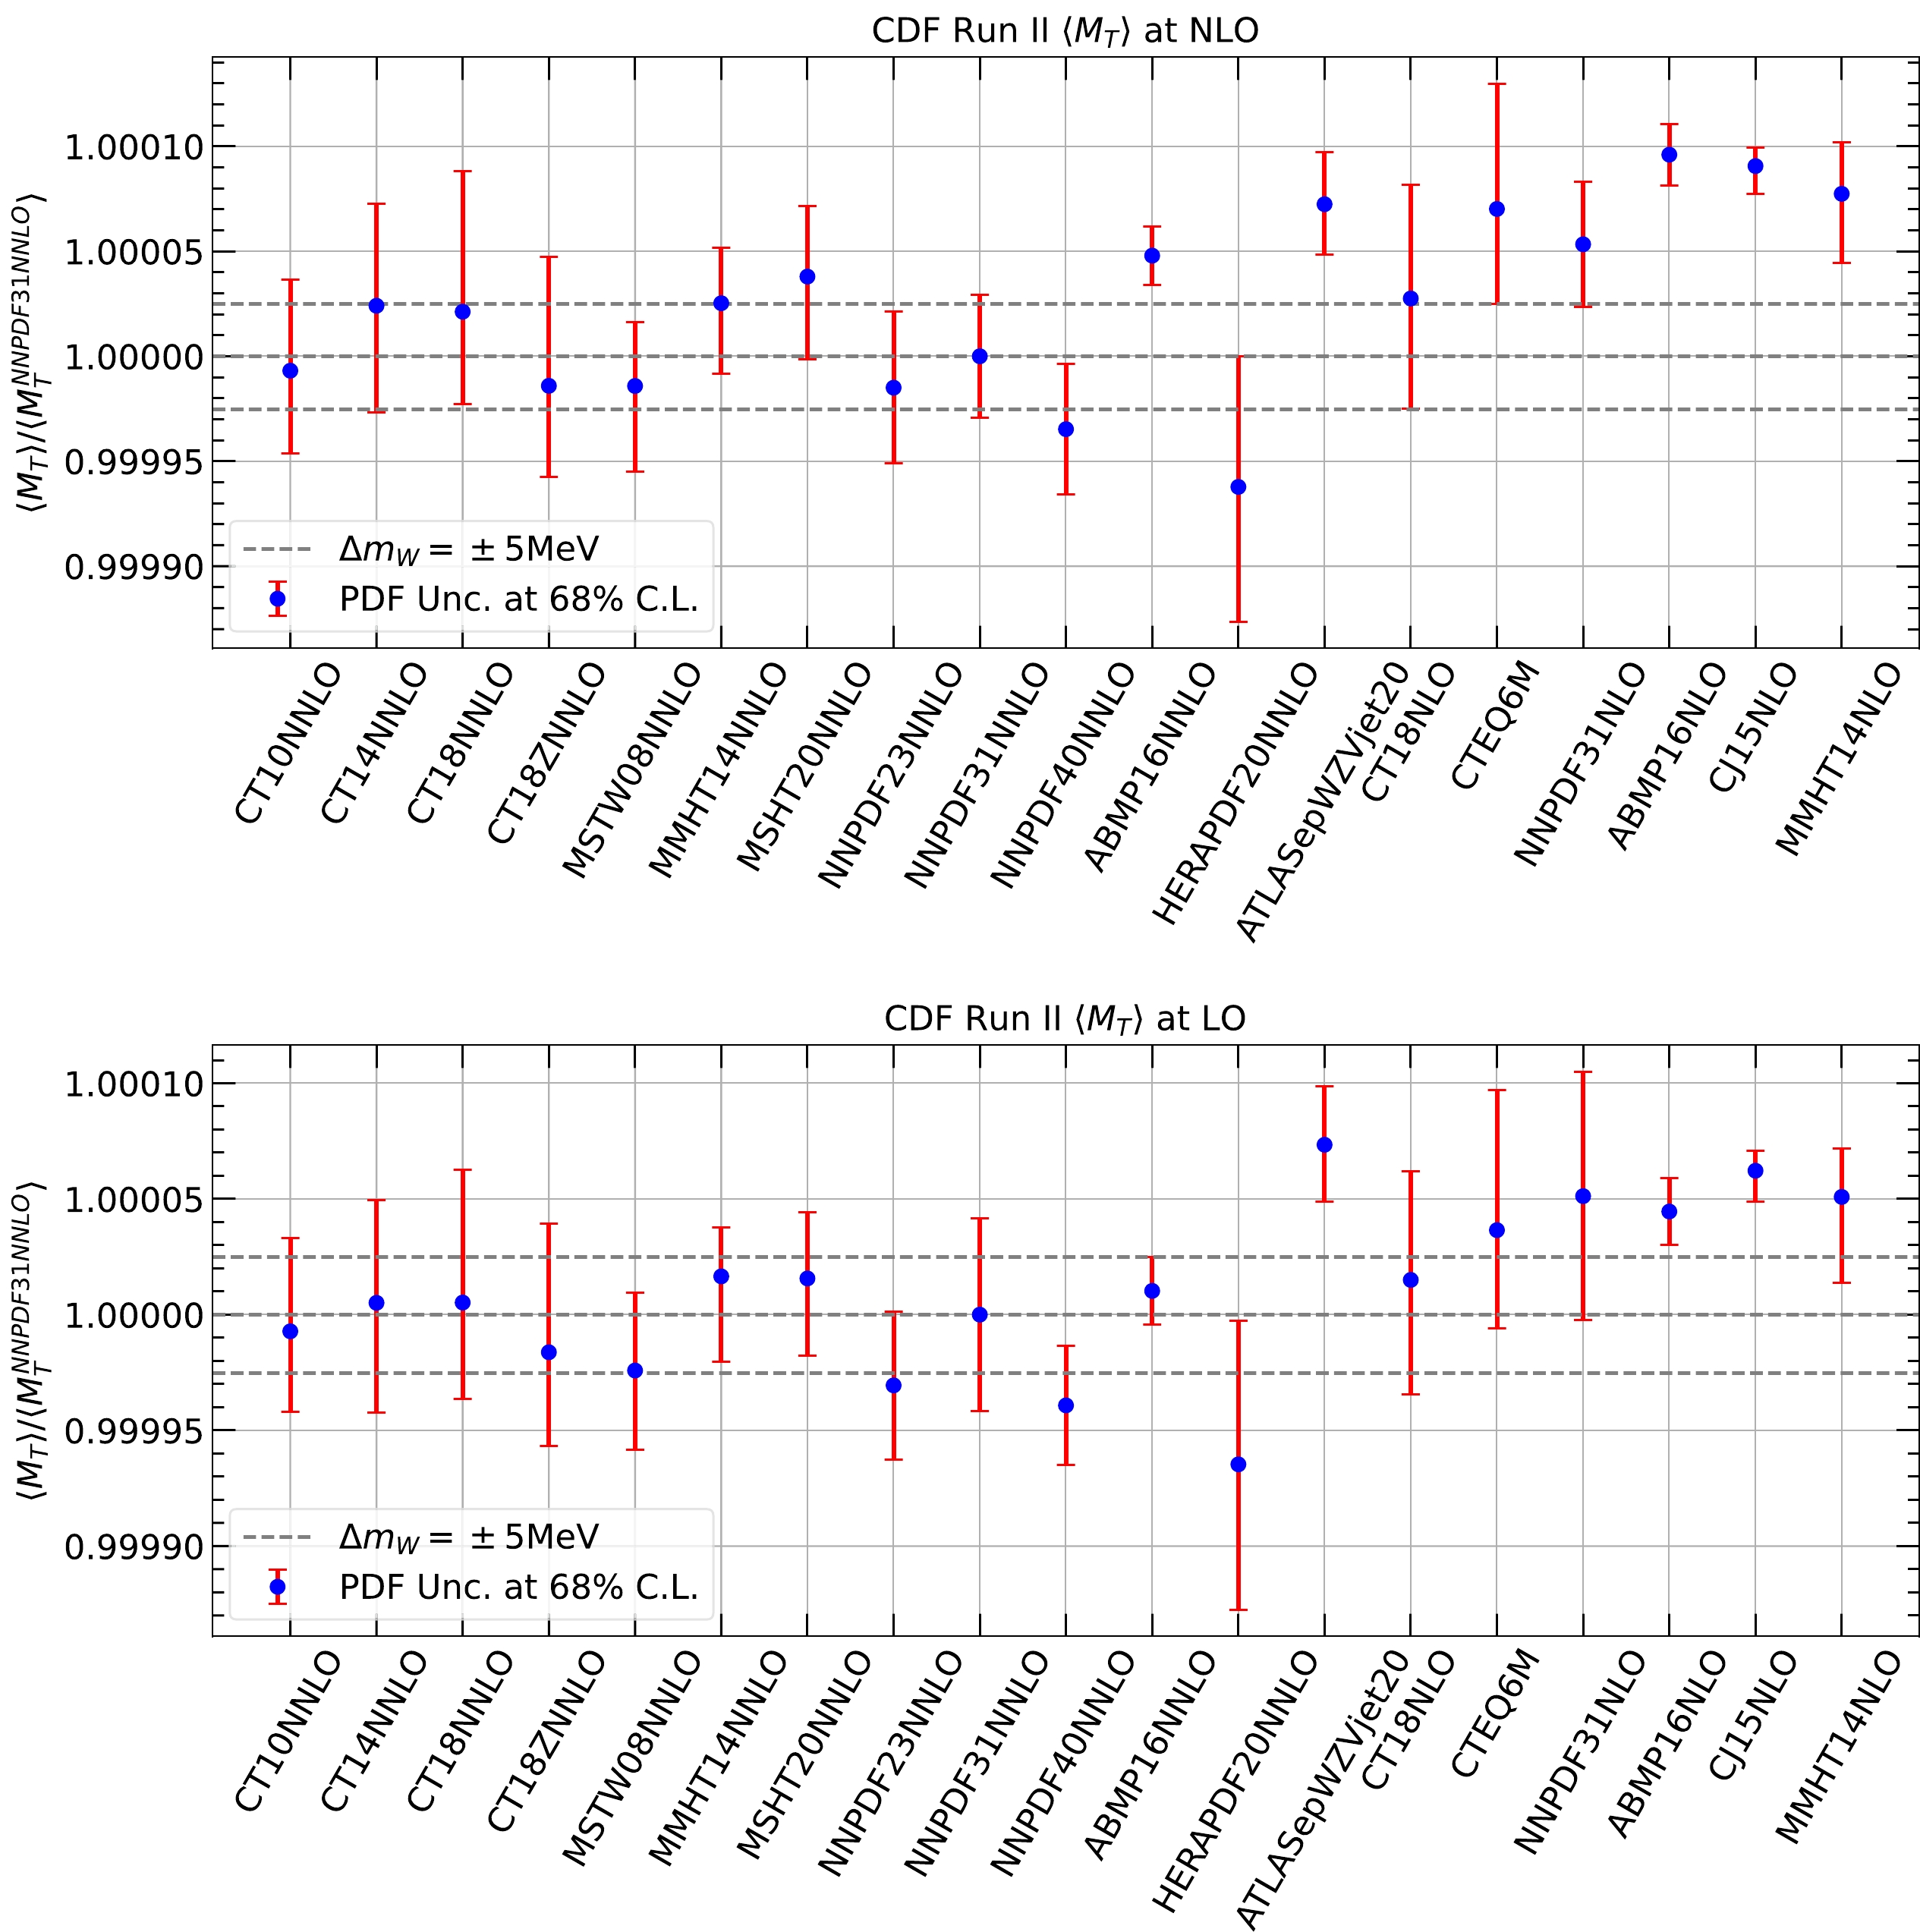
Figure 2. (color online) Mean transverse mass of the charged lepton and missing energy in the scenario of the CDF measurement calculated at NLO or LO with various PDFs, normalized to the central prediction of NNPDF3.1 NNLO PDFs. The error bars represent PDF uncertainties at a 68% C.L., and the horizontal lines indicate variations induced by a W boson mass change of
$ \pm 5 $ MeV.Figure 2 shows a simplified prescription using
$ \langle M_T\rangle $ to quantify the shift in the extracted W boson mass when using different PDFs and the associated uncertainties. Ideally, one can consider the shift in$ M_W $ to compensate for the change in$ \langle M_T\rangle $ induced by the variation of PDFs. We summarize the estimated shifts in the extracted$ M_W $ with respect to NNPDF3.1 and associated PDF uncertainties in Table 1 and compare them to the results in the CDF analysis when available. Using the$ \langle M_T\rangle $ prescription NNPDF3.1 gives a PDF uncertainty of 5.7 MeV for the extracted W boson mass at NLO; in contrast, a value of 3.9 MeV is obtained from the CDF analysis. The envelope of extracted$ M_W $ values from the central sets of NNPDF3.1, CT18, and MMHT14 is approximately 5.0 MeV, whereas the envelope is 4.2 MeV from the CDF analysis. Thus, the simplified prescription is in reasonable agreement with the dedicated simulation in the CDF analysis. However, using the$ \langle M_T\rangle $ prescription, we find a$ \delta M_W $ value of -14 MeV when comparing CTEQ6M with NNPDF3.1, whereas this value is -3.3 MeV from the CDF analysis. The shift is reduced to -7.3 MeV when using LO calculations of$ \langle M_T\rangle $ . Another interesting observation is that for the most recent NNLO PDFs, namely CT18, MMHT20, and NNPDF4.0, the envelope of extracted$ M_W $ from their central sets is enlarged to 15(11) MeV at NLO(LO), which is larger than that of the previous generation. This further motivates the analysis of W boson mass data using up-to-date PDFs.$ \delta M_W $ in MeV

sta. NNPDF3.1 CT18 MMHT14 NNPDF4.0 MSHT20 CTEQ6M $ \langle M_T\rangle $ (LO)

− 0 $ ^{+ 8.3}_{-8.3} $ 

$ - $ 1.0

$ _{-11.4}^{+8.3} $ 

$ - $ 3.3

$ _{-4.2}^{+7.4} $ 

$ + $ 7.8

$ ^{+5.1}_{-5.1} $ 

$ - $ 3.1

$ _{-5.7}^{+6.7} $ 

$ - $ 7.3

$ _{-12.0}^{+8.4} $ 

$ \chi^2 $ fit (LO)

8.0 0 $ _{-7.6}^{+7.6} $ 

$ - $ 1.0

$ _{-8.6}^{+5.4} $ 

$ - $ 3.3

$ _{-3.0}^{+6.1} $ 

$ + $ 8.0

$ _{-3.7}^{+3.7} $ 

$ - $ 3.0

$ _{-4.0}^{+5.0} $ 

$ - $ 7.3

$ _{-9.3}^{+5.6} $ 

$ \langle M_T\rangle $ (NLO)

− 0 $ ^{+ 5.9}_{-5.9} $ 

$ - $ 4.2

$ _{-13.3}^{+8.8} $ 

$ - $ 5.0

$ _{-5.3}^{+6.7} $ 

$ + $ 6.9

$ ^{+6.2}_{-6.2} $ 

$ - $ 7.6

$ _{-6.7}^{+7.9} $ 

$ - $ 14.0

$ _{-11.9}^{+9.0} $ 

$ \chi^2 $ fit (NLO)

8.0 0 $ _{-4.2}^{+4.2} $ 

$ - $ 4.3

$ _{-10.1}^{+5.4} $ 

$ - $ 5.1

$ _{-3.4}^{+4.8} $ 

$ + $ 7.1

$ _{-4.5}^{+4.5} $ 

$ - $ 7.8

$ _{-4.5}^{+5.7} $ 

$ - $ 14.6

$ _{-5.4}^{+5.8} $ 

CDF 9.2 0 $ ^{+ 3.9}_{-3.9} $ 

− − − − $ - $ 3.3

Table 1. Estimated shifts and PDF uncertainties at a 68% C.L. in the extracted W boson mass of the CDF scenario for various PDF sets with respect to a common reference using an NNPDF3.1 NNLO central PDF. The results are presented using the simplified prescription and compared with those from a
$ \chi^2 $ fit as well as results reported in the CDF analysis. In the case of the$ \chi^2 $ fit, we also show the expected experimental statistical error of the extracted W boson mass compared to the actual value in the CDF analysis.The CDF analysis dependence of the extracted
$ M_W $ on PDFs is studied via fitting to pseudo experiments. We perform similar studies and use the predictions of NNPDF3.1 NNLO PDFs as pseudo-data. We calculate$ \chi^2 $ as a function of$ M_W $ to use predictions from various PDFs, considering only statistical uncertainties because they are dominant over experimental systematic uncertainties. Then, we can estimate the shift in the extracted$ M_W $ as well as the statistical and PDF uncertainties included in Table 1 for comparison. We can see that the$ \chi^2 $ fit indicates a statistical uncertainty on the extracted$ M_W $ of 8.0 MeV, which is consistent with the value of 9.2 MeV from the CDF measurement on the muon channel alone. The$ \chi^2 $ fit shows very good agreement for the projected shift in the extracted$ M_W $ for different PDFs with respect to the previous simplified prescription using$ \langle M_T\rangle $ . The estimated PDF uncertainties are slightly smaller than previous values because the$ \chi^2 $ fit does account for the higher moments of the kinematic distribution.Besides the PDF dependence, we also explore other theoretical uncertainties, including the factorization and renormalization scales, strong coupling constant, and W-boson decay width, based on a
$ \chi^2 $ fit of the transverse mass distribution at NLO with CT18 NNLO PDFs. The results are summarized in Table 2 and discussed in sequence as follows:Variation $ \mu_{F,R} $ (7-point)

$ \alpha_s=0.118\pm0.002 $ 

$ \Gamma_W=2,085\pm42 {\rm{MeV}} $ 

$ \chi^2 $ fit (NLO)

$ 0_{-3.0}^{+3.1} $ 

$ 0_{-1.3}^{+1.2} $ 

$ 0_{-6.8}^{+7.1} $ 

Table 2. Dependence of
$ M_W $ extraction on the factorization and renormalization scales, strong coupling constant, and W-boson decay width in the CDF scenario.$ \bullet $ The scale uncertainty is estimated with the envelope of seven-point variation,$ \begin{aligned}[b] (\mu_F,\mu_R)=&\{(1/2,1/2),(1/2,1),(1,1/2),(1,1),(1,2),\\&(2,1),(2,2)\}M_{\ell\nu}. \end{aligned} $

(5) It is found that maximal shifts in
$ M_W $ are -3.0 and +3.1 MeV. However, we expect the impact of scale variations to be largely reduced once higher order corrections are included.$ \bullet $ The strong coupling constant can impact$ M_W $ extraction in two ways. First, starting from NLO, high-order corrections to W boson production are directly involved in the QCD interaction. Second, different choices of strong coupling in the QCD global analysis will lead to different PDFs, with the impact propagating to$ M_W $ extraction. We quantify the dependence by varying$ \alpha_s $ between 0.116 and 0.120 along with consistent PDF variations. This changes the extracted$ M_W $ by -1.3 and +1.2 MeV, respectively.$ \bullet $ To date, the most precise measurements of the W-boson decay width$ \Gamma_W $ have originated from the LEP [104] and Tevatron [130], which gave a combined result of$\Gamma_W=2,085\pm 42\; {\rm{MeV}}$ [3]. In experimental analyses, the CDF collaboration adopted the electroweak global fitting value of$2,089.5\pm 0.6\; {\rm{MeV}}$ [3] and found that the uncertainty induced by the input width was negligible. However, if the W-boson width is allowed to vary by 42 MeV, which is the error from direct measurements, we find that the normalized$ M_T $ distribution can deviate significantly (up to 2% at$ M_T\sim90\; {\rm{GeV}} $ ). As a result, the extracted$ M_W $ value can shift by -6.8 (+7.1) MeV, comparable to the full uncertainty on the CDF measurement. This suggests that a simultaneous fit of the W-boson mass and width is possible and may result in comparable precision on the width measurement. -
We repeat a similar exercise for the 7 TeV ATLAS measurement. The event selection criterion follows [101]
$ \begin{equation} p_T^{\ell,\nu}>30\; {\rm{GeV}},\; u_T<30\; {\rm{GeV}},\; M_T>60\; {\rm{GeV}}. \end{equation} $

(6) The pseudo-rapidity of the charged lepton is required to satisfy
$ \begin{equation} |\eta|<2.4. \end{equation} $

(7) We use the same theoretical setups as in the calculations for the CDF scenario; however, separate calculations must be performed for
$ W^+ $ and$ W^- $ production. We assume a detector resolution of 10% for$ M_T $ to effectively reproduce the shape of the measured distribution.In Fig. 3, we show the predictions of the normalized
$ M_T $ distribution at NLO for several choices of PDFs and different values of the W boson mass for both$ W^+ $ and$ W^- $ production. We find that the PDF variations are approximately twice those shown in Fig. 1 for the CDF scenario, whereas the dependence on the W boson mass is similar in size. The PDFs clearly alter$ W^+ $ and$ W^- $ production in different ways, evident by the fact that the NNPDF4.0 central predictions lie on opposite sides of CT10 for$ W^+ $ and$ W^- $ . The PDF uncertainties of CT10 are larger for$ W^- $ production than$ W^+ $ production, possibly because of the relatively larger contributions from the strange quark in the former case. The significance in the lowest panel is calculated assuming a total number of events equal to that from the ATLAS measurement of the muon channel and a bin width of 0.5 GeV.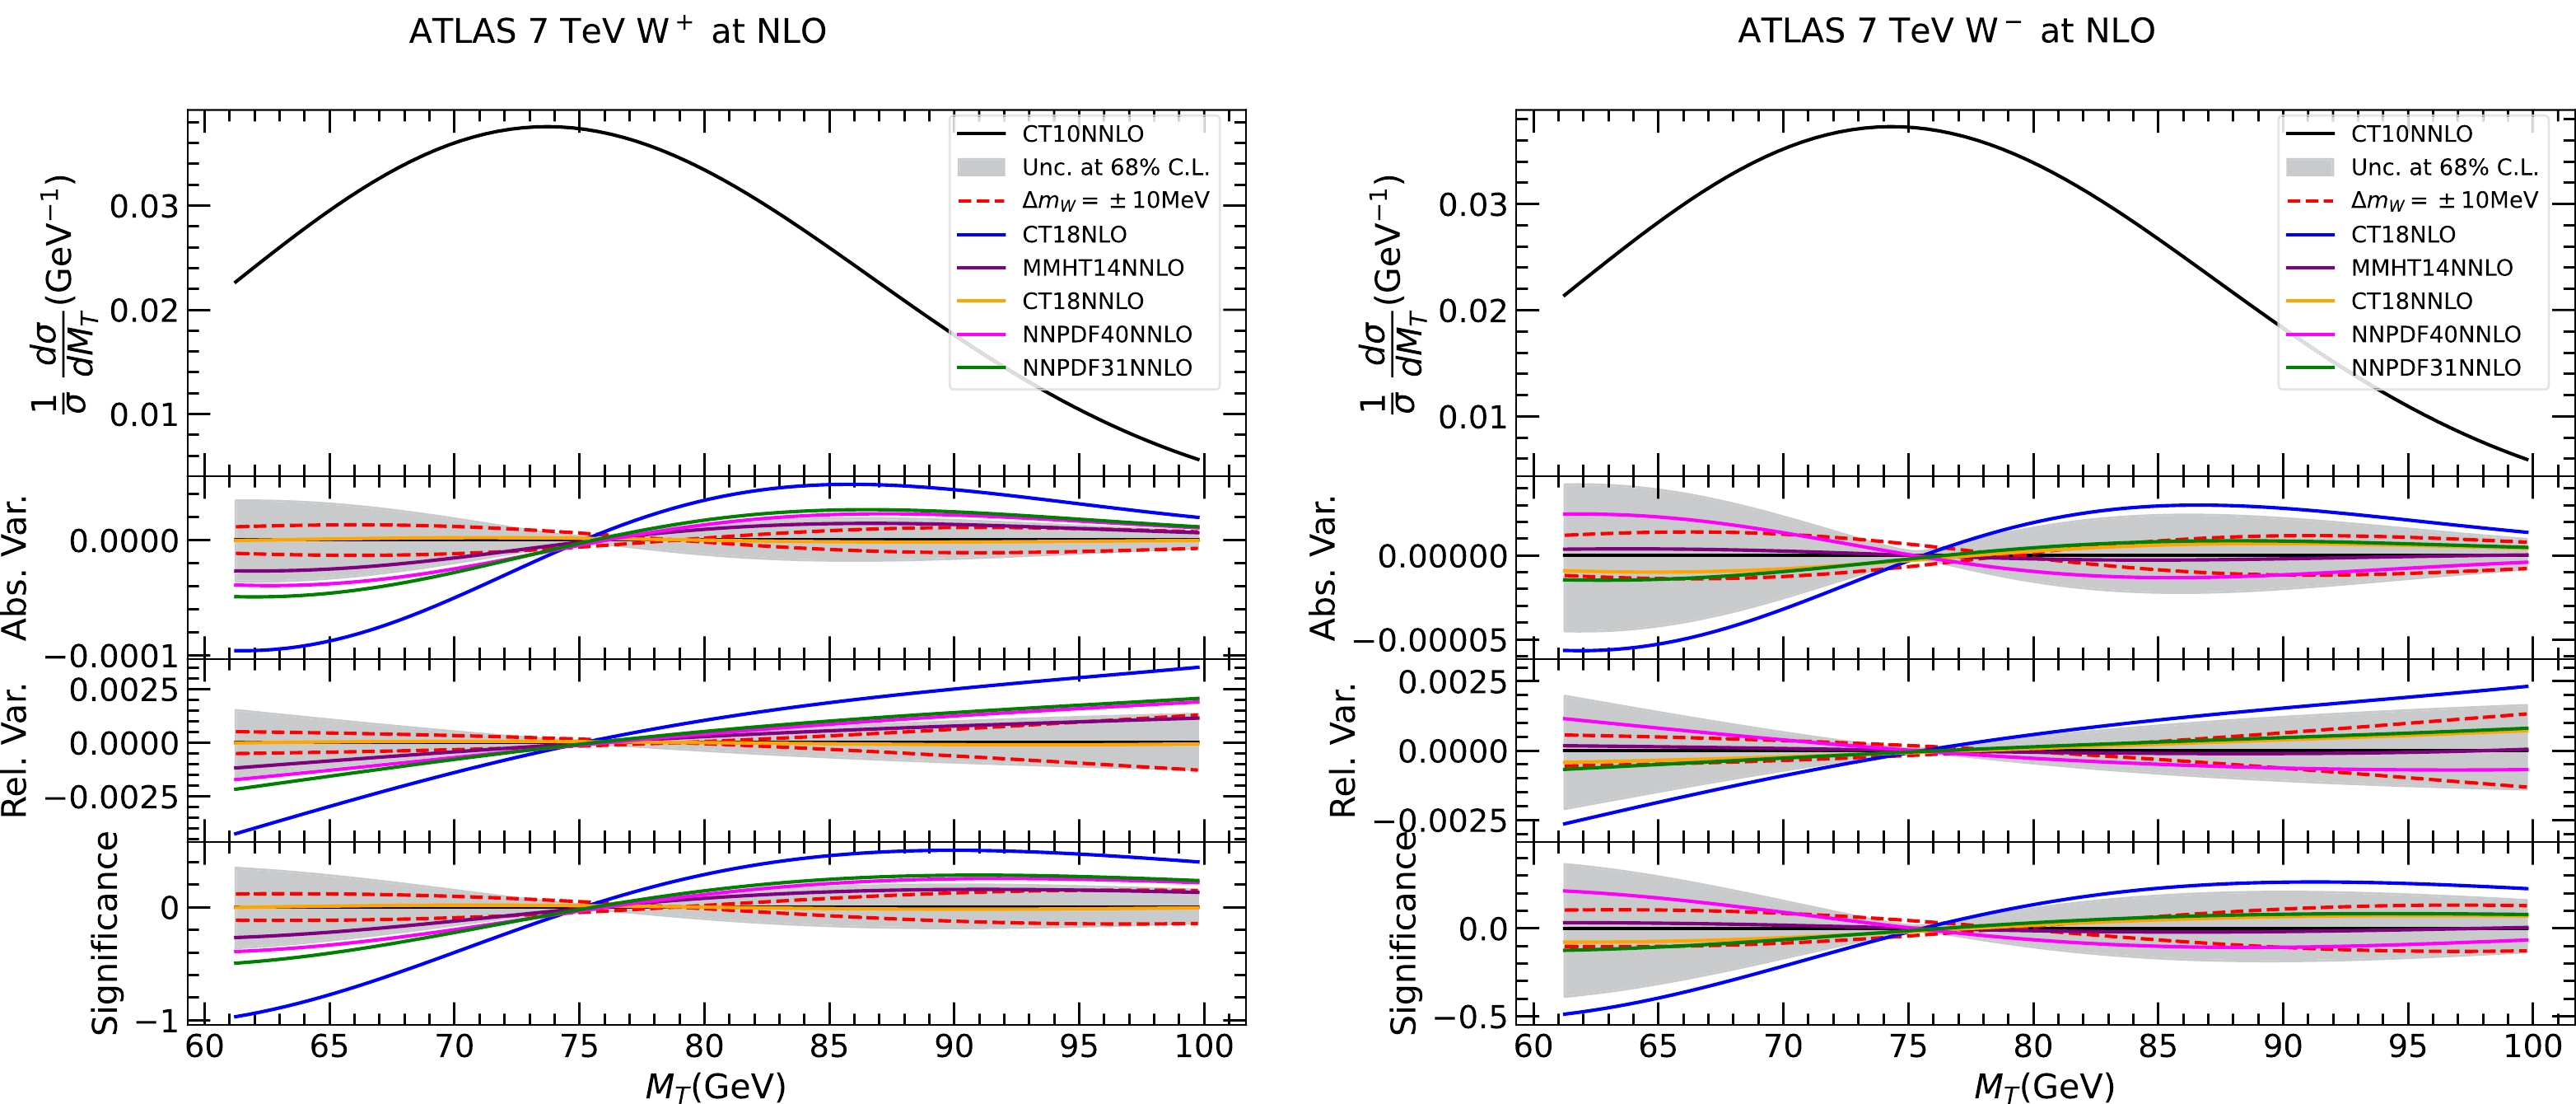
Figure 3. (color online) Transverse mass distribution of the charged lepton and missing energy in the scenario of the ATLAS measurement for
$ W^+ $ and$ W^- $ with various PDFs and different values of the W boson mass (increased or decreased by 10 MeV) calculated at NLO. From top to bottom are the normalized distribution, and absolute and relative changes with respect to a common reference of the prediction obtained with CT10 NNLO PDFs and the nominal W boson mass. The lowest panel shows the changes normalized to the experimental statistical uncertainties.Similar to the CDF case, Fig. 4 shows the mean transverse mass within a window of [65, 100] GeV for
$ W^+ $ and$ W^- $ production with various choices of PDFs. All predictions are normalized to the central prediction from CT10 NNLO PDFs, including those with a W boson mass change of$ \pm 5 $ MeV. We find a wider spread of predictions from different PDFs and larger PDF uncertainties compared to Fig. 2, which is consistent with observations in the normalized distributions. We can again use the simplified prescription to estimate the expected shift in the extracted W boson mass and the associated PDF uncertainties, which are summarized in Table 3. For example, we estimate a PDF uncertainty of approximately 13 and 14 MeV with CT10 NNLO PDFs for$ W^+ $ and$ W^- $ , respectively, whereas ATLAS reported 15 and 14 MeV, respectively. We also note that the central sets of both NNPDF4.0 and MSHT20 prefer a downward shift in$ M_W $ of almost 20 MeV for$ W^+ $ production compared with those of CT10. These shifts are generally smaller for$ W^- $ production. We take an unweighted average of the$ W^+ $ and$ W^- $ results on$ \langle M_T\rangle $ and show the shift in the extracted W boson mass in Table 3, denoted as$ W^{\pm} $ . The combinations reveal less spread of the expected shift in$ M_W $ , and the PDF uncertainties are generally reduced. The PDF uncertainty in the W boson mass for$ W^{\pm} $ decreases slightly to 11 MeV for CT10 NNLO PDFs. In the ATLAS analysis, the combined$ W^{\pm} $ results exhibit a PDF uncertainty of approximately 7 MeV, which is largely reduced compared to those of$ W^+ $ and$ W^- $ alone owing to the anti-correlations of PDF dependence in the two. We observe a similar pattern for CT10 when using LO calculations instead of NLO, that is, by excluding PDF uncertainties due to the modeling of the W boson$ p_T $ . The corresponding results are also summarized in Table 3.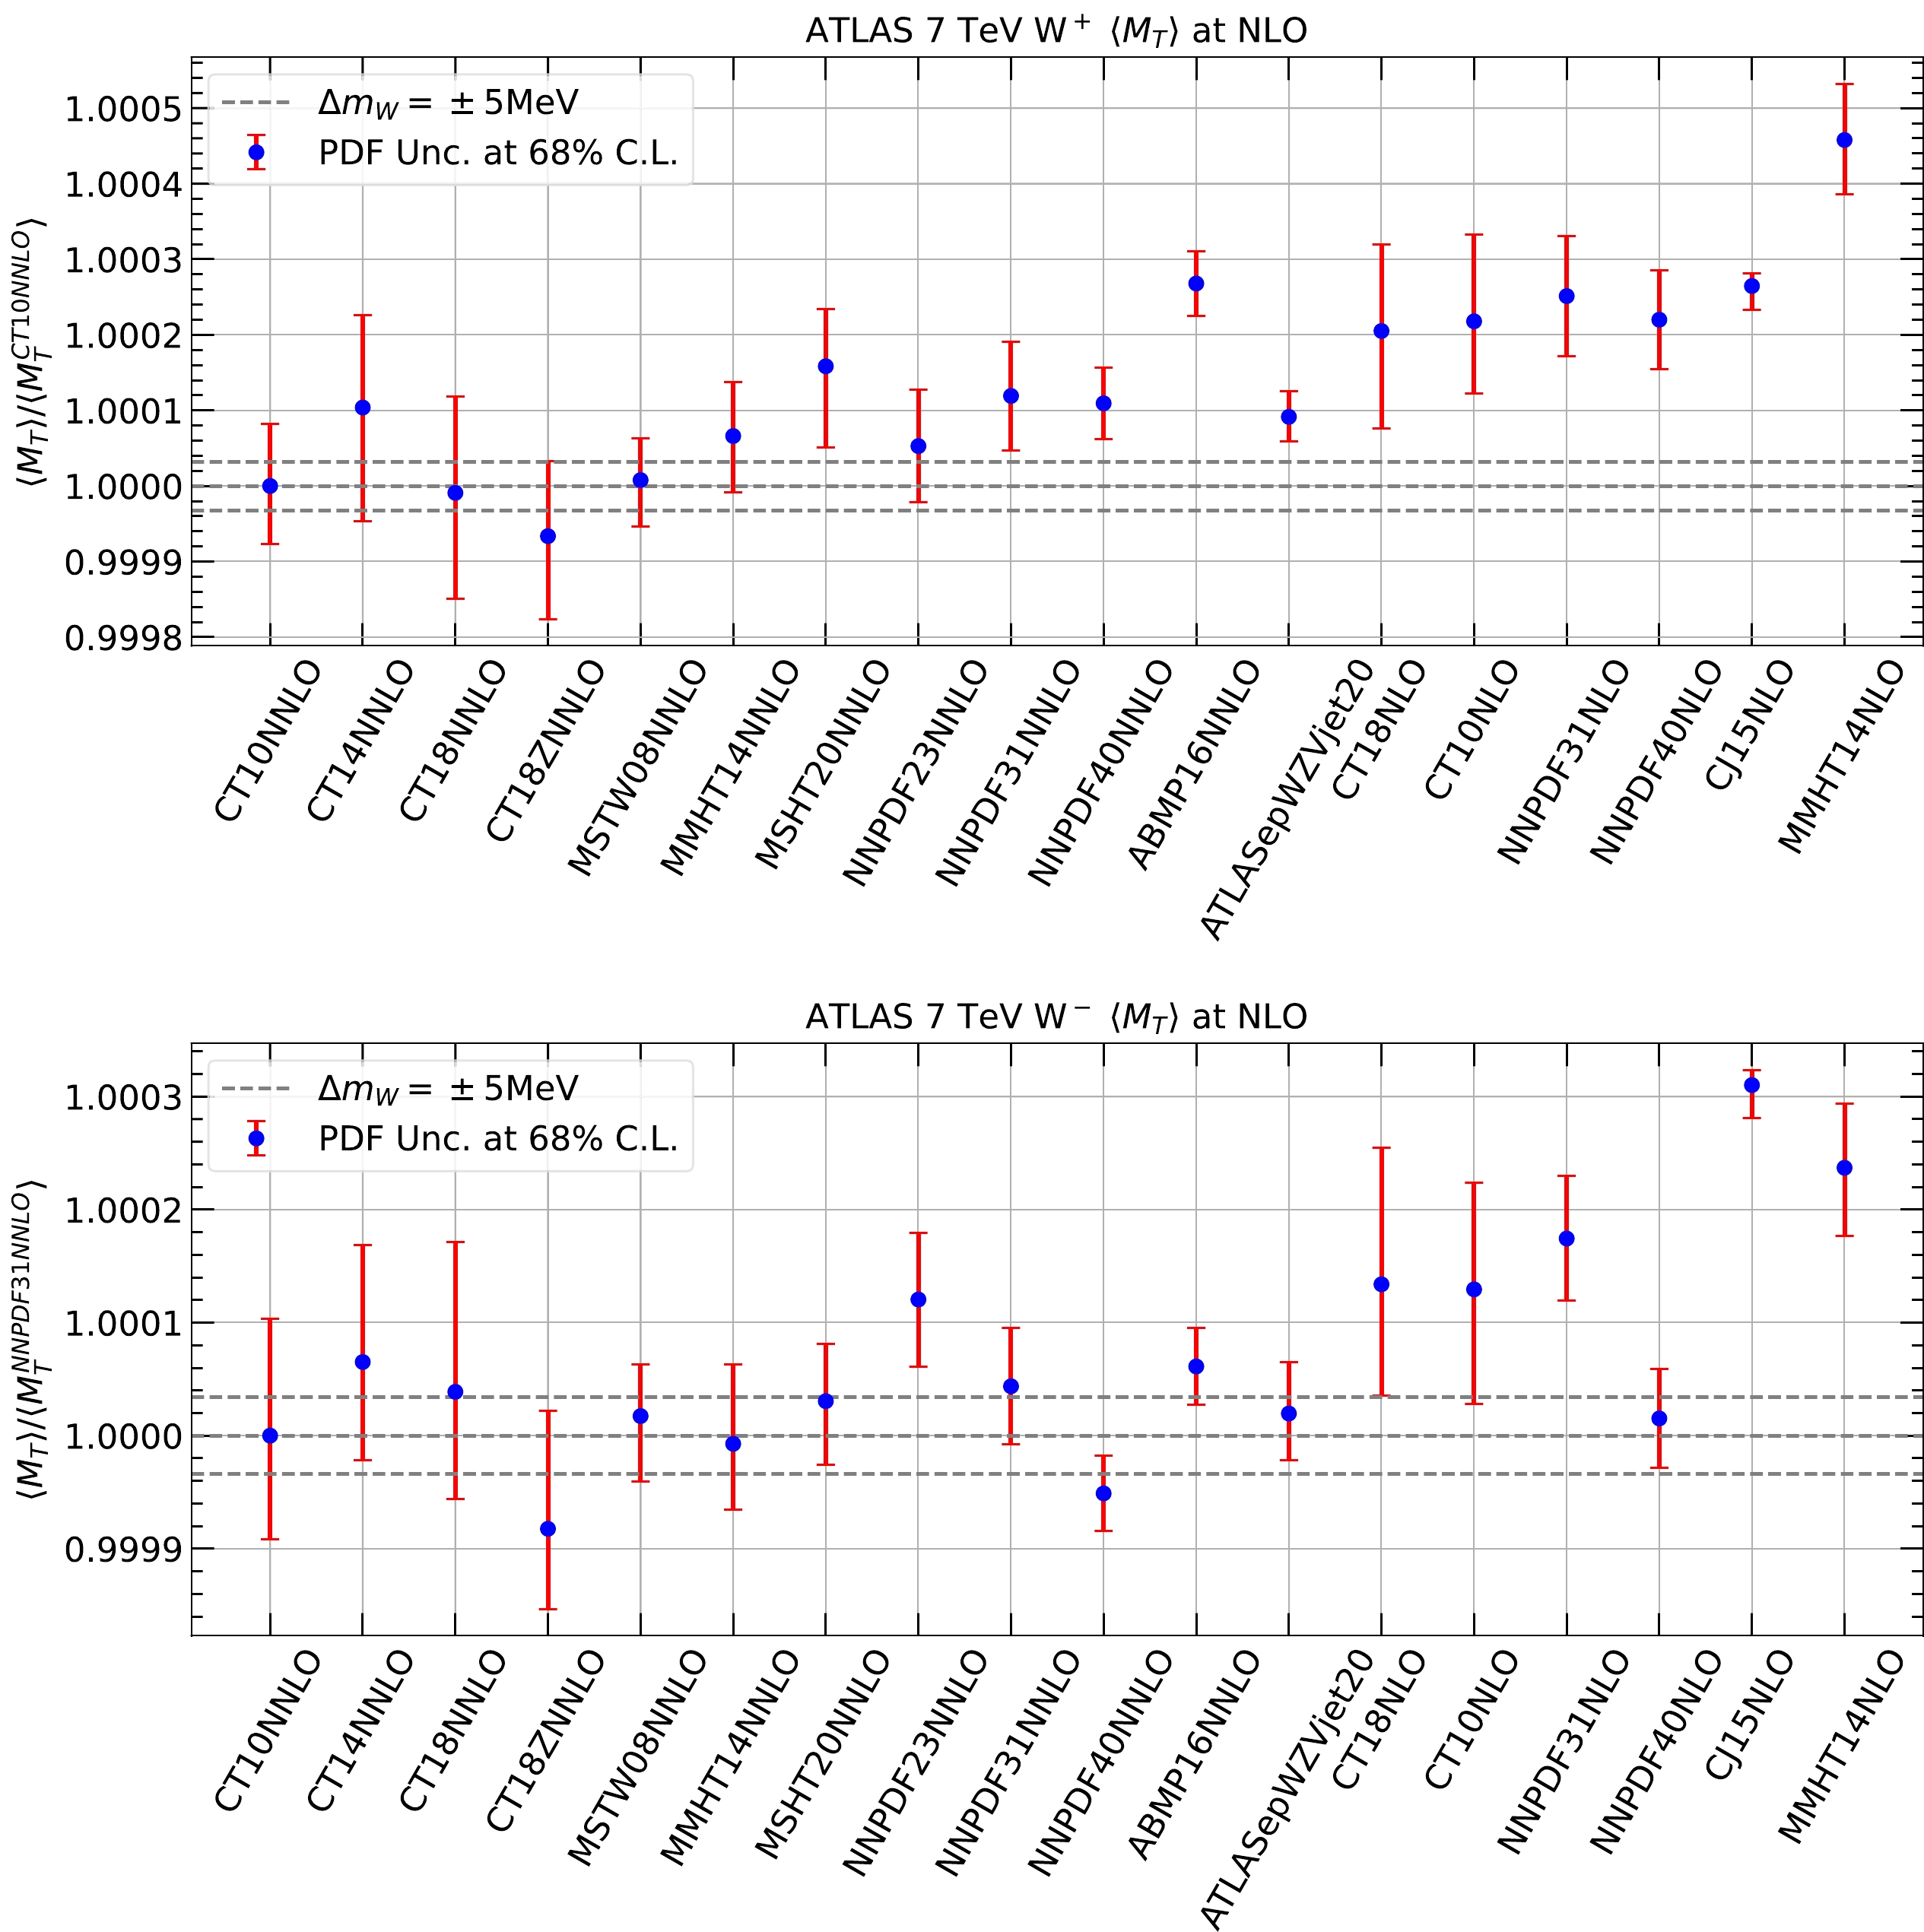
Figure 4. (color online) Mean transverse mass of the charged lepton and missing energy in the scenario of ATLAS measurement calculated at NLO with various PDFs, normalized to the central prediction of CT10 NNLO PDFs, for
$ W^+ $ and$ W^- $ production. The error bars represent PDF uncertainties at a 68% C.L., and the horizontal lines indicate variations induced by a W boson mass change of$ \pm 5 $ MeV.$ \delta M_W $ in MeV

CT10 CT18 MMHT14 NNPDF4.0 CT14 MSHT20 $ W^+ $ 

$ \langle M_T\rangle $ (NLO)

0 $ ^{+ 12.1}_{-12.9} $ 

$ + $ 1.4

$ _{-20.0}^{+21.8} $ 

$ - $ 10.3

$ _{-11.1}^{+11.6} $ 

$ - $ 17.1

$ ^{+7.4}_{-7.4} $ 

$ - $ 16.2

$ _{-19.1}^{+23.5} $ 

$ - $ 24.8

$ _{-11.9}^{+16.8} $ 

$ W^- $ 

$ \langle M_T\rangle $ (NLO)

0 $ ^{+ 13.5}_{-15.2} $ 

$ - $ 5.7

$ _{-19.5}^{+14.0} $ 

$ + $ 1.1

$ _{-10.3}^{+8.6} $ 

$ + $ 7.5

$ ^{+4.9}_{-4.9} $ 

$ - $ 9.6

$ _{-15.3}^{+12.8} $ 

$ - $ 4.5

$ _{-7.5}^{+8.3} $ 

$ W^{\pm} $ 

$ \langle M_T\rangle $ (NLO)

0 $ ^{+ 9.8}_{-11.4} $ 

$ - $ 2.3

$ _{-16.8}^{+14.4} $ 

$ - $ 4.5

$ _{-8.5}^{+8.2} $ 

$ - $ 4.4

$ ^{+4.6}_{-4.6} $ 

$ - $ 12.8

$ _{-15.1}^{+16.6} $ 

$ - $ 14.3

$ _{-8.0}^{+10.9} $ 

$ W^+ $ 

$ \langle M_T\rangle $ (LO)

0 $ ^{+ 10.8}_{-11.4} $ 

$ - $ 6.5

$ _{-10.0}^{+14.1} $ 

$ - $ 5.7

$ _{-7.1}^{+8.1} $ 

$ - $ 14.1

$ ^{+5.8}_{-5.8} $ 

$ - $ 4.1

$ _{-12.9}^{+15.0} $ 

$ - $ 14.4

$ _{-7.3}^{+10.2} $ 

$ W^- $ 

$ \langle M_T\rangle $ (LO)

0 $ ^{+ 8.9}_{-11.4} $ 

$ - $ 7.2

$ _{-12.5}^{+10.1} $ 

$ + $ 3.1

$ _{-9.9}^{+8.3} $ 

$ + $ 3.5

$ ^{+4.5}_{-4.5} $ 

$ - $ 7.0

$ _{-8.9}^{+6.2} $ 

$ + $ 2.1

$ _{-4.9}^{+6.3} $ 

$ W^{\pm} $ 

$ \langle M_T\rangle $ (LO)

0 $ ^{+ 5.2}_{-7.0} $ 

$ - $ 0.6

$ _{-7.4}^{+7.6} $ 

$ - $ 1.2

$ _{-5.9}^{+5.3} $ 

$ - $ 5.0

$ ^{+3.0}_{-3.0} $ 

$ - $ 5.6

$ _{-8.4}^{+8.0} $ 

$ - $ 5.9

$ _{-4.2}^{+5.9} $ 

$ W^+ $ ATLAS

0 $ ^{+ 14.9}_{-14.9} $ 

− − − − − $ W^- $ ATLAS

0 $ ^{+ 14.2}_{-14.2} $ 

− − − − − $ W^{\pm} $ ATLAS

0 $ ^{+ 7.4}_{-7.4} $ 

− − − − − Table 3. Estimated shifts and PDF uncertainties at a 68% C.L. of the extracted W boson mass in the ATLAS scenario for various PDF sets with respect to a common reference using the CT10 NNLO central PDF. We show the results with the simplified prescription and calculations at NLO and LO and compare them to the values from the ATLAS analysis.
-
In this section, we study the PDF uncertainties of the W boson mass measurements in the context of the CT18 global analysis. We focus on the observable of the mean transverse mass, which is strongly anti-correlated with the extracted W boson mass, as previously shown. We first reveal correlations between
$ \langle M_T\rangle $ and PDFs of different flavors and momentum fractions x and those of$ \langle M_T\rangle $ in different measurements. This is followed by a series of LM scans to understand the constraints imposed by individual data sets in the CT18 global analysis. -
We study the PDF-induced correlations of the observables proposed in the previous section, namely, the mean transverse mass of the charged lepton and missing energy in the CDF and ATLAS measurements. The correlations are calculated using CT18 NNLO PDFs with the transverse mass distributions at NLO by default. In the Hessian approach, the correlations between two observables, X and Y, can be estimated [131]:
$\cos (\Delta \varphi)=\frac {\displaystyle\sum\nolimits_{i=1}^{N_{\rm eig}}\left(X_{i}^+-X_{i}^-\right) \left(Y_{i}^+-Y_{i}^-\right)}{ \sqrt{\displaystyle\sum\nolimits_{i=1}^{N_{\rm eig}}\left[X_{i}^+-X_{i}^-\right]^{2}} \sqrt{\displaystyle\sum\nolimits_{i=1}^{N_{\rm eig}}\left[Y_{i}^+-Y_{i}^-\right]^{2}}}, $

(8) where
$ \Delta\varphi $ is the correlation angle, and$ X_i^{\pm} $ ($ Y_i^{\pm} $ ) represent the values of X (Y), with the error on the PDF of the Hessian set in the positive and negative directions of the$i_{\rm th}$ eigenvector in$N_{\rm eig}$ -dimensional PDF parameter space. In addition, the error ellipse for X and Y, which is determined using CT18 NNLO PDFs at a 68% C.L., can be found using the following parametric equations [131]:$ \begin{aligned}[b]& \left\{\begin{array}{ll} X(\theta)=\dfrac{1}{2\times1.645}\sqrt{\displaystyle\sum\nolimits_{i=1}^{N_{\rm eig}}\left[X_{i}^+-X_{i}^-\right]^{2}} \cos \theta, \\ \\ Y(\theta)=\dfrac{1}{2\times1.645}\sqrt{\displaystyle\sum\nolimits_{i=1}^{N_{\rm eig}}\left[Y_{i}^+-Y_{i}^-\right]^{2}} \cos (\theta+\Delta \varphi), \end{array}\right. \\& \qquad (0 \le \theta < 2\pi). \end{aligned} $

(9) In Fig. 5, we plot the correlations between
$ \langle M_T\rangle $ and PDFs of various flavors at different x values and with$ Q= $ 100 GeV. In the scenario of CDF measurement,$ \langle M_T\rangle $ is anti-correlated with a d-quark at$ x\sim 0.01 $ because this corresponds to a W boson produced in large rapidity regions, where the decayed lepton has a smaller average$ p_T $ , as explained later in Sec. III.C. For the same reason,$ \langle M_T\rangle $ in the case of$ W^+ $ production at 7 TeV ATLAS is anti-correlated with the$ \bar d $ quark, but now at$ x\sim 0.002 $ . In the ATLAS$ W^- $ production at 7 TeV, various sea quarks exhibit moderate anti-correlations, including the strange quark. For the average$ \langle M_T\rangle $ of$ W^+ $ and$ W^- $ production at ATLAS, the correlations exhibit an average pattern of the two.
Figure 5. (color online) Correlations between
$ \langle M_T\rangle $ calculated at NLO and PDFs of different flavors as a function of x in the scenarios of CDF and ATLAS measurements of$ W^+ $ ,$ W^- $ , and their combination using CT18 NNLO PDFs.We plot a 68% C.L. relative error ellipse for each pair of observables in Fig. 6 at both NLO and LO. As shown, the PDF uncertainty of
$ \langle M_T\rangle $ at ATLAS is approximately twice that at the CDF, which is consistent with the results shown in an earlier section; the two are also largely uncorrelated. This suggests that the PDF uncertainty in the extracted$ M_W $ can be further reduced by combining the CDF and ATLAS measurements. However, the PDF uncertainties of$ \langle M_T\rangle $ for$ W^+ $ and$ W^- $ production at ATLAS are only partially correlated at NLO and anti-correlated at LO. Combining the$ \langle M_T\rangle $ of$ W^+ $ and$ W^- $ will reduce the PDF uncertainty, especially at LO, as it is evident from Table 3.
Figure 6. (color online) Relative error ellipse at a 68% C.L. for each pair of
$ \langle M_T\rangle $ in the scenarios of the CDF and ATLAS measurements of$ W^+ $ ,$ W^- $ , and their combination, calculated at NLO and LO using CT18 NNLO PDFs. -
LM scanning is a robust method of estimating PDF uncertainties, which was originally developed in Refs. [132, 133]. In this method, PDF uncertainties of an observable can be determined from the profiled
$ \chi^2 $ as a function of the observable without relying on any assumptions about the specific behavior of$ \chi^2 $ around the global minimum. However, the LM method requires a detailed scan of the PDF parameter space for every observable studied, which is usually time-consuming. To overcome this drawback, we take advantage of neural networks (NNs) and machine learning techniques to model the profiles of$ \chi^2 $ and$ \langle M_{T} \rangle $ for multi-dimensional parameter space, which work beyond quadratic approximations and ensure efficient scans of the entire parameter space. The setup of the NNs and further details can be found in Ref. [134].In Fig. 7, we show the results of LM scans on
$ \langle M_{T}\rangle $ based on the aforementioned NNs. The black and red solid lines indicate$ \Delta\chi^2 $ and$ \Delta\chi^2 + P $ , respectively, where P, known as a Tier-2 penalty [120, 123], is introduced to ensure that the tolerance is reached as soon as any data set shows disagreement at a 90% C.L. The PDF uncertainty of$ \langle M_{T}\rangle $ at a 90% C.L. can be determined by requiring$ \Delta\chi^2 + P = 100 $ , following the CT18 analysis. The dotted and dashed lines represent the contributions to$ \Delta\chi^2 $ from individual data sets. The blue and green vertical dot-dashed lines indicate the uncertainties at a 90% C.L. determined using the LM and Hessian methods [124, 135] from the published CT18 NNLO PDFs, respectively. The profiles of the total$ \Delta\chi^2 $ and individual$ \Delta\chi^2 $ exhibit an almost quadratic dependence on the variable in the vicinity of the global minimum. In the case of the CDF measurement, in the left panel, NMC deuteron to proton ratio data along with D0 Run II charge asymmetry data and E866 Drell-Yan deuteron to proton ratio data give the dominant constraints. The penalty term contributes largely to the total constraints and cuts off the uncertainty range well before the global$ \Delta \chi^2 $ reaches the tolerance. The LM method gives a smaller PDF uncertainty than the estimation based on the Hessian method [124, 135]. In the case of$ W^{-} $ production at 7 TeV ATLAS, in the right panel, we find that BCDMS deuteron data along with HERA inclusive DIS data and 8 TeV CMS charge asymmetry data give the dominant constraints. In addition, the BCDMS deuteron data prefer a larger$ \langle M_{T}\rangle $ , which results in a large penalty term. The LM method again predicts a slightly smaller uncertainty than the Hessian method.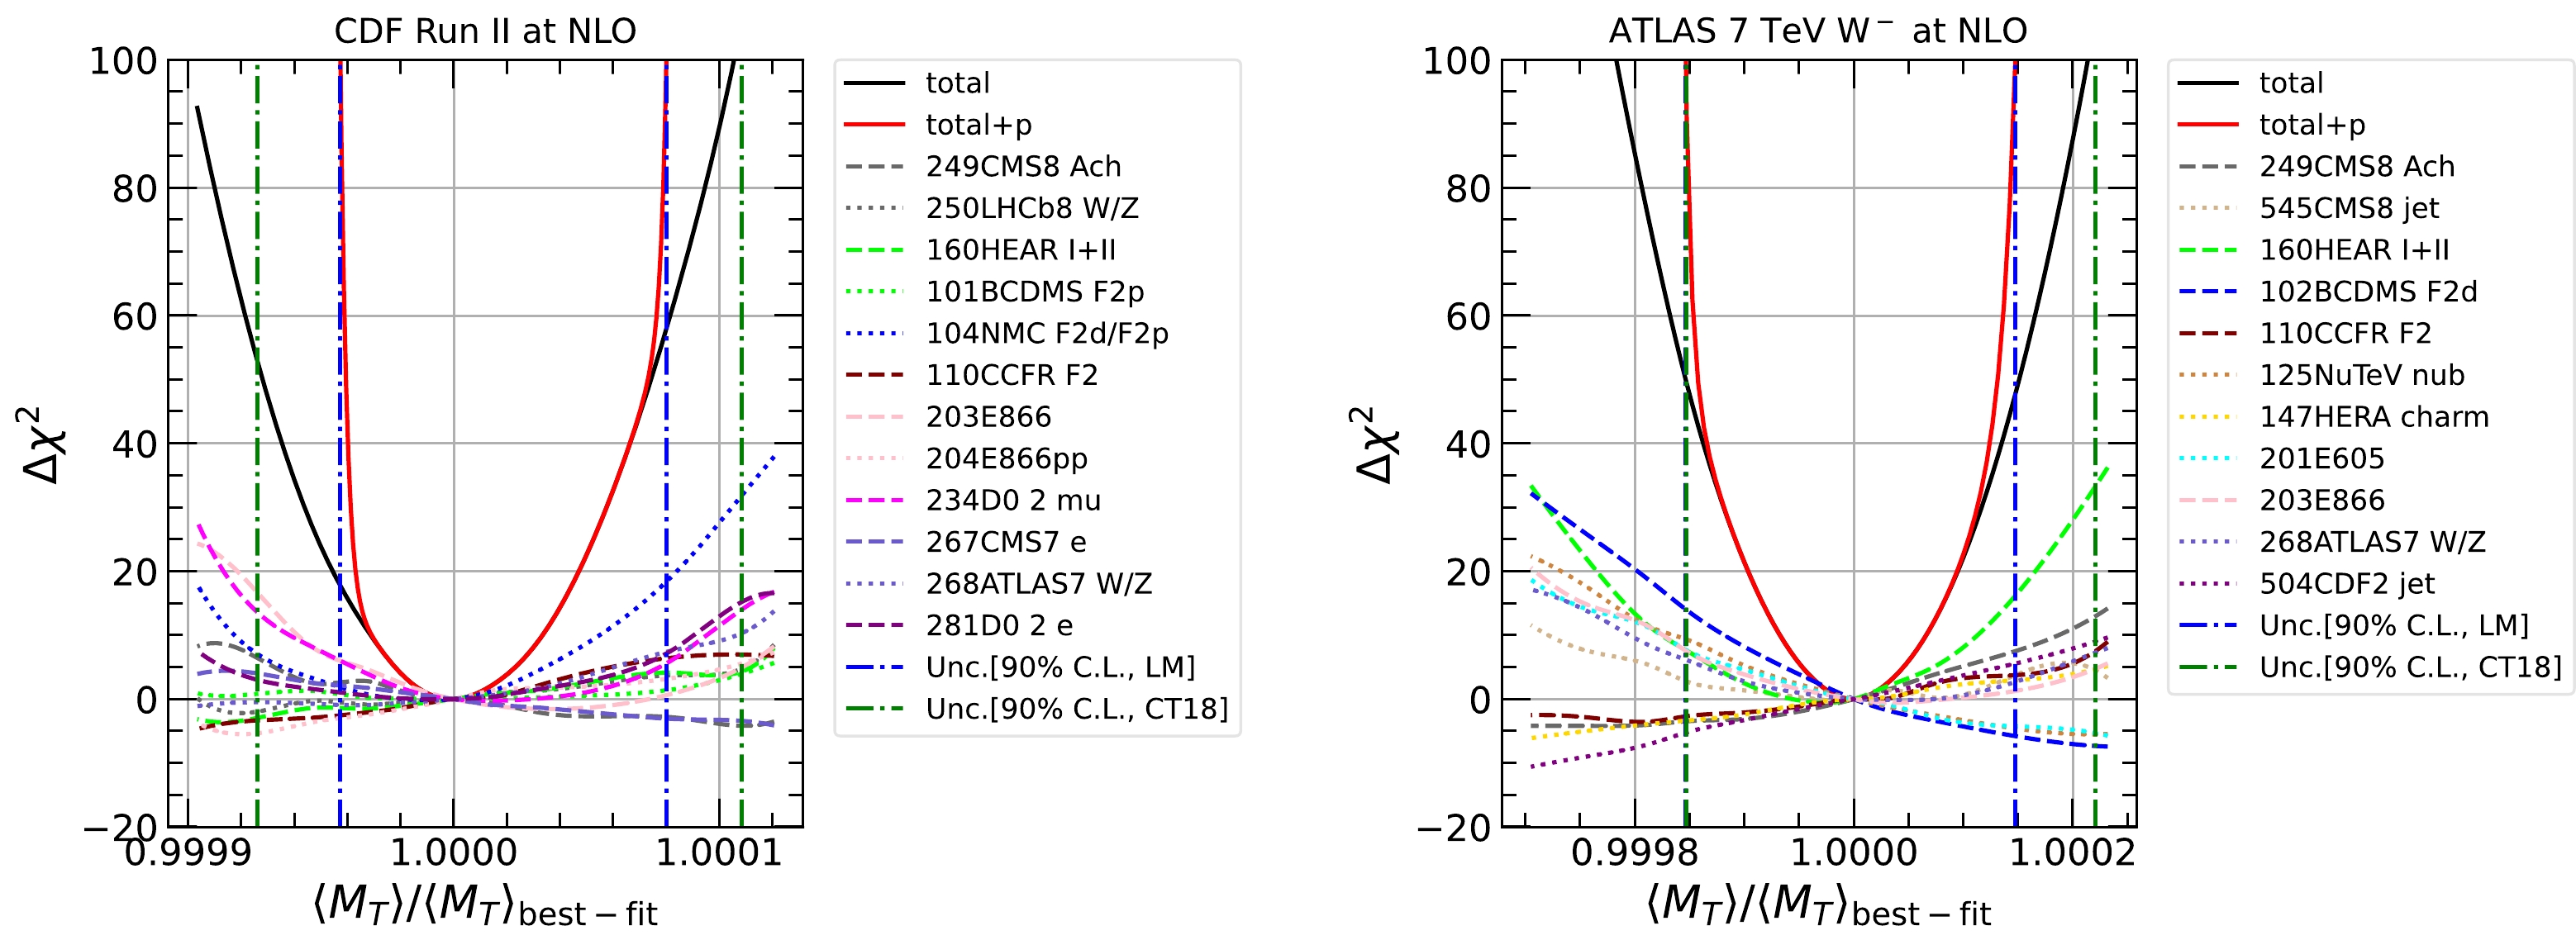
Figure 7. (color online) LM scans on
$ \langle M_T\rangle $ . The black and red solid lines represent$ \Delta\chi^2 $ and$ \Delta\chi^2 + P $ , respectively. The dotted and dashed lines indicate the contributions to$ \Delta\chi^2 $ from individual data sets. The blue and green vertical dot-dashed lines represent the uncertainties at a 90% C.L. determined using the LM method and the Hessian method from the published CT18 NNLO PDFs, respectively.The contribution from an individual experimental data set can also be evaluated using LM scans with data subtracted. We remove one data set at a time and repeat the LM scans on
$ \langle M_T \rangle $ with the remaining data sets. The difference between the fit with and without the data set can be an assessment of its contribution. In Fig. 8, we show the results of LM scans on$ \langle M_T\rangle $ with data subtracted. The results are normalized to the central value determined with full data sets. In the case of the CDF measurement, in the upper panel, we find that after the removal of most of the data set, the$ \langle M_T\rangle $ value and its uncertainty only change slightly, as represented by the error bars, compared to the uncertainty from LM scans with full data sets, represented by the gray band. E866 Drell-Yan ratio data (Exp. ID = 203) along with D0 Run II charge asymmetry data (Exp. ID = 234) and NMC deuteron data (Exp. ID = 104) give strong constraints, which is consistent with the left panel of Fig. 7. In addition, we find that E866 Drell-Yan ratio data prefer a larger$ \langle M_T\rangle $ . In the case of$ W^{\pm} $ production at 7 TeV ATLAS, in the lower panel, the constraints from HERA inclusive DIS data (Exp. ID = 160), E866 Drell-Yan ratio data (Exp. ID = 203), and 8 TeV CMS charge asymmetry data (Exp. ID = 249) predominate, as expected. After the inclusion of HERA inclusive DIS data or E866 Drell-Yan ratio data, the uncertainties of$ \langle M_T\rangle $ are reduced by almost 50%. In addition, E866 Drell-Yan ratio data prefer a larger$ \langle M_T\rangle $ , in contrast with HERA inclusive DIS data and 8 TeV CMS charge asymmetry data, which prefer a smaller value.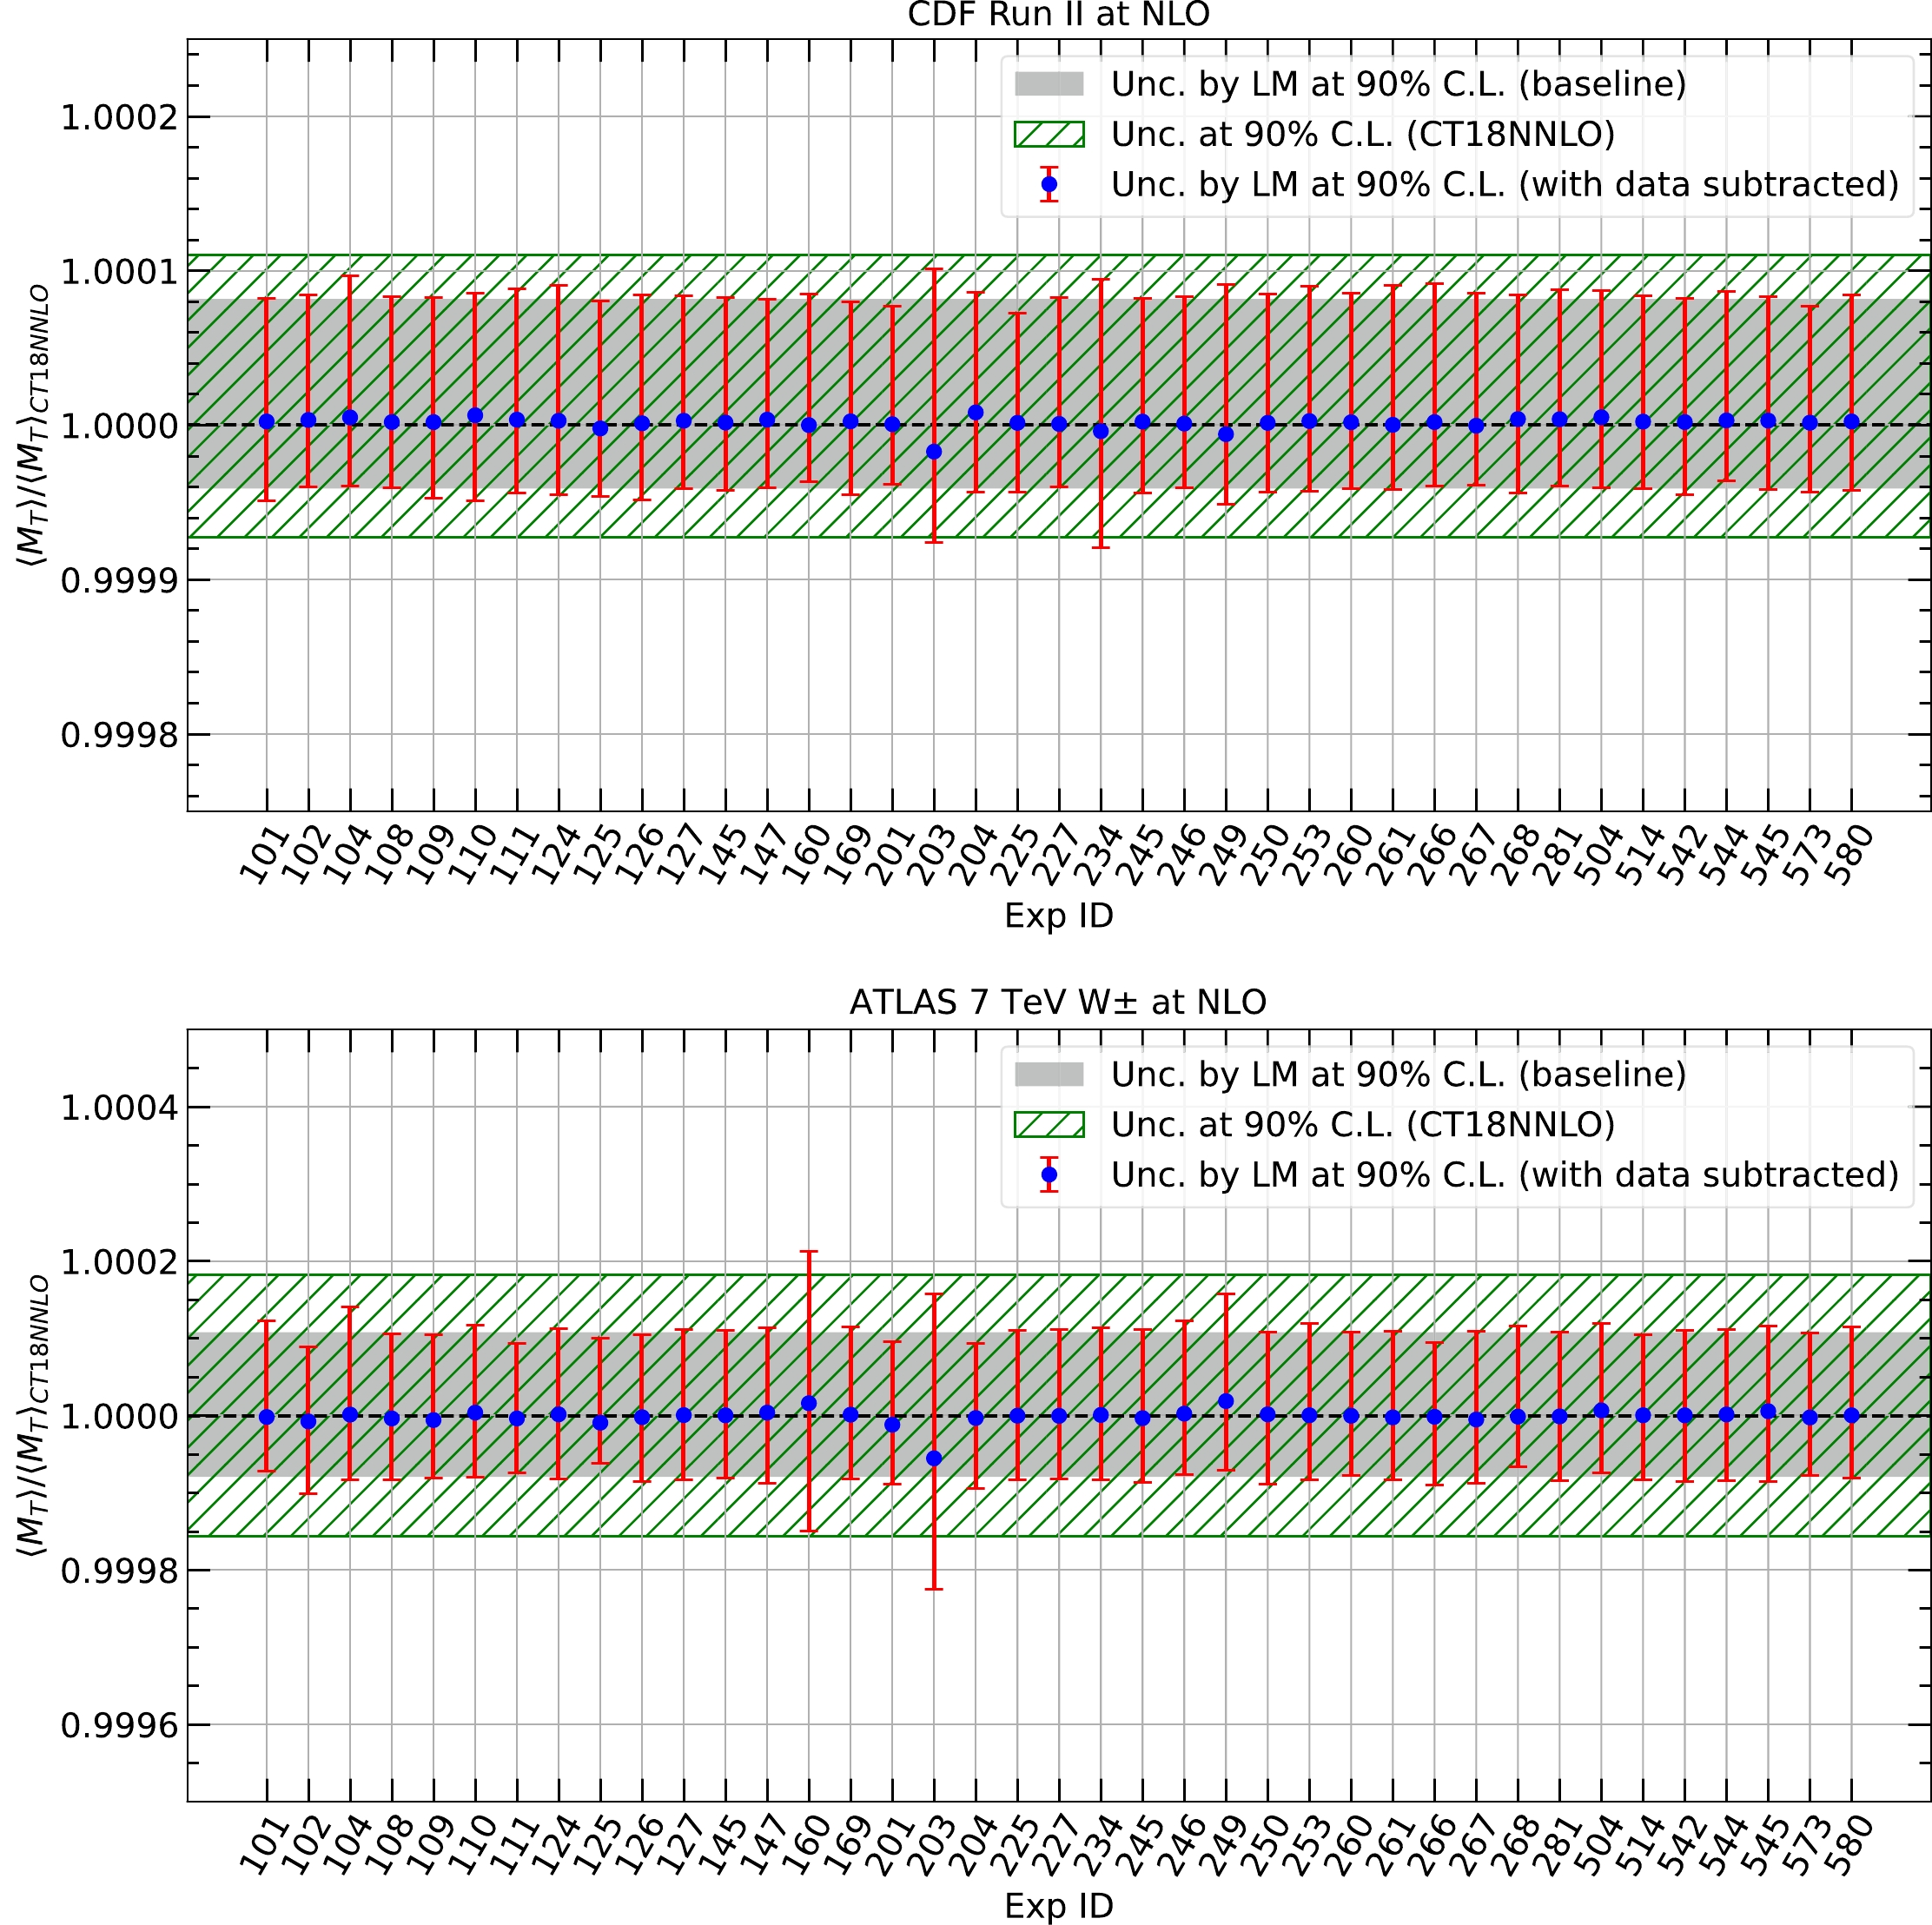
Figure 8. (color online) Results of LM scans on
$ \langle M_T\rangle $ with data subtracted. The results are normalized to the central value determined with full data sets. The horizontal axis represents the experimental data set removed from the LM scans. The blue marks and red error bars indicate the central values and uncertainties at a 90% C.L., respectively, determined using the LM method with the remaining the data sets. The green hatched area and gray band represent the uncertainties at a 90% C.L., which are determined using the Hessian and LM methods with full data sets, respectively. -
In the following, we perform a simple analysis to further understand the dependence of leptonic distributions on the PDFs, focusing on the
$ p_T $ of the charged lepton in the CDF scenario. Note that at LO,$ p_T $ equals half of the transverse mass discussed earlier. We define$ \theta^* $ as the polar angle between the decayed positron and anti-proton directions and$ y^* $ as the rapidity of the positron with respect to the proton direction, both in the rest frame of the$ W^+ $ boson. The following relations on kinematics hold at LO:$ \begin{equation} \cos \theta^*=-\tanh{y^*},\,\,p_T=\frac{m_W}{2}\frac{1}{\cosh{y^*}}. \end{equation} $

(10) For the dominant partonic channel of
$ u\bar d $ annihilation, the LO partonic differential cross section with respect to$ \cos\theta^* $ is proportional to$ (1+\cos\theta^*)^2 $ owing to the$ V-A $ structure of the weak-charged current. This can be translated to$ \begin{equation} \frac{{\rm d}\hat{\sigma}}{{\rm d}y^*}\sim (1-\tanh y^*)^2/\cosh{^2y^*}, \end{equation} $

(11) and a
$ p_T $ weighted distribution,$ \begin{equation} p_T\frac{{\rm d}\hat{\sigma}}{{\rm d}y^*}\sim \frac{m_W}{2} (1-\tanh y^*)^2/\cosh{^3y^*}. \end{equation} $

(12) From the above equations, we can calculate the mean transverse momentum of the positron as
$ \dfrac{15\pi}{128}\, m_W \sim 0.368\, m_W $ . However, in the CDF analysis, the selection cut on the transverse momentum of the charged lepton imposes$ |y^*|\lesssim 0.8 $ . Furthermore, if the W boson is boosted with a rapidity of$ y_b $ , the rapidity selection of the charged lepton also requires$ |y^*+y_b|<1 $ . Thus, the actual mean transverse momentum and acceptance of the charged lepton depend on$ y_b $ in a non-trivial way, as plotted in Fig. 9. We also show the distribution of$ y^* $ in Fig. 9, which peaks at a negative value because the positron is aligned with the$ \bar d $ quark. The inequalities indicate the$ y^* $ region that contributes to the cross sections after selections for a fixed$ y_b $ . The mean transverse momentum peaks at a$ y_b $ value of approximately$ -0.8 $ because this excludes the peak region in$ y^* $ , which has a relatively smaller$ p_T $ . The mean transverse momentum decreases at large$ |y_b| $ values because only high$ |y^*| $ regions remain, which have low$ p_T $ . The acceptance is largest in the central region of$ y_b $ .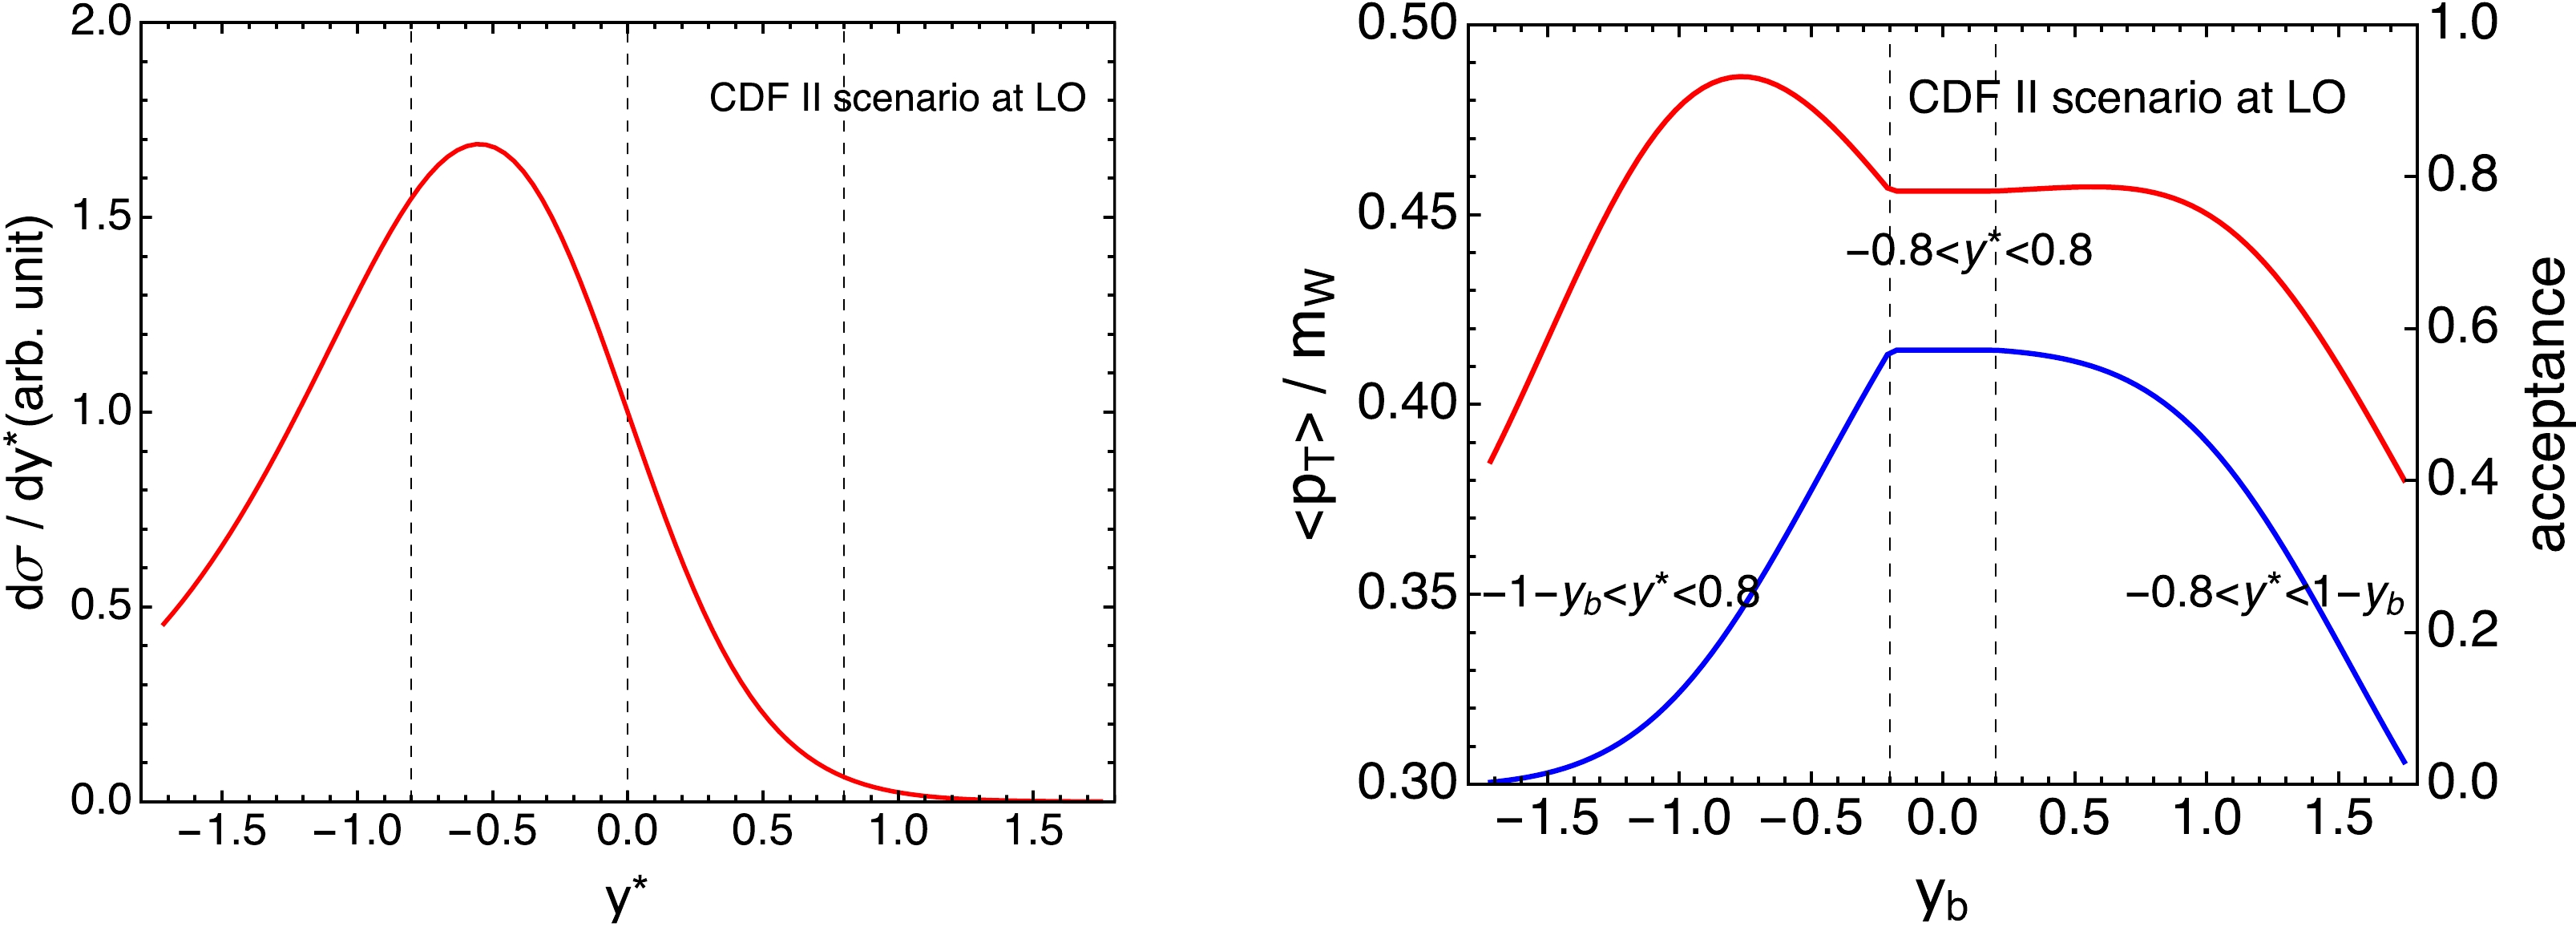
Figure 9. (color online) Left: Rapidity distribution of the positron in the rest frame of the
$ W^+ $ boson in the scenario of the CDF measurement calculated at LO for the$ u\bar d $ partonic channel. Right: Mean transverse momentum (red with the scale on the left) and acceptance (blue with the scale on the right) of the positron after selections as a function of the rapidity of the W boson. The inequalities indicate the$ y^* $ region that contributes to the cross sections after selections for a fixed$ y_b $ .However, the transverse momentum distribution is a superposition of contributions from all possible rapidities of the W boson. The distribution of the latter is exactly determined by PDFs as
$ \begin{equation} \frac{{\rm d}{\sigma}}{{\rm d}y_b}\sim f_{u/p}(x_1, \mu)f_{\bar d/\bar p}(x_2, \mu), \end{equation} $

(13) at LO for the
$ u\bar d $ partonic channel, with$x_{1,2}=m_W/\sqrt s\, e^{\pm y_b}$ . The normalized rapidity distribution of the W boson based on the above equation is shown in Fig. 10 for a variety of PDFs, with the lepton acceptance shown in Fig. 9 applied. By combining Figs. 9 and 10, we can understand several features shown in Sec. IIA. For instance, by comparing the$ y_b $ distributions from the CT18, MSHT20, NNPDF3.1, and NNPDF4.0 NNLO PDFs, the ratios of NNPDF4.0 to others are shown to exhibit a clear positive slope across$ y_b $ . This leads to a reduction in the mean transverse momentum of the positron because it is, on average, smaller for$ y_b>0 $ , and also a reduction in the mean transverse mass of the leptons. The behavior of NNPDF4.0 can be traced back to the suppression of the d-quark PDF in the large-x region, in contrast with its previous generation, which suppresses the rapidity distribution in the anti-boost region. Similarly, the NLO PDFs give a larger mean transverse mass than NNLO PDFs in general, and the ratios of NLO to NNLO PDFs exhibit a negative slope in the middle panel of Fig. 10. However, this situation can change for different PDF groups because CT18 and MMHT14 present more stable predictions when using NLO PDFs than NNLO.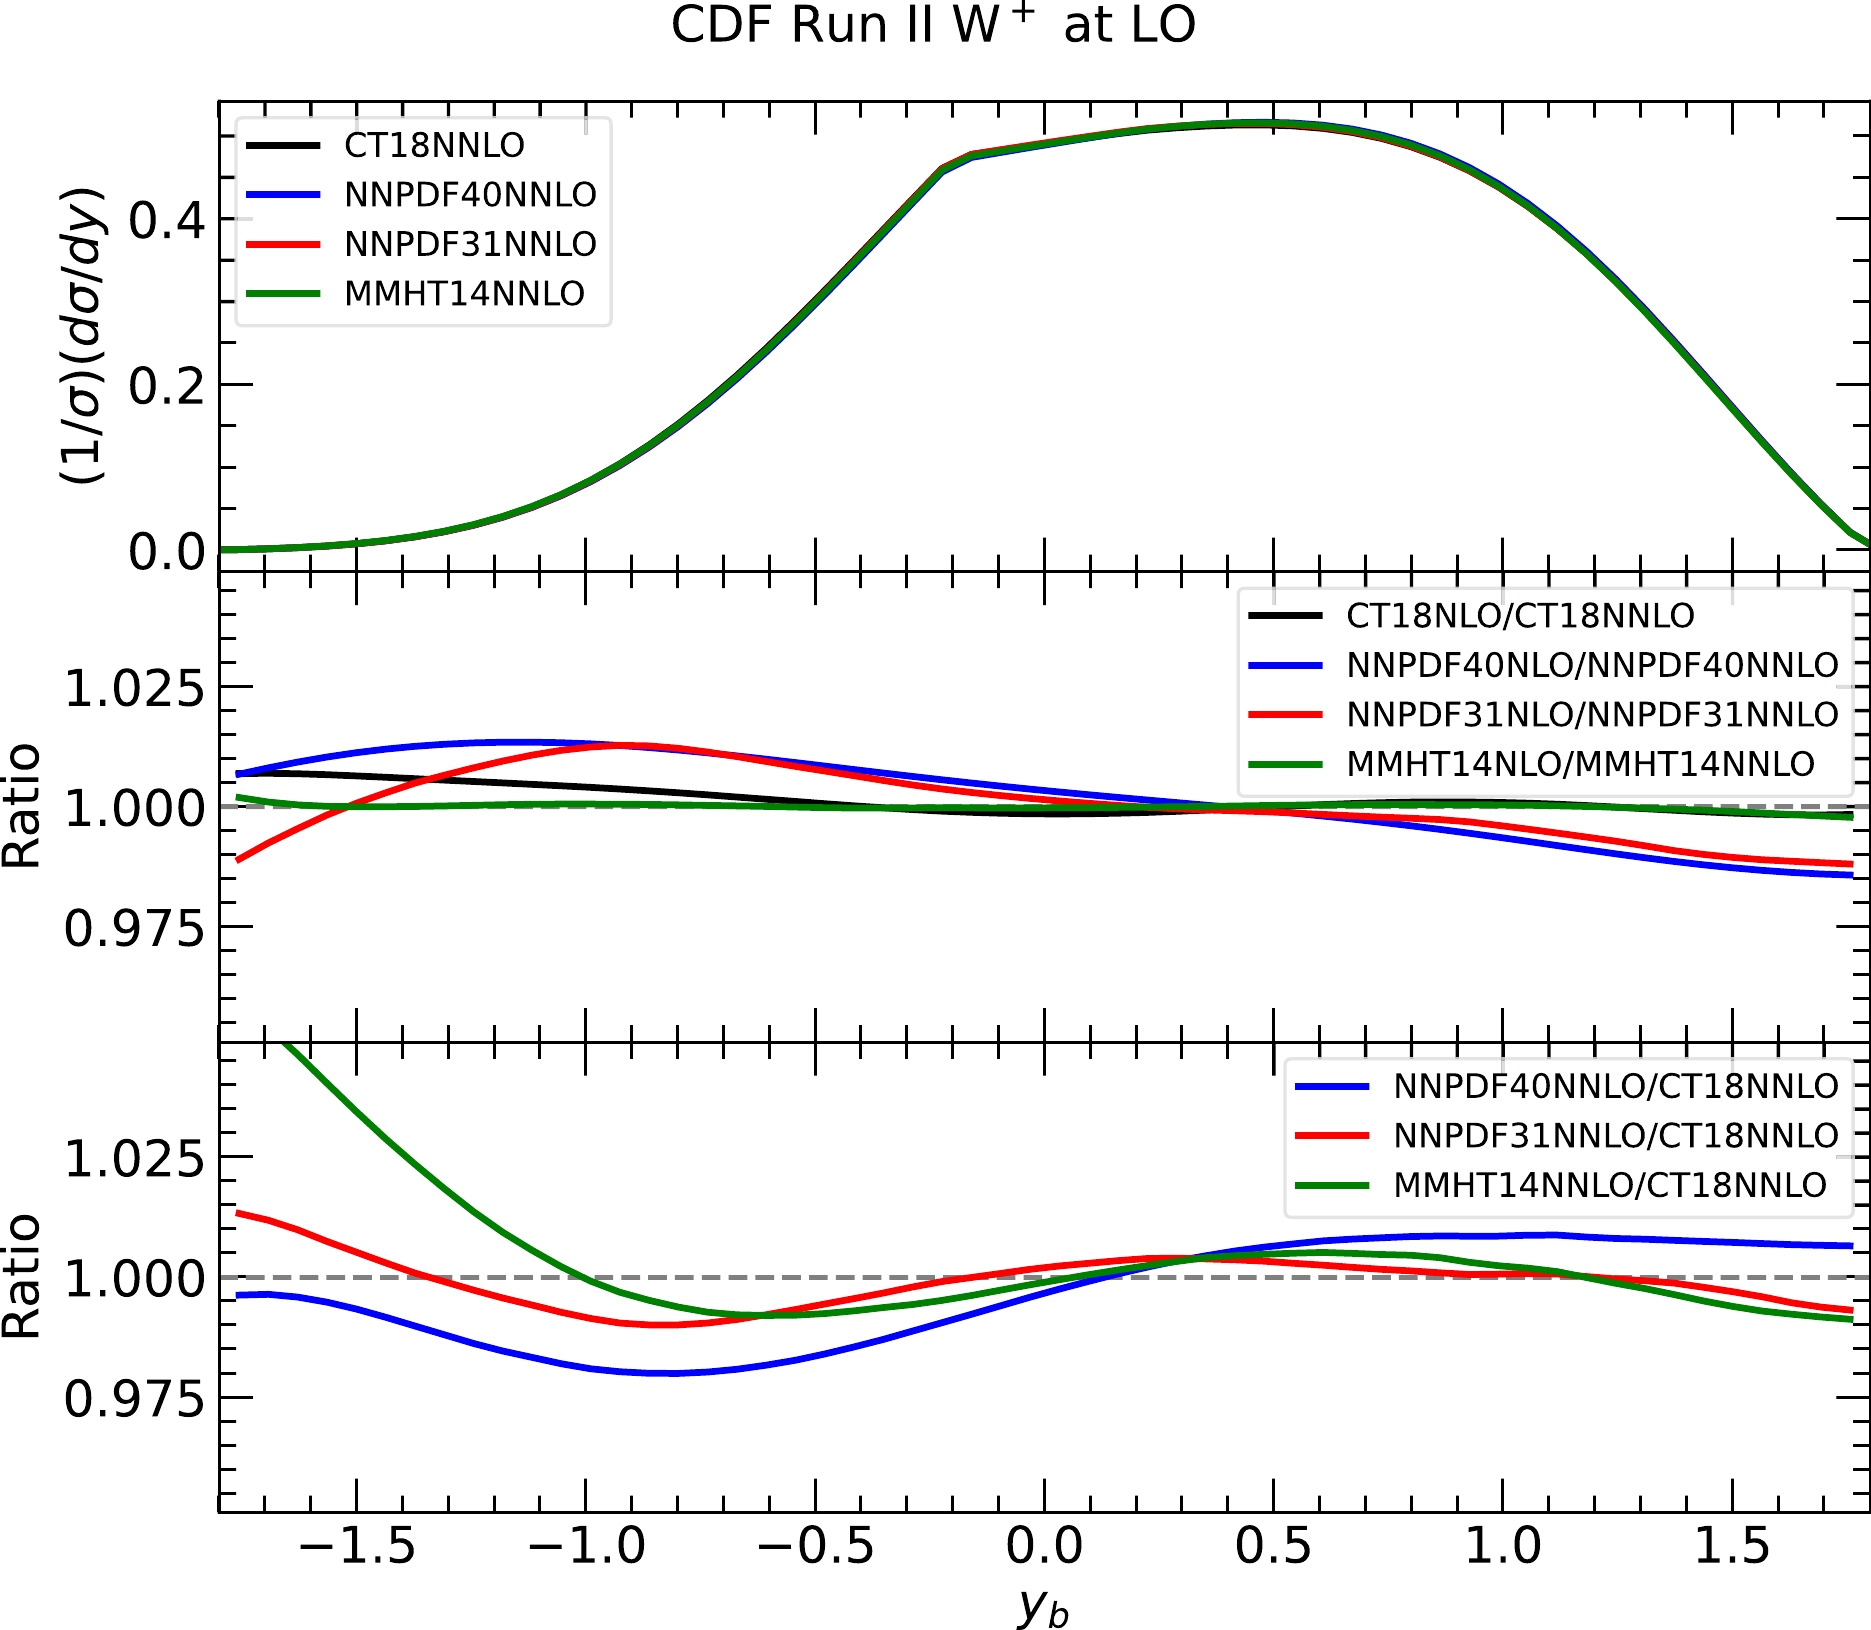
Figure 10. (color online) Rapidity distribution of the
$ W^+ $ boson at Tevatron Run II, calculated at LO and with lepton acceptance applied for the$ u\bar d $ annihilation channel using a variety of NLO and NNLO PDFs. -
In summary, we study the dependence of the transverse mass distribution of charged leptons and the missing energy on PDFs, focusing on W boson mass measurements by the CDF and ATLAS collaborations. We compare the shape of the prediction distributions using various up-to-date PDFs. In particular, we compare the mean transverse mass adapted to each of the measurements. We find that the spread of predictions from different PDF sets can be significantly larger than the PDF uncertainty predicted by a specific PDF set. The mean transverse mass is strongly anti-correlated with the extracted W boson mass, as validated by the
$ \chi^2 $ fit and via a comparison with the experimental numbers of mass shift on PDF dependence. Thus, the analysis of experimental data using up-to-date PDFs could be highly desirable, especially considering tensions between different W boson mass measurements. We also examine theoretical uncertainties induced by factorization and renormalization scales, the strong coupling constant, and the W-boson decay width in the CDF context and find that the width dependence can be comparable if varied by an experimental error. Furthermore, we perform a series of LM scans to identify the constraints on the transverse mass distribution imposed by individual data sets in the CT18 global analysis of PDFs. In the case of the CDF measurement, the distribution is mostly sensitive to d-quark PDFs in the intermediate x region, which are largely constrained by DIS and Drell-Yan data on deuteron targets as well as Tevatron lepton charge asymmetry data. For the ATLAS measurement, the strongest constraints arise from HERA inclusive DIS data, E866 Drell-Yan ratio data, and CMS lepton charge asymmetry data. -
We would like to thank Pavel Nadolsky, C.-P. Yuan, and other CTEQ-TEA collaborators for helpful discussions and comments. JG would like to thank Hong-Jian He for useful discussions. KX thanks PITT PACC colleagues for many stimulating discussions, particularly Tao Han for bringing up the W decay width effect.
Understanding PDF uncertainty in W boson mass measurements
- Received Date: 2022-05-16
- Available Online: 2022-12-15
Abstract: We study the dependence of the transverse mass distribution of charged leptons and the missing energy on parton distributions (PDFs) adapted to W boson mass measurements at the CDF and ATLAS experiments. We compare the shape variations of the distribution induced by different PDFs and find that the spread of predictions from different PDF sets can be significantly larger than the PDF uncertainty predicted by a specific PDF set. We suggest analyzing the experimental data using up-to-date PDFs to gain a better understanding of the PDF uncertainties in W boson mass measurements. We also perform a series of Lagrange multiplier scans to identify the constraints on the transverse mass distribution imposed by individual data sets in the CT18 global analysis. In the case of the CDF measurement, the distribution is mostly sensitive to d-quark PDFs in the intermediate x region, which are largely constrained by DIS and Drell-Yan data on deuteron targets and Tevatron lepton charge asymmetry data.


 DownLoad: