


 Abstract
 HTML
HTML Reference
 Related
 PDF
PDF


-
Since the discovery of quark-gluon plasma (QGP) at the Relativistic Heavy-Ion Collider (RHIC) and Large Hadron Collider (LHC), the determination of the QCD phase diagram at high quark chemical potential, especially the search for the location of the critical end point (CEP), has been the focus of experiments such as the BES-II program at RHIC and CBM experiment at FAIR. Theoretically, owing to the "sign problem" encountered by the lattice QCD, various effective models are used to study the QCD phase diagram, such as chiral perturbation theory [1], finite energy sum rules [2], Dyson-Schwinger Equations (DSEs) [3–5], Nambu-Jona-Lasinio (NJL) model, and Polyakov-Nambu-Jona-Lasinio (PNJL) model [6–10].
It is worth noting that Boltzmann-Gibbs (BG) statistics are often used in the study of the QCD phase diagram. However, in relativistic heavy ion collisions, this is not satisfactory. The collision system is small enough and evolves so rapidly that global equilibrium is difficult to establish. As a result, the probability distribution is no longer the standard e-exponential distribution in BG statistics but becomes the so-called power-law tailed distribution (i.e., the Tsallis distribution introduced next), which is supported by an increasing number of relativistic heavy ion collision experiments [11–17].
The most notable difference between Tsallis statistics and BG statistics is that the former replaces the probability distribution as follows [18–20]:
$ \begin{eqnarray} \rho_{\rm BG}(x)=C\,\mathrm{exp}(x)\longrightarrow \rho_{q}(x)=C_{q}\,\mathrm{exp}_{q}(x), \end{eqnarray} $

(1) where
$ \begin{eqnarray} \mathrm{exp}_{q}(x)=[1+(1-q)x]^{\frac{1}{1-q}}, \end{eqnarray} $

(2) and the inverse function is
$ \begin{eqnarray} \mathrm{ln}_{q}(x)=\frac{x^{1-q}-1}{1-q}. \end{eqnarray} $

(3) As
$ q\rightarrow1 $ , BG statistics is recovered.In fact, the Tsallis distribution appears not only in relativistic heavy ion collision systems, but also in complex systems with non-ergodicity, multifractality, long-range correlations, long-term memory, etc [21–23]. Ref. [21] shows in a clear manner that owing to a break in ergodicity, the system has crossed from BG statistics to Tsallis statistics. Furthermore, Ref. [24] shows that the renormalizable field theories lead to fractal structures, which can be studied by using Tsallis statistics. Therefore, in this study, we used Tsallis statistics to study the QCD phase diagram. The paper is organized as follows. In Sec. II, we generalize the PNJL model to its nonextensive version. In Sec. III, we focus on the impact of nonextensive effects on the QCD phase diagram, especially on the location of CEP. In addition, we study the moments of the net-baryon number distribution and compare them with the latest experimental data. Finally, we briefly summarize our work in Sec. IV.
-
The Lagrangian of the two-flavor and three-color PNJL model for equal-mass quark is [25, 26]
$ \begin{aligned}[b] \mathcal{L}_{\rm PNJL} =& \bar{\Psi}({\rm i} \gamma_{\mu}D^{\mu}-m)\Psi +G\,[(\bar{\Psi}\Psi)^2+(\bar{\Psi}{\rm i} \gamma_5\mathit{\boldsymbol{\tau}}\Psi)^2]\\ &-\mathcal{U}(\Phi,\bar{\Phi};T), \end{aligned} $

(4) where m is the current quark mass, Ψ denotes the quark field, and G is the four-fermion interaction coupling constant.
The effective Polyakov-loop potential
$ \mathcal{U}(\Phi,\bar{\Phi};T) $ that accounts for gauge field self-interaction is a function of the Polyakov-Loop Φ and its Hermitian conjugate$ \bar{\Phi} $ $ \begin{eqnarray} \Phi=\frac{\langle Tr_{c}L \rangle}{N_{c}}, \ \ \bar{\Phi}=\frac{\langle Tr_{c}L^{\dagger} \rangle}{N_{c}}, \end{eqnarray} $

(5) where the Polyakov line is
$ \begin{eqnarray} L(\vec{x})=\mathcal{P}\exp\bigg({\rm i} \int_{0}^{\beta}A_{4}(\vec{x},\tau){\rm d}\tau\bigg). \end{eqnarray} $

(6) Following Refs. [27–30], we apply the approximation
$ L^{\dagger}=L $ and have$ \Phi=\bar{\Phi} $ .The form of the Polyakov effective potential
$ \mathcal{U} $ is provided by [31],$ \begin{eqnarray} \frac{\mathcal{U_{L}}}{T^{4}}=-\frac{a(T)}{2}\Phi^{2}+b(T)\mathrm{ln}[1-6\Phi^{2}-3\Phi^{4}+8\Phi^{3}], \end{eqnarray} $

(7) where
$ \begin{eqnarray} a(T)=a_{0}+a_{1}\left(\frac{T_{0}}{T}\right)+a_{2}\left(\frac{T_{0}}{T}\right)^{2}, \end{eqnarray} $

(8) $ \begin{eqnarray} b(T)=b_{3}\left(\frac{T_{0}}{T}\right)^{3}. \end{eqnarray} $

(9) The parameters used to reproduce the pure gluonic lattice data are listed in Table 1. Following Ref. [32], we adjusted
$ T_{0}=190\ \mathrm{MeV} $ to take into account the dynamical quarks.$a_0$ 

$a_1$ 

$a_2$ 

$b_3$ 

$T_{0}/\mathrm{MeV}$ 

3.51 −2.47 15.2 −1.75 190 Table 1. Parameter set used in this study.
The coupling constant G, as pointed out in Refs. [32, 33], should depend on Φ. Here, we take the form reported in Ref. [32],
$ \begin{eqnarray} G=g[1-\alpha_{1}\Phi^{2}-2\alpha_{2}\Phi^{3}]. \end{eqnarray} $

(10) The PNJL model with the parameters listed in Tables 1 and 2 is in good agreement with lattice QCD data [32].
$\Lambda/\mathrm{MeV}$ 

$g/\mathrm{MeV^{-2} }$ 

$m/\mathrm{MeV}$ 

$\alpha_{1}$ 

$\alpha_{2}$ 

631.5 $5.498\times10^{-6}$ 

5.5 0.2 0.2 Table 2. Parameter set used in this study.
The thermodynamic potential density function Ω is defined as
$ \begin{aligned}[b] \Omega=&-\frac{T}{V}\mathrm{ln}Z\\ =&-\frac{T}{V}\mathrm{ln}\mathbf{Tr}\ \mathrm{exp}\left(-\frac{1}{T}\int {\rm d}^{3}x(\mathcal{H}-\mu\psi^{\dagger}\psi)\right). \end{aligned} $

(11) Using the finite temperature field theory and mean field approximation, Ω can be derived as
$ \begin{aligned}[b] \Omega(\mu,T,M,\Phi)=&\mathcal{U}(\Phi;T)+\frac{(M-m)^{2}}{4G}\\ &-2N_{c}N_{f}\int_{0}^{\Lambda}\frac{{\rm d}^3\vec{p}}{(2\pi)^3}E_{p}\\ &-2N_{f}T\int_{0}^{\infty}\frac{{\rm d}^3\vec{p}}{(2\pi)^3}(\mathrm{ln}F^++\mathrm{ln}F^-), \end{aligned} $

(12) where M is the dynamical quark mass,
$ \begin{eqnarray} M=m-2G(\Phi)\sigma, \end{eqnarray} $

(13) $ \sigma=\langle\bar{\Psi}\Psi\rangle $ is the quark chiral condensate. Moreover, we have that$ \begin{aligned}[b] F^{\pm}=&1+3\Phi({\rm e} ^{-(E_{p}\mp\mu)/T}+{\rm e}^{-2(E_{p}\mp\mu)/T})\\ &+{\rm e}^{-3(E_{p}\mp\mu)/T}, \end{aligned} $

(14) where
$ E_{p}=\sqrt{p^{2}+M^{2}} $ is the single quasi-particle energy. The finite temperature contribution term is finite, so here we only impose the cut-off Λ on the vacuum term [25, 26, 34, 35].Numerical solutions of physical quantities M and Φ with respect to μ and T can be obtained by minimizing the thermodynamic potential,
$ \begin{eqnarray} \frac{\partial\Omega}{\partial M}=\frac{\partial\Omega}{\partial\Phi}=0. \end{eqnarray} $

(15) The quantitative study of the QCD phase transition is based on thermal susceptibility,
$ \begin{eqnarray} \chi_{T}=\frac{\partial\sigma}{\partial T}. \end{eqnarray} $

(16) -
The nonextensive version of the thermodynamic potential density function
$ \Omega_{q} $ is defined as [20, 36]$ \begin{aligned}[b] \Omega_{q}=&-\frac{T}{V}\mathrm{ln_{q}}Z_{q}\\ =&-\frac{T}{V}\mathrm{ln_{q}}\mathbf{Tr}\ \mathrm{exp}_{q}\left(-\frac{1}{T}\int {\rm d}^{3}x(\mathcal{H}-\mu\psi^{\dagger}\psi)\right). \end{aligned} $

(17) Combining q-algebra and following the same derivation steps as in Eq. (12), the thermodynamic potential density function
$ \Omega_{q} $ can be derived as$ \begin{aligned}[b] \Omega_{q}(\mu,T,M,\Phi)=&\mathcal{U}(\Phi;T)+\frac{(M-m)^{2}}{4G}\\ &-2N_{c}N_{f}\int_{0}^{\Lambda}\frac{{\rm d}^3\vec{p}}{(2\pi)^3}E_{p}\\ &-2N_{f}T\int_{0}^{\infty}\frac{{\rm d}^3\vec{p}}{(2\pi)^3}(\mathrm{ln}_{q}F_{q}^++\mathrm{ln}_{q}F_{q}^-), \end{aligned} $

(18) where
$ \begin{aligned}[b] F_{q}^{\pm}=&1+3\Phi(e_{q}(-(E_{p}\mp\mu)/T)+e_{q}(-2(E_{p}\mp\mu)/T))\\ &+e_{q}(-3(E_{p}\mp\mu)/T). \end{aligned} $

(19) It should be noted that, as a simplification, the form of the Polyakov-loop potential remains unchanged. That is to say, it is only indirectly affected by the nonextensive effects through saddle point equations. Besides, the parameters of the PNJL model are as usual. Here, we treat q as a thermodynamic variable on the same footing as T and μ. That is to say, based on the ansatz, the parameters determined at
$ T=0 $ ,$ \mu=0 $ , and$ q=1 $ can be used to study the whole region. The same simplifications also appear in Ref. [20].It is worth noting that to ensure that
$ e_{q}(x) $ is always a non-negative real function, the following condition must be satisfied:$ \begin{eqnarray} 1+(1-q)x>0. \end{eqnarray} $

(20) During the calculations, we found that the q value cannot be too large, otherwise the CEP position we care about will fall into the non-physical region. Therefore, in this study, we mainly focused on
$ 1 \leq q \leq 1.2 $ . This is also the typical region of q values found by high-energy collisions [37–40]. In addition, there are no nonextensive effects at low temperature. Note that as T tends to zero,$ \Omega_{q} $ tends to Ω as long as$ q>1 $ .According to Eq. (15), the numerical results for M and Φ can be obtained by solving the following nonlinear coupling equations:
$ M=m+4GN_{c}N_{f}\int\frac{{\rm d}^3\vec{p}}{(2\pi)^3}\frac{M}{E_{p}}[1-n_{q}-\bar{n}_{q}], $ 
(21) $ \begin{aligned}[b] 0=&\frac{\partial\mathcal{U}}{\partial\Phi}-\frac{(M-m)^{2}}{4G^{2}}\frac{\partial G}{\partial\Phi}-2N_{c}N_{f}T\int_{0}^{\infty}\frac{{\rm d}^3\vec{p}}{(2\pi)^3}\left\{\frac{e_{q}(-(E_{p}-\mu)/T)+e_{q}(-2(E_{p}-\mu)/T)}{[1+3\Phi(e_{q}(-(E_{p}-\mu)/T)+e_{q}(-2(E_{p}-\mu)/T))+e_{q}(-3(E_{p}-\mu)/T)]^{q}}\right.\\ &\left.+\frac{e_{q}(-(E_{p}+\mu)/T)+e_{q}(-2(E_{p}+\mu)/T)}{[1+3\Phi(e_{q}(-(E_{p}+\mu)/T)+e_{q}(-2(E_{p}+\mu)/T))+e_{q}(-3(E_{p}+\mu)/T)]^{q}}\right\}, \end{aligned} $

(22) where the q-version of the Fermi-Dirac distribution is
$ \begin{eqnarray} n_{q}(T,\mu)=\frac{e_{q}^{q}(-3(E_{p}-\mu)/T)+\Phi(e_{q}^{q}(-(E_{p}-\mu)/T)+2e_{q}^{q}(-2(E_{p}-\mu)/T))}{[1+3\Phi(e_{q}(-(E_{p}-\mu)/T)+e_{q}(-2(E_{p}-\mu)/T))+e_{q}(-3(E_{p}-\mu)/T)]^{q}}, \end{eqnarray} $

(23) and
$ \begin{eqnarray} \bar{n}_{q}(T,\mu)=\frac{e_{q}^{q}(-3(E_{p}+\mu)/T)+\Phi(e_{q}^{q}(-(E_{p}+\mu)/T)+2e_{q}^{q}(-2(E_{p}+\mu)/T))}{[1+3\Phi(e_{q}(-(E_{p}+\mu)/T)+e_{q}(-2(E_{p}+\mu)/T))+e_{q}(-3(E_{p}+\mu)/T)]^{q}}. \end{eqnarray} $

(24) As expected, for
$ q\rightarrow1 $ , the standard distribution function of the usual PNJL model is recovered. -
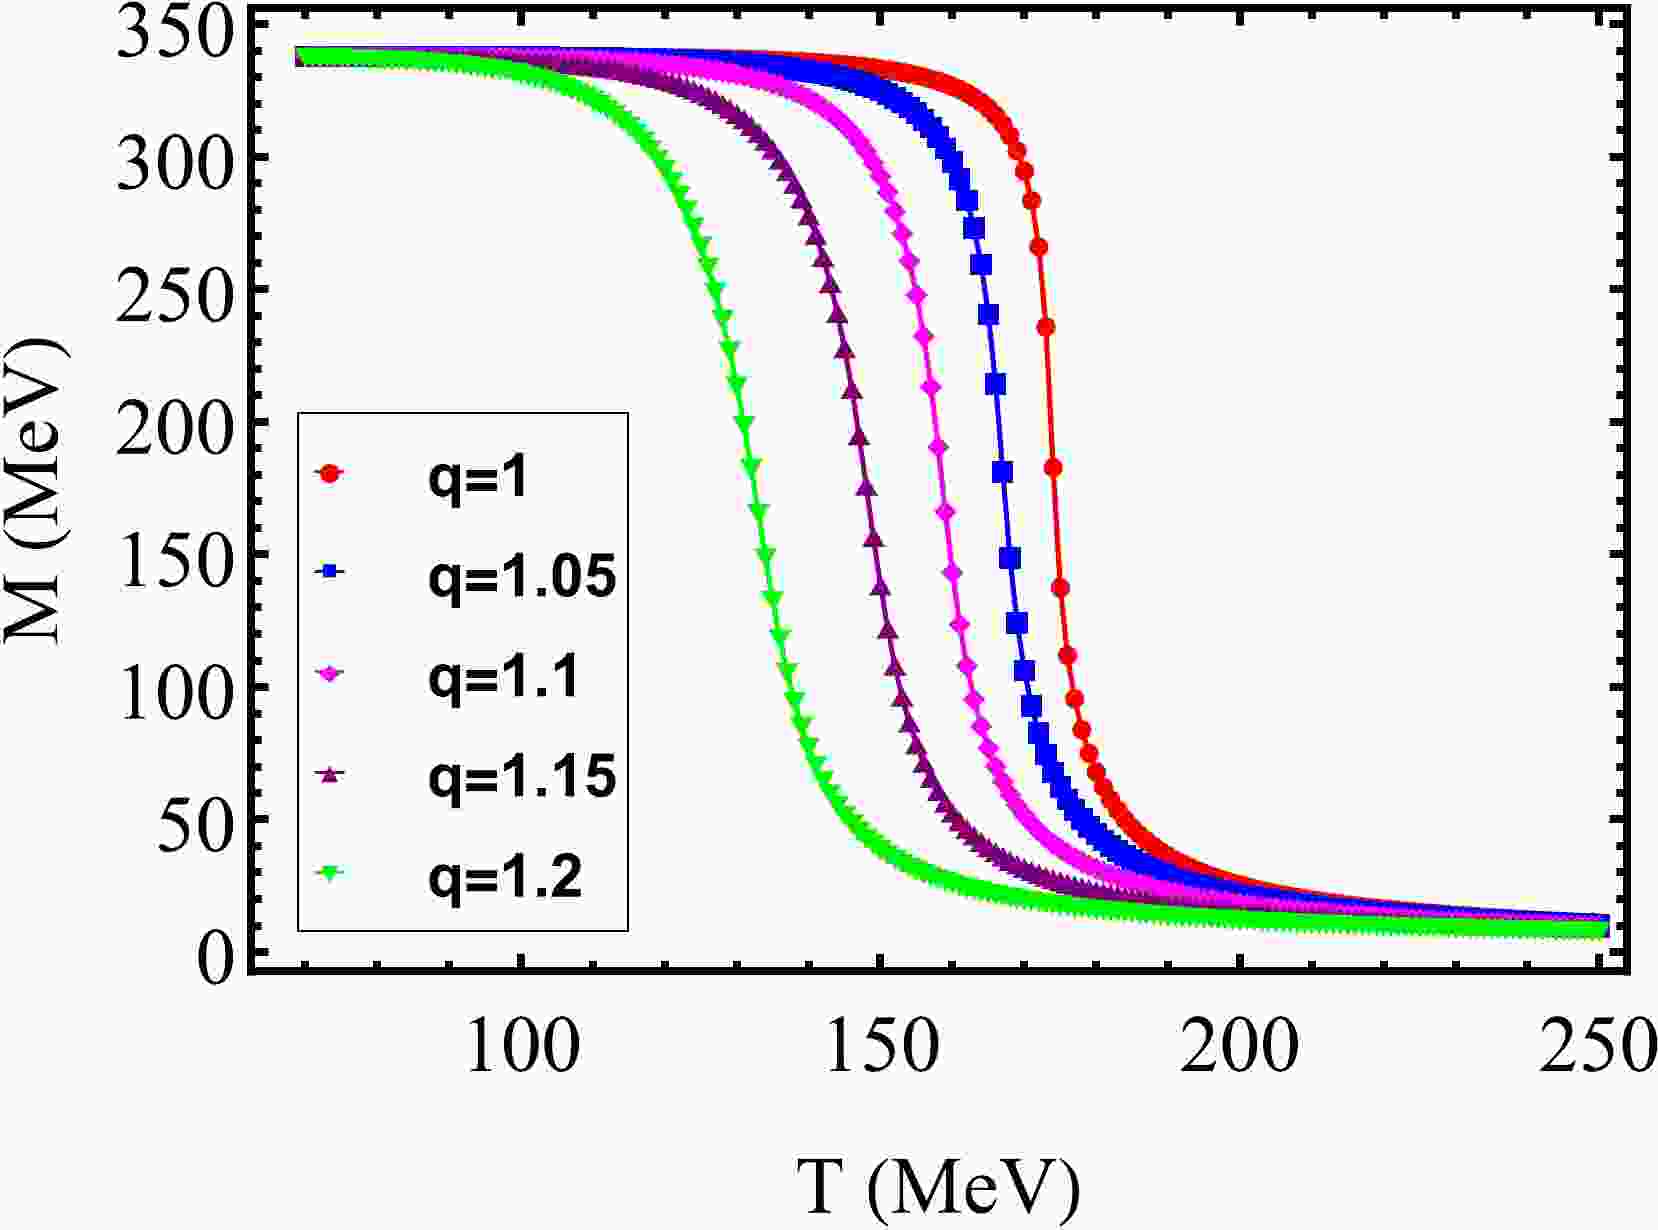
Variations of M and Φ with temperature for different parameters q are shown in Figs. 1 and 2. We found that the pseudo-critical temperature decreases with increasing q; the same conclusion was reported in Ref. [20]. Besides, even if the nonextensive effects are taken into account, the pseudo-critical temperature of the chiral and deconfinement crossover transition is still the same. For example, at
$ q=1 $ and$ q=1.15 $ , the pseudo-critical temperature is$ 173\ \mathrm{MeV} $ and$ 148\ \mathrm{MeV} $ , respectively.
Figure 1. (color online) Constituent quark mass M as a function of T at
$ \mu=0 $ for five values of parameter q.
Figure 2. (color online) Polyakov-loop expectation value Φ as a function of T at
$ \mu=0 $ for five values of parameter q.When considering the finite chemical potential, for
$ q=1 $ , the variation of the constituent quark mass M with temperature is shown in Fig. 3. It can be clearly seen that the first-order phase transition and crossover transition occur at chemical potentials$ \mu=190\ \mathrm{MeV} $ and$ \mu= $ 150 MeV, respectively. The determination of the CEP position is based on the peak of thermal susceptibility$ \chi_{T} $ , given that at the CEP position,$ \chi_{T} $ is divergent. According to Fig. 4, we determined the location of CEP to be$ (\mu_{c},T_{c})= $ (171 MeV, 159.5 MeV).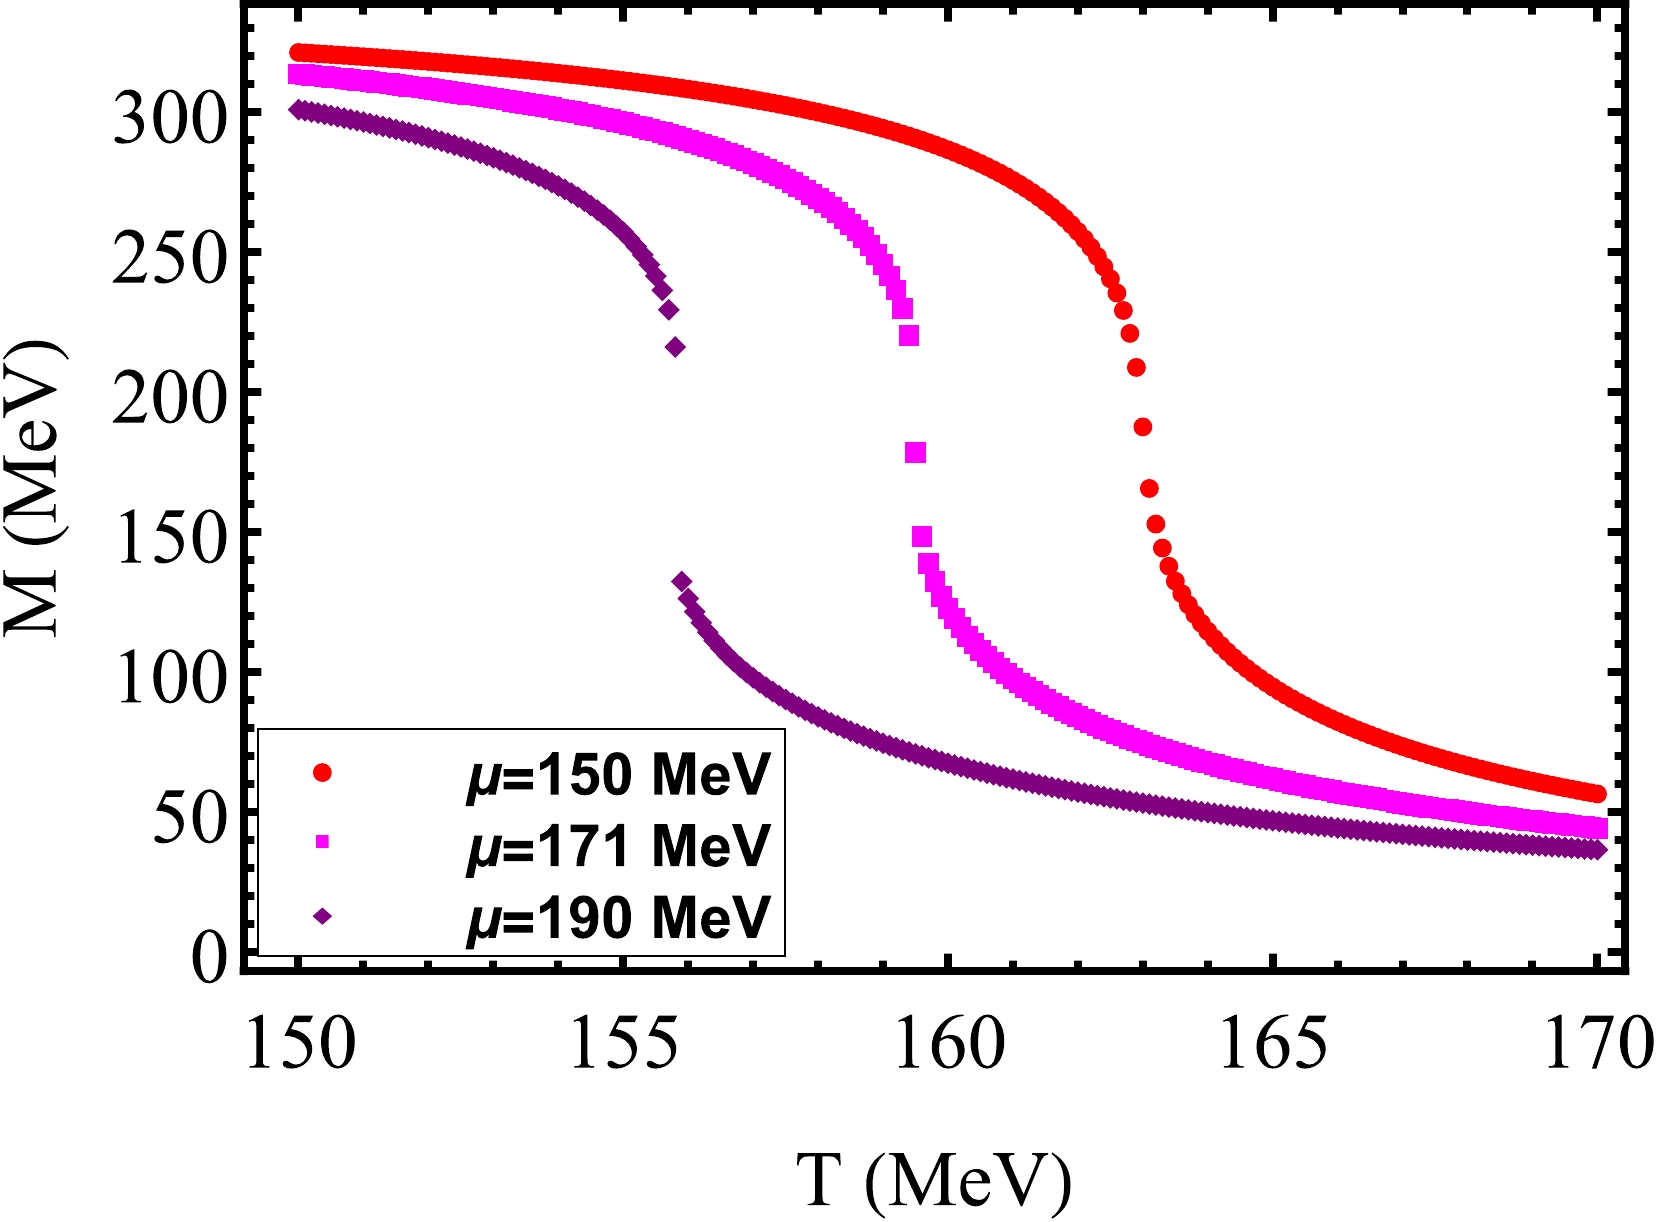
Figure 3. (color online) Constituent quark mass M as a function of T at
$ q=1 $ for three different quark chemical potentials.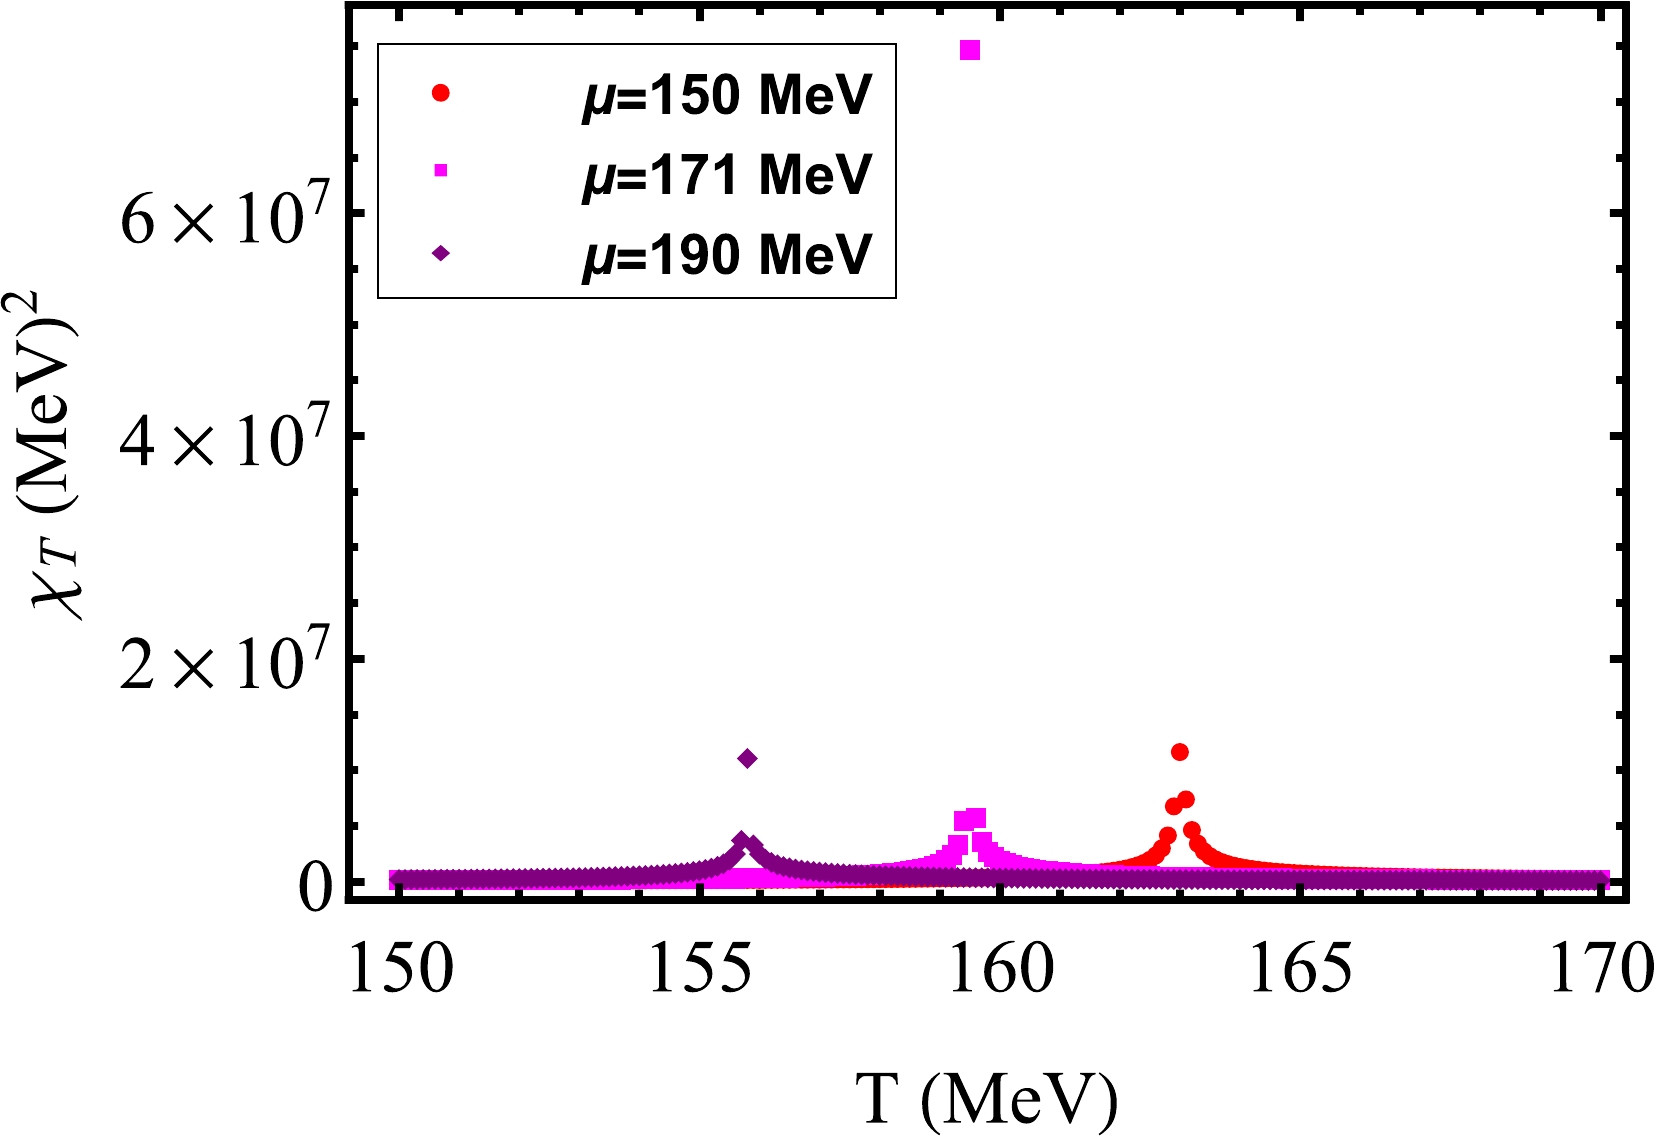
Figure 4. (color online) Susceptibility
$ \chi_{T} $ as a function of T at$ q=1 $ for three different quark chemical potentials.The impact of the nonextensive effects on the location of CEP, which we are most concerned about, is shown in Fig. 5. We found that the nonextensive effects have a significant impact on the CEP position. For
$1\leq q\leq 1.08$ , with the increase of q, the CEP position moves rapidly on an approximate straight line to the direction of lower temperature and larger chemical potential. However, for$ 1.08\leq q\leq1.2 $ , we found that the CEP position has an evident non-monotonic dependence on q. Although$ T_{c} $ keeps decreasing with the increase of q,$ \mu_{c} $ first increases and then decreases. The critical value$ q_{c} $ is 1.15. The numerical results are shown in Table 3. This non-monotonic behavior was also reported in a previous article of ours [41]. However, compared with Ref. [41], there is a significant quantitative difference. This is because for$ q=1 $ , the coupling constant$ G(\Phi) $ doubles the value of$ T_{c} $ , and the nonextensive effects become more pronounced only for sufficiently high temperatures. In addition, another difference is that in Ref. [41], as q increases,$ T_{c} $ also moves in the opposite direction, and the corresponding critical value q is 1.1. The reappearance of this non-monotonic behavior deserves our attention, and it may be model-independent. The reason why Refs. [19, 20] did not find this phenomenon is most likely because they only set q to 1.1. Our results are meaningful for the search of the CEP position in relativistic heavy-ion collisions, where strong fluctuations and long-range correlation lead the system into out-of-equilibrium states, and BG statistics fails. For a wide class of such systems, it has been shown in recent years that the correct approach is to alternatively use Tsallis statistics [21, 22]. We found that in the search for CEP, the nonextensive effects cannot be ignored. Moreover, the search for CEP in larger or smaller quark chemical potential regions depends on$ q_{c} $ .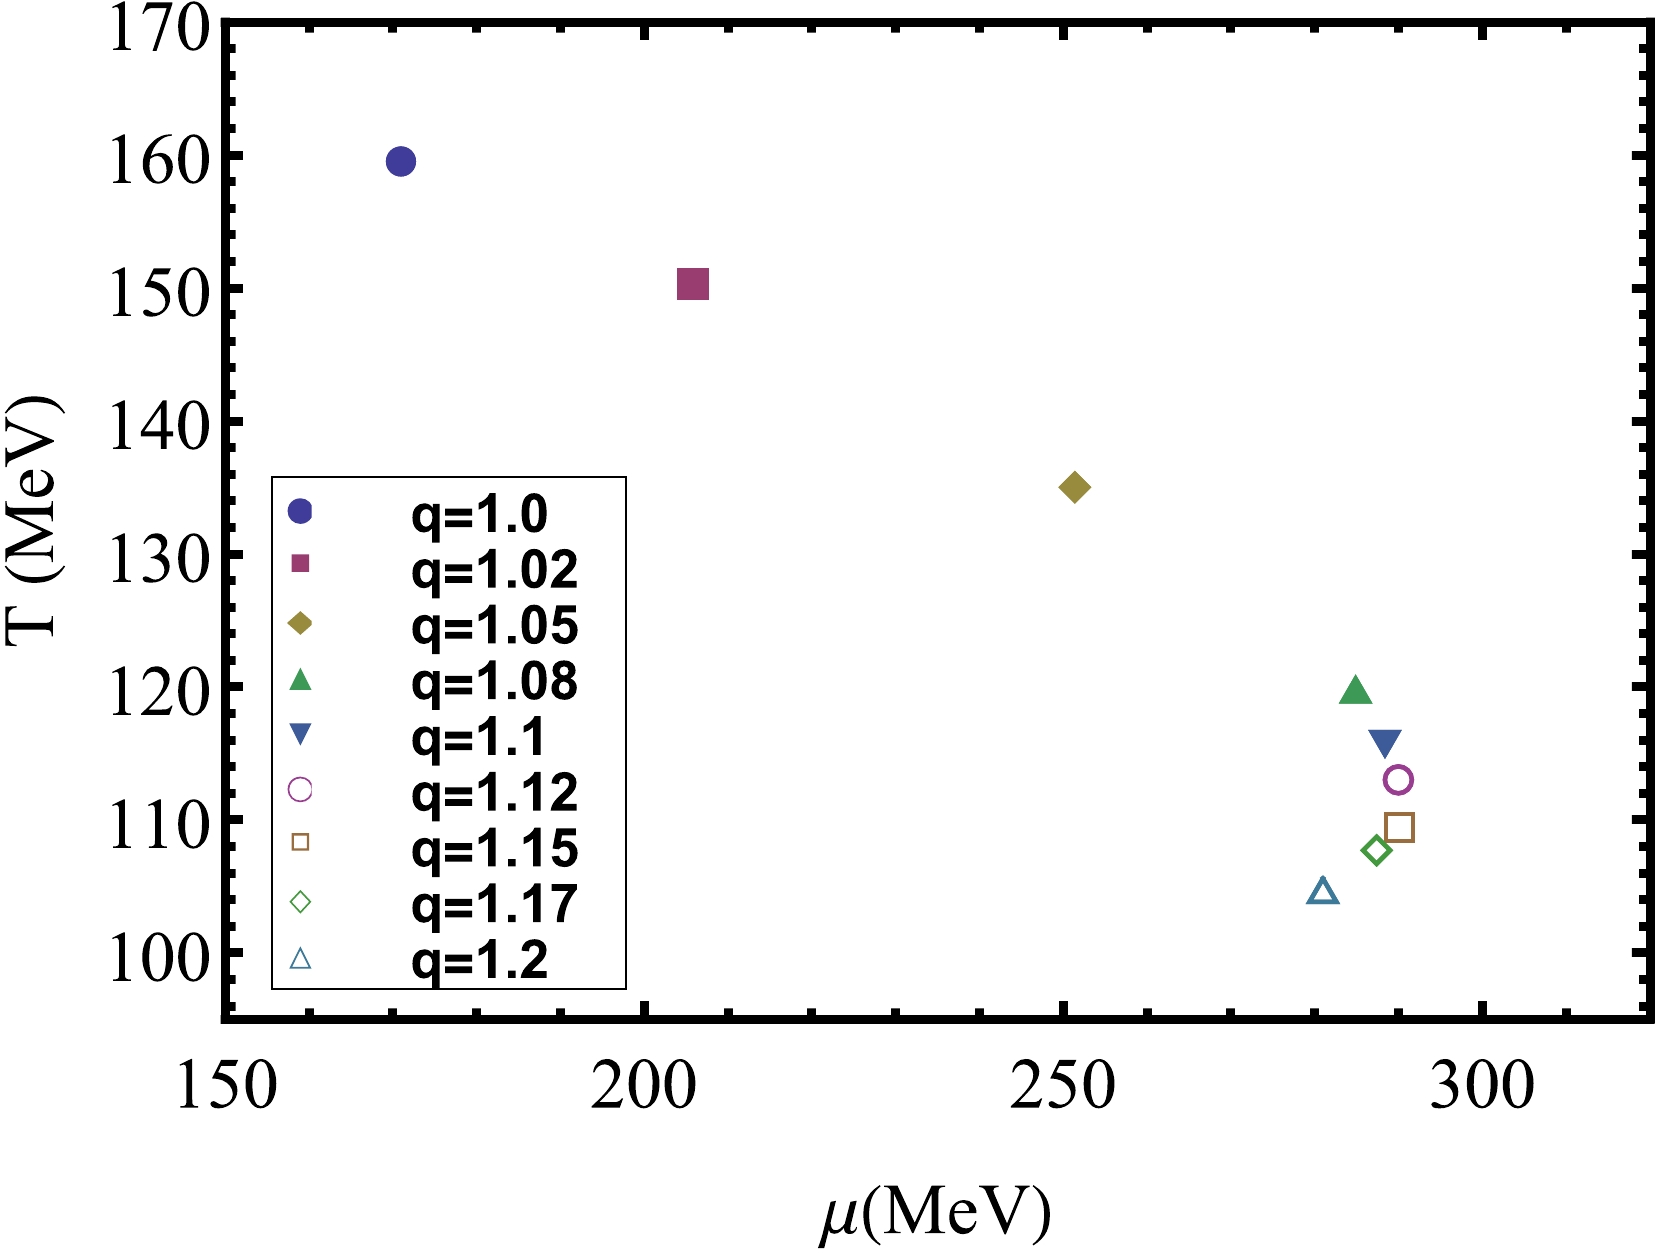
Figure 5. (color online) Trajectory of CEP position with q in the T-μ plane.
q $1$ 

$1.05$ 

$1.08$ 

$1.1$ 

$1.12$ 

$1.15$ 

$1.17$ 

$1.2$ 

$T_{c}$ 

159.5 135 119.8 115.7 113 109.4 107.7 104.7 $\mu_{c}$ 

171 251.4 284.9 288.4 290 290.2 287.4 281 Table 3. Numerical results of CEP for different values of nonextensivity parameter q. The unit of both
$T_{c}$ and$\mu_{c}$ is MeV. -
In this section, we analyze baryon-number susceptibilities because they are related to the moments of the conserved net-baryon number distribution, such as variance
$ \sigma^{2} $ , skewness S, and kurtosis κ. Non-monotonic dependence of these moments, especially high-order quantities, on collision energy$ \sqrt{S_{NN}} $ is suggested as an experimental signature of the QCD critical point [42]. The detailed formulas are as follows:$ \begin{aligned}[b] S\sigma=&\frac{T\chi_{B}^{(3)}}{\chi_{B}^{(2)}}, \;\kappa\sigma^{2}=\frac{T^{2}\chi_{B}^{(4)}}{\chi_{B}^{(2)}}. \end{aligned} $

(25) Here, the n-th order of the baryon-number susceptibility, i.e.,
$ \chi_{B}^{(n)} $ , is$ \begin{eqnarray} \chi_{B}^{(n)}=\frac{\partial^{n-1}}{\partial\mu_{B}^{n-1}}\rho_{B}=\frac{\partial^{n-1}}{3^{n}\partial\mu^{n-1}}\rho(T,\mu). \end{eqnarray} $

(26) According to Eq. (18), the quark number density
$ \rho(T,\mu) $ is$ \begin{aligned}[b] \rho(T,\mu)=&-\frac{\partial\Omega_{q}}{\partial\mu}\\ =&2N_{c}N_{f}\int\frac{{\rm d}^{3}p}{(2\pi)^{3}}(n_{q}(T,\mu)-\bar{n}_{q}(T,\mu)). \end{aligned} $

(27) Here, for brevity, we omit the subscript q of the quark number density.
To compare with experimental results, one needs the values of T and
$ \mu_{B} $ along the freeze-out curve as a function of the collision energy$ \sqrt{S_{NN}} $ . Here, we use the empirical fitting formula reported in Ref. [43] as follows:$ \begin{aligned}[b] T=&T_{\rm lim}\frac{1}{1+\exp(2.60-\ln(\sqrt{S_{NN}({\rm GeV})})/0.45)},\\ \mu_{B}=&\frac{1303}{1+0.286\sqrt{S_{NN}({\rm GeV})}}, \end{aligned} $

(28) where the limiting temperature is
$T_{\rm lim}=164\ \mathrm{MeV}$ .In Fig. 6,
$ S\sigma $ and$ \kappa\sigma^{2} $ are shown as a function of$ \sqrt{S_{NN}} $ . The latest experimental data come from$\rm Au+Au$ collisions at RHIC [44]. By varying the q value ($ 1\leq q\leq1.2 $ ,$ \Delta q=0.01 $ ), it can be concluded that our results are generally consistent with the experimental data at$ q= $ 1.07, especially for$ \sqrt{S_{NN}}>19.6\ \mathrm{GeV} $ , which fits the experimental data well. However, for$\sqrt{S_{NN}}= $ 11.5, 14.5 GeV, there is a larger deviation. The results of$ \kappa\sigma^{2} $ are qualitatively consistent with those of Ref. [45]. This non-monotonic variation with$ \sqrt{S_{NN}} $ shows that the chemical freeze-out points cross the crossover transition line, as shown in Fig. 7. Furthermore, their intersection is approximately$ \sqrt{S_{NN}}=20\ \mathrm{GeV} $ . However, it should be noted that, according to our model results,$ S\sigma $ also has a non-monotonic dependence on the collision energy, which is qualitatively different from the experimental data and deserves further study. This non-monotonic behavior is also seen in the NJL model [46]. In addition, we also tested the dependence of our results on T and μ, taking$ T(\sqrt{S_{NN}})\pm1\ \mathrm{MeV} $ and$ \mu(\sqrt{S_{NN}})\pm4\ \mathrm{MeV} $ . According to Figs. 6 and 7, it can be concluded that there is a large uncertainty in the results near the intersection. This is due to a large uncertainty of quark-number susceptibility in this region. All in all, our results generally agree with the experimental data at$ q=1.07 $ , which to some extent indicates that the nonextensive effects are worth considering in relativistic heavy ion collisions. This may also provide some useful clues for related research to interpret experimental data from a nonextensive perspective.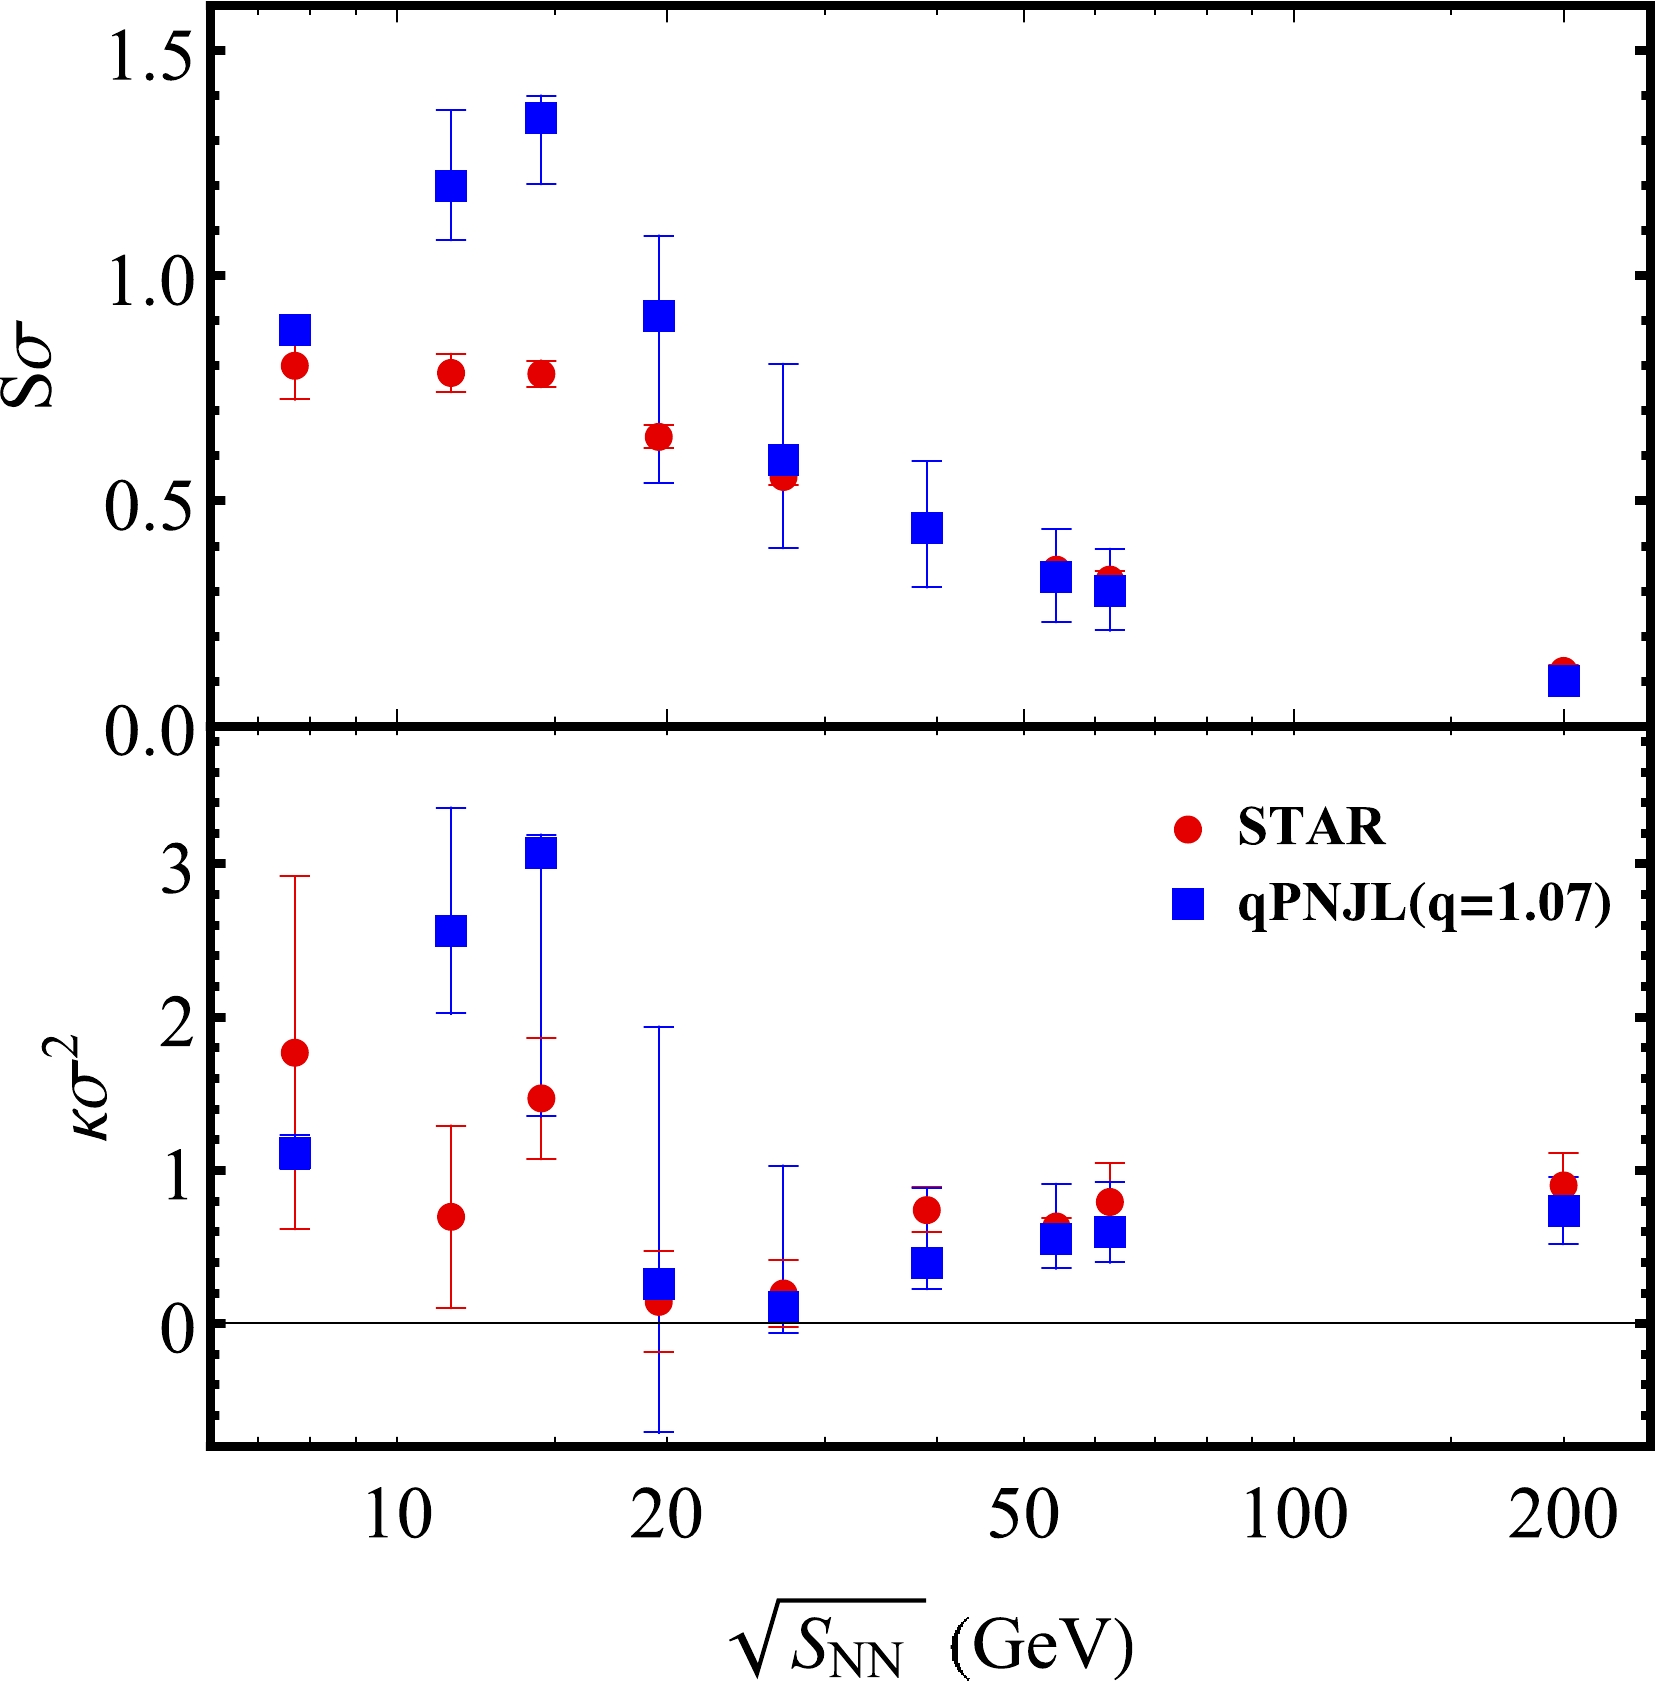
Figure 6. (color online) Comparison of the qPNJL model results and latest experimental data [44] for
$ S\sigma $ ,$ \kappa\sigma^{2} $ at$ \sqrt{S_{NN}}= $ 7.7, 11.5, 14.5, 19.6, 27, 39, 54.4, 62.4, and$ 200\ \mathrm{GeV} $ . The red circles represent the experimental data whereas the blue squares represent the results from our qPNJL model.
Figure 7. (color online) The dotted blue line represents the crossover transition line. The red circles represent the chemical freeze-out temperature as a function of the quark chemical potential at
$ \sqrt{S_{NN}}= $ 7.7, 11.5, 14.5, 19.6, 27, 39, 54.4, 62.4, and$ 200\ \mathrm{GeV} $ . Their intersection is approximately$ \sqrt{S_{NN}}= $ 20 GeV. -
In this study, combined with the Tsallis statistics and PNJL model, we first investigated the sensitivity of the QCD phase transition to deviations from usual BG statistics. At zero chemical potential and finite temperature, we found that the pseudo-critical temperature of the chiral and deconfinement transition decreases as q increases. At finite chemical potential and finite temperature, the most interesting point is that we found the non-monotonic dependence of CEP on q. At the beginning, as q increases, CEP moves rapidly toward a lower temperature and larger quark chemical potential. However, when
$ q\geq 1.15 $ , CEP turns to move in a direction with lower temperature and quark chemical potential. This means that searching for CEP in larger or smaller quark chemical potential regions in relativistic heavy-ion collisions depends on a critical value$ q_{c} $ .Secondly, we studied the moments of the net-baryon number distribution and obtained that
$ S\sigma $ ,$ \kappa\sigma^{2} $ are generally consistent with the experimental data when$ q=1.07 $ . This indicates that the nonextensive effects may be worth considering in relativistic heavy-ion collisions. In addition, quark stars, as candidates for observed massive stars ($ \geq2M_{\odot} $ ), have attracted much attention in astronomy [47–50]. Therefore, studying the influence of nonextensive effects on the structure and evolution of protoquark stars is a meaningful topic [51].Finally, how to introduce the nonextensive effects directly into the pure gluonic sector is a problem that deserves further study. As mentioned above, in the standard Polyakov-loop potential, there is no space to introduce nonextensive effects because this potential is based on group integral rather than momentum integral. We could consider other gluonic potentials, for example the Meisinger-Miller-Ogilvie model [52], which can qualitatively describe the confinement-deconfinement nature of QCD. This will be definitely a brand new attempt, and these issues will constitute directions of our future research.
Nonextensive effects on QCD chiral phase diagram and baryon-number fluctuations within Polyakov-Nambu-Jona-Lasinio model
- Received Date: 2022-10-08
- Available Online: 2023-05-15
Abstract: In this paper, a version of the Polyakov-Nambu-Jona-Lasinio (PNJL) model based on nonextensive statistical mechanics is presented. This new statistics summarizes all possible factors that violate the assumptions of the Boltzmann-Gibbs (BG) statistics to a dimensionless nonextensivity parameter q. Thus, when q tends to 1, it returns to the BG case. Within the nonextensive PNJL model, we found that as q increases, the location of the critical end point (CEP) exhibits non-monotonic behavior. That is, for


 DownLoad: