


 Abstract
 HTML
HTML Reference
 Related
 PDF
PDF


-
The main task of heavy-ion collision experiments is to study the properties of quark-gluon plasma and the phase structure of strongly interacting matter, which can be displayed by a quantum chromodynamics (QCD) phase diagram in terms of temperature T and baryon chemical potential (
$ \mu_{B} $ ). Recently, theoretical studies have predicted a QCD critical point (CP) at the end of the first-order phase transition boundary, but there is no consensus on the theoretical side on the exact location of the CP [1−8].On the experimental side, in the search for the QCD CP, higher-order cumulants of conserved quantities, such as net-baryon, net-strangeness, and net-electric charge, are proposed as promising observables owing to their sensitivity to system correlation length
$ \xi $ , which tends to diverge at around the CP [9−12]. The Beam Energy Scan program at the BNL Relativistic Heavy Ion Collider (RHIC) by the STAR experiment has collected large datasets over a wide range of collision energies$ \sqrt{s_{NN}} $ = 7.7−200 GeV of Au+Au collisions. Assuming that the thermalization is reached in those collisions, the corresponding range of chemical potential is$ \mu_B \sim $ 420−?25 MeV. The STAR experiment has published a series of papers on high moments related to the QCD CP [13−25]. Recent STAR results on the net-proton$ C_{4}/C_{2} $ [18, 19, 26] have shown a non-monotonic energy dependence trend with a significance level of 3.1$ \sigma $ , which could be a signature of the QCD CP. The subsequent net-proton analysis on BES-II datasets ($ \sqrt{s_{NN}} $ = 7.7−27 GeV), which have 10 to 20 times larger statistics, has significantly reduced statistical uncertainties [27]. During the second phase of the Beam Energy Scan, BES-II, STAR also obtained data in fixed-target mode (FXT) and collected Au+Au collision data at$ \sqrt{s_{NN}} $ = 3.0−4.5 GeV for proton high-moment analysis. The FXT data extended the QCD CP search to an unprecedented high baryon density region, where$ \mu_B \sim $ 750 MeV. The first publication of the proton high moments of STAR fixed-target data in Au+Au collisions at$ \sqrt{s_{NN}} $ = 3.0 GeV shows the consistency between data and hadronic transport model calculation, indicating that the CP could exist only at energies higher than 3.0 GeV [21, 22]. Measurements in the baryon density region will be crucial to establish a complete energy dependence trend. There have been several publications of non-critical model calculations [28] as baselines for net-proton high moment measurement, whereas those in the high baryon density region are scarce. As noted in Refs. [22], fluctuation analysis suffers from the so-called initial volume fluctuation effect. The effect emerges in experimental measurements when using charged particle multiplicity as a reference for collision centrality. From the experimental side, one could estimate the initial volume fluctuation effect by evaluating the centrality resolution of reference multiplicity at a certain energy. Generally, limited reference multiplicity indicates low centrality resolution, which brings a large initial volume effect into high moment measurements, particularly for higher-order ones.In this paper, we show (net-)proton moment calculations using a hadronic transport model called the ultra-relativistic quantum molecular dynamics (UrQMD) model for Au+Au collisions at
$ \sqrt{s_{NN}} $ = 3.0−9.2 GeV and discuss the effect of the initial volume fluctuation on high moments. In Sec. II, we briefly introduce the UrQMD model and simulation setup, as well as calculation details. In Sec. III, we show the model results and compare them with experimental data. We provide a summary in Sec. IV. -
The main task of heavy-ion collision experiments is to study the properties of Quark-Gluon Plasma (QGP) and the phase structure of strongly interacting matter, which can be displayed by a QCD (Quantum Chromodynamics) phase diagram in terms of temperature T and baryon chemical potential (
$ \mu_{B} $ ). Recently, theoretical studies have predicted a QCD critical point at the end of the first-order phase transition boundary while there is no consensus on the theoretical side on the exact location of the CP [1−8].On the experimental side, in the search for the QCD critical point, higher-order cumulants of conserved quantities such as net-baryon, net-strangeness, and net-electric charge are proposed as promising observables due to their sensitivity to system correlation length
$ \xi $ , which tends to diverge at around critical point [9−12]. The Beam Energy Scan program at the BNL Relativistic Heavy Ion Collider (RHIC) by the STAR experiment has collected large datasets over a wide range of collision energies$ \sqrt{s_{NN}} $ = 7.7 – 200 GeV of Au+Au collisions. Assuming that the thermalization is reached in those collisions, the corresponding range of chemical potential is$ \mu_B \sim $ 420 – 25 MeV. The STAR Experiment has published a series of papers on high moments related to the QCD critical point [13−25]. Recent STAR results on the net-proton$ C_{4}/C_{2} $ [18, 19, 26] show a non-monotonic energy dependence trend with a significance level of 3.1$ \sigma $ , which could be a signature of QCD CP. The subsequent net-proton analysis on BES-II datasets ($ \sqrt{s_{NN}} $ = 7.7 – 27 GeV), which has 10 to 20 times larger statistics has significantly reduced statistical uncertainties [27]. During the second phase of the beam energy scan, BES-II, STAR also took data in fixed-target mode (FXT) and has collected Au+Au collisions data at$ \sqrt{s_{NN}} $ = 3.0 – 4.5 GeV for proton high-moments analysis. The FXT data has extended the QCD CP search to unprecedented high baryon density region where$ \mu_B \sim $ 750 MeV. The first publication of proton high moments of STAR fixed-target data in Au+Au collisions at$ \sqrt{s_{NN}} $ = 3.0 GeV shows the consistency between data and hadronic transport model calculation indicating that the critical point could exist only at energies higher than 3.0 GeV [21, 22]. Measurements at baryon density region will be crucial to establish a complete energy dependence trend. There have been many publications of non-critical model calculations [28] as baselines for net-proton high moment measurement while few in high baryon density region. As noted in Refs. [22], fluctuation analysis suffers from the so-called initial volume fluctuation effect. The effect emerges in experimental measurements when using charged particle multiplicity as a reference of collision centrality. From the experimental side, one could estimate the initial volume fluctuation effect by evaluating the centrality resolution of reference multiplicity at a certain energy. Generally, limited reference multiplicity means low centrality resolution which brings a large initial volume effect into high moment measurement, especially for higher-order ones.In this paper, we show (net-)proton moments calculations using the hadronic transport model UrQMD (Ultra-relativistic Quantum Molecular Dynamics) for Au+Au collisions at
$ \sqrt{s_{NN}} $ = 3.0 – 9.2 GeV, and discuss the effect of initial volume fluctuation on high moments. In Sec. II, we briefly introduce the UrQMD model and simulation setup, as well as calculation details. In Sec. III, we show the model results and compare with experimental data. We summarize in Sec. IV. -
The main task of heavy-ion collision experiments is to study the properties of quark-gluon plasma and the phase structure of strongly interacting matter, which can be displayed by a quantum chromodynamics (QCD) phase diagram in terms of temperature T and baryon chemical potential (
$ \mu_{B} $ ). Recently, theoretical studies have predicted a QCD critical point (CP) at the end of the first-order phase transition boundary, but there is no consensus on the theoretical side on the exact location of the CP [1−8].On the experimental side, in the search for the QCD CP, higher-order cumulants of conserved quantities, such as net-baryon, net-strangeness, and net-electric charge, are proposed as promising observables owing to their sensitivity to system correlation length
$ \xi $ , which tends to diverge at around the CP [9−12]. The Beam Energy Scan program at the BNL Relativistic Heavy Ion Collider (RHIC) by the STAR experiment has collected large datasets over a wide range of collision energies$ \sqrt{s_{NN}} $ = 7.7−200 GeV of Au+Au collisions. Assuming that the thermalization is reached in those collisions, the corresponding range of chemical potential is$ \mu_B \sim $ 420−?25 MeV. The STAR experiment has published a series of papers on high moments related to the QCD CP [13−25]. Recent STAR results on the net-proton$ C_{4}/C_{2} $ [18, 19, 26] have shown a non-monotonic energy dependence trend with a significance level of 3.1$ \sigma $ , which could be a signature of the QCD CP. The subsequent net-proton analysis on BES-II datasets ($ \sqrt{s_{NN}} $ = 7.7−27 GeV), which have 10 to 20 times larger statistics, has significantly reduced statistical uncertainties [27]. During the second phase of the Beam Energy Scan, BES-II, STAR also obtained data in fixed-target mode (FXT) and collected Au+Au collision data at$ \sqrt{s_{NN}} $ = 3.0−4.5 GeV for proton high-moment analysis. The FXT data extended the QCD CP search to an unprecedented high baryon density region, where$ \mu_B \sim $ 750 MeV. The first publication of the proton high moments of STAR fixed-target data in Au+Au collisions at$ \sqrt{s_{NN}} $ = 3.0 GeV shows the consistency between data and hadronic transport model calculation, indicating that the CP could exist only at energies higher than 3.0 GeV [21, 22]. Measurements in the baryon density region will be crucial to establish a complete energy dependence trend. There have been several publications of non-critical model calculations [28] as baselines for net-proton high moment measurement, whereas those in the high baryon density region are scarce. As noted in Refs. [22], fluctuation analysis suffers from the so-called initial volume fluctuation effect. The effect emerges in experimental measurements when using charged particle multiplicity as a reference for collision centrality. From the experimental side, one could estimate the initial volume fluctuation effect by evaluating the centrality resolution of reference multiplicity at a certain energy. Generally, limited reference multiplicity indicates low centrality resolution, which brings a large initial volume effect into high moment measurements, particularly for higher-order ones.In this paper, we show (net-)proton moment calculations using a hadronic transport model called the ultra-relativistic quantum molecular dynamics (UrQMD) model for Au+Au collisions at
$ \sqrt{s_{NN}} $ = 3.0−9.2 GeV and discuss the effect of the initial volume fluctuation on high moments. In Sec. II, we briefly introduce the UrQMD model and simulation setup, as well as calculation details. In Sec. III, we show the model results and compare them with experimental data. We provide a summary in Sec. IV. -
The UrQMD model [29, 30] is a hadronic transport model that is successfully used in simulating (ultra-)relativistic heavy-ion collisions at a wide range of energies from SIS to RHIC. In UrQMD, hadrons have explicit space-time evolution trajectories. Below
$ \sqrt{s_{NN}} $ = 5 GeV, particle production is described by interactions between hadrons and resonances, and at collision energies above$ \sqrt{s_{NN}} $ = 5 GeV, the excitation of color strings and their fragmentation into hadrons dominates particle production.In this paper, we simulate Au+Au collisions at
$ \sqrt{s_{NN}} $ = 3.0 – 9.2 GeV in UrQMD configured as the standard cascade mode. Impact parameter (b) is set to 0 to 16 fm. The statistics at each energy are shown in Table 1.$ \sqrt{s_{NN}} $ (GeV)

3.0 3.2 3.5 3.9 4.5 4.9 7.7 9.2 Events (million) 66 117 131 105 93 136 170 156 Table 1. Statistics of Au+Au collisions simulated in UrQMD model at
$ \sqrt{s_{NN}} $ = 3.0 – 9.2 GeV -
The UrQMD model [29, 30] is a hadronic transport model successfully used in simulating (ultra-)relativistic heavy-ion collisions at a wide range of energies from SIS to RHIC. In UrQMD, hadrons have explicit space-time evolution trajectories. Below
$ \sqrt{s_{NN}} = 5 $ GeV, particle production is described by interactions between hadrons and resonances, and at collision energies above$ \sqrt{s_{NN}} $ = 5 GeV, the excitation of color strings and their fragmentation into hadrons dominate particle production.In this study, we simulate Au+Au collisions at
$ \sqrt{s_{NN}} $ = 3.0−9.2 GeV in the UrQMD model configured in the standard cascade mode. The impact parameter (b) is set to 0 to 16 fm. The statistics at each energy are shown in Table 1.$ \sqrt{s_{NN}}\, $ /GeV3.0 3.2 3.5 3.9 4.5 4.9 7.7 9.2 Events (million) 66 117 131 105 93 136 170 156 Table 1. Statistics of Au+Au collisions simulated in the UrQMD model at
$ \sqrt{s_{NN}} $ = 3.0−9.2 GeV. -
The cumulants of a distribution up to the fourth order are defined as follows:
$ \begin{aligned}[b] C_{1} &= \langle N \rangle, \quad\quad C_{2} = \langle(\delta N)^2\rangle, \\ C_{3} &= \langle(\delta N)^3\rangle, \quad\quad C_{4} = \langle(\delta N)^4\rangle - 3\langle(\delta N)^2\rangle^2, \end{aligned} $
(1) where N is the number of protons in each event, and
$ \delta N = N - \langle N\rangle $ is the deviation from the mean value$ \langle N\rangle $ . Cumulant ratios, such as$ C_{2}/C_{1} $ ,$ C_{3}/C_{2} $ , and$ C_{4}/C_{2} $ , are used to cancel volume dependence and are shown below:$ \begin{aligned} \frac{C_{2}}{C_{1}} = \sigma^2/M, \enspace\frac{C_{3}}{C_{2}} = S\sigma, \enspace\frac{C_{4}}{C_{2}} = \kappa\sigma^2 \end{aligned} $
(2) where M,
$ \sigma^2 $ , S, and$ \kappa $ represent the mean value, variance, skewness, and kurtosis, respectively. Higher-order cumulants, such as skewness and kurtosis, are famous for their capability to measure non-Gaussianity. The factorial cumulants ($ \kappa_{n} $ ) are related to the corresponding cumulants through the following relations:$ \begin{aligned}[b] \kappa_{1} &= C_{1} = \langle N \rangle, \\ \kappa_{2} &= -C_{1} + C_{2}, \\ \kappa_{3} &= 2C_{1} - 3C_{2} + C_{3}, \\ \kappa_{4} &= -6C_{1} + 11C_{2} - 6C_{3} + C_{4} \end{aligned} $
(3) In this study, the calculations of proton and net-proton high moments follow the same procedure used in experimental data analysis. Collision centrality is determined using charged particle multiplicity, including
$ \pi^{\pm} $ and$ K^{\pm} $ . To approximate the acceptance of the STAR Au+Au collision experiment at each energy (3−9.2 GeV),$ \pi^{\pm} $ and$ K^{\pm} $ are counted within$ -2.0 < \eta < 0 $ for 3.0 GeV,$ -2.4 < \eta < 0 $ for 3.2−4.9 GeV, and$ |\eta| < 1.6 $ for 7.7 and 9.2 GeV. Protons and anti-protons are not included in the multiplicity definition to avoid self-correlation [31, 32]. The formation of light fragments, such as deuterons, is not included in the UrQMD calculation. As shown in previous studies [33, 34], deuterons and other light nuclei are formed via the coalescence of nearby protons and neutrons, which effectively removes correlated protons from the free nucleon sample and leads to an increase in the proton cumulant ratios. As discussed in [35], the effect of deuteron formation is similar to the binomial efficiency effect owing to the loss of protons via deuteron formation. The formation of light fragments should be considered when comparing with data.Figure 1 shows the charged particle multiplicity distributions in Au+Au collisions at
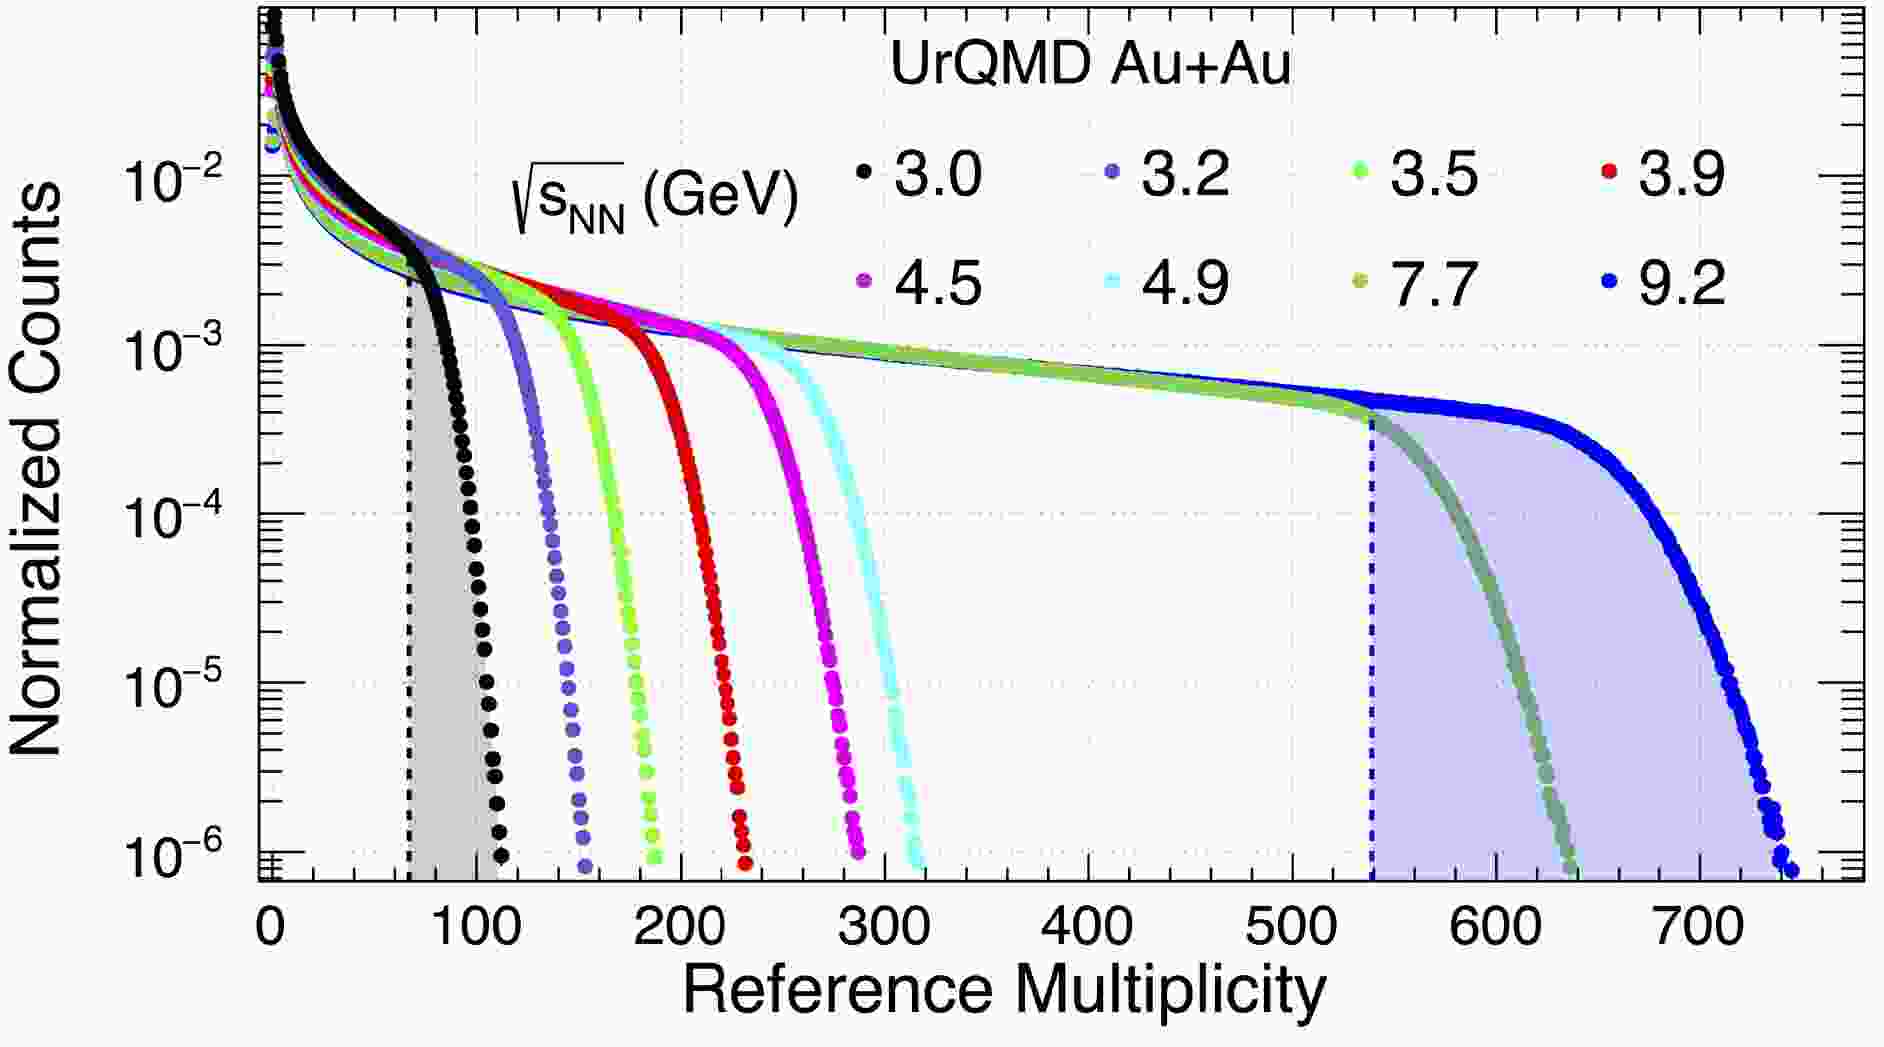
$ \sqrt{s_{NN}} $ = 3.0−9.2 GeV in the UrQMD model. The charged particle multiplicity distribution is then fitted by the Monte Carlo Glauber model [36], and categorized into several centrality classes: 0%−5%, 5%−10%,$ \cdots $ , 70%−80%. The black and blue shaded regions in Fig. 1 indicate the 0%−5% collision centrality class. The centrality bin width correction method [31] is used in proton and net-proton cumulant calculation. Cumulants are calculated in each reference multiplicity bin, and then, the weighted average for each centrality bin is calculated. The statistical errors are determined via analytical equations using the Delta method [37].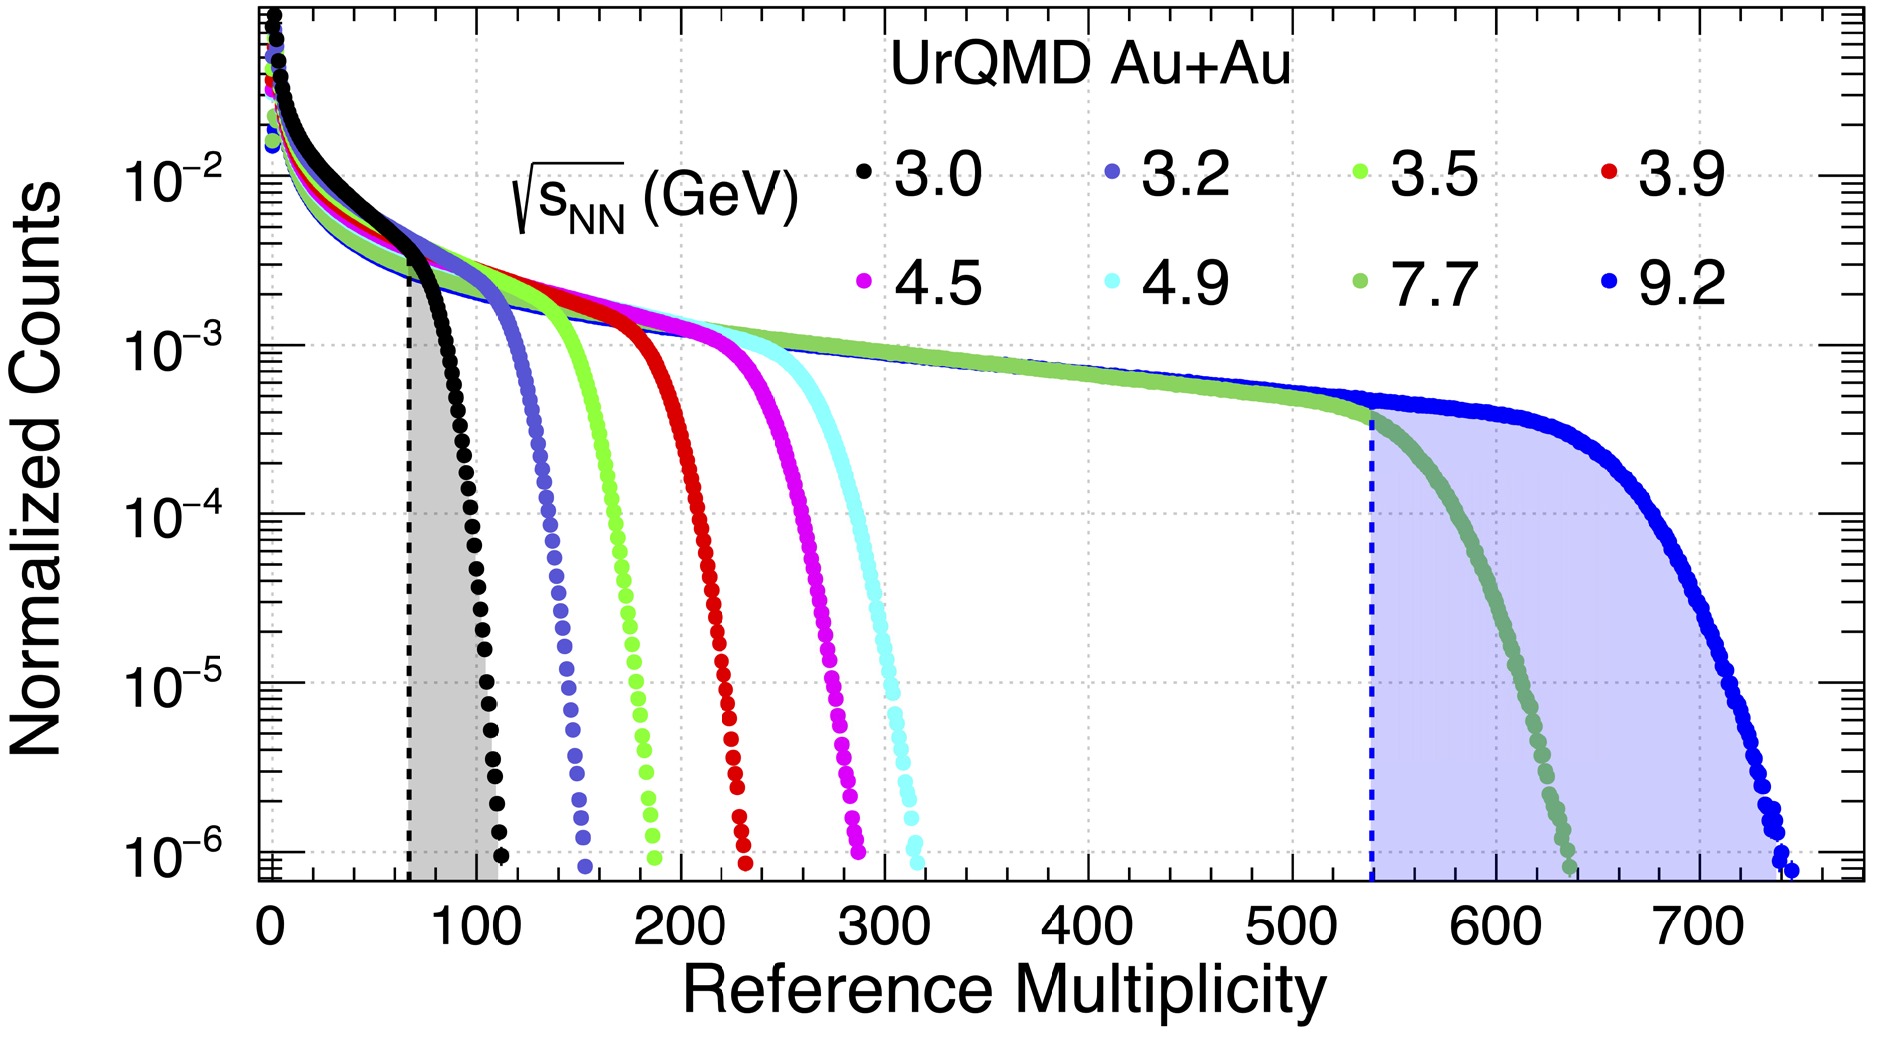
Figure 1. (color online) Reference multiplicity distribution in Au+Au collisions at
$ \sqrt{s_{NN}} $ = 3.0, 3.2, 3.5, 3.9, 4.5, 4.9, 7.7, and 9.2 GeV calculated using the UrQMD model. The black and blue shaded regions indicate the most central 0%–5% collisions.Figure 2 shows the proton acceptance in transverse momentum (
$ p_{\rm{T}} $ ) versus proton rapidity (y) in the center-of-mass frame in Au+Au collisions at$ \sqrt{s_{NN}} $ = 3.0 and 4.9 GeV from the UrQMD model. The black and red boxes indicate analysis windows within$ 0.4 < p_{T} < 2.0 $ GeV/c and$ -0.5 < y < 0 $ and |y| < 0.5, respectively.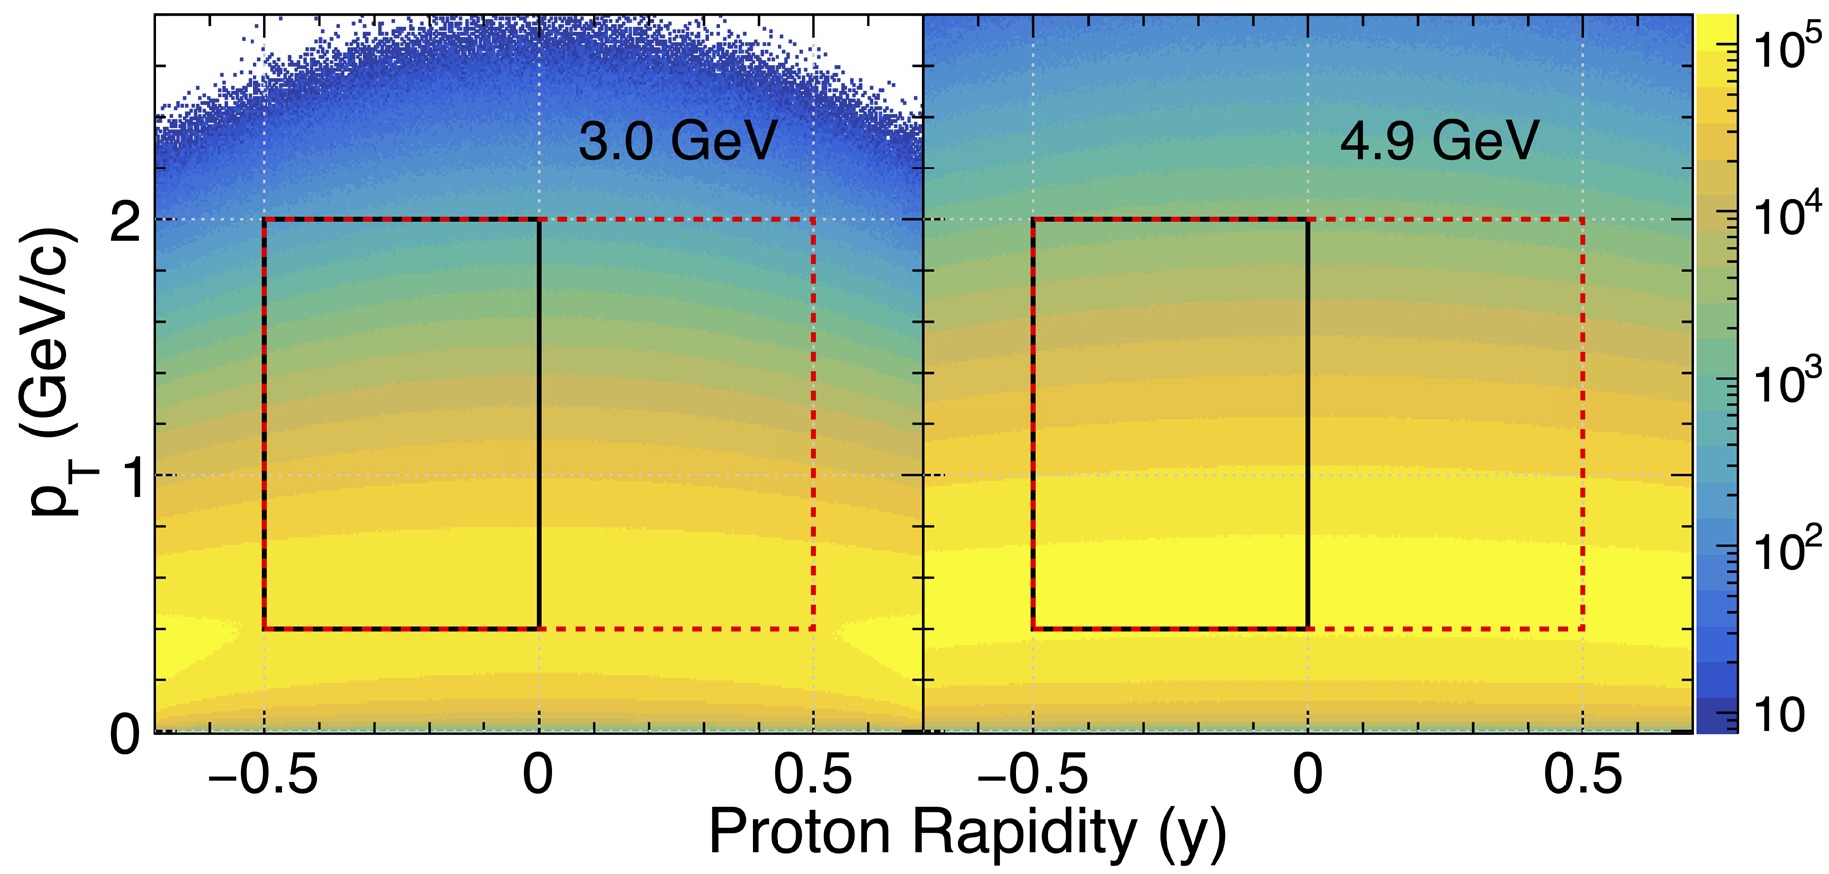
Figure 2. (color online) Transverse momentum (
$ p_{\rm{T}} $ ) versus proton rapidity (y) in Au+Au minimum bias collisions at$ \sqrt{s_{NN}} $ = 3.0 and 4.9 GeV calculated using the UrQMD model. Protons at rapidity$ |y| < 0.5 $ (red-dashed box) and$ -0.5 < y < 0.0 $ (black box) are used in the analysis for the collider and FXT mode, respectively. -
Cumulants of a distribution up to fourth order are defined as follows:
$ \begin{aligned}[b] C_{1} &= \langle N \rangle, \\ C_{2} &= \langle(\delta N)^2\rangle, \\ C_{3} &= \langle(\delta N)^3\rangle, \\ C_{4} &= \langle(\delta N)^4\rangle - 3\langle(\delta N)^2\rangle^2, \end{aligned} $

(1) where N is the number of proton in each event and
$ \delta N = N - \langle N\rangle $ is the deviation from mean value$ \langle N\rangle $ . Cumulant ratios such as$ C_{2}/C_{1} $ ,$ C_{3}/C_{2} $ , and$ C_{4}/C_{2} $ are used to cancel volume dependence and are shown below:$ \begin{aligned} \frac{C_{2}}{C_{1}} = \sigma^2/M, \enspace\frac{C_{3}}{C_{2}} = S\sigma, \enspace\frac{C_{4}}{C_{2}} = \kappa\sigma^2 \end{aligned} $

(2) Where M,
$ \sigma^2 $ , S,$ \kappa $ are known as mean value, variance, skewness, and kurtosis, respectively. Higher-order cumulants such as skewness and kurtosis are famous for their capability to measure non-Gaussianity. The factorial cumulants ($ \kappa_{n} $ ) are related to the corresponding cumulants through the following relations:$ \begin{aligned}[b] \kappa_{1} &= C_{1} = \langle N \rangle, \\ \kappa_{2} &= -C_{1} + C_{2}, \\ \kappa_{3} &= 2C_{1} - 3C_{2} + C_{3}, \\ \kappa_{4} &= -6C_{1} + 11C_{2} - 6C_{3} + C_{4} \end{aligned} $

(3) In this paper, the calculations of proton and net-proton high moments follow the same procedure used in experimental data analysis. Collision centrality is determined using charged particle multiplicity including
$ \pi^{\pm} $ and$ K^{\pm} $ . To approximate the acceptance of the STAR Au+Au collisions experiment at each energy (3 – 9.2 GeV),$ \pi^{\pm} $ and$ K^{\pm} $ are counted within$ -2.0 < \eta < 0 $ for 3.0 GeV,$ -2.4 < \eta < 0 $ for 3.2 – 4.9 GeV, and$ |\eta| < 1.6 $ for 7.7 and 9.2 GeV. Protons and anti-protons are not included in the multiplicity definition to avoid self-correlation [31, 32]. The formation of light fragments such as deuterons is not included in the UrQMD calculation. As shown in previous studies [33, 34], Deuterons and other light nuclei are formed via the coalescence of nearby protons and neutrons, which effectively removes correlated protons from the free nucleon sample and leads to a increase of the proton cumulant ratios. As discussed in [35], they showed the effect of deuteron formation is similar to the binomial efficiency effect due to the loss of protons via deuteron formation. The formation of light fragments should be taken into account when comparing with data.Figure 1 shows charged particle multiplicity distributions in Au+Au collisions at
$ \sqrt{s_{NN}} $ = 3.0 – 9.2 GeV in UrQMD model. The charged particle multiplicity distribution is then fitted by the Monte Carlo Glauber model [36], and categorized into several centrality classes: 0–5%, 5–10%,$ \cdots $ , 70–80%. The black and blue shaded regions of Fig. 1 indicate the 0–5% collision centrality classes. Centrality bin width correction (CBWC) method [31] is used in proton and net-proton cumulant calculation. Cumulants are calculated in each reference multiplicity bin and then taken weighted average for each centrality bin. The statistical errors are determined by analytical equations using the Delta method [37].
Figure 1. (color online) Reference multiplicity distribution in Au+Au collisions at
$ \sqrt{s_{NN}} $ = 3.0, 3.2, 3.5, 3.9, 4.5, 4.9, 7.7 and 9.2 GeV calculated by the UrQMD model. The regions with black and blue shading indicate the most central 0–5% collision.Figure 2 shows the proton acceptance in transverse momentum (
$ p_{\rm{T}} $ ) versus proton rapidity (y) in center-of-mass frame in Au+Au collisions at$ \sqrt{s_{NN}} $ = 3.0 and 4.9 GeV from UrQMD model. The black and red boxes indicate analysis windows within$ 0.4 < p_{T} < 2.0 $ GeV/c and$ -0.5 < y < 0 $ and |y| < 0.5.
Figure 2. (color online) Transverse momentum (
$ p_{\rm{T}} $ ) versus proton rapidity (y) in Au+Au minimum bias collisions at$ \sqrt{s_{NN}} $ = 3.0 and 4.9 GeV calculated by the UrQMD model. Protons from rapidity window$ |y| < 0.5 $ (red-dashed box) and$ -0.5 < y < 0.0 $ (black box) are used in the analysis for the collider and FXT mode, respectively. -
The cumulants of a distribution up to the fourth order are defined as follows:
$ \begin{aligned}[b] C_{1} &= \langle N \rangle, \quad\quad C_{2} = \langle(\delta N)^2\rangle, \\ C_{3} &= \langle(\delta N)^3\rangle, \quad\quad C_{4} = \langle(\delta N)^4\rangle - 3\langle(\delta N)^2\rangle^2, \end{aligned} $
(1) where N is the number of protons in each event, and
$ \delta N = N - \langle N\rangle $ is the deviation from the mean value$ \langle N\rangle $ . Cumulant ratios, such as$ C_{2}/C_{1} $ ,$ C_{3}/C_{2} $ , and$ C_{4}/C_{2} $ , are used to cancel volume dependence and are shown below:$ \begin{aligned} \frac{C_{2}}{C_{1}} = \sigma^2/M, \enspace\frac{C_{3}}{C_{2}} = S\sigma, \enspace\frac{C_{4}}{C_{2}} = \kappa\sigma^2 \end{aligned} $
(2) where M,
$ \sigma^2 $ , S, and$ \kappa $ represent the mean value, variance, skewness, and kurtosis, respectively. Higher-order cumulants, such as skewness and kurtosis, are famous for their capability to measure non-Gaussianity. The factorial cumulants ($ \kappa_{n} $ ) are related to the corresponding cumulants through the following relations:$ \begin{aligned}[b] \kappa_{1} &= C_{1} = \langle N \rangle, \\ \kappa_{2} &= -C_{1} + C_{2}, \\ \kappa_{3} &= 2C_{1} - 3C_{2} + C_{3}, \\ \kappa_{4} &= -6C_{1} + 11C_{2} - 6C_{3} + C_{4} \end{aligned} $
(3) In this study, the calculations of proton and net-proton high moments follow the same procedure used in experimental data analysis. Collision centrality is determined using charged particle multiplicity, including
$ \pi^{\pm} $ and$ K^{\pm} $ . To approximate the acceptance of the STAR Au+Au collision experiment at each energy (3−9.2 GeV),$ \pi^{\pm} $ and$ K^{\pm} $ are counted within$ -2.0 < \eta < 0 $ for 3.0 GeV,$ -2.4 < \eta < 0 $ for 3.2−4.9 GeV, and$ |\eta| < 1.6 $ for 7.7 and 9.2 GeV. Protons and anti-protons are not included in the multiplicity definition to avoid self-correlation [31, 32]. The formation of light fragments, such as deuterons, is not included in the UrQMD calculation. As shown in previous studies [33, 34], deuterons and other light nuclei are formed via the coalescence of nearby protons and neutrons, which effectively removes correlated protons from the free nucleon sample and leads to an increase in the proton cumulant ratios. As discussed in [35], the effect of deuteron formation is similar to the binomial efficiency effect owing to the loss of protons via deuteron formation. The formation of light fragments should be considered when comparing with data.Figure 1 shows the charged particle multiplicity distributions in Au+Au collisions at
$ \sqrt{s_{NN}} $ = 3.0−9.2 GeV in the UrQMD model. The charged particle multiplicity distribution is then fitted by the Monte Carlo Glauber model [36], and categorized into several centrality classes: 0%−5%, 5%−10%,$ \cdots $ , 70%−80%. The black and blue shaded regions in Fig. 1 indicate the 0%−5% collision centrality class. The centrality bin width correction method [31] is used in proton and net-proton cumulant calculation. Cumulants are calculated in each reference multiplicity bin, and then, the weighted average for each centrality bin is calculated. The statistical errors are determined via analytical equations using the Delta method [37].
Figure 1. (color online) Reference multiplicity distribution in Au+Au collisions at
$ \sqrt{s_{NN}} $ = 3.0, 3.2, 3.5, 3.9, 4.5, 4.9, 7.7, and 9.2 GeV calculated using the UrQMD model. The black and blue shaded regions indicate the most central 0%–5% collisions.Figure 2 shows the proton acceptance in transverse momentum (
$ p_{\rm{T}} $ ) versus proton rapidity (y) in the center-of-mass frame in Au+Au collisions at$ \sqrt{s_{NN}} $ = 3.0 and 4.9 GeV from the UrQMD model. The black and red boxes indicate analysis windows within$ 0.4 < p_{T} < 2.0 $ GeV/c and$ -0.5 < y < 0 $ and |y| < 0.5, respectively.
Figure 2. (color online) Transverse momentum (
$ p_{\rm{T}} $ ) versus proton rapidity (y) in Au+Au minimum bias collisions at$ \sqrt{s_{NN}} $ = 3.0 and 4.9 GeV calculated using the UrQMD model. Protons at rapidity$ |y| < 0.5 $ (red-dashed box) and$ -0.5 < y < 0.0 $ (black box) are used in the analysis for the collider and FXT mode, respectively. -
In this section, we show the calculations of proton and net-proton cumulant ratios in the UrQMD model.
Figure 3 shows the centrality dependence of proton cumulant ratio
$ C_{4}/C_{2} $ in Au+Au collisions at$ \sqrt{s_{NN}} $ = 3.0−9.2 GeV calculated using the UrQMD model. The dashed line at unity indicates a baseline from Poisson distribution. In mid-central and peripheral collisions, the proton ratio$ C_{4}/C_{2} $ largely deviates from the Poisson baseline, which demonstrates the poor centrality resolution of the reference multiplicity, particularly at lower energies. The proton ratio$ C_{4}/C_{2} $ shown with black dots is closer to the Poisson baseline than the results denoted by red squares, as the narrower proton distribution with$ -0.5<y<0 $ converges to the Poisson statistic rather than a wider distribution selected by |y| < 0.5.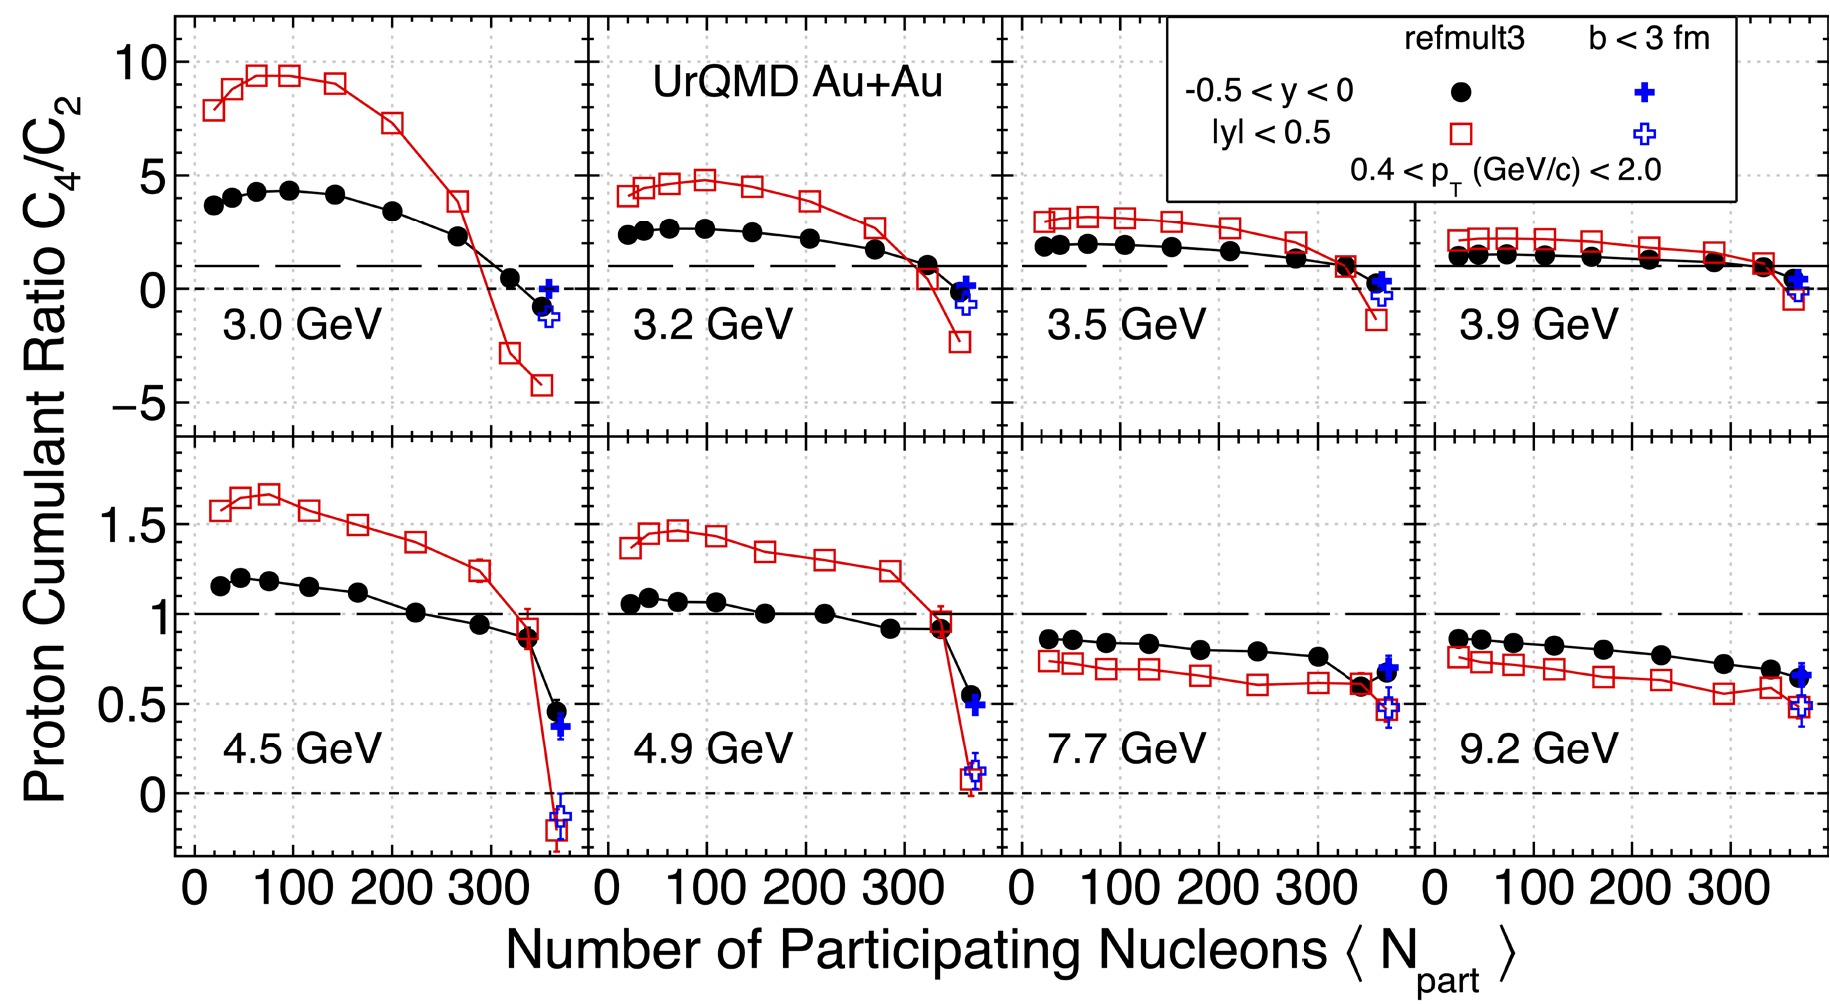
Figure 3. (color online) Centrality dependence of the proton cumulant ratio,
$ C_{4}/C_{2} $ , in Au+Au collisions at$ \sqrt{s_{NN}} $ = 3.0−9.2 GeV calculated using the UrQMD model. The solid black circles and red open squares represent the results for protons at rapidity acceptance -0.5 < y < 0 and |y| < 0.5, respectively. The blue solid crosses and open crosses indicate calculations with a cut on the impact parameter$ b\leq $ 3 fm, for –0.5 < y < 0 and |y| < 0.5, respectively. For these calculations, the$ p_{\rm{T}} $ acceptance of protons and anti-protons is$ 0.4 < p_{T} < 2.0 $ GeV/c.As shown in the figure, the proton high moments,
$ \kappa\sigma^{2} $ , have been suppressed in both central and peripheral collisions, particularly at the lowest collision energy$ \sqrt{s_{NN}} $ = 3.0 GeV. The observed suppression decreases with increasing collision energy, and is more pronounced for the wider rapidity |y| < 0.5. In addition, the largest fluctuation from unity is observed in the mid-central collisions$ \langle N_{\rm part} \rangle \sim 100 $ . The negative value of the ratios is caused by the initial volume fluctuation; see the discussion below. The suppression at the most central collisions is due to the fixed number of incoming nucleons.Now, let us focus on the results from the most central collisions: for protons from rapidity |y| < 0.5, the values of
$ C_{4}/C_{2} $ ratios are negative until the collision energy reaches 4.9 GeV, and this is true even for events selected from the cuts by the impact parameter b as shown by the open- and filled-blue crosses in the figure. For collision energy$ \sqrt{s_{NN}} > $ 4.5 GeV, all the ratios become positive, the values of the ratios from wider rapidity bins become smaller than those from the narrower bin$ -0.5<y<0 $ , and they decrease from peripheral to central collisions. These results indicate the diminishing role of the initial volume fluctuations and baryon number conservations in such collisions.Figure 4 shows the correlation distribution of the reference multiplicity vs.
$ N_{\rm part} $ and b vs.$ N_{\rm part} $ in Au+Au collisions at$ \sqrt{s_{NN}} $ = 3.0 GeV, calculated using the UrQMD model. The vertical black dashed line indicates the 0%–5% central collisions selected by the reference multiplicity, and the vertical red dashed line indicates a cut on$ b \leq $ 3 fm. One can compare these two cuts on the$ N_{\rm part} $ distributions. The$ \langle N_{\rm part} \rangle $ determined by the reference multiplicity, as in the experiment, shows a much wider variation in the$ N_{\rm part} $ distribution (see the left plot), compared with that of the$ \langle N_{\rm part} \rangle $ extracted from the cut on the impact parameter$ b \leq $ 3 fm (see the right plot). Conversely, for a fixed range of the$ N_{\rm part} $ distribution, a much wider fluctuation is observed in the "measured" reference multiplicity compared with the impact parameter. The variations in the$ N_{\rm part} $ distribution are the root cause of the initial volume fluctuations shown in Fig. 3. Note that such variation is part of the collision dynamics, and it should be properly simulated in the physics analysis.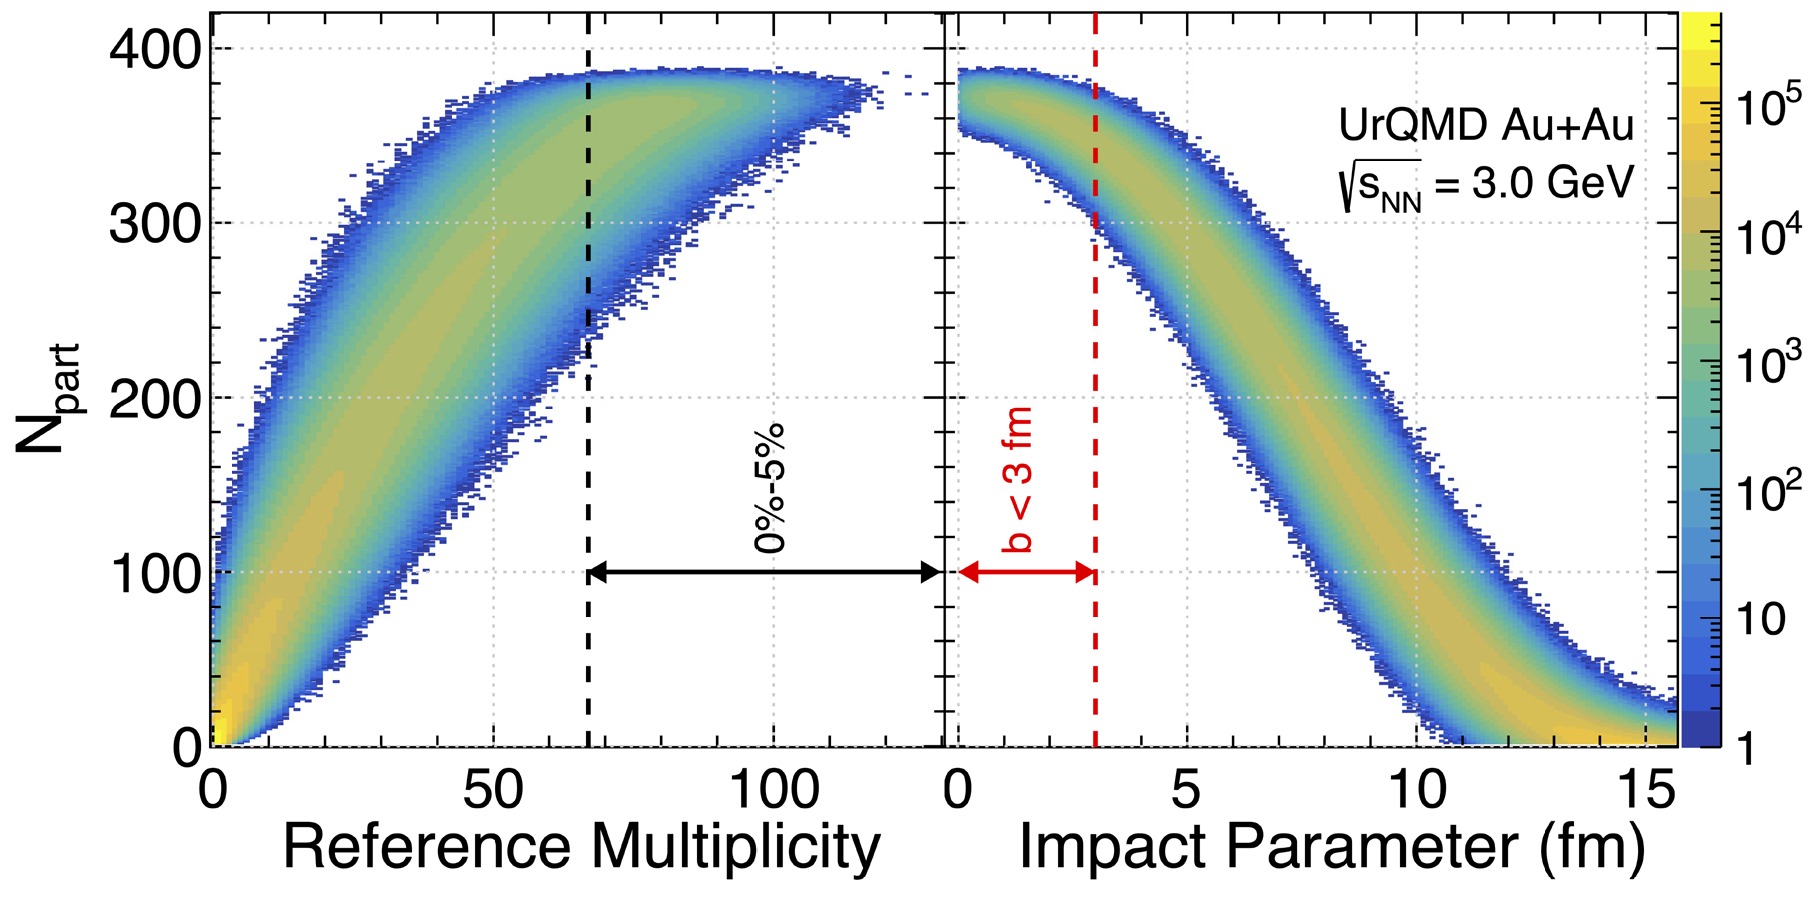
Figure 4. (color online) Left panel: Correlation distribution of reference multiplicity vs.
$ N_{\rm part} $ in Au+Au collisions at$ \sqrt{s_{NN}} $ = 3.0 GeV calculated using the UrQMD model. The vertical black dashed line indicates the 0%–5% central collisions selected by the reference multiplicity. Right panel: Correlation distribution of b vs.$ N_{\rm part} $ . The vertical red dashed line indicates a cut on b$ \leq $ 3 fm.Figure 5 shows the proton cumulant ratios
$ C_{2}/C_{1} $ ,$ C_{3}/C_{2} $ , and$ C_{4}/C_{2} $ (left panels) and factorial cumulant ratios$ \kappa_{2}/\kappa_{1} $ ,$ \kappa_{3}/\kappa_{1} $ , and$ \kappa_{4}/\kappa_{1} $ (right panels) as a function of collision energy in central collisions 0%–5% within kinematic acceptance 0.4 <$ p_{{T}} $ < 2.0 GeV/c. The results of$b \leq 3$ fm are shown as solid crosses (–0.5 < y < 0) and open crosses (|y| < 0.5). As mentioned in the previous paragraph, the large difference between the reference multiplicity 0%–5% and$b \leq 3 $ fm is mainly caused by the initial volume fluctuations. As the collision energy increases, while the ratios$ C_{3}/C_{2} $ ,$ C_{4}/C_{2} $ , and$ \kappa_{3}/\kappa_{1} $ show an initial fast increase and saturation at energies above 5 GeV, the ratios$ C_{2}/C_{1} $ and$ \kappa_{2}/\kappa_{1} $ behave in the opposite way. In any case, protons from wider rapidity bins show more sensitivity to the initial volume fluctuation, particularly in the high baryon density region.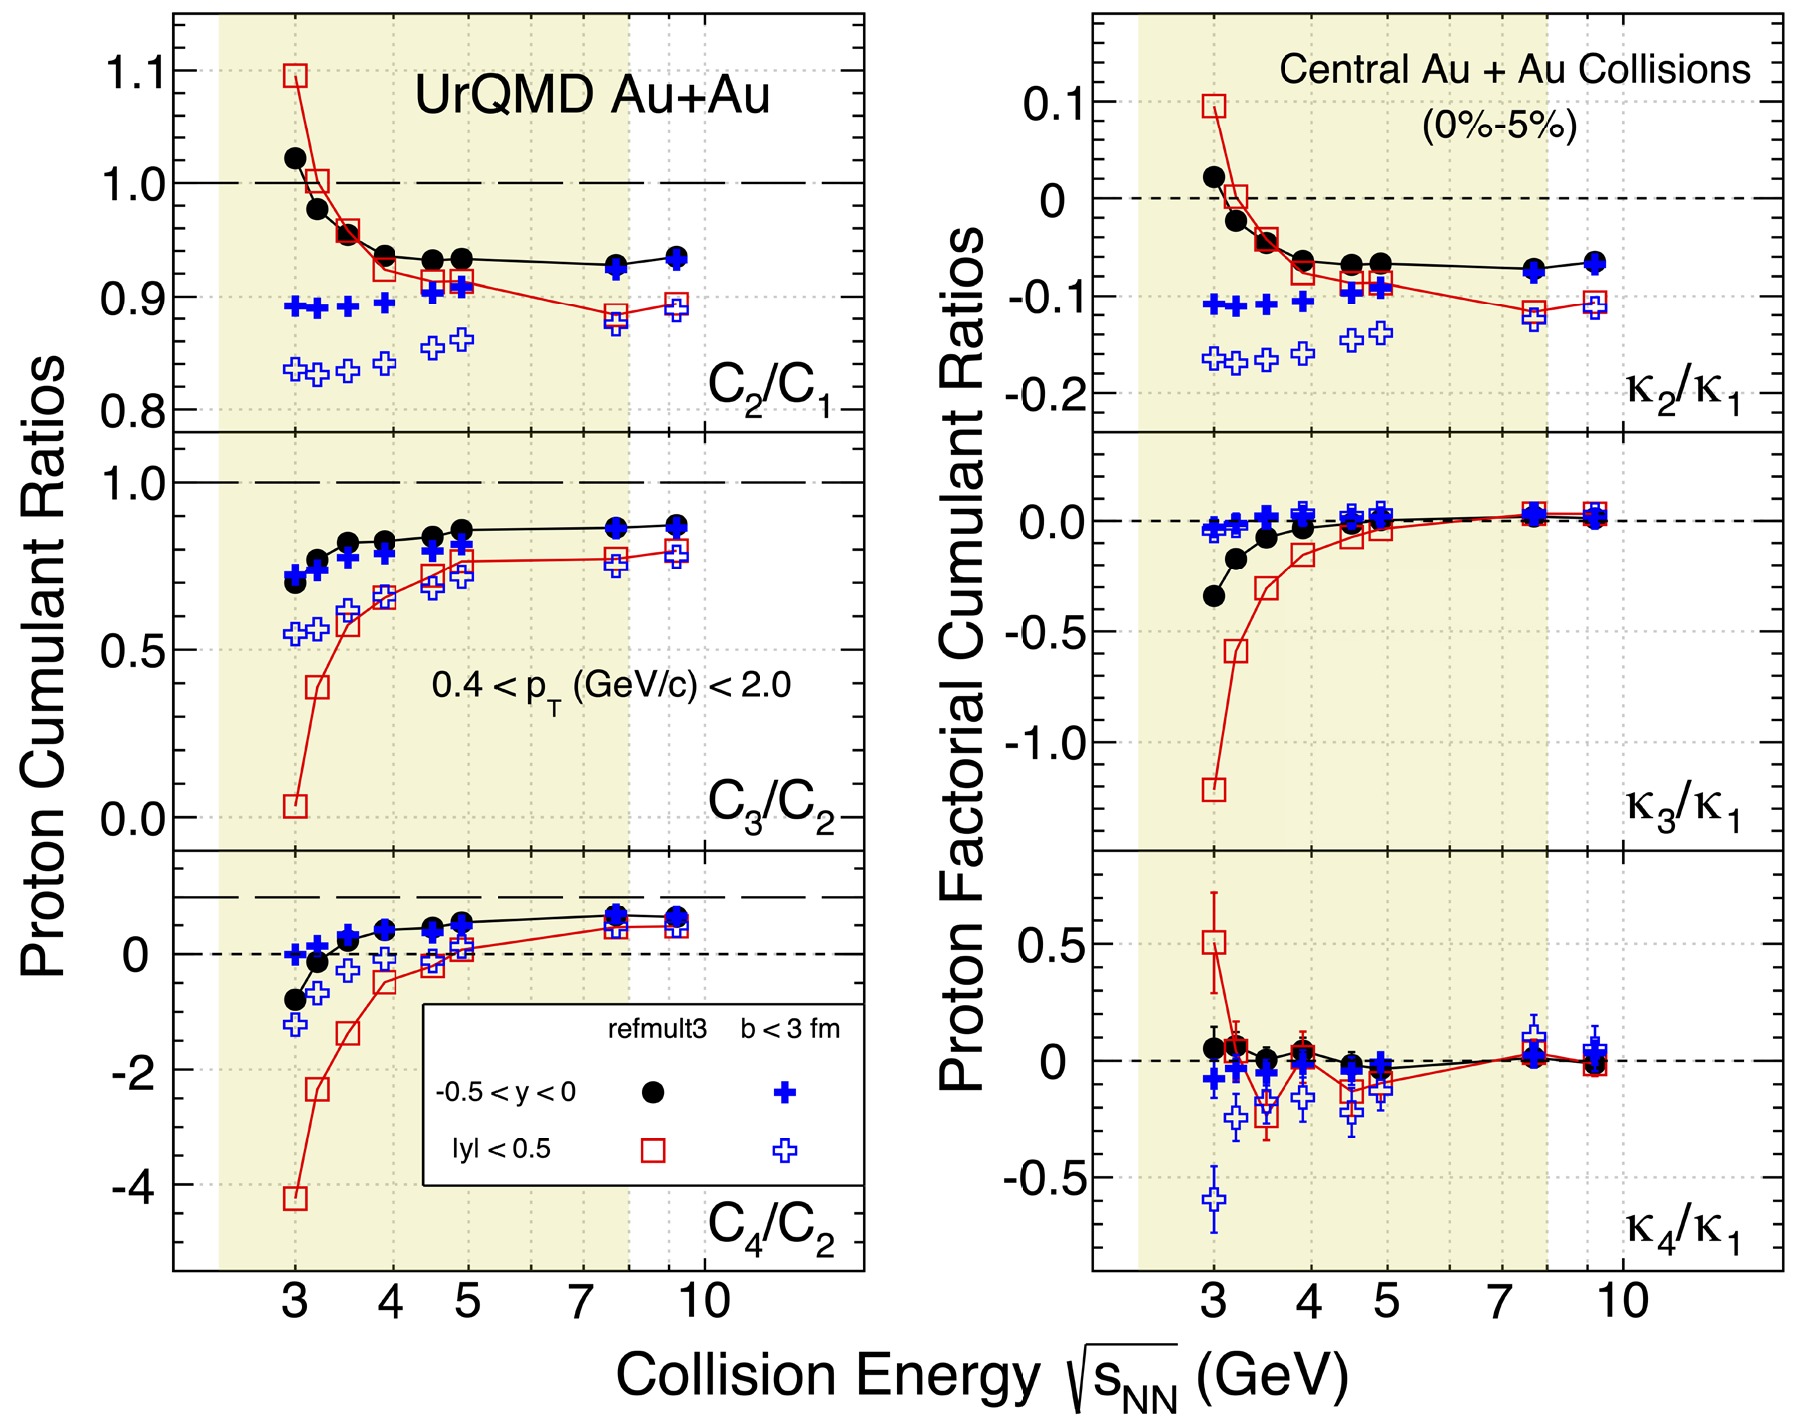
Figure 5. (color online) Collision energy dependence of proton cumulant ratios (
$ C_{2}/C_{1} $ ,$ C_{3}/C_{2} $ , and$ C_{4}/C_{2} $ ) and factorial cumulant ratios ($ \kappa_{2}/\kappa_{1} $ ,$ \kappa_{3}/\kappa_{1} $ , and$ \kappa_{4}/\kappa_{1} $ ) in 0%–5% central Au+Au collisions from the UrQMD model. The black solid circles and red open squares represent proton results at rapidity acceptance –0.5 < y < 0 and |y| < 0.5, respectively. The blue solid crosses and open crosses represent calculations with a cut on$ b \leq 3 $ fm, for –0.5 < y < 0 and |y| < 0.5, respectively.Figure 6 shows the collision energy dependence of the proton and net-proton
$ C_{4}/C_{2} $ ratios from 0%–5% central collisions. The experimental measurements in$ \sqrt{s_{NN}} $ = 7.7−19.6 GeV Au+Au collisions from RHIC-STAR BES-II data are also shown as red solid circles [18] from collider collisions, and the 3 GeV results are denoted by blue squares. The results of the UrQMD model calculations are displayed as colored bands: protons from$ -0.5 < y < 0 $ and net-protons from |y| < 0.5 are presented as blue and red bands, respectively. In both cases, both bands decreased as the collision energy decreased owing to both baryon number conservation and volume fluctuations. Owing to large acceptance in the case of the net-protons from |y| < 0.5, the decreases in the$ C_{4}/C_{2} $ ratio are much faster in the low energy region. While there was a large deviation between data and the UrQMD model calculation at 19.6 GeV, the transport model well reproduced the data at$ \sqrt{s_{NN}} $ = 3 GeV. The result indicates that, if the CP exists, it should be between$ 3 < \sqrt{s_{NN}} < $ 19.6 GeV Au+Au collisions. In addition to the Beam Energy Scan program at RHIC, the physics program at the Facility for Antiproton and Ion Research (FAIR) via the Compressed Baryonic Matter (CBM) experiment [38] is essential to finally determine the location of the QCD CP.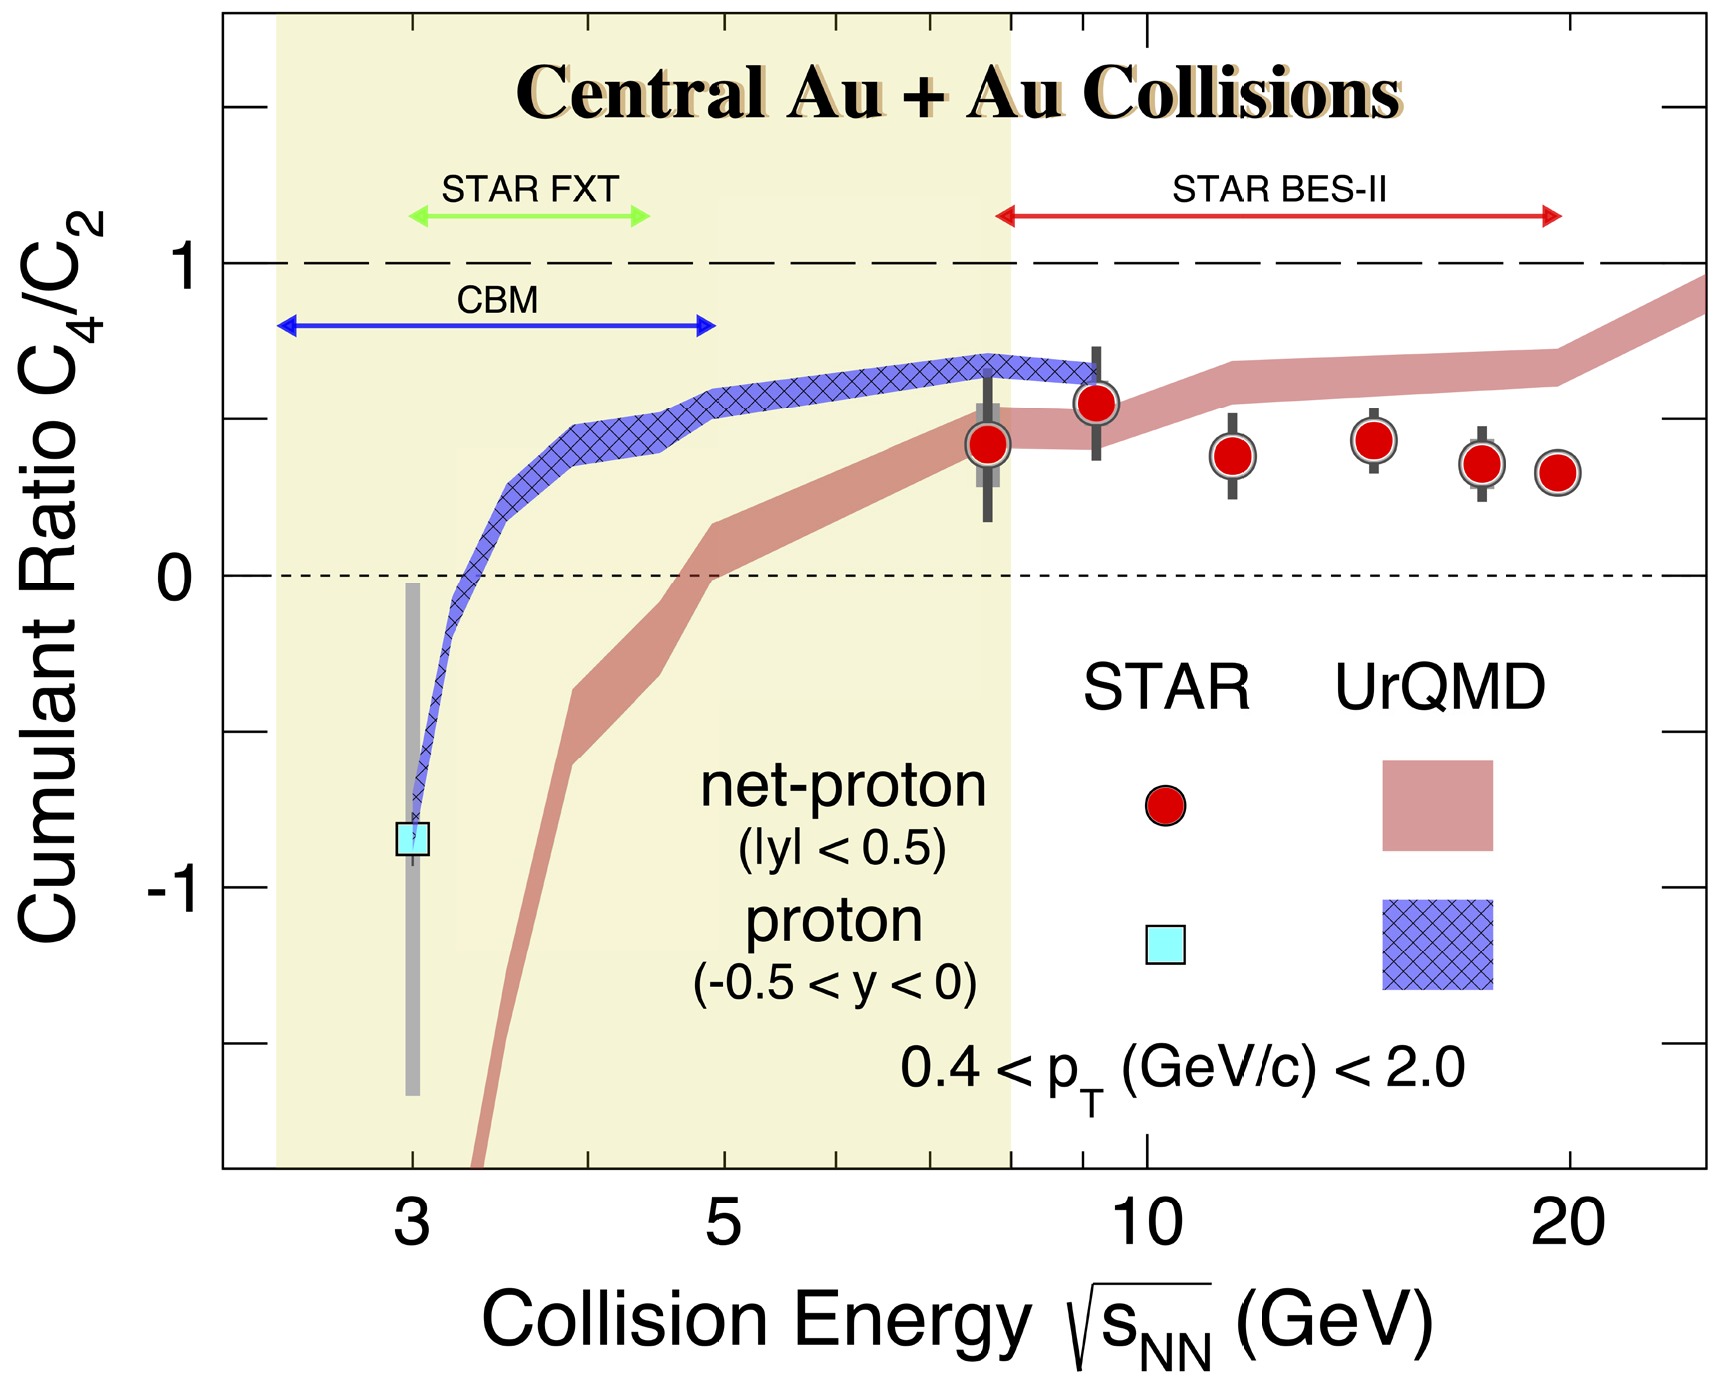
Figure 6. (color online) Collision energy dependence of proton and net-proton cumulant ratio,
$ C_{4}/C_{2} $ , in 0%–5% central Au+Au collisions from the UrQMD model. The blue and red bands represent proton and net-proton results in UrQMD, respectively. The red and cyan markers represent STAR measurements from BES-II and the fixed-target experiment, respectively. In addition, the green and blue arrows indicate the collision energy range of the STAR fixed-target experiment at RHIC and the CBM experiment at FAIR, respectively. -
In this section, we show the calculations of proton and net-proton cumulant ratios in UrQMD model.
Figure 3 shows centrality dependence of proton
$ C_{4}/C_{2} $ in Au+Au collisions at$ \sqrt{s_{NN}} $ = 3.0 – 9.2 GeV calculated by the UrQMD model. The dashed line at unity indicates a baseline from Poisson distribution. In mid-central and peripheral collisions, the proton$ C_{4}/C_{2} $ largely deviate from Poisson baseline, which demonstrates poor centrality resolution of reference multiplicity especially in lower energies. The proton$ C_{4}/C_{2} $ shown with black dots are closer to Poisson baseline than results shown with red squares, which could be explained by that the narrower proton distribution with$ -0.5<y<0 $ converges to Poisson statistic rather than a wider distribution selected by |y| < 0.5.
Figure 3. (color online) Centrality dependence of the proton cumulant ratio,
$ C_{4}/C_{2} $ , in Au+Au collisions at$ \sqrt{s_{NN}} $ = 3.0 – 9.2 GeV calculated by the UrQMD model. Solid black circles and red open squares represent results for proton in the rapidity acceptance -0.5 < y < 0 and |y| < 0.5, respectively. Blue solid crosses and open crosses are calculations with a cut on impact parameter$ b\leq $ 3 fm, for -0.5 < y < 0 and |y| < 0.5, respectively. For these calculations, the$ p_{\rm{T}} $ acceptance of protons and anti-protons is$ 0.4 < p_{T} < 2.0 $ GeV/c.As one can see in the figure, the proton high moments,
$ \kappa\sigma^{2} $ , have been suppressed in both central and peripheral collisions, especially at the lowest collision energy$ \sqrt{s_{NN}} $ = 3.0 GeV. The observed suppression decreases with increasing collision energy, and is more pronounced for the wider rapidity |y| < 0.5. In addition, the largest fluctuation from unity is seen in the mid-central collisions$ \langle N_{part} \rangle \sim 100 $ . The negative value of the ratios is caused by the initial volume fluctuation, see discussions below. The suppression at the most central collisions is due to the fixed number of incoming nucleons.Now, let us focus on the results from the most central collisions: for protons from rapidity |y| < 0.5, the values of
$ C_{4}/C_{2} $ ratios are negative till the collision energy reaches 4.9 GeV and this is true even for events selected from the cuts by the impact parameter b as shown by the open- and filled-blue crosses in the figure. For collision energy$ \sqrt{s_{NN}} > $ 4.5 GeV, all ratios become positive, the values of the ratios from wider rapidity bins become smaller than those from narrower bin$ -0.5<y<0 $ and they are decreased from peripheral to central collisions. All of these indicated the diminishing role of the initial volume fluctuations and baryon number conservations in such collisions.Figure 4 shows the correlation distribution of reference multiplicity vs.
$ N_{part} $ and b vs.$ N_{part} $ in Au+Au collisions at$ \sqrt{s_{NN}} $ = 3.0 GeV, calculated by the UrQMD model. The vertical black dashed line indicate the 0–5% central collisions selected by reference multiplicity, and the vertical red dashed line indicate a cut on$ b \leq $ 3 fm. One can compare these two cuts on the$ N_{part} $ distributions. As one can see, the$ \langle N_{part} \rangle $ determined by reference multiplicity, as it is done in experiment, shows a much wider variation in the$ N_{part} $ distribution, see left plot, compared to that of the$ \langle N_{part} \rangle $ extracted from the cut on the impact parameter$ b \leq $ 3 fm, see right plot. Reversely, for a fixed range of the$ N_{part} $ distribution, a much wider fluctuation is seen in the 'measured' reference multiplicity compared to the impact parameter. The variations in the$ N_{part} $ distribution are the root cause of the initial volume fluctuations shown in Figure 3. One should note that such variation is part of the collision dynamics and it should be properly simulated in the physics analysis.
Figure 4. (color online) Left panel: Correlation distribution of reference multiplicity vs.
$ N_{part} $ in Au+Au collisions at$ \sqrt{s_{NN}} $ = 3.0 GeV calculated by the UrQMD model. The vertical black dashed line indicate the 0–5% central collisions selected by reference multiplicity. Right panel: Correlation distribution of b vs.$ N_{part} $ . The vertical red dashed line indicate a cut on b$ \leq $ 3 fm.Figure 5 depicts proton cumulant ratios
$ C_{2}/C_{1} $ ,$ C_{3}/C_{2} $ and$ C_{4}/C_{2} $ (left panels) and factorial cumulant ratios$ \kappa_{2}/\kappa_{1} $ ,$ \kappa_{3}/\kappa_{1} $ and$ \kappa_{4}/\kappa_{1} $ (right panels) as a function of collision energy in central collisions 0–5% within kinematic acceptance 0.4 <$ p_{\rm{T}} $ < 2.0 GeV/c. Results of b$ \leq $ 3 fm are shown as solid cross (-0.5 < y < 0) and open cross (|y| < 0.5). As mentioned in the previous paragraph, the large difference between the reference multiplicity 0–5% and b$ \leq $ 3 fm is mainly caused by initial volume fluctuations. As the collision energy increases, While all$ C_{3}/C_{2} $ ,$ C_{4}/C_{2} $ and$ \kappa_{3}/\kappa_{1} $ ratios show a initial fast increase and saturation at energy above 5 GeV, the ratios of$ C_{2}/C_{1} $ and$ \kappa_{2}/\kappa_{1} $ just behave in the opposite way. In any case, protons from wider rapidity bins show more sensitivity to initial volume fluctuation especially at the high baryon density region.
Figure 5. (color online) Collision energy dependence of proton cumulant ratios (
$ C_{2}/C_{1} $ ,$ C_{3}/C_{2} $ and$ C_{4}/C_{2} $ ) and factorial cumulant ratios ($ \kappa_{2}/\kappa_{1} $ ,$ \kappa_{3}/\kappa_{1} $ and$ \kappa_{4}/\kappa_{1} $ ) in 0–5% central Au+Au collisions from the UrQMD model. Black solid circles and red open squares represent proton results in the rapidity acceptance -0.5 < y < 0 and |y| < 0.5, respectively. Blue solid crosses and open crosses are calculations with a cut on b$ \leq $ 3 fm, for -0.5 < y < 0 and |y| < 0.5, respectively.Figure 6 depicts the collision energy dependence of the proton and net-proton
$ C_{4}/C_{2} $ ratios from 0–5% central collisions. The experimental measurements in$ \sqrt{s_{NN}} $ = 7.7 – 19.6 GeV Au+Au collisions from RHIC-STAR BES-II data are also shown as red solid circles [18] from collider collisions and the 3 GeV result is shown as blue square. Results of UrQMD model calculations are displaced as colored bands: protons from$ -0.5 < y < 0 $ and net-protons from |y| < 0.5 are presented as blue and red band, respectively. In both cases, both bands decreased as collision energy decreases due to both baryon number conservation and volume fluctuations. Due to large acceptance in case of the net-protons from |y| < 0.5, the decreases of the$ C_{4}/C_{2} $ ratios are much faster at the low energy region. While large deviation between data and UrQMD calculation at the 19.6 GeV, the transport model well reproduced the data at$ \sqrt{s_{NN}} $ = 3 GeV. The result implies that if the critical point exists, it should be somewhere between$ 3 < \sqrt{s_{NN}} < $ 19.6 GeV Au+Au collisions. In addition to the beam energy scan program at RHIC, the physics program at the FAIR CBM experiment [38] is essential in order to finally determine the location of the QCD critical point.
Figure 6. (color online) Collision energy dependence of proton and net-proton cumulant ratio,
$ C_{4}/C_{2} $ , in 0–5% central Au+Au collisions from the UrQMD model. The blue and red band represent proton and net-proton results in UrQMD, respectively. The red and cyan markers represent STAR measurements, red from BES-II, cyan form fixed-target experiment. In addition, the green and blue arrows indicate collision energy range of STAR fixed-target experiment at RHIC and CBM experiment at FAIR, respectively. -
In summary, we presented results of proton (from -0.5 < y < 0) and net-proton (from |y| < 0.5) high order cumulants ratios from Au+Au collisions at
$ \sqrt{s_{NN}} $ = 3.0 – 19.6 GeV from the hadronic transport model UrQMD calculations. These results are valuable dynamic references for the QCD critical point search and there are two main observations from these analyses: (i) At low energy$ \sqrt{s_{NN}} < $ 5 GeV, initial volume fluctuation is important, the larger the acceptance the stronger the effect of the fluctuation and (ii) In the FXT Au+Au collisions below$ \sqrt{s_{NN}} < $ 5 GeV, UrQMD model calculations well reproduced$ C_{4}/C_{2} $ ratios implying that if the QCD critical point exist, it should be in the energy$ \sqrt{s_{NN}} > $ 3.0 GeV.Recently, preliminary results of proton cumulant on RHIC-STAR fixed-target experiment at
$ \sqrt{s_{NN}} $ = 3.2 – 3.9 GeV are reported [39]. The future Compressed Baryonic Matter (CBM) experiment in Facility for Antiproton and Ion Research (FAIR) [38] will cover a collision energy of$ \sqrt{s_{NN}} $ = 2.4 – 4.9 GeV, with excellent acceptance and higher statistics to reduce both statistical and systematic uncertainties, will play an important role in the QCD critical point search. -
We present the results of proton (from –0.5 < y < 0) and net-proton (from |y| < 0.5) high order cumulant ratios in Au+Au collisions at
$ \sqrt{s_{NN}} $ = 3.0−19.6 GeV obtained from calculations using the UrQMD model (hadronic transport model). These results are valuable dynamic references for the QCD CP search, and there are two main observations from these analyses. (i) At low energy$ \sqrt{s_{NN}} < $ 5 GeV, the initial volume fluctuation is important; the larger the acceptance, the stronger the effect of the fluctuation. (ii) In the FXT Au+Au collisions below$ \sqrt{s_{NN}} < $ 5 GeV, the UrQMD model calculations well reproduced the$ C_{4}/C_{2} $ ratios, indicating that, if the QCD CP exists, it should be in the energy range$ \sqrt{s_{NN}} > $ 3.0 GeV.Recently, the preliminary results of the proton cumulant in the RHIC-STAR fixed-target experiment at
$ \sqrt{s_{NN}} $ = 3.2−3.9 GeV have been reported [39]. The future CBM experiment at the FAIR [38] will consider a collision energy of$ \sqrt{s_{NN}} $ = 2.4−4.9 GeV, with excellent acceptance and higher statistics to reduce both statistical and systematic uncertainties, and will play an important role in the QCD CP search. -
We present the results of proton (from –0.5 < y < 0) and net-proton (from |y| < 0.5) high order cumulant ratios in Au+Au collisions at
$ \sqrt{s_{NN}} $ = 3.0−19.6 GeV obtained from calculations using the UrQMD model (hadronic transport model). These results are valuable dynamic references for the QCD CP search, and there are two main observations from these analyses. (i) At low energy$ \sqrt{s_{NN}} < $ 5 GeV, the initial volume fluctuation is important; the larger the acceptance, the stronger the effect of the fluctuation. (ii) In the FXT Au+Au collisions below$ \sqrt{s_{NN}} < $ 5 GeV, the UrQMD model calculations well reproduced the$ C_{4}/C_{2} $ ratios, indicating that, if the QCD CP exists, it should be in the energy range$ \sqrt{s_{NN}} > $ 3.0 GeV.Recently, the preliminary results of the proton cumulant in the RHIC-STAR fixed-target experiment at
$ \sqrt{s_{NN}} $ = 3.2−3.9 GeV have been reported [39]. The future CBM experiment at the FAIR [38] will consider a collision energy of$ \sqrt{s_{NN}} $ = 2.4−4.9 GeV, with excellent acceptance and higher statistics to reduce both statistical and systematic uncertainties, and will play an important role in the QCD CP search.
UrQMD simulations of higher-order cumulants in Au+Au collisions at high baryon density
- Received Date: 2025-07-10
- Available Online: 2026-01-15
Abstract: High moments of conserved quantities, such as net-baryon, net-electric charge, and net-strangeness, in heavy-ion collisions are sensitive to fluctuations caused by the quantum chromodynamics critical point (CP). The event-by-event analysis of high moments of the conserved charges has been widely used in experiments to search for the CP, particularly in the RHIC-STAR experiment. To establish a dynamical non-critical baseline, particularly in the high baryon density region, we performed a systematic analysis of the proton multiplicity distributions from Au+Au collisions at $ 3 \leq \sqrt{s_{NN}} \leq 9.2 $ GeV. The beam energy, centrality, and rapidity width dependence of proton (factorial) cumulants, up to the $ 4^{\rm th} $ order, were extracted from the calculations of a hadronic transport model called the ultra-relativistic quantum molecular dynamics (UrQMD) model. In addition, the effects of the initial volume fluctuation are discussed. These results will be important for the physics analysis of the RHIC Beam Energy Scan (BES) data, particularly for the fixed-target data and experimental data from future CBM experiments at FAIR.


 DownLoad: